What is Data Analysis. Kerala School of MathematicsCourse in Statistics for Scientis. Introduction to Data Analysis. Steps in a Statistical Study
|
|
|
- Lewis Harrington
- 10 years ago
- Views:
Transcription
1 Kerala School of Mathematics Course in Statistics for Scientists Introduction to Data Analysis T.Krishnan Strand Life Sciences, Bangalore What is Data Analysis Statistics is a body of methods how to use numbers to elucidate rather than to mislead Statisticians work in many areas probability, exploratory data analysis, modelling, social policy, decision making, and others two fundamental tasks: description and inference Description involves characterizing a batch of data in simple but informative ways, including graphically Inference involves generalizing from a sample of data to a larger population of possible data Descriptive statistics help us to observe more acutely Inferential statistics help us to formulate and test hypotheses ts Steps in a Statistical Study Exploration of Data plan the study understand background and collect questions and issues collect data check the data for errors explore the data review the initial questions generate hypotheses and build statistical models analyze residuals and review hypotheses and models interpret and make recommendations clean and sanitize the data check validity of the values check for missing values and deal with them check for outliers and deal with them understand the data make tables, charts, graphs check if there are groups in the data make transforms if needed check for standard assumptions ts

2 Descriptive Measures Graphical Representation of Data what measures to use depends on data and purpose mean, median, mode, variance, standard deviation, range, inter-quartile range, etc. depends on nature of distribution symmetric, skewed, outliers, tails (light or heavy), etc. shall discuss in the Descriptive Statistics presentation what graphs to use depend on nature of data and purpose careful not to mislead graphs before, during, and after data analysis Graphs before: visual representation of data and summaries: e.g. bar chart Graphs during: check assumptions and model fit : normal prob plot Graphs after: check assumptions; e.g., normal probability plot of residuals present results: parameter estimates, say in log-linear models ts Reasonable Graph Overemphasized Graph ts

3 Inferential Statistics want to do more than describe the sample generalize, formulate a policy, or test a hypothesis, to make an inference, to classify, to predict inference implies that we think a model describes a more general population from which our data have been randomly sampled when you make inferences, you should have a population in mind finite and infinite populations Population, Sample, Statistical Inference to use inferential methods to estimate the mean age of India s population on 1 April 2001 could enter all N ages into a SYSTAT file and compute the mean age exactly If practical, this is the preferred method census method sometimes, a sampling estimate can be more accurate than an entire census biases are introduced into large censuses from refusals to comply, keying or coding errors, and other sources a carefully constructed random sample can yield less-biased information about the population it is the analyst s responsibility to ensure that the sample is representative of the larger group (population) on all attributes that might affect the results more on this in Survey Sampling ts Computing Aids and Statistical Analysis Types of Statistical Software Data Analysis with hand computation mechanical calculator electronic calculator with functions electronic computer electronic computer with subroutine packages menu-driven software packages ts Level 1: Excel, MatLab, StatGraphics, Statview limited statistical features; menu-driven; easy to learn and use Level 2: JMP, SPSS, MINITAB, SYSTAT, STATISTICA statistical software packages; more comprehensive features; menu-driven with command-line windows; moderate cost Level 3: SAS, S-PLUS statistical software packages; for expert users; command-line driven; very comprehensive; sophisticated features; very expensive Level 4: R freeware; command-driven; a somewhat steep learning curve Level 5: BUGS, MRBAYES statistical software packages for specialized uses base module + optional add-on modules or toolboxes Many softwares have simpler less expensive or free

4 Using a Software When using a software for data analysis: Don t be blind to the data set Formulate the issues to be resolved Examine assumptions Analyse by alternative methods Investigate methods suitable Examine the software Use computer-intensive methods Exploratory Data Analysis ts Data Files Data Cleaning be aware that almost every data set is likely to be polluted errors, incompleteness, and other inadequacies especially those data sets obtained or imported from different sources some of the common sources of errors: typing errors or data entry errors coding errors measurement errors missing values detection of errors correction of errors missing value imputation detection of outliers (elimination?) finding groups (lack of homegeneity) need for transformations ts

5 Data Cleaning Tools Descriptive Statistics cross tabulation bar charts descriptive statistics graphical displays box plots (outliers) density plots (mixture of groups) ts Crosstabulation Outliers ts
 ts Crosstabulation")
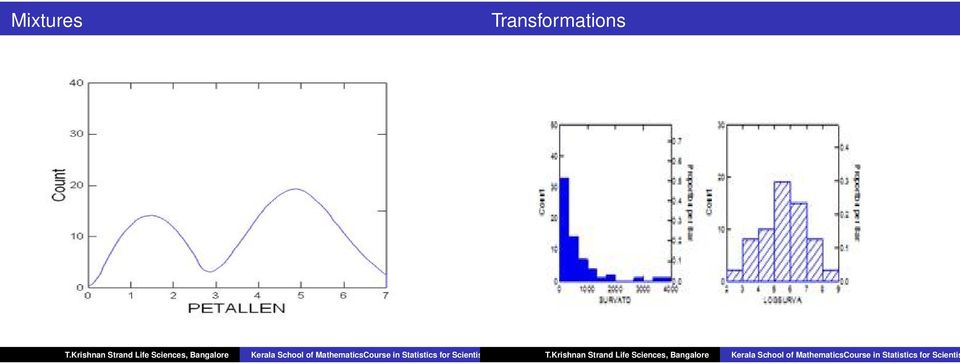
6 Mixtures Transformations ts
Lecture 2: Descriptive Statistics and Exploratory Data Analysis
 Lecture 2: Descriptive Statistics and Exploratory Data Analysis Further Thoughts on Experimental Design 16 Individuals (8 each from two populations) with replicates Pop 1 Pop 2 Randomly sample 4 individuals
STAT355 - Probability & Statistics
 STAT355 - Probability & Statistics Instructor: Kofi Placid Adragni Fall 2011 Chap 1 - Overview and Descriptive Statistics 1.1 Populations, Samples, and Processes 1.2 Pictorial and Tabular Methods in Descriptive
Why Taking This Course? Course Introduction, Descriptive Statistics and Data Visualization. Learning Goals. GENOME 560, Spring 2012
 Why Taking This Course? Course Introduction, Descriptive Statistics and Data Visualization GENOME 560, Spring 2012 Data are interesting because they help us understand the world Genomics: Massive Amounts
Fairfield Public Schools
 Mathematics Fairfield Public Schools AP Statistics AP Statistics BOE Approved 04/08/2014 1 AP STATISTICS Critical Areas of Focus AP Statistics is a rigorous course that offers advanced students an opportunity
BNG 202 Biomechanics Lab. Descriptive statistics and probability distributions I
 BNG 202 Biomechanics Lab Descriptive statistics and probability distributions I Overview The overall goal of this short course in statistics is to provide an introduction to descriptive and inferential
Institute of Actuaries of India Subject CT3 Probability and Mathematical Statistics
 Institute of Actuaries of India Subject CT3 Probability and Mathematical Statistics For 2015 Examinations Aim The aim of the Probability and Mathematical Statistics subject is to provide a grounding in
Foundation of Quantitative Data Analysis
 Foundation of Quantitative Data Analysis Part 1: Data manipulation and descriptive statistics with SPSS/Excel HSRS #10 - October 17, 2013 Reference : A. Aczel, Complete Business Statistics. Chapters 1
1.3 Measuring Center & Spread, The Five Number Summary & Boxplots. Describing Quantitative Data with Numbers
 1.3 Measuring Center & Spread, The Five Number Summary & Boxplots Describing Quantitative Data with Numbers 1.3 I can n Calculate and interpret measures of center (mean, median) in context. n Calculate
Statistics I for QBIC. Contents and Objectives. Chapters 1 7. Revised: August 2013
 Statistics I for QBIC Text Book: Biostatistics, 10 th edition, by Daniel & Cross Contents and Objectives Chapters 1 7 Revised: August 2013 Chapter 1: Nature of Statistics (sections 1.1-1.6) Objectives
4.1 Exploratory Analysis: Once the data is collected and entered, the first question is: "What do the data look like?"
 Data Analysis Plan The appropriate methods of data analysis are determined by your data types and variables of interest, the actual distribution of the variables, and the number of cases. Different analyses
How To Check For Differences In The One Way Anova
 MINITAB ASSISTANT WHITE PAPER This paper explains the research conducted by Minitab statisticians to develop the methods and data checks used in the Assistant in Minitab 17 Statistical Software. One-Way
How To Write A Data Analysis
 Mathematics Probability and Statistics Curriculum Guide Revised 2010 This page is intentionally left blank. Introduction The Mathematics Curriculum Guide serves as a guide for teachers when planning instruction
DESCRIPTIVE STATISTICS AND EXPLORATORY DATA ANALYSIS
 DESCRIPTIVE STATISTICS AND EXPLORATORY DATA ANALYSIS SEEMA JAGGI Indian Agricultural Statistics Research Institute Library Avenue, New Delhi - 110 012 [email protected] 1. Descriptive Statistics Statistics
MTH 140 Statistics Videos
 MTH 140 Statistics Videos Chapter 1 Picturing Distributions with Graphs Individuals and Variables Categorical Variables: Pie Charts and Bar Graphs Categorical Variables: Pie Charts and Bar Graphs Quantitative
What is the purpose of this document? What is in the document? How do I send Feedback?
 This document is designed to help North Carolina educators teach the Common Core (Standard Course of Study). NCDPI staff are continually updating and improving these tools to better serve teachers. Statistics
A Correlation of. to the. South Carolina Data Analysis and Probability Standards
 A Correlation of to the South Carolina Data Analysis and Probability Standards INTRODUCTION This document demonstrates how Stats in Your World 2012 meets the indicators of the South Carolina Academic Standards
430 Statistics and Financial Mathematics for Business
 Prescription: 430 Statistics and Financial Mathematics for Business Elective prescription Level 4 Credit 20 Version 2 Aim Students will be able to summarise, analyse, interpret and present data, make predictions
Week 1. Exploratory Data Analysis
 Week 1 Exploratory Data Analysis Practicalities This course ST903 has students from both the MSc in Financial Mathematics and the MSc in Statistics. Two lectures and one seminar/tutorial per week. Exam
Exploratory data analysis (Chapter 2) Fall 2011
 Fall 2011") Exploratory data analysis (Chapter 2) Fall 2011 Data Examples Example 1: Survey Data 1 Data collected from a Stat 371 class in Fall 2005 2 They answered questions about their: gender, major, year in school,
Exploratory data analysis (Chapter 2) Fall 2011 Data Examples Example 1: Survey Data 1 Data collected from a Stat 371 class in Fall 2005 2 They answered questions about their: gender, major, year in school,
Chapter 7 Section 7.1: Inference for the Mean of a Population
 Chapter 7 Section 7.1: Inference for the Mean of a Population Now let s look at a similar situation Take an SRS of size n Normal Population : N(, ). Both and are unknown parameters. Unlike what we used
MBA 611 STATISTICS AND QUANTITATIVE METHODS
 MBA 611 STATISTICS AND QUANTITATIVE METHODS Part I. Review of Basic Statistics (Chapters 1-11) A. Introduction (Chapter 1) Uncertainty: Decisions are often based on incomplete information from uncertain
BASIC STATISTICAL METHODS FOR GENOMIC DATA ANALYSIS
 BASIC STATISTICAL METHODS FOR GENOMIC DATA ANALYSIS SEEMA JAGGI Indian Agricultural Statistics Research Institute Library Avenue, New Delhi-110 012 [email protected] Genomics A genome is an organism s
International College of Economics and Finance Syllabus Probability Theory and Introductory Statistics
 International College of Economics and Finance Syllabus Probability Theory and Introductory Statistics Lecturer: Mikhail Zhitlukhin. 1. Course description Probability Theory and Introductory Statistics
Descriptive statistics Statistical inference statistical inference, statistical induction and inferential statistics
 Descriptive statistics is the discipline of quantitatively describing the main features of a collection of data. Descriptive statistics are distinguished from inferential statistics (or inductive statistics),
Exploratory Data Analysis
 Exploratory Data Analysis Johannes Schauer [email protected] Institute of Statistics Graz University of Technology Steyrergasse 17/IV, 8010 Graz www.statistics.tugraz.at February 12, 2008 Introduction
Lecture 1: Review and Exploratory Data Analysis (EDA)
") Lecture 1: Review and Exploratory Data Analysis (EDA) Sandy Eckel [email protected] Department of Biostatistics, The Johns Hopkins University, Baltimore USA 21 April 2008 1 / 40 Course Information I Course
Lecture 1: Review and Exploratory Data Analysis (EDA) Sandy Eckel [email protected] Department of Biostatistics, The Johns Hopkins University, Baltimore USA 21 April 2008 1 / 40 Course Information I Course
Diagrams and Graphs of Statistical Data
 Diagrams and Graphs of Statistical Data One of the most effective and interesting alternative way in which a statistical data may be presented is through diagrams and graphs. There are several ways in
COMMON CORE STATE STANDARDS FOR
 COMMON CORE STATE STANDARDS FOR Mathematics (CCSSM) High School Statistics and Probability Mathematics High School Statistics and Probability Decisions or predictions are often based on data numbers in
Silvermine House Steenberg Office Park, Tokai 7945 Cape Town, South Africa Telephone: +27 21 702 4666 www.spss-sa.com
 SPSS-SA Silvermine House Steenberg Office Park, Tokai 7945 Cape Town, South Africa Telephone: +27 21 702 4666 www.spss-sa.com SPSS-SA Training Brochure 2009 TABLE OF CONTENTS 1 SPSS TRAINING COURSES FOCUSING
3: Summary Statistics
 3: Summary Statistics Notation Let s start by introducing some notation. Consider the following small data set: 4 5 30 50 8 7 4 5 The symbol n represents the sample size (n = 0). The capital letter X denotes
Descriptive Analysis
 Research Methods William G. Zikmund Basic Data Analysis: Descriptive Statistics Descriptive Analysis The transformation of raw data into a form that will make them easy to understand and interpret; rearranging,
South Carolina College- and Career-Ready (SCCCR) Probability and Statistics
 Probability and Statistics") South Carolina College- and Career-Ready (SCCCR) Probability and Statistics South Carolina College- and Career-Ready Mathematical Process Standards The South Carolina College- and Career-Ready (SCCCR)
South Carolina College- and Career-Ready (SCCCR) Probability and Statistics South Carolina College- and Career-Ready Mathematical Process Standards The South Carolina College- and Career-Ready (SCCCR)
Statistics and Probability (Data Analysis)
") Statistics and Probability (Data Analysis) Kindergarten Grade 1 Grade 2 Grade 3 Grade 4 Specific Learning Outcomes Specific Learning Outcomes Specific Learning Outcomes 2.SP.1. Gather and record data about
Statistics and Probability (Data Analysis) Kindergarten Grade 1 Grade 2 Grade 3 Grade 4 Specific Learning Outcomes Specific Learning Outcomes Specific Learning Outcomes 2.SP.1. Gather and record data about
Street Address: 1111 Franklin Street Oakland, CA 94607. Mailing Address: 1111 Franklin Street Oakland, CA 94607
 Contacts University of California Curriculum Integration (UCCI) Institute Sarah Fidelibus, UCCI Program Manager Street Address: 1111 Franklin Street Oakland, CA 94607 1. Program Information Mailing Address:
Descriptive Statistics. Purpose of descriptive statistics Frequency distributions Measures of central tendency Measures of dispersion
 Descriptive Statistics Purpose of descriptive statistics Frequency distributions Measures of central tendency Measures of dispersion Statistics as a Tool for LIS Research Importance of statistics in research
IBM SPSS Statistics 20 Part 1: Descriptive Statistics
 CALIFORNIA STATE UNIVERSITY, LOS ANGELES INFORMATION TECHNOLOGY SERVICES IBM SPSS Statistics 20 Part 1: Descriptive Statistics Summer 2013, Version 2.0 Table of Contents Introduction...2 Downloading the
An Introduction to Statistics using Microsoft Excel. Dan Remenyi George Onofrei Joe English
 An Introduction to Statistics using Microsoft Excel BY Dan Remenyi George Onofrei Joe English Published by Academic Publishing Limited Copyright 2009 Academic Publishing Limited All rights reserved. No
Mathematics within the Psychology Curriculum
 Mathematics within the Psychology Curriculum Statistical Theory and Data Handling Statistical theory and data handling as studied on the GCSE Mathematics syllabus You may have learnt about statistics and
Descriptive Statistics
 Y520 Robert S Michael Goal: Learn to calculate indicators and construct graphs that summarize and describe a large quantity of values. Using the textbook readings and other resources listed on the web
Quantitative Methods for Finance
 Quantitative Methods for Finance Module 1: The Time Value of Money 1 Learning how to interpret interest rates as required rates of return, discount rates, or opportunity costs. 2 Learning how to explain
Data Analysis, Statistics, and Probability
 Chapter 6 Data Analysis, Statistics, and Probability Content Strand Description Questions in this content strand assessed students skills in collecting, organizing, reading, representing, and interpreting
EXPLORING SPATIAL PATTERNS IN YOUR DATA
 EXPLORING SPATIAL PATTERNS IN YOUR DATA OBJECTIVES Learn how to examine your data using the Geostatistical Analysis tools in ArcMap. Learn how to use descriptive statistics in ArcMap and Geoda to analyze
Description. Textbook. Grading. Objective
 EC151.02 Statistics for Business and Economics (MWF 8:00-8:50) Instructor: Chiu Yu Ko Office: 462D, 21 Campenalla Way Phone: 2-6093 Email: [email protected] Office Hours: by appointment Description This course
Exercise 1.12 (Pg. 22-23)
") Individuals: The objects that are described by a set of data. They may be people, animals, things, etc. (Also referred to as Cases or Records) Variables: The characteristics recorded about each individual.
Individuals: The objects that are described by a set of data. They may be people, animals, things, etc. (Also referred to as Cases or Records) Variables: The characteristics recorded about each individual.
3. Data Analysis, Statistics, and Probability
 3. Data Analysis, Statistics, and Probability Data and probability sense provides students with tools to understand information and uncertainty. Students ask questions and gather and use data to answer
Variables. Exploratory Data Analysis
 Exploratory Data Analysis Exploratory Data Analysis involves both graphical displays of data and numerical summaries of data. A common situation is for a data set to be represented as a matrix. There is
Why do statisticians "hate" us?
 Why do statisticians "hate" us? David Hand, Heikki Mannila, Padhraic Smyth "Data mining is the analysis of (often large) observational data sets to find unsuspected relationships and to summarize the data
Analyzing and interpreting data Evaluation resources from Wilder Research
 Wilder Research Analyzing and interpreting data Evaluation resources from Wilder Research Once data are collected, the next step is to analyze the data. A plan for analyzing your data should be developed
STT315 Chapter 4 Random Variables & Probability Distributions KM. Chapter 4.5, 6, 8 Probability Distributions for Continuous Random Variables
 Chapter 4.5, 6, 8 Probability Distributions for Continuous Random Variables Discrete vs. continuous random variables Examples of continuous distributions o Uniform o Exponential o Normal Recall: A random
Characteristics of Binomial Distributions
 Lesson2 Characteristics of Binomial Distributions In the last lesson, you constructed several binomial distributions, observed their shapes, and estimated their means and standard deviations. In Investigation
Service courses for graduate students in degree programs other than the MS or PhD programs in Biostatistics.
 Course Catalog In order to be assured that all prerequisites are met, students must acquire a permission number from the education coordinator prior to enrolling in any Biostatistics course. Courses are
Data Exploration Data Visualization
 Data Exploration Data Visualization What is data exploration? A preliminary exploration of the data to better understand its characteristics. Key motivations of data exploration include Helping to select
AP Statistics: Syllabus 1
 AP Statistics: Syllabus 1 Scoring Components SC1 The course provides instruction in exploring data. 4 SC2 The course provides instruction in sampling. 5 SC3 The course provides instruction in experimentation.
INTRODUCING DATA ANALYSIS IN A STATISTICS COURSE IN ENVIRONMENTAL SCIENCE STUDIES
 INTRODUCING DATA ANALYSIS IN A STATISTICS COURSE IN ENVIRONMENTAL SCIENCE STUDIES C. Capilla Technical University of Valencia, Spain [email protected] Education in methods of applied statistics is important
Karyn Ruiz-Cordell, MA, PhD Shunda Irons-Brown, PhD, MBA, CHCP Tamar Sapir, PhD
 Advanced Methodologies in Outcomes & Insights Research Study Design Measuring Knowledge vs. Impact vs. Performance vs. Quality of Care and Everything In Between Karyn Ruiz-Cordell, MA, PhD Shunda Irons-Brown,
INTRODUCING THE NORMAL DISTRIBUTION IN A DATA ANALYSIS COURSE: SPECIFIC MEANING CONTRIBUTED BY THE USE OF COMPUTERS
 INTRODUCING THE NORMAL DISTRIBUTION IN A DATA ANALYSIS COURSE: SPECIFIC MEANING CONTRIBUTED BY THE USE OF COMPUTERS Liliana Tauber Universidad Nacional del Litoral Argentina Victoria Sánchez Universidad
STATISTICAL DATA ANALYSIS
 STATISTICAL DATA ANALYSIS INTRODUCTION Fethullah Karabiber YTU, Fall of 2012 The role of statistical analysis in science This course discusses some statistical methods, which involve applying statistical
Descriptive Statistics and Exploratory Data Analysis
 Descriptive Statistics and Exploratory Data Analysis Dean s s Faculty and Resident Development Series UT College of Medicine Chattanooga Probasco Auditorium at Erlanger January 14, 2008 Marc Loizeaux,
Module 3: Correlation and Covariance
 Using Statistical Data to Make Decisions Module 3: Correlation and Covariance Tom Ilvento Dr. Mugdim Pašiƒ University of Delaware Sarajevo Graduate School of Business O ften our interest in data analysis
Now we begin our discussion of exploratory data analysis.
 Now we begin our discussion of exploratory data analysis. 1 Remember to keep in mind where we are in the big picture. For now, we will assume that the data we are given is a representative sample from
Chi Square Tests. Chapter 10. 10.1 Introduction
 Contents 10 Chi Square Tests 703 10.1 Introduction............................ 703 10.2 The Chi Square Distribution.................. 704 10.3 Goodness of Fit Test....................... 709 10.4 Chi Square
The right edge of the box is the third quartile, Q 3, which is the median of the data values above the median. Maximum Median
 CONDENSED LESSON 2.1 Box Plots In this lesson you will create and interpret box plots for sets of data use the interquartile range (IQR) to identify potential outliers and graph them on a modified box
NEW MEXICO Grade 6 MATHEMATICS STANDARDS
 PROCESS STANDARDS To help New Mexico students achieve the Content Standards enumerated below, teachers are encouraged to base instruction on the following Process Standards: Problem Solving Build new mathematical
STATS8: Introduction to Biostatistics. Data Exploration. Babak Shahbaba Department of Statistics, UCI
 STATS8: Introduction to Biostatistics Data Exploration Babak Shahbaba Department of Statistics, UCI Introduction After clearly defining the scientific problem, selecting a set of representative members
WebFOCUS RStat. RStat. Predict the Future and Make Effective Decisions Today. WebFOCUS RStat
 Information Builders enables agile information solutions with business intelligence (BI) and integration technologies. WebFOCUS the most widely utilized business intelligence platform connects to any enterprise
Analysis of Variance (ANOVA) Using Minitab
 Using Minitab") Analysis of Variance (ANOVA) Using Minitab By Keith M. Bower, M.S., Technical Training Specialist, Minitab Inc. Frequently, scientists are concerned with detecting differences in means (averages) between
Analysis of Variance (ANOVA) Using Minitab By Keith M. Bower, M.S., Technical Training Specialist, Minitab Inc. Frequently, scientists are concerned with detecting differences in means (averages) between
9. Sampling Distributions
 9. Sampling Distributions Prerequisites none A. Introduction B. Sampling Distribution of the Mean C. Sampling Distribution of Difference Between Means D. Sampling Distribution of Pearson's r E. Sampling
UNDERGRADUATE DEGREE DETAILS : BACHELOR OF SCIENCE WITH
 QATAR UNIVERSITY COLLEGE OF ARTS & SCIENCES Department of Mathematics, Statistics, & Physics UNDERGRADUATE DEGREE DETAILS : Program Requirements and Descriptions BACHELOR OF SCIENCE WITH A MAJOR IN STATISTICS
Simple linear regression
 Simple linear regression Introduction Simple linear regression is a statistical method for obtaining a formula to predict values of one variable from another where there is a causal relationship between
Center: Finding the Median. Median. Spread: Home on the Range. Center: Finding the Median (cont.)
") Center: Finding the Median When we think of a typical value, we usually look for the center of the distribution. For a unimodal, symmetric distribution, it s easy to find the center it s just the center
Center: Finding the Median When we think of a typical value, we usually look for the center of the distribution. For a unimodal, symmetric distribution, it s easy to find the center it s just the center
THE OPEN SOURCE SOFTWARE R IN THE STATISTICAL QUALITY CONTROL
 1. Miriam ANDREJIOVÁ, 2. Zuzana KIMÁKOVÁ THE OPEN SOURCE SOFTWARE R IN THE STATISTICAL QUALITY CONTROL 1,2 TECHNICAL UNIVERSITY IN KOŠICE, FACULTY OF MECHANICAL ENGINEERING, KOŠICE, DEPARTMENT OF APPLIED
Predictor Coef StDev T P Constant 970667056 616256122 1.58 0.154 X 0.00293 0.06163 0.05 0.963. S = 0.5597 R-Sq = 0.0% R-Sq(adj) = 0.
 = 0.") Statistical analysis using Microsoft Excel Microsoft Excel spreadsheets have become somewhat of a standard for data storage, at least for smaller data sets. This, along with the program often being packaged
Statistical analysis using Microsoft Excel Microsoft Excel spreadsheets have become somewhat of a standard for data storage, at least for smaller data sets. This, along with the program often being packaged
Descriptive statistics parameters: Measures of centrality
 Descriptive statistics parameters: Measures of centrality Contents Definitions... 3 Classification of descriptive statistics parameters... 4 More about central tendency estimators... 5 Relationship between
Chapter 7. One-way ANOVA
 Chapter 7 One-way ANOVA One-way ANOVA examines equality of population means for a quantitative outcome and a single categorical explanatory variable with any number of levels. The t-test of Chapter 6 looks
Practice#1(chapter1,2) Name
 Name") Practice#1(chapter1,2) Name Solve the problem. 1) The average age of the students in a statistics class is 22 years. Does this statement describe descriptive or inferential statistics? A) inferential statistics
Practice#1(chapter1,2) Name Solve the problem. 1) The average age of the students in a statistics class is 22 years. Does this statement describe descriptive or inferential statistics? A) inferential statistics
II. DISTRIBUTIONS distribution normal distribution. standard scores
 Appendix D Basic Measurement And Statistics The following information was developed by Steven Rothke, PhD, Department of Psychology, Rehabilitation Institute of Chicago (RIC) and expanded by Mary F. Schmidt,
Business Statistics. Successful completion of Introductory and/or Intermediate Algebra courses is recommended before taking Business Statistics.
 Business Course Text Bowerman, Bruce L., Richard T. O'Connell, J. B. Orris, and Dawn C. Porter. Essentials of Business, 2nd edition, McGraw-Hill/Irwin, 2008, ISBN: 978-0-07-331988-9. Required Computing
Geostatistics Exploratory Analysis
 Instituto Superior de Estatística e Gestão de Informação Universidade Nova de Lisboa Master of Science in Geospatial Technologies Geostatistics Exploratory Analysis Carlos Alberto Felgueiras [email protected]
Dealing with Missing Data
 Res. Lett. Inf. Math. Sci. (2002) 3, 153-160 Available online at http://www.massey.ac.nz/~wwiims/research/letters/ Dealing with Missing Data Judi Scheffer I.I.M.S. Quad A, Massey University, P.O. Box 102904
MEASURES OF LOCATION AND SPREAD
 Paper TU04 An Overview of Non-parametric Tests in SAS : When, Why, and How Paul A. Pappas and Venita DePuy Durham, North Carolina, USA ABSTRACT Most commonly used statistical procedures are based on the
Introduction to time series analysis
 Introduction to time series analysis Margherita Gerolimetto November 3, 2010 1 What is a time series? A time series is a collection of observations ordered following a parameter that for us is time. Examples
WEEK #22: PDFs and CDFs, Measures of Center and Spread
 WEEK #22: PDFs and CDFs, Measures of Center and Spread Goals: Explore the effect of independent events in probability calculations. Present a number of ways to represent probability distributions. Textbook
List of Examples. Examples 319
 Examples 319 List of Examples DiMaggio and Mantle. 6 Weed seeds. 6, 23, 37, 38 Vole reproduction. 7, 24, 37 Wooly bear caterpillar cocoons. 7 Homophone confusion and Alzheimer s disease. 8 Gear tooth strength.
Dongfeng Li. Autumn 2010
 Autumn 2010 Chapter Contents Some statistics background; ; Comparing means and proportions; variance. Students should master the basic concepts, descriptive statistics measures and graphs, basic hypothesis
Curriculum Map Statistics and Probability Honors (348) Saugus High School Saugus Public Schools 2009-2010
 Saugus High School Saugus Public Schools 2009-2010") Curriculum Map Statistics and Probability Honors (348) Saugus High School Saugus Public Schools 2009-2010 Week 1 Week 2 14.0 Students organize and describe distributions of data by using a number of different
Curriculum Map Statistics and Probability Honors (348) Saugus High School Saugus Public Schools 2009-2010 Week 1 Week 2 14.0 Students organize and describe distributions of data by using a number of different
Mean = (sum of the values / the number of the value) if probabilities are equal
 if probabilities are equal") Population Mean Mean = (sum of the values / the number of the value) if probabilities are equal Compute the population mean Population/Sample mean: 1. Collect the data 2. sum all the values in the population/sample.
Population Mean Mean = (sum of the values / the number of the value) if probabilities are equal Compute the population mean Population/Sample mean: 1. Collect the data 2. sum all the values in the population/sample.
business statistics using Excel OXFORD UNIVERSITY PRESS Glyn Davis & Branko Pecar
 business statistics using Excel Glyn Davis & Branko Pecar OXFORD UNIVERSITY PRESS Detailed contents Introduction to Microsoft Excel 2003 Overview Learning Objectives 1.1 Introduction to Microsoft Excel
ROCHESTER INSTITUTE OF TECHNOLOGY COURSE OUTLINE FORM COLLEGE OF SCIENCE. School of Mathematical Sciences
 ! ROCHESTER INSTITUTE OF TECHNOLOGY COURSE OUTLINE FORM COLLEGE OF SCIENCE School of Mathematical Sciences New Revised COURSE: COS-MATH-252 Probability and Statistics II 1.0 Course designations and approvals:
Basics of Statistics
 Basics of Statistics Jarkko Isotalo 30 20 10 Std. Dev = 486.32 Mean = 3553.8 0 N = 120.00 2400.0 2800.0 3200.0 3600.0 4000.0 4400.0 4800.0 2600.0 3000.0 3400.0 3800.0 4200.0 4600.0 5000.0 Birthweights
White Paper Combining Attitudinal Data and Behavioral Data for Meaningful Analysis
 MAASSMEDIA, LLC WEB ANALYTICS SERVICES White Paper Combining Attitudinal Data and Behavioral Data for Meaningful Analysis By Abigail Lefkowitz, MaassMedia Executive Summary: In the fast-growing digital
Probability and Statistics Vocabulary List (Definitions for Middle School Teachers)
") Probability and Statistics Vocabulary List (Definitions for Middle School Teachers) B Bar graph a diagram representing the frequency distribution for nominal or discrete data. It consists of a sequence
Probability and Statistics Vocabulary List (Definitions for Middle School Teachers) B Bar graph a diagram representing the frequency distribution for nominal or discrete data. It consists of a sequence
Introduction to Statistics and Quantitative Research Methods
 Introduction to Statistics and Quantitative Research Methods Purpose of Presentation To aid in the understanding of basic statistics, including terminology, common terms, and common statistical methods.
Exploratory Data Analysis
 Exploratory Data Analysis Paul Cohen ISTA 370 Spring, 2012 Paul Cohen ISTA 370 () Exploratory Data Analysis Spring, 2012 1 / 46 Outline Data, revisited The purpose of exploratory data analysis Learning
MULTIPLE CHOICE. Choose the one alternative that best completes the statement or answers the question.
 Exam Name 1) A recent report stated ʺBased on a sample of 90 truck drivers, there is evidence to indicate that, on average, independent truck drivers earn more than company -hired truck drivers.ʺ Does
How Far is too Far? Statistical Outlier Detection
 How Far is too Far? Statistical Outlier Detection Steven Walfish President, Statistical Outsourcing Services [email protected] 30-325-329 Outline What is an Outlier, and Why are
What Does the Normal Distribution Sound Like?
 What Does the Normal Distribution Sound Like? Ananda Jayawardhana Pittsburg State University [email protected] Published: June 2013 Overview of Lesson In this activity, students conduct an investigation
HISTOGRAMS, CUMULATIVE FREQUENCY AND BOX PLOTS
 Mathematics Revision Guides Histograms, Cumulative Frequency and Box Plots Page 1 of 25 M.K. HOME TUITION Mathematics Revision Guides Level: GCSE Higher Tier HISTOGRAMS, CUMULATIVE FREQUENCY AND BOX PLOTS
Statistics 2014 Scoring Guidelines
 AP Statistics 2014 Scoring Guidelines College Board, Advanced Placement Program, AP, AP Central, and the acorn logo are registered trademarks of the College Board. AP Central is the official online home
Module 4: Data Exploration
 Module 4: Data Exploration Now that you have your data downloaded from the Streams Project database, the detective work can begin! Before computing any advanced statistics, we will first use descriptive