Making MAGIC with Your Data: Interactive Maps, Map Mashups, and Data Visualization Tools
|
|
|
- Poppy Farmer
- 10 years ago
- Views:
Transcription
1 Making MAGIC with Your Data: Interactive Maps, Map Mashups, and Data Visualization Tools Michael Howser Connecticut State Data Center Coordinator & Undergraduate Education & GIS Librarian

2 What is the Connecticut State Data Center? Connecticut s Census Bureau Liaison Part of the National Data Center Network Assists public with accessing Census Data Provides custom data resources for Connecticut Funded by Office of Policy and Management ctsdc.uconn.edu

3 What is MAGIC? University of Connecticut Libraries Map and Geographic Information Center MAGIC Over 220,000 print maps Historical Aerial Photography for Connecticut Provides digitized maps and aerial photography in fullquality TIFF format for download FREE! magic.lib.uconn.edu

4 Data Visualization Multiple Approaches

5 Why Visualize Data? Spreadsheets are great but it s difficult to understand with large datasets Examine Concepts from multiple perspective Spatial Temporal Integrate data from multiple sources Ex. Fault lines, earthquakes, and population data Interac ve expensive or difficult

6 Visualizing Complex Data What do the following items have in common? June 1

7 Does this help?

8 Why Visualize Data as Maps?

9
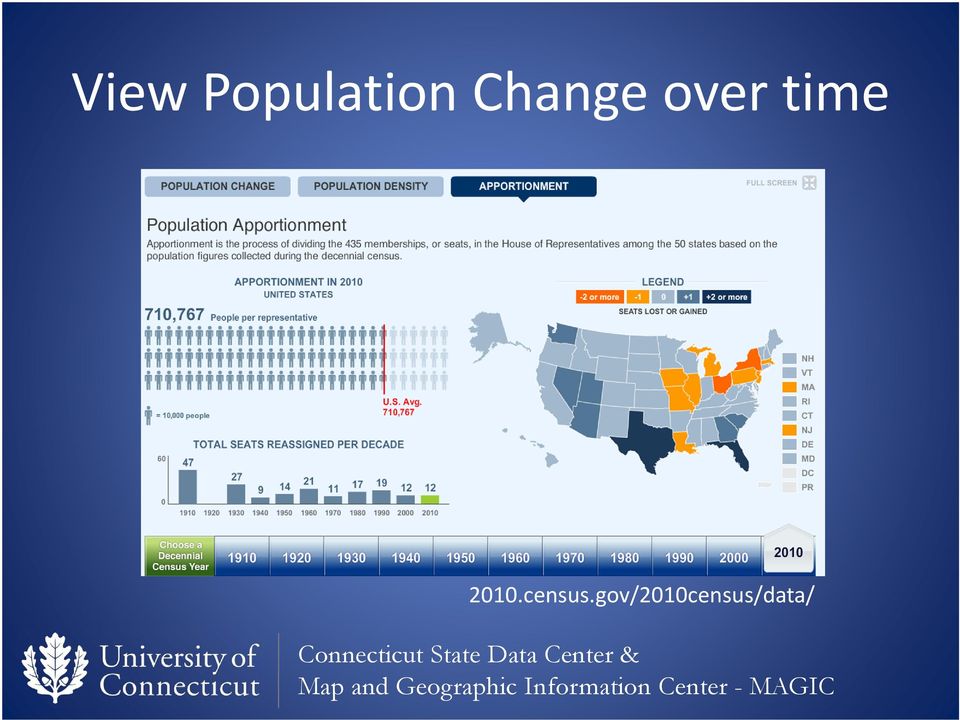
10 View Population Change over time 2010.census.gov/2010census/data/
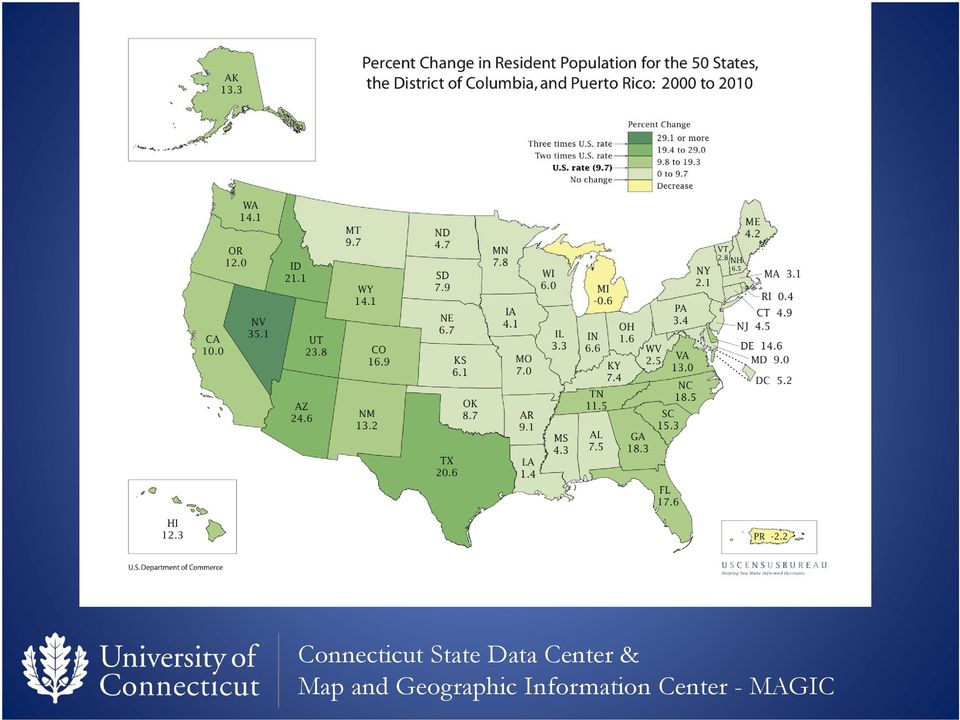
11 Transform this Total Population 281,421, ,745,538 (+9.7%) White 211,460, ,553,265 (+5.7%) Black or African American 34,658,190 38,929,319 (12.3%) American Indian & Alaska Native 2,475,956 2,932,248 (18.4%) Asian 10,242,998 14,674,252 (43.3%) Native Hawaiian and Other Pacific Islander 398, ,013 (35.4%) Some Other Race 15,359,073 19,107,368 (24.4%) Hispanic or Latino 35,305,818 50,477,594 (43%)
 Native Hawaiian and Other Pacific Islander 398,835 540,013 (35.")
12 Exploring National Data New York Times 2010 Census Map projects.nytimes.com/census/2010/map

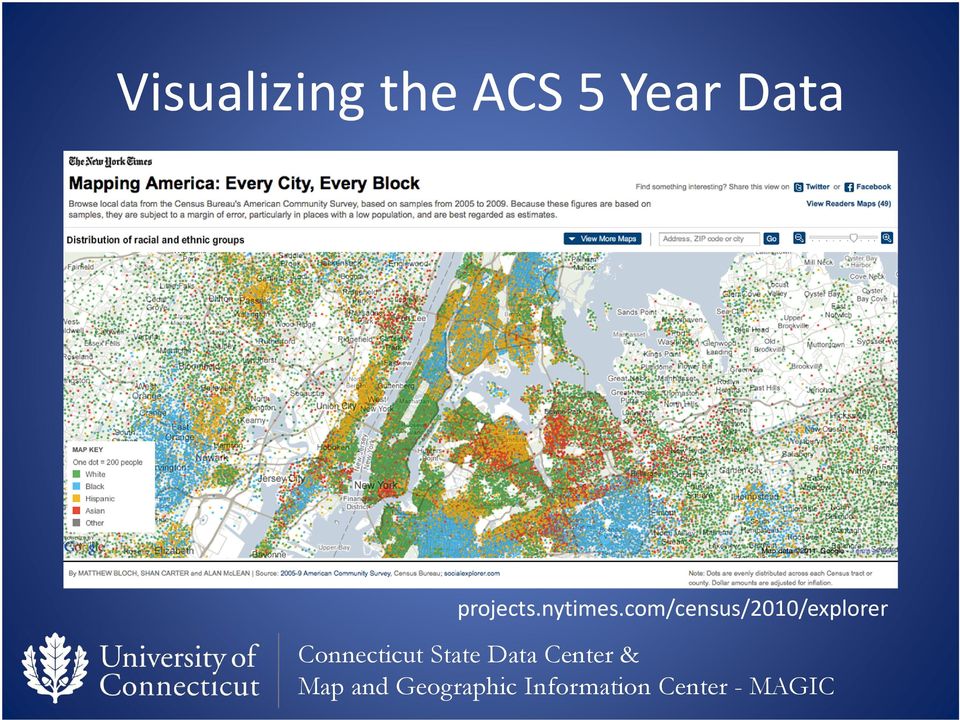
13 Visualizing the ACS 5 Year Data projects.nytimes.com/census/2010/explorer
14 Visualizing Data using Google Maps

15 Making your own maps! MyMaps Placemarks (points) Lines Shape (polygons) embed photos & videos Import KML s Share Collaborate

16 Visualizing Data using Google Earth

17 What is Google Earth? Travel the world Satellite imagery Maps Terrain 3D buildings Create tours Embed pictures and videos Access to diverse geographic data

18 Explore the past

19
20 Visualizing Data using Google Fusion Tables
21 What is Google Fusion Tables? Web based interface for uploading, managing, and visualizing large datasets Builds upon Google Docs and Google Maps Includes API to develop custom interfaces Enables sharing of large datasets
22
23 Google Fusion Example: Poverty by School District
24 Visualizing Data using ArcGIS.com
25 What is ArcGIS.com? Web based map creation interface Enables collaborative map creation Users can contribute data to share via ArcGIS.com Free!
26 Adding Data to ArcGIS.com Data formats supported include: Spreadsheets (.csv,.txt) Shapefiles (.zip) WGS84 projection GPS files (GPX) Data can be imported from the following: ArcGIS Server Web Service OGC Web Service (WMS) KML file (Google Earth)
27 ArcGIS Example from Gallery ArcGIS.com
28 On the Line A collaborative approach to interactive maps using the Google Maps API
29 What is On the Line?
30 Neighborhood Change in CT
31 Racial Change Maps
32 Stay Current Follow Us outsidetheneatline.blogspot.com
33 Thanks! Contact us at: and Special Thanks Connecticut Office of Policy and Management National Endowment for the Humanities On the Line: How schooling, housing, and civil rights shaped Hartford and its suburbs UConn Department of Geography & Center for Population Research UConn Libraries Digital Projects Team, Directors Council, Information Technology Services, Planning Team, and Undergraduate Education Team U.S. Census Bureau Boston Regional Office
Demographic and Labor Market Profile of the city of Detroit - Michigan
 Demographic and Labor Market Profile of the city of Detroit - Michigan Leonidas Murembya, PhD Regional Coordinator [email protected] www.michigan.gov/lmi 517-241-6574 State of Michigan Department
There are various ways to find data using the Hennepin County GIS Open Data site:
 Finding Data There are various ways to find data using the Hennepin County GIS Open Data site: Type in a subject or keyword in the search bar at the top of the page and press the Enter key or click the
Contents. The OWRB Floodplain Viewer. Creating Maps... 8. Helpful Tips... 10
 Contents QUICK START GUIDE... 2-5 Add layers...9 Search for Layers...9 COMPREHENSIVE GUIDE... 6 Navigate the map...6 Locate specific places...6 Add layer from file...9 Add layer from web...9 Display pop-up
Selected Socio-Economic Data. Baker County, Florida
 Selected Socio-Economic Data African American and White, Not Hispanic www.fairvote2020.org www.fairdata2000.com 5-Feb-12 C03002. HISPANIC OR LATINO ORIGIN BY RACE - Universe: TOTAL POPULATION Population
Making a Choropleth map with Google Fusion Tables
 Making a Choropleth map with Google Fusion Tables Choropleth map is a thematic map based on predefined aerial units. Its areas are coloured or shaded to show the measurement of the statistical variables
HEALTH INSURANCE COVERAGE STATUS. 2009-2013 American Community Survey 5-Year Estimates
 S2701 HEALTH INSURANCE COVERAGE STATUS 2009-2013 American Community Survey 5-Year Estimates Supporting documentation on code lists, subject definitions, data accuracy, and statistical testing can be found
Quick Start Guide to. ArcGISSM. Online. for Insurance
 Quick Start Guide to ArcGISSM Online for Insurance Historic tracks from tropical storms and hurricanes are overlaid on a map displaying population growth. Quick Start Guide to ArcGIS Online ArcGIS SM Online
Tutorial 5: Summarizing Tabular Data Florida Case Study
 Tutorial 5: Summarizing Tabular Data Florida Case Study This tutorial will introduce you to the following: Identifying Attribute Data Sources for Health Data Converting Tabular Data into Usable Databases
Conservation Workshop ArcGIS Explorer
 Conservation Workshop ArcGIS Explorer Bern Szukalski [email protected] Topics for this session Introduction Overview of features Using ArcGIS Explorer effectively New features & capabilities Customization
Total Males Females 34.4 36.7 (0.4) 12.7 17.5 (1.6) Didn't believe entitled or eligible 13.0 (0.3) Did not know how to apply for benefits 3.4 (0.
 12.7 17.5 (1.6) Didn't believe entitled or eligible 13.0 (0.3) Did not know how to apply for benefits 3.4 (0.") 2001 National Survey of Veterans (NSV) - March, 2003 - Page 413 Table 7-10. Percent Distribution of Veterans by Reasons Veterans Don't Have VA Life Insurance and Gender Males Females Not Applicable 3,400,423
2001 National Survey of Veterans (NSV) - March, 2003 - Page 413 Table 7-10. Percent Distribution of Veterans by Reasons Veterans Don't Have VA Life Insurance and Gender Males Females Not Applicable 3,400,423
Mapping Mashup/Data Integration Development Resources Teaching with Google Earth and Google Ocean Stone Lab August 13, 2010
 Mapping Mashup/Data Integration Development Resources Teaching with Google Earth and Google Ocean Stone Lab August 13, 2010 David Hart GIS Specialist University of Wisconsin Sea Grant Institute Virtual
MINORITIES IN GOVERNMENT FINANCE SCHOLARSHIP Funded by Tyler Technologies
 Government Finance Officers Association MINORITIES IN GOVERNMENT FINANCE SCHOLARSHIP Funded by Tyler Technologies AWARD: The Minorities in Government Finance Scholarship is available for award to an upper-division
Demographic Profile of Wichita Unemployment Insurance Beneficiaries Q3 2015
 Demographic Profile of Wichita Unemployment Insurance Beneficiaries Q3 2015 The Bureau of Labor Statistics defines an unemployed person as one 16 years and older having no employment and having made specific
Free Google Tools for Creating Interactive Mapping Mashups
 Free Google Tools for Creating Interactive Mapping Mashups Cary Chadwick Emily Wilson Tuesday, May 10, 2011 2pm Welcome to the CLEAR Webinar Series! This is the fourth in the 2011 series Riparian Corridors,
OFFICE SPACE FOR LEASE
 OFFICE SPACE FOR LEASE www.kowitrealestate.com OFFICE SPACE FOR LEASE 1111 Superior Avenue Cleveland, Ohio Property Highlights Property Photos: Appriximately 1,500 to 180,000 SF of availalbe Class A office
Georeferencing and Google Earth. Cyberinfrastructure: Specimen Databases: Day 5 Brigette Zacharczenko
 Georeferencing and Google Earth Cyberinfrastructure: Specimen Databases: Day 5 Brigette Zacharczenko 1 Georeferencing standards Georeferencing of legacy data Georeferencing exercise Mapping data Using
ArcGIS online Introduction... 2. Module 1: How to create a basic map on ArcGIS online... 3. Creating a public account with ArcGIS online...
 Table of Contents ArcGIS online Introduction... 2 Module 1: How to create a basic map on ArcGIS online... 3 Creating a public account with ArcGIS online... 3 Opening a Map, Adding a Basemap and then Saving
Quick Start Guide to. ArcGISSM. Online
 Quick Start Guide to ArcGISSM Online ArcGIS Online Quick Start Guide ArcGIS SM Online is a cloud-based mapping platform for organizations. Users get access to dynamic, authoritative content to create,
Lecture 8. Online GIS
 Lecture 8 Online GIS Lecture 8: Outline I. Online GIS 1. Google Earth 2. MSN Live Maps II. Open Source GIS III. ArcGIS Server and the ESRI suite of online software utility options IV. Advanced Data Mining
Demographic Profile of Wichita Unemployment Insurance Beneficiaries Q2 2014
 Demographic Profile of Wichita Unemployment Insurance Beneficiaries Q2 2014 The Bureau of Labor Statistics defines an unemployed person as one 16 years and older having no employment and having made specific
Storytelling with Maps: Workflows and Best Practices
 Storytelling with Maps: Workflows and Best Practices Introduction What is a story map? Story maps are interactive maps combined with text and other content to tell a story about the world. Typically story
Family and Provider/Teacher Relationship Quality
 R Family and Provider/Teacher Relationship Quality Provider/Teacher Measure: Short Form Provider/Teacher Measure: Short Form This measure asks about you and your early education and child care program.
South Dakota DOE 2013-2014 Report Card
 School Classification: Focus Title I Designation: Schoolwide Performance Indicators * No bar will display at the school or district level if the subgroup does not meet minimum size for reporting purposes.
Estimated Population Responding on Item 25,196,036 2,288,572 3,030,297 5,415,134 4,945,979 5,256,419 4,116,133 Medicare 39.3 (0.2)
") Table 3-15. Percent Distribution of Veterans by Type of Health Insurance and Age 35 Years 35-44 Years 2001 National Survey of Veterans (NSV) - March, 2003 - Page 140 45-54 Years 55-64 Years 65-74 Years
Table 3-15. Percent Distribution of Veterans by Type of Health Insurance and Age 35 Years 35-44 Years 2001 National Survey of Veterans (NSV) - March, 2003 - Page 140 45-54 Years 55-64 Years 65-74 Years
Demography. Focus on the three contributors to population change: Fertility, mortality, and migration
 1 Formal Demography Demography Focus on the three contributors to population change: Fertility, mortality, and migration Social Demography Focus on relationship between social, economic, and demographic
Google Earth Digitale Wege in eine bekannte Welt Sep. 2006
 Google Earth Digitale Wege in eine bekannte Welt Sep. 2006 Joachim Glaubrecht Google Enterprise [email protected] What is Google Enterprise? 2 1 Focus.de: "Der Papst-Besuch in Google Earth" 3 How to Geo
National Center for Education Statistics
 National Center for Education Statistics IPEDS Data Center Northeast Technical Institute UnitID 461962 OPEID 04185100 Address 51 US RT 1, Suite K, Scarborough, ME, 04074-0000 Web Address www.ntinow.edu
Mobile Solutions in ArcGIS. Justin Fan
 Mobile Solutions in ArcGIS Justin Fan Agenda Introducing Mobile GIS Esri Mobile GIS solutions Selecting the right Mobile GIS solution Resources Q&A Introducing Mobile GIS What is Mobile GIS? Extends the
Quick and Easy Web Maps with Google Fusion Tables. SCO Technical Paper
 Quick and Easy Web Maps with Google Fusion Tables SCO Technical Paper Version History Version Date Notes Author/Contact 1.0 July, 2011 Initial document created. Howard Veregin 1.1 Dec., 2011 Updated to
Network Analysis with ArcGIS Online
 Federal GIS Conference February 9 10, 2015 Washington, DC Network Analysis with ArcGIS Online Matt Kennedy Topics Online versus on-premise network analysis services How to access online services How to
Chapter 6: Data Acquisition Methods, Procedures, and Issues
 Chapter 6: Data Acquisition Methods, Procedures, and Issues In this Exercise: Data Acquisition Downloading Geographic Data Accessing Data Via Web Map Service Using Data from a Text File or Spreadsheet
Small Business Administration Loan Application
 BUSINESS INFORMATION Small Business Administration Loan Application Business Name Structure (Corporation, Partnership, Sole P., LLC) Address Type of Business City, State, Zip No. of Employees: Before After
Quick Start Guide to. ArcGISSM. Online. for Public Accounts
 Quick Start Guide to ArcGISSM Online for Public Accounts Using ArcGIS Online with a Public Account ArcGIS SM Online is a cloud-based mapping platform that allows you to easily and quickly make maps, collaborate,
Clever SFTP Instructions
 Clever SFTP Instructions November 10, 2015 Contents 1 Introduction 2 2 General SFTP Setup 2 3 Preparing CSV Files 3 3.1 Preparing schools.csv............................... 4 3.2 Preparing students.csv...............................
Contents. General Overview... 1-2 Common Work Flow... 3 Full Feature List... 4 Additional Information... 5. Website... GIS.Garafa.
 Contents Contents General Overview... 1-2 Common Work Flow... 3 Full Feature List... 4 Additional Information... 5 Website... GIS.Garafa.com 1 Ease of Use Traditional mobile software for data collection
Health Insurance by Race/Ethnicity: 2008
 2008 WASHINGTON STATE POPULATION SURVEY Research Brief No. 52 December 2008 U WASHINGTON STATE OFFICE OF FINANCIAL MANAGEMENT Health Insurance by Race/Ethnicity: 2008 Contributor: Erica Gardner sing data
FSSE-G 2015 Respondent Profile Missouri State University
 FSSE-G 2015 Respondent Profile IPEDS: 179566 About This Report The display below highlights details in the FSSE-G Respondent Profile report that are important to keep in mind when interpreting your results.
Activity: Using ArcGIS Explorer
 Activity: Using ArcGIS Explorer Requirements You must have ArcGIS Explorer for this activity. Preparation: Download ArcGIS Explorer. The link below will bring you to the ESRI ArcGIS Explorer download page.
CCF Guide to the ACS Health Insurance Coverage Data
 CCF Guide to the ACS Health Insurance Coverage Data 2013 ACS Timeline o Thursday, September 19: The Census Bureau will release the 2012 one-year estimates o Week of November 4: Advocates that would like
USER GUIDE AND DIRECTIVES ON DATA COLLECTION AND REPORTING FOR DHCD STATE RENTAL ASSISTANCE
 USER GUIDE AND DIRECTIVES ON DATA COLLECTION AND REPORTING FOR DHCD STATE RENTAL ASSISTANCE Page 1 of 8 I. Purpose In response to Chapter 334 of the Acts of 2006 ( the Act ), the Department of Housing
Oklahoma s Open Source Spatial Data Clearinghouse: OKMaps
 Oklahoma s Open Source Spatial Data Clearinghouse: OKMaps Presented by: Mike Sharp State Geographic Information Coordinator Oklahoma Office of Geographic Information MAGIC 2014 Symposium April 28-May1,
CONGRESSIONAL DISTRICT REPORT For the 113th Congress. California District 47. Representative Alan Lowenthal (D)
") CONGRESSIONAL DISTRICT REPORT For the 113th Congress District 47 Representative Alan Lowenthal (D) National Association of REALTORS 500 New Jersey Avenue, NW Washington, D.C. Congressional Districts 113th
CONGRESSIONAL DISTRICT REPORT For the 113th Congress District 47 Representative Alan Lowenthal (D) National Association of REALTORS 500 New Jersey Avenue, NW Washington, D.C. Congressional Districts 113th
Report Reference Guide
 Esri Business Analyst OnlineSM Report Reference Guide Table of Contents Introduction About Business Analyst Online... 1 Current-Year/Five-Year Forecast Demographic Updates... 2 How to Order Get Started
Geospatial exploitation Products. GXP WebView. Powered by the GXP Platform
 Geospatial exploitation Products GXP WebView Powered by the GXP Platform Exploitation Capabilities GXP WebView Powered by the GXP Platform Detailed annotation (text, points, lines, and polygons) Distance,
National Center for Education Statistics
 National Center for Education Statistics IPEDS Data Center Rensselaer Polytechnic Institute UnitID 194824 OPEID 00280300 Address 110 8th St, Troy, NY, 12180-3590 Web Address www.rpi.edu Institution Characteristics
An Introduction to the Paso Robles Wine Country Alliance Interactive Web Map
 An Introduction to the Paso Robles Wine Country Alliance Interactive Web Map Kelly Bobbitt Mike Bobbitt & Associates Sonoma www.mikebobbitt.com Atascadero Introductions Vineyard Mapping and Project Overview
Texas WIC Nutrition Education Survey Local Agency 067 Report June 2014
 Texas WIC Nutrition Education Survey Local Agency 067 Report June 2014 Note: Due to missing data, rounding, or the ability to mark more than one response (if noted in the question), some percentages may
WHITTIER COLLEGE. Application for Admission Teacher Credential Program. Department of Education & Child Development
 WHITTIER COLLEGE Department of Education & Child Development Application for Admission Teacher Credential Program 13406 E. Philadelphia Street P.O. Box 634 Whittier, CA 90608 562-907- 4248 Fax: 562-464-
The Employment Status of Instructional Staff Members in Higher Education, Fall 2011
 The Employment Status of Instructional Staff Members in Higher Education, Fall 2011 April 2014 John W. Curtis Director of Research and Public Policy American Association of University Professors, Washington
Using Google Earth for Environmental Science Research
 Using Google Earth for Environmental Science Research This document is up-to-date as of August 2013. If you have any questions or additions to this material please email [email protected]. Note: this
A Geospatial Approach for Environmental Justice Reviews. Rachel Turney-Work
 A Geospatial Approach for Environmental Justice Reviews Rachel Turney-Work Overview Environmental Justice (EJ) Regulatory Drivers Minority and Low-Income Populations Impact Pathways Benefits of Using ArcGIS
Leveraging Cloud-Based Mapping Solutions
 Leveraging Cloud-Based Mapping Solutions GeoAlberta October 28, 2014 Laura Kerssens Safe Software Agenda To the Cloud Using Basic Services Cloud Applications Web Services Cloud-Hosted Databases Real-time
Geospatially Enabling the World: The Convergence of Geospatial and Architectural and Engineering Design
 Geospatially Enabling the World: The Convergence of Geospatial and Architectural and Engineering Design Geoff Zeiss Director of Technology Autodesk Map Middle East Dubai 2007 1 Overview Geospatial inflection
Mapping Mashup/Data Integration Development Resources
 Mapping Mashup/Data Integration Development Resources David Hart GIS Specialist University of Wisconsin Sea Grant Institute October 6, 2008 Virtual Globes A virtual globe is a 3D software model or representation
MD imap 2.0 THE NEXT GENERATION OF MARYLAND S ENTERPRISE GIS. Esri MUG Conference Baltimore, MD December 3, 2014 http://imap.maryland.
 THE NEXT GENERATION OF MARYLAND S ENTERPRISE GIS MD imap 2.0 Matt Sokol, GISP Senior GIS Analyst Maryland Department of Information Technology Geographic Information Office Julia Fischer, GISP Senior GIS
Children's Bureau Child and Family Services Reviews Consultant Profile Form
 Children's Bureau Child and Family Services Reviews Consultant Profile Form Revised April 2008 (Please Type or Print Legibly) Identifying Information First Name Middle Name/Initial Last Name Home Address
Data Visualization. Susan Stoddard, PhD InfoUse, VRRTC. InfoUse
 Data Visualization Susan Stoddard, PhD InfoUse, VRRTC InfoUse A picture is worth a thousand words But more than that: Using data visualization tools, we can see patterns and relationships we might miss
Using the American Community Survey Data
 Using the American Community Survey Data The ACS website is accessible from www.census.gov/acs. In the middle of the screen choose In-depth Data Go directly to the ACS Datasets Tab The ACS Datasets Tab
Numbers of Doctorates Awarded in the United States Declined in 2010
 Numbers of Doctorates Awarded in the United States Declined in 2010 by Mark K. Fiegener 1 November 2011 NSF 12-303 U.S. academic institutions awarded 48,069 research doctorates in 2010, down from 49,554
Each company reporting as part of a group, completed Addendum A and is included with the Group Report. Group Name:
 214 GOVERNING BOARD DIVERSITY SURVEY 1. Company Name: Western Surety Company 2. Company NAIC Number: 13188 i. Women ii. Men 5 ii. African American? iii. Asian Pacific Islander? vii. Other? iv. Hispanic
Occupation Overview. EMSI Q2 2015 Data Set. Medical Coding Specialist October 2015. Western Technical College
 Occupation Overview EMSI Q2 2015 Data Set Medical Coding Specialist October 2015 Western Technical College 400 Seventh Street La Crosse, Wisconsin 54601 608.785.9200 EMSI Q2 2015 Data Set www.economicmodeling.com
Portal for ArcGIS. Satish Sankaran Robert Kircher
 Portal for ArcGIS Satish Sankaran Robert Kircher ArcGIS A Complete GIS Data Management Planning & Analysis Field Mobility Operational Awareness Constituent Engagement End to End Integration Collect, Organize,
Vision. South Pacific GIS/RS Conference 2015 11/17/2015. Applying Geography Everywhere. Applying Geography Everywhere
 South Pacific GIS/RS Conference 2015 Applying Geography Everywhere Jithen (J) Singh Eagle Technology Group Ltd (Esri New Zealand) Suva, Fiji Vision Applying Geography Everywhere 1 GIS Is Evolving A Whole
Demographic Analysis of the Salt River Pima-Maricopa Indian Community Using 2010 Census and 2010 American Community Survey Estimates
 Demographic Analysis of the Salt River Pima-Maricopa Indian Community Using 2010 Census and 2010 American Community Survey Estimates Completed for: Grants & Contract Office The Salt River Pima-Maricopa
Creating Web and Mobile Maps Using ArcGIS Online. SCO Technical Paper
 Creating Web and Mobile Maps Using ArcGIS Online SCO Technical Paper Version History Version Date Notes Author/Contact 1.0 February, 2012 Initial document created. John J Czaplewski Copyright 2012 The
GIS. Digital Humanities Boot Camp Series
 GIS Digital Humanities Boot Camp Series GIS Fundamentals GIS Fundamentals Definition of GIS A geographic information system (GIS) is used to describe and characterize spatial data for the purpose of visualizing
Summary of Employment, Demographics, and Commuting Patterns for Marion County, Florida
 FLORIDA DEPARTMENT OF ECONOMIC OPPORTUNITY, BUREAU OF LABOR MARKET STATISTICS Summary of Employment, Demographics, and Commuting Patterns for Marion County, Florida March 2015 Contents Labor Shed Analysis...
HELCOM Data and Map Service. User Manual
 HELCOM Data and Map Service User Manual Version 2.2 - February 2015 1 Table of contents 1. General Information... 3 1.1 Background... 3 1.2 Technical requirements... 3 1.3 Contact... 3 2. Accessing HELCOM
12-month Enrollment 2014-15
 Overview screen 12-month Enrollment 2014-15 12-month Enrollment Overview The 12-Month Enrollment component collects unduplicated student enrollment counts and instructional activity data for an entire
Mississippi Private Schools 2015
 Mississippi Private Schools 2015 Shapefile Tags education, schools, private, K-12 Summary To add to state data clearinghouse the Mississippi private schools point features. Description Point locations
BROCK UNIVERSITY MAP LIBRARY MY GOOGLE EARTH. 1. Link to the Air Photo Index page -> link to the 1934 air photos. A map of Niagara will appear.
 BROCK UNIVERSITY MAP LIBRARY MY GOOGLE EARTH Step 1: Downloading an Air Photo From the Map Library website www.brocku.ca/maplibrary 1. Link to the Air Photo Index page -> link to the 1934 air photos. A
How to Download Census Data from American Factfinder and Display it in ArcMap
 How to Download Census Data from American Factfinder and Display it in ArcMap Factfinder provides census and ACS (American Community Survey) data that can be downloaded in a tabular format and joined with