The Other CO 2 -Problem. Eight Experiments for Students and Teachers
|
|
|
- Claire Young
- 10 years ago
- Views:
Transcription


1 The Other CO 2 -Problem Eight Experiments for Students and Teachers


2 introduction
3 Ocean Acidification - The Other CO 2 Problem The oceans cover more than two-thirds of the planet earth. This vast body of water absorbs about onethird of human-generated carbon dioxide (CO 2 ), thus, a smaller amount of this greenhouse gas remains in the atmosphere and global warming is slowed. However, in the ocean the carbon dioxide reacts to form carbonic acid. The water turns more acidic and becomes a threat to big and small marine organisms. This brochure explains to students the chemical and physical processes that underlie ocean acidification through different experiments, and is intended to encourage pupils to give more thought to their own use of resources. Since the Industrial Revolution of the mid-19th century, the human population has released around 440 billion tons of carbon dioxide (CO 2 ) into the atmosphere from the burning of fossil fuels such as coal, natural gas and crude oil equivalent to 440 million return flights from Germany to Australia! Plants process this invisible and odourless gas into oxygen through photosynthesis. The oceans also act as CO 2 sinks by binding carbon dioxide. If these natural stores on our planet did not exist, it would heat up much more and much faster than what we observe today. Carbon dioxide is a dangerous greenhouse gas: Once it gets into the atmosphere, it reflects heat radiated from the earth and the climate starts to heat up. The oceans slow down this global warming, however, the CO 2 from the atmosphere reacts with seawater to form carbonic acid. As a result, the ph of the water decreases it becomes more acidic. Experiments and numerical model calculations clearly indicate that increasing carbon dioxide concentrations and the resulting ocean acidification have consequences for marine life: Corals, sea urchins, mussels and snails, as well as smaller organisms that build their skeletons and shells from calcium carbonate, will not be able to develop as they did before. In the Antarctic Ocean, researchers have already discovered plankton, whose shells are 35 per cent lighter than comparable specimens recovered from sediment cores dating back to times prior to industrialisation. These microscopic organisms will be the first ones affected by ocean acidification. Plankton sits at the base of the food chain and serves as food for fish and other larger animals. In addition, their metabolism influences important chemical processes in the ocean. Ocean acidification disturbs the balance in these systems. It is still unclear what this means for our climate and our environment, therefore, scientists are working hard to better understand the process of ocean acidification and to better estimate its consequences. The experiments in this booklet will help young people to understand the basics of ocean acidification. In the first half, all eight experiments are explained in great detail. Teachers will find information on the preparation and running of the experiments as well as answers to any questions. Starting on page 52, all of the experiments are prepared as worksheets for students. In the first two experiments, students explore how carbon dioxide passes from the air into the water and from water into the air, and examine the influence of temperature on these processes. An indicator solution shows how the ph varies according to CO 2 content. Then they learn that acidification takes place primarily at the boundary layer between the atmosphere and the ocean, and that the more acidic surface water can reach the deeper layers through convection processes. 3


4 introduction So what is the primary direction in which the carbon dioxide moves? Molecules always move to where a lesser partial pressure prevails i.e. where the concentration is lower. Experiment 3 illustrates that even if the ocean does release CO 2 in some warmer regions, the main direction is from the atmosphere into the ocean. Overall, the ocean near the poles takes up more carbon dioxide than the tropical and subtropical oceans, as another experiment with hot and cold water shows. Due solely to their cold temperatures, the Arctic and Antarctic regions are particularly affected by ocean acidification. Researchers assume that the surface water will have turned corrosive in some polar regions by 2018, thereby dissolving the shells of calcifying organisms. The fifth experiment shows how seawater, in contrast to the freshwater in lakes and rivers, reacts to the rise in carbon dioxide. The saltier the water is, the slower its ph decreases. This so-called buffering capacity of the seawater therefore depends on its salt content. However, the buffer capacity is not unlimited - even the saltiest sea becomes gradually more acidic. today Coccolithophorid Calcidiscus today... 4


5 In the ocean, carbon dioxide dissolved in water, together with bicarbonate ions (HCO 3 - ) and carbonate ions (CO3 2- ), forms a large carbon reservoir referred to by researchers as DIC. The three letters stand for dissolved inorganic carbon. Much smaller amounts of carbon are present in the form of dissolved organic compounds - dissolved organic carbon, DOC. The ph of the seawater is determined by the concentration of carbon dioxide, bicarbonate and carbonate. The sixth experiment leads to a deeper understanding of ocean chemistry and ph regulation. Like on land, photosynthesis also occurs in the ocean: marine microalgae, single-celled plants barely discernible by the naked eye, process carbon dioxide and use it for growth. This is demonstrated by an experiment with the microalgae Dunaliella sp. in seawater. Finally, students explore the CO 2 balance of their own environment. How much carbon dioxide does the air in their classroom contain? What factors can increase the CO 2 concentrations, and which factors are capable of reducing it? The last experiment may trigger some thoughts on which of our actions lead to even more carbon dioxide into the atmosphere and how we can help to reduce this greenhouse gas under conditions that are expected for the year This microscope image clearly shows the damage to the calcareous algae as a result of ocean acidification. 5

6 introduction A bit of chemistry For the process of ocean acidification, two reactions are particularly important. These can occur simultaneously: 1. The formation of carbonic acid and the subsequent release of hydrogen ions: CO 2 + H 2 O H 2 CO 3 H + + HCO 3 - carbon dioxide water carbonic acid hydrogen ions hydrogen carbonate ions 2. The reaction between carbonate ions, CO 2 and water, resulting in bicarbonate ions: CO 2 + H 2 O + CO HCO 3 carbon dioxide water carbonate ions bicarbonate ions These reactions not only turn the water more acidic but also decrease the number of carbonate ions. However, these ions are exactly what are needed by calcifying organisms, such as clams and corals, to build their shells and skeletons. The ph scale The ph indicates how acidic or basic (alkaline) a liquid is. It depends on the concentration of hydrogen ions in an aqueous solution. With increasing ph, the number of hydrogen ions decreases and rises with decreasing ph. Pure water has a ph of 7. Lower values are described as acidic, and higher ones as basic. Seawater currently has a ph between 7.8 and 8.5 and is therefore slightly basic. Since the ph is based on a logarithmic scale, a change from ph 8 to ph 7 corresponds to a tenfold increase in acidity i.e. hydrogen ion concentration. If the ph of a liquid changes from 7 to 6, there are ten times as many additional hydrogen ions as in a change from ph 8 to ph 7. Tip: Making seawater Some of the experiments are carried out with seawater. If no seawater is readily available, it can be easily made using a salt mixture from the pet shop. The aim is to achieve a salinity of 35. Any water to be used for the experiments, i.e. freshly mixed seawater, tap water or distilled water, should be left overnight in an open container so that the carbon dioxide content can equilibrate with the ambient air. Unless otherwise specified in the instructions, the water used for the experiments should always be at room temperature. Scientists now report salinity as a dimensionless quantity - the unit, psu (practical salinity units) is no longer used. The older unit, ppt (parts per thousand or per mille), is also no longer in use. A salinity of 35 corresponds to 35 grams of salt per litre of water. 6 Right-hand Figure: The global carbon dioxide budget for the years 1990 to 2000 (blue) and 2000 to 2009 (red), expressed in gigatons per year. Carbon dioxide (CO 2 ) is emitted to the atmosphere due to deforestation and other changes in land use, as well as through the use of fossil fuels or cement production. The amount of CO 2 in the atmosphere increases. Plants on land and in the ocean act as so-called sinks to take up some of the CO 2.


7 increase in the atmosphere 3,1 ± 0,1 4,1 ± 0,1 land sink 2,6 ± 0,9 2,4 ± 1,0 changes in land use 1,6 ± 0,7 1,1 ± 0,7 use of fossil fuels 6,4 ± 0,4 7,7 ± 0,5 ocean sink 2,2 ± 0,4 2,3 ± 0,5 geological reservoirs 7


8 8 experiment 1
9 teacher The gas exchange between ocean and atmosphere The oceans exchange gases such as oxygen and carbon dioxide (CO 2 ) with the atmosphere. This occurs at the boundary layer where the air and surface waters meet. In addition to temperature, the corresponding CO 2 pressure and chemical reactions between already-dissolved carbon dioxide and other dissolved material in the water determine how much CO 2 the ocean can absorb. Various other biological and physical processes determine the release or uptake of CO 2. This experiment illustrates the exchange of gases between water and the atmosphere and how the concentration of gases in these media is always maintained in balance. The effect of temperature on this process will also be observed. Students learn that the oceans give off CO 2 in the warm waters near the equator, while the cold polar oceans can absorb considerably more CO 2. experiment p 1 summary Preparation time: Activity time: For pupils aged: Application: Time for data analysis and discussion: Prior knowledge required: Degree of difficulty: Safety note: 10 minutes 10 minutes for setting up, 1 hour for observation years physics or chemistry lesson, after-school activity 20 minutes factors affecting gas solubility easy although the universal indicator is not toxic, the pupils should only blow air into the bottles and avoid sucking up the liquid materials 3 bottles or flasks of the same size (any material or size will do) 3 beakers or drinking glasses large enough for the bottles to fit in 1 drinking straw 1 small pipette universal indicator (McCrumb) water: distilled water, tap water or seawater are suitable hot water ice cubes 9

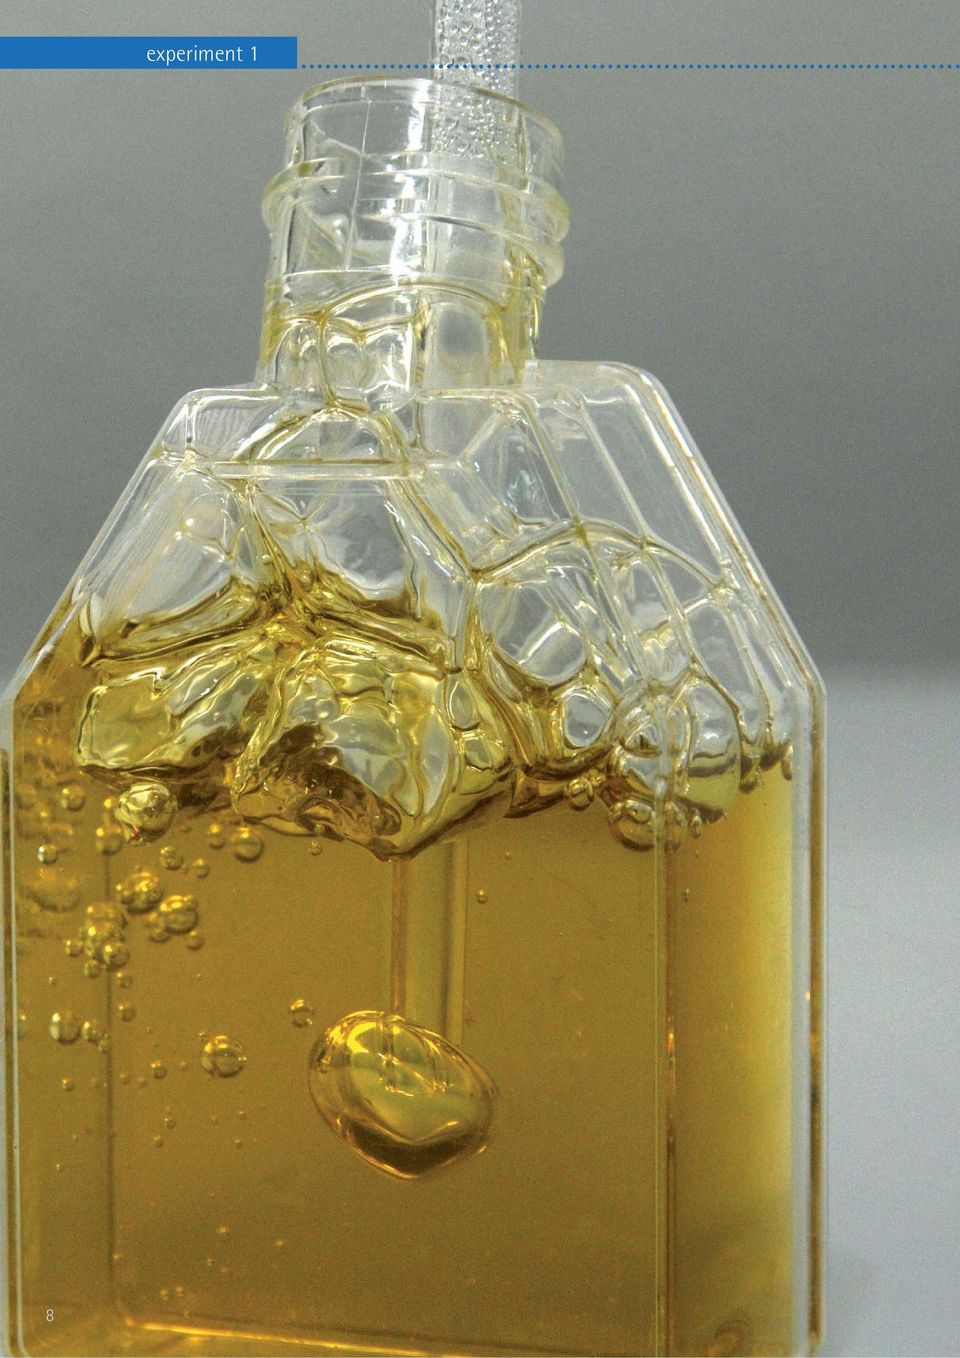
10 experiment 1 procedure Figure 1: The bottles with distilled water and McCrumb Indicator 1. Fill the bottles half-full with water. Use either distilled water, tap water or seawater in all three bottles. Put several drops of indicator solution into the bottles with the pipette until the water in the bottles has reached the same shade of green. Be sure to add the same amount of indicator in all bottles. The amount of indicator depends on what water is used and its volume. 2. The air you exhale contains carbon dioxide. Use the drinking straw to blow air into the bottles until the colour changes from green to yellow. This means that the ph of the water has changed from basic to acidic. Keep blowing air through the straw until there is no further colour change. Figure 2: CO 2 was added by blowing air into the bottles. The yellow colour indicates that the water became more acidic. 3. Fill one beaker half-full with water at room temperature, the second beaker half-full with hot water and the last beaker with ice water. Figure 3: The bottles are placed uncapped in water baths of different temperatures. 4. Put one uncapped bottle in each beaker and observe the change in colour of the water inside the bottles. Depending on the temperature of your water bath, this may take about an hour until the change becomes visible. results 1. Did the colour of the water in the bottles change? 2. What does the colour change in the bottles mean? 10


11 teacher notes 1. The water in the bottle placed in the hot water bath changed gradually from yellow to green. This means that the dissolved CO 2 escaped back to the air making the water more basic. This demonstrates partly why CO 2 in low latitude waters is degassed out of the water. In this region, cold newly upwelled, CO 2 -rich deep water is warmed thus releasing CO 2 into the atmosphere. Figure 4: The green shade indicates that the water in the bottle with the hot water bath has already released CO 2 back into the air. 2. High temperatures decrease the solubility of gases in water and consequently lead to the release of dissolved gases to the atmosphere. Cold water is able to take up a larger amount of gas. The Arctic and the Antarctic Oceans are therefore able to absorb much more carbon dioxide than equatorial waters, where gasses are emitted back to the atmosphere. further experiments 1. Compare the results between distilled water, tap water and seawater. Distilled water will change to a more intensive yellow colour than tap water and seawater. These two contain calcium carbonate (lime) that buffers the acidification. 2. To investigate how the size of the surface area where water and air interact influences the degassing process, bottles or containers with different diameters can be used. Add the same amount of water to every container. Observe how fast the colour changes. The container with the largest diameter will also be the shallowest. The colour here will change back to green quicker than in containers with smaller diameters. After this experiment, you can draw attention to the fact that oceans cover 71 per cent of the earth s surface offering a large area for CO 2 exchange. 11


12 12 experiment 2

13 teacher Acidification in the boundary layer between ocean and atmosphere In lakes, rivers or the ocean, there is a constant exchange of gases between the air and the surface waters. Depending on the temperature and the amount of carbon dioxide (CO 2 ) already dissolved, the water either absorbs CO 2 from the atmosphere or releases it to the atmosphere. Captured carbon dioxide can be transported into deeper layers when the surface waters are cooled, become heavier and then sink we then talk about the ocean as a carbon sink. If this does not occur, the dissolved gas remains at the surface and equilibration takes place with the atmosphere. This experiment illustrates the gas exchange at the interface between water and air. It also shows how temperature affects the process. Observations made during the experiment can thus illustrate the processes which occur at the interface between ocean and atmosphere. experiment p 2 summary Preparation time: Activity time: For pupils aged: Application: Time for data analysis and discussion: Prior knowledge required: Degree of difficulty: Safety note: 15 minutes 15 minutes years physics or chemistry lesson, after-school activity 15 minutes acid-base interaction, concept of indicators easy since matches and candles are used, this experiment should be performed under the supervision of an adult. materials 6 salad bowls of the same diameter distilled water at room temperature frozen distilled water (ice cubes) 12 floating candles or tealight candles, preferably white matches white background (paper, napkin, kitchen towel) universal indicator (McCrumb) pipette To save on materials, the experiment can be carried out in parts one after the other. In this case, only two salad bowls of the same size and four candles are necessary. It is essential to use water which has equilibrated with the surrounding air. Place the water in an open container and leave it to stand in the room overnight, better still outdoors. To speed the process up, the water can be aerated using an aquarium pump. 13

. It is important that all three bowls are filled to the same level, about two-thirds.")
14 experiment 2 procedure Figure 1: Bowl of water with green indicator. 1. Place three bowls on top of the white paper. Fill these with the same volume of distilled water. These bowls represent three oceans. Cool one bowl by adding the frozen distilled water (ice cubes). It is important that all three bowls are filled to the same level, about two-thirds. Add the same amount of indicator to each bowl. Make sure that they have the same intensity of green colour. 2. Light eight candles and place four in the bowl with frozen distilled water and four in another bowl. Put the four unlit candles in the third bowl. This will serve as your control. Cover the bowls with the remaining empty bowls. Note the colour of the water at the start of the experiment. Figure 2: Four burning candles float in the bowl with green indicator. 3. Watch how the candles burn out and how the colour of the water in the bowls changes. This will take a few minutes. Look closely at the boundary between air and water. Can you explain why the candles burn out? What gas do the candles release when they burn? If necessary, explain that the candles burn out because they had used up the oxygen trapped in the bowls and that they release carbon dioxide when they burn. Figure 3 and 4: The bowl with the burning candles is covered with a second bowl. After several minutes, the candles burn out themselves. results What colour change did you observe? What does it indicate? 2. Where does the colour change take place? Did all the water in the bowl change its colour? What does this imply in relation to the oceans? 3. In which bowl was the colour change more visible? What is the reason for this?


15 teacher notes 1. The colour change from green to yellow (and the change of the ph from basic to acidic) occurs only at the water surface which has direct contact with the air above it. The carbon dioxide produced by the burning candles dissolves at the water surface making it acidic. Since there was no CO 2 introduced into the control bowl, where there were no lit candles, there should be no change in the colour of the water there. 2. Without agitation, the yellow, more acidic water remains at the surface and does not readily diffuse to the deeper part of the bowl. In the ocean, CO 2 dissolved at the surface is only effectively removed from the atmosphere if this CO 2 is physically transported to the deeper layers by convection. 3. The cooled water in one bowl should be more intensive yellow because of the higher solubility of gases in cold water. However, since the water in the bowl has a uniform temperature, there is no transport of the acidic water to the bottom of the bowl. 4. In this experiment, distilled water was deliberately used to show the ph change at the surface of the water using the universal indicator. Seawater cannot be used for this experiment because the indicator is not sensitive enough to a small ph drop. The buffering capacity of seawater will lead to a smaller change in ph compared to distilled water. 5. The experiment can be repeated using the same materials. Remove the covering bowl and stir the water to encourage faster equilibration with the air. The water will turn green and the experiment can be repeated. before after Figure 5: Colour of the water before the experiment with burning candles. Figure 6 and 7: After several minutes, the candles burn out and a thin yellow layer becomes visible at the surface. This indicates, that the water at the surface is more acidic than the water further down in the bowl. a further experiment Remove the covering bowl and let the setup stand for a while. Observe the colour change at the surface of the water: After several minutes, the yellow colour will disappear because equilibration with the surrounding air, which has a lower concentration of carbon dioxide, has occurred. 15


16 16 experiment 3
17 teacher Acidification of the oceans - The increase in carbon dioxide partial pressure in the atmosphere Rising carbon dioxide concentrations in the air also mean an increasing partial pressure of carbon dioxide (CO 2 ) in the atmosphere i.e. an increasing proportion of this gas within the gas mixture in the atmosphere. In order to restore the balance of the CO 2 partial pressure between the atmosphere and the ocean, the CO 2 diffuses to where the partial pressure is lower: This means diffusion of CO 2 from the atmosphere into the ocean. In this straightforward experiment, we see the impact of the steady increase in CO 2 partial pressure in the air on the ocean. experiment p 3 summary Preparation time: Activity time: For pupils aged: Application: Time for data analysis and discussion: Prior knowledge required: Degree of difficulty: 10 minutes minutes years physics, chemistry or geography lesson, after-school activity 20 minutes basic knowledge about acids and bases easy materials 2 large test tubes 2 rubber stoppers with 2 holes for the test tubes 2 glass tubes which fit into the holes in the rubber stoppers 2 thermometers a small amount of modelling clay 1 rubber tube test tube rack universal indicator (McCrumb) tap water or seawater, and distilled water at room temperature effervescent vitamin tablets, split into quarters 17


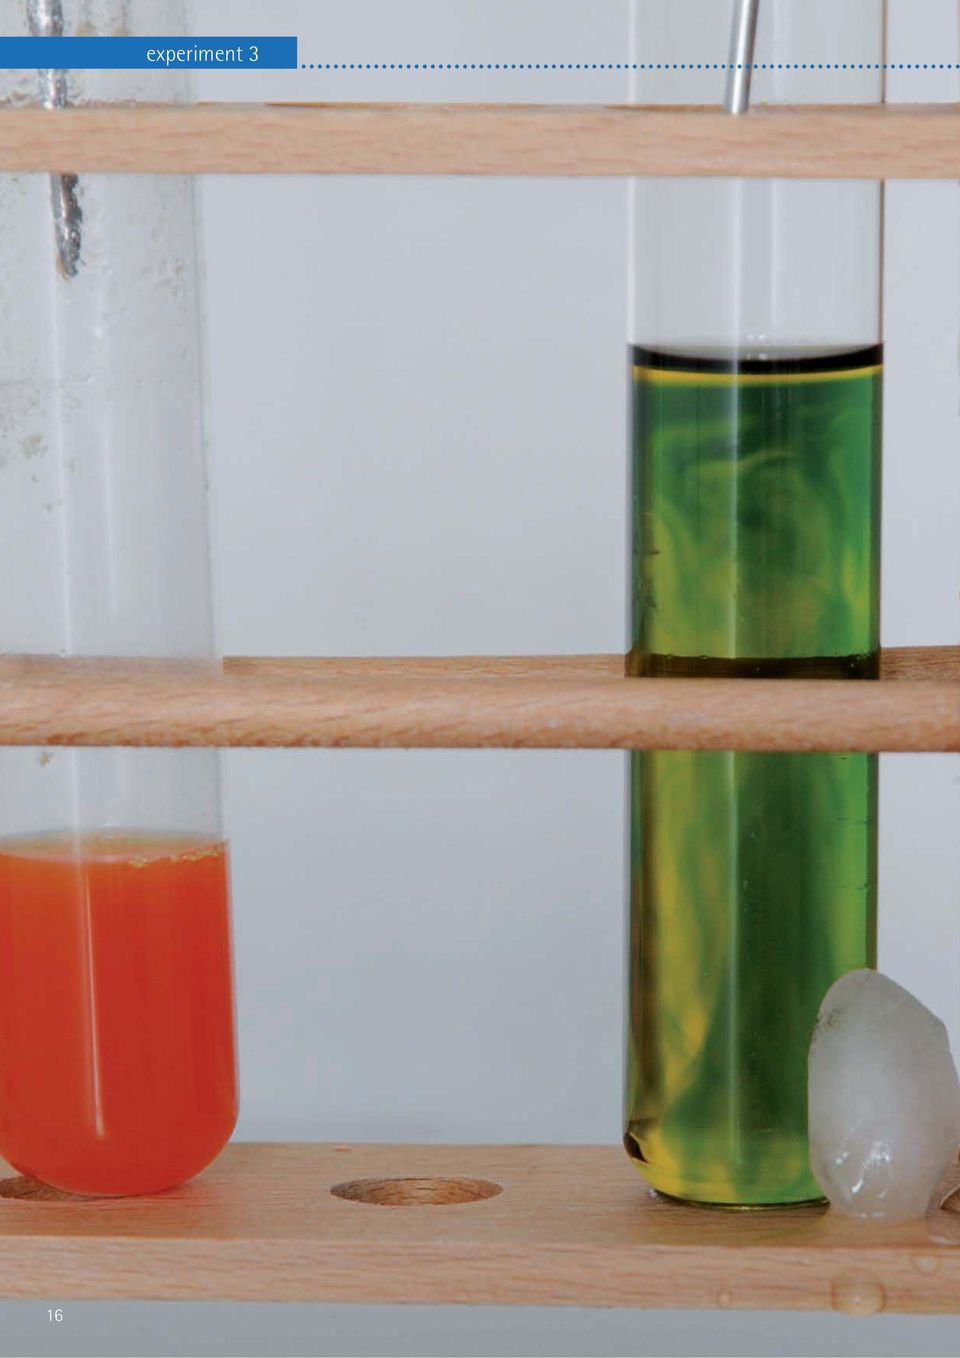
18 experiment 3 procedure 1. Insert one glass tube and a thermometer into the holes of each rubber stopper. Connect the two glass tubes in each plug with the rubber tubing. Figure 1: The green colour of the water in test tube A is due to the added indicator. 2. Close the test tubes with the rubber stoppers. Make your setup airtight using modelling clay to plug the air space on the holes of the stopper where you inserted the thermometers and the glass tubes. Note down the temperature of the air inside the test tubes as soon as it has stabilised. 3. Fill one test tube half-full with distilled water and add some drops of indicator until the water is a dark shade of green. Replace the stopper making sure that the thermometer does not touch the water. Place the test tube in the rack. This is test tube A. 4. Put one quarter of an effervescent tablet in the other test tube and add a generous amount of tap water to cover the tablet. Close the test tube immediately with the rubber stopper. Place the test tube in the rack next to the first one. This is test tube B. Figure 2: An effervescent tablet bubbles inside test tube B. 5. Note down the temperature of the air inside the two test tubes. 6. Look at the colour of the water with the indicator in test tube A. Do you already notice a change? Figure 3: Measuring the temperature. Figure 4: Change of colour in test tube A. 7. Put another quarter of the effervescent tablet into test tube B and close it immediately. Wait about 3 to 5 minutes and observe the colour of the water in test tube A again. Do you observe a change now? Keep adding a quarter of an effervescent tablet until the colour changes waiting for at least 5 minutes after each addition. Write down the temperature every time you add another quarter. 8. Repeat the experiment with seawater or tap water. 18 Figure 5: Change of colour after the addition of the first quarter of an effervescent tablet.

19 teacher experimental setup rubber tube thermometer glass tube water with indicator A B quarter of an effervescent tablet addition of effervescent tablets distilled water temp ( C) observations 0 1/4 1/2 3/ /4 colour /ph temp ( C) colour /ph temp ( C) colour /ph temp ( C) colour /ph temp ( C) colour /ph temp ( C) colour /ph water seawater results 1. Describe any changes in colour of the water in test tube A after the first quarter of an effervescent tablet was dissolved in test tube B. What happened after adding another quarter? And another? What does the visible change mean? 2. What happened to the temperature in the test tubes after the effervescent tablets were added? What does this temperature rise indicate? 3. At what temperature does the colour change at the surface of the distilled water become visible? How does this compare to when tap water or seawater is used? Can you explain any differences? 19


20 experiment 3 notes 1. The effervescent tablet contains solid sodium hydrogen carbonate and solid citric acid. When water is added to the tablet, these solids dissolve, dissociate into ions and carbon dioxide is released. The carbon dioxide increases the pressure in test tube B, and the gas is forced into test tube A. The carbon dioxide reacts with the water in test tube A forming carbonic acid. 2. The addition of quarters of the effervescent tablets simulates the ever-increasing CO 2 in the atmosphere. The initial increase of CO 2 after addition of the first quarter tablet does not necessarily lead to acidification of the water in test tube A. However, after subsequent addition of more tablets the concentration of CO 2 increases leading to the colour change (lowered ph) of the water in test tube A. The temperature in test tube B increases because the pressure inside the test tube rises. The dissolution of an effervescent tablet is an endothermic process (energy/heat is absorbed from the surroundings), but the increased pressure neutralizes this effect. 3. The higher the pressure, the higher the temperature: The water in test tube A starts becoming more acidic as soon as the temperature inside increases due to increasing CO 2 pressure. This happens faster when distilled water is used instead of tap water or sea water. 4. At the beginning of the experiment, no change is observed when tap water or seawater is used because they are able to buffer the acidification process. Tap water is buffered by the high calcium carbonate content and seawater is buffered by the carbonate system, but when the partial pressure of carbon dioxide continues to rise, even tap water and seawater will become acidic. Tap water in your area may be soft meaning it does not contain much calcium carbonate. In this case, the water may turn acidic faster. 5. The acidic water at the surface of test tube A does not sink to deeper parts automatically. In the ocean, it also stays at the surface unless it is transported to the deeper waters by convection. This leads to more acidic surface waters affecting a number of surface water dwelling organisms. 6. As an additional experiment, you can cool the upper part of test tube A by placing ice cubes on the outside wall of the test tube. Remove the tube connecting the two test tubes to cut off the CO 2 supply to test tube A. Only cool the part where you find the more acidic water. After some time, you can watch how the water sinks down to the lower part of the test tube. In the ocean, the absorbed CO 2 is also transported to deeper layers when the water gets cooler. Figure 6: Expansion of the acidic layer of water. 20


21 teacher 21

22 22 experiment 4
23 teacher How does the temperature affect the solubility of CO 2 in water? If the proportion of carbon dioxide (CO 2 ) in the atmosphere increases, the temperature of the air and the ocean will also increase due to the greenhouse effect. Do these increasing water temperatures have a positive or negative effect on the ability of the water to absorb CO 2? Will this effect be observed globally or regionally? This simple experiment illustrates that cold water dissolves larger volumes of gas than warm water. When we relate this to the oceans, it means that polar regions are capable of absorbing particularly large volumes of carbon dioxide. On the one hand, they act as CO 2 sinks and thereby slow down climate change. On the other hand, increasing CO 2 concentrations have adverse effects on organisms in the water. In the tropics and subtropics, the ocean even releases CO 2 into the atmosphere. In terms of global temperature rise, this means that the warmer the water of our oceans is, the less CO 2 it can absorb. experiment p 4 summary Preparation time: Activity time: For pupils aged: Application: Time for data analysis and discussion: Prior knowledge required: Degree of difficulty: 10 minutes minutes years chemistry, physics or, geography lesson, or after-school activity 20 minutes none easy materials large transparent bowl or an aquarium 250 ml transparent graduated cylinder funnel petri dish covers stand and clamp (optional) ice cubes / cold water water heater / warm water effervescent tablets It is easier to compare the experiment with warm and cold water if you do both experiments simultaneously. Colour the water with food colouring (e.g. blue and red) to distinguish the warm and cold experiments and see the results more effectively. 23


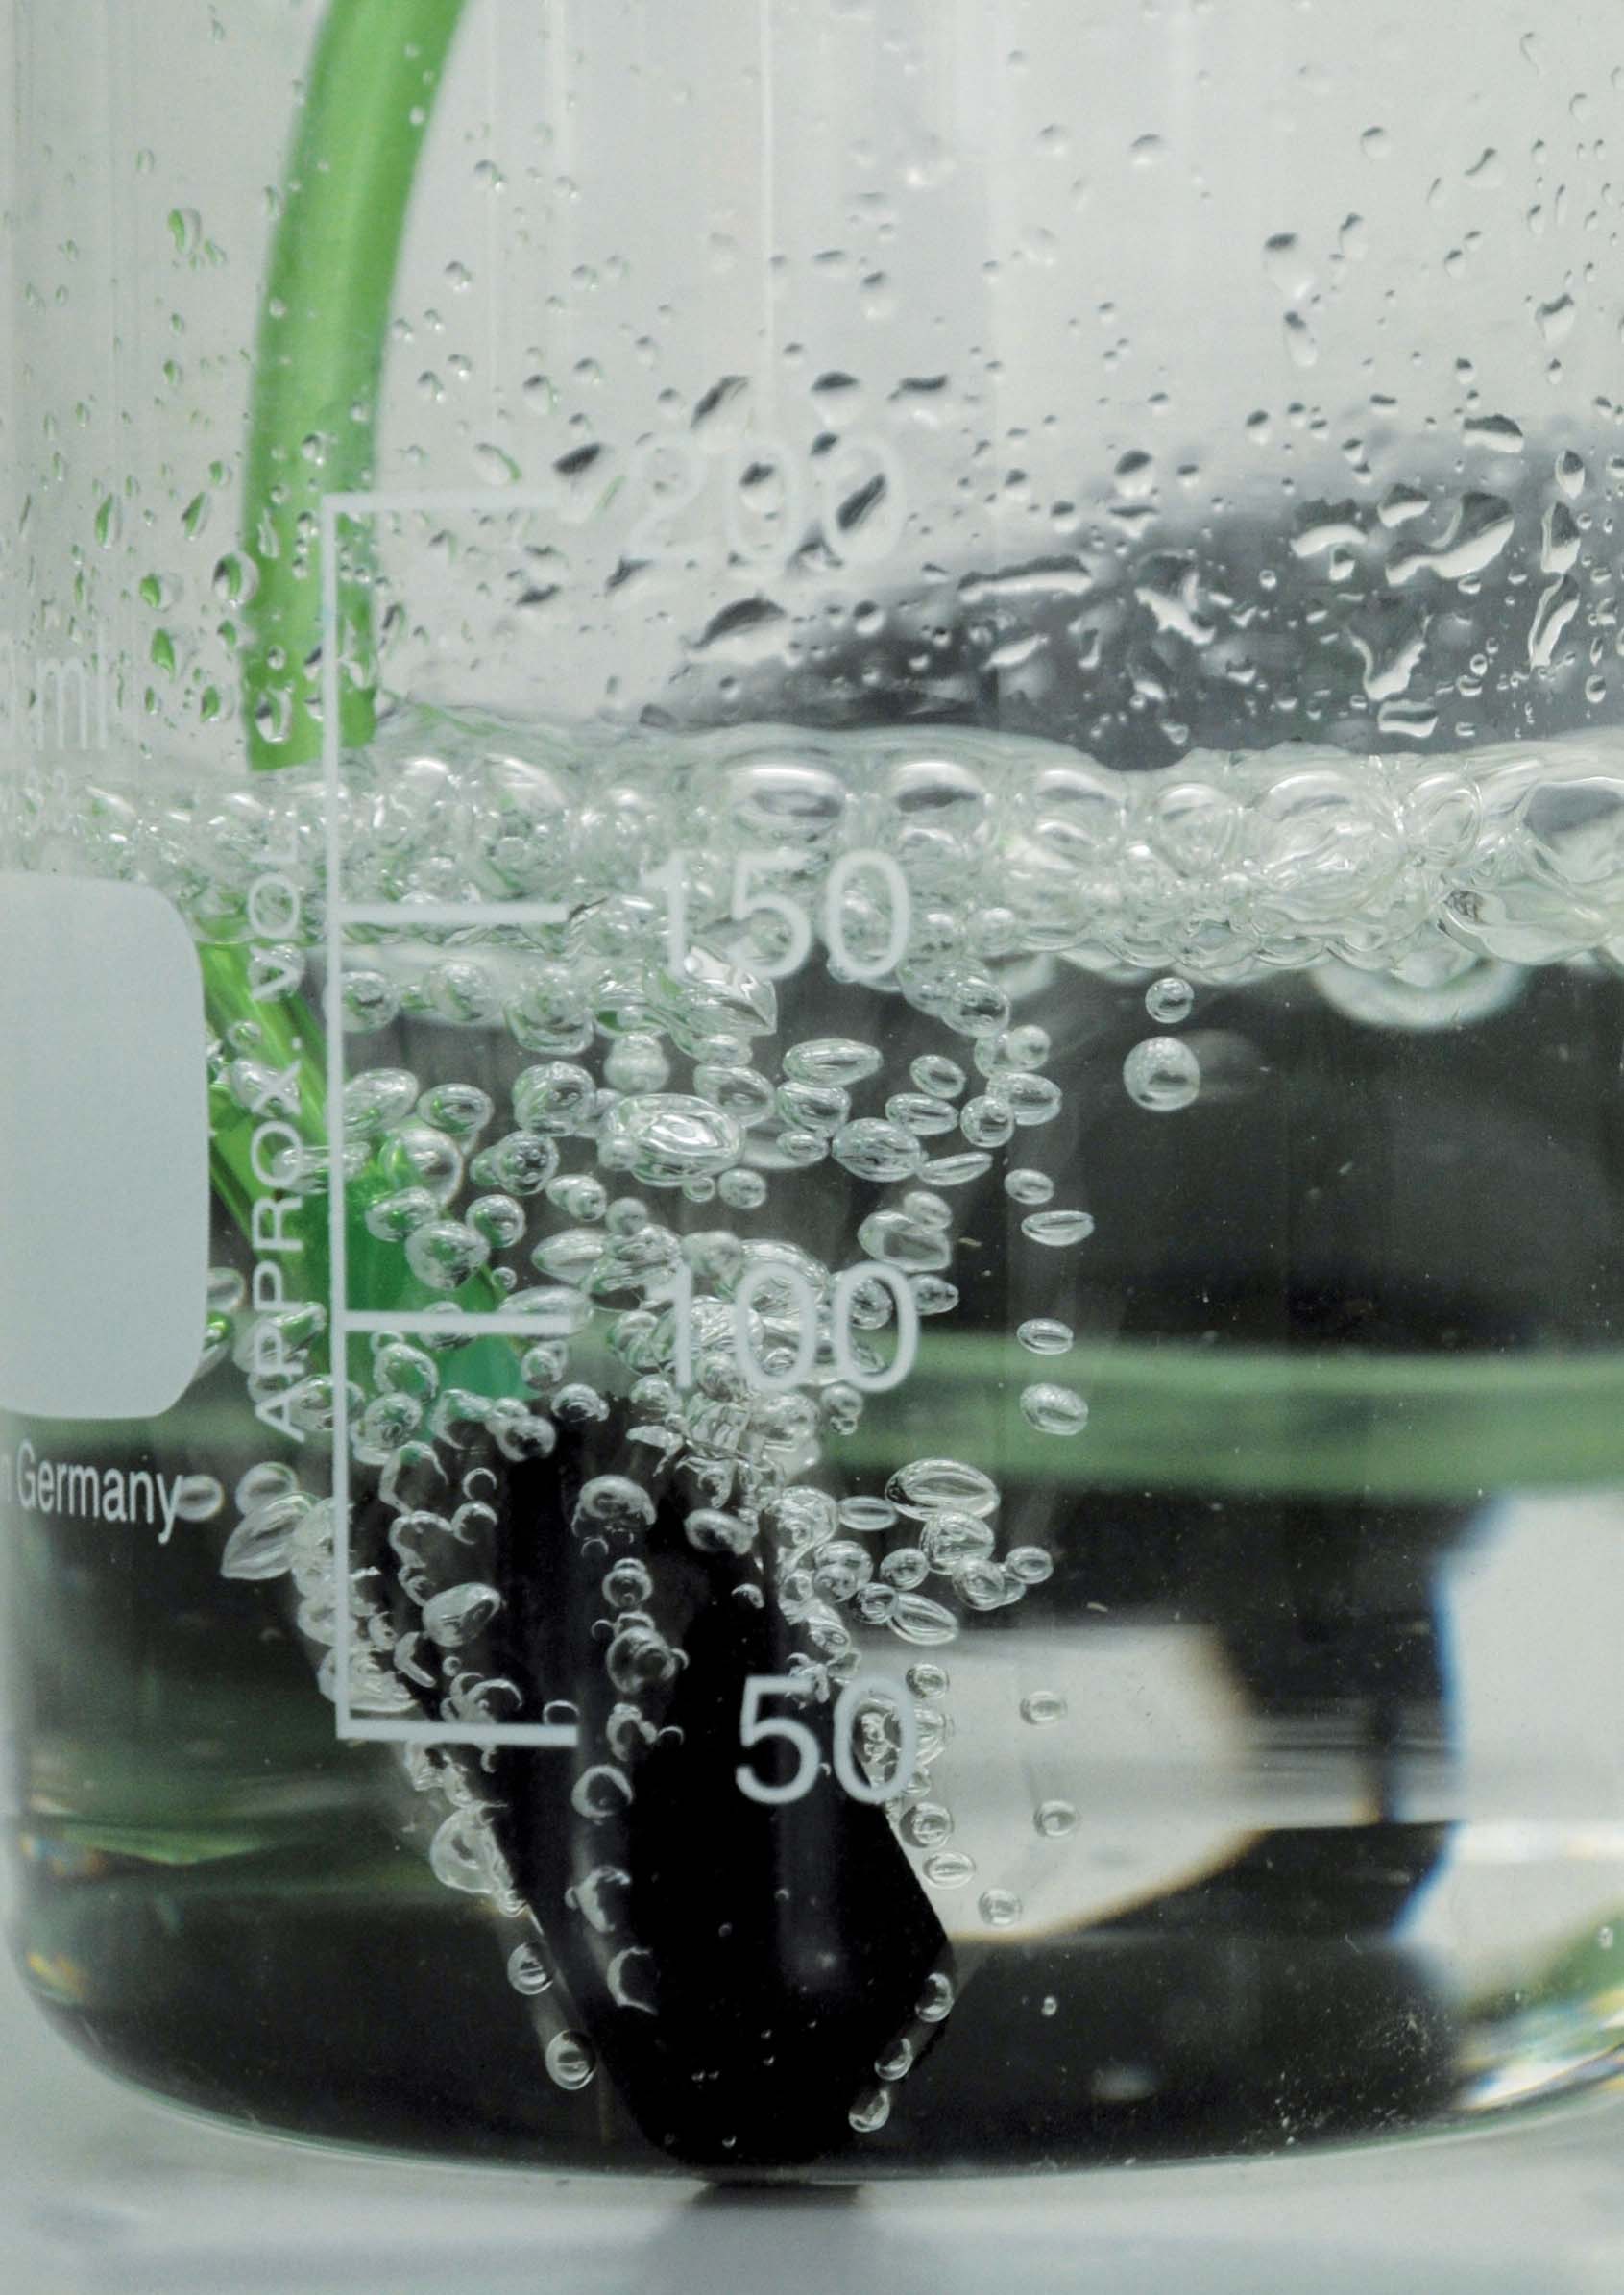
24 experiment 4 procedure 1. Fill the bowl half-full with cold or warm water. Figure 1: Covering the cylinder mouth with a petri dish. 2. Fill the graduated cylinder to the brim with water from the bowl and place it carefully upside down in the bowl. Be sure that no water spills out of the cylinder so that no air bubbles are formed. To do this, cover the opening of the full cylinder with a petri dish, invert the cylinder and immerse this in the bowl. Remove the petri dish after the mouth of the cylinder is already under water. 3. Tilt the graduated cylinder and place the funnel in the opening of the cylinder taking care that there is minimal space between the funnel and the opening of the cylinder and hold it in place. Eventually, the cylinder should sit safely on the funnel. Figure 2: Replacement of the petri dish cover with a funnel. 4. Place an effervescent tablet carefully but quickly under the funnel. This dissolves immediately in the water. Observe how an air pocket develops at the top of the upside down cylinder. Record the volume of the air space formed in the table below. Repeat the trial several times. For each trial discard the used water and replace this with the same volume of fresh water. Figure 3: Holding the cylinders to keep them in place. 5. Compare the results you get when using warm and cold water and record your results in the table. What happens with the air space when warm water is used? Figure 4: Comparison of the cylinders. Adding colour to the water will make comparisons easier. table 1: results formation of an air space inside the graduated cylinder number of effervescent tablets volume of air space formed (ml) trial number cold water warm water
25 teacher results 1. Which produces a larger volume of air space inside the graduated cylinder, cold water or warm water? 2. What will be the consequence of a warming ocean? How will this affect the role of the oceans as a CO 2 sink? 3. In which areas of the world will you expect more CO 2 uptake into the ocean? Where will it be less? notes 1. When the effervescent tablets dissolve in water, the carbon dioxide bubbles are produced and rise. Water has a limited inherent capacity to dissolve gases. The volume of the air space formed in the graduated cylinder is equal to the volume of CO 2 (and other gases), which cannot be dissolved in the water anymore because it is saturated. The gas released during the initial dissolution of the tablet will dissolve in the water. Once the water becomes saturated with gas, further gas released will no longer dissolve in the water and will form an air bubble, displacing water inside the cylinder. 2. The solubility of gases decreases with increasing temperature, so the air space inside the cylinder when warm water was used will be bigger compared to when cold water was used. 3. The Northern Atlantic and Antarctic Oceans act as major sinks of CO 2 because they are colder than other seas. In addition, cold water is denser than warm water, causing it to sink, therefore the carbon dioxide taken up at the surface can be transported to the deeper waters by convection. 4. Warm equatorial waters tend to release CO 2 into the atmosphere. In these regions upwelling of CO 2 -rich deep waters occurs. When the water reaches the surface, it is warmed decreasing gas solubility therefore leading to the degassing of CO 2. further experiments 1. Try the experiment with different salinities. The effect of salinity is however not as great as temperature, so use very different salinities e.g., compare distilled water with seawater (salinity: 35). 2. Try adding two tablets, one after the other, to the same funnel. Use the same water temperature. The students will assume that a tablet will always produce the same volume of air inside the cylinder. The second tablet will, however, produce a larger volume of air because the water is already saturated. This will demonstrate that water has a limited capacity to take up gases. 3. With this experiment, you can even show how the ph influences the amount of CO 2 that can be taken up by the water. To do this, run this experiment with normal water and with water acidified with vinegar. 25
26 26 experiment 5
27 teacher The effects of increased CO 2 concentration in the air on seawater and distilled water More than 70 per cent of the earth s surface is covered with water - we truly live on a blue planet! Only about three per cent of this is fresh water, whereas the remaining 67 per cent consist of more or less salty seawater. How do rising carbon dioxide concentrations in the atmosphere affect the ph of seawater and bodies of freshwater, such as lakes and rivers? This experiment shows that salinity has an impact on how oceans and lakes respond to carbon dioxide (CO 2 ), which reaches the water from the air. It is clear that seawater can withstand acidification longer than fresh water. In this experiment you will use distilled water (pure water containing no dissolved ions or other components) and seawater, to compare how they react to rising CO 2 levels in the air. experiment p 5 summary Preparation time: Activity time: For pupils aged: Application: Time for data analysis and discussion: Prior knowledge required: Degree of difficulty: Safety notes: 15 minutes 30 minutes years chemistry lesson, after-school activity 30 minutes concept of acids and bases medium since matches and candles are used, this experiment should be performed under adult supervision materials large transparent basin or a large aquarium 2 beakers (500 ml) 2 ph meters aquarium pump plastic tubing and 2 airstones with regulator valves seawater*, distilled water* 5 tealight candles matches stopwatch * Leave the water to stand overnight in an open container to allow it to equilibrate with the surrounding air. Aerating the water with the aquarium pump is also advisable. 27
28 experiment 5 procedure 1. Fill one beaker half-full with seawater and the other half full with distilled water. Aerate the water in the beakers with the airstones connected to the aquarium pump. Regulate the aeration with the valves so that both beakers are bubbled with air to the same degree. Figure 1: The same amount of bubbling in the two beakers. 2. Place one ph electrode in each beaker and connect these to the ph meters. Make an initial reading and record this in the table. Figure 2: The initial ph is recorded. 3. Light the candles and place them next to the beakers. Place the entire setup under the inverted aquarium. The aquarium pump should also be inside the aquarium. If the aquarium is not big enough, the ph meters can be placed outside. Figure 3: The burning candles are placed next to the beakers. 4. Record the ph of the water in the beakers for 10 minutes at 1-minute intervals. Note down the time when all the candles burn out. 5. Make a graph of the results you recorded in the table. Figure 4: The ph is recorded every minute. 28
29 teacher experimental setup regulator valve ph electrode inverted aquarium aquarium pump airstone D S 7,00 8,00 ph meter ph meter D = distilled water S = seawater candles ph of the water in the beakers time (minutes) ph seawater distilled water ph 8,00 7,50 7,00 6,50 6,00 5,50 5,00 4,50 4, time (minutes) 29
30 experiment 5 results 1. In which beaker was there a greater change in ph? Did the water become more basic or acidic? 2. Many aquatic organisms cannot tolerate big ph changes in their environment. What do you think will be the effect of a high CO 2 environment to organisms in a lake and in the ocean? 3. Why should the water in the beakers be aerated? Why should the pump also be placed inside the inverted aquarium? 4. What do the burning candles do to the air inside the aquarium? Where does the oxygen go? What gas do the burning candles produce? notes 1. The decrease in ph of the distilled water is faster and greater than that of the seawater. 8 7,5 7 6,5 seawater ph 6 5,5 5 distilled water ph of the water in the beakers over time 4, time (minutes) In our example, the ph of the distilled water changed from 6.5 to 4.6 within ten minutes, whereas the seawater ph decreased from 7.8 to 7 for the same duration. The change in ph can be calculated as ph at the start of the experiment (ph t0 ) minus the ph at a given time (ph tn ). Ask the students to draw a graph and plot the change in ph over time. ph change 2 1,8 1,6 distilled water 1,4 1,2 1 seawater 0,8 0,6 0,4 0, time (minutes) ph change in the beakers 30
31 teacher Another way of showing the change in ph is by multiplying the values for the graph above by -1. Plotting the results will give: 0 ph change -1 seawater distilled water ph change in the beakers time (minutes) 2. The water should be aerated by a pump, which is placed inside the aquarium. By placing the pump under the inverted aquarium together with the candles, air will be pumped from inside the aquarium into the water. Bubbling also increases the contact between the air inside the aquarium and the water and so more gas dissolves into the water. 3. Alkalinity is a measure of the ability of water to resist ph changes. The buffering capacity (alkalinity) of water depends on the carbonate system as well as on the dissolved ions in the water. 4. Some lakes have hard water containing high magnesium and calcium concentrations and these exhibit high alkalinities. On the other hand, some have soft water with low salinity, specifically low in calcium and magnesium and only a small amount of dissolved salts. Their alkalinities are low. Seawater has a high salinity (35), high alkalinity and therefore a high buffering capacity. 5. Lakes can either be sinks or sources of CO 2. Since most lakes are acidic, receiving acidic water from run-off of terrestrial origin as well as from acidic wet (rain, snow, fog) and dry (gas, particles) precipitation, CO 2 plays only a minor role in lake acidification. However, lakes are sensitive to the effects of CO 2 because they are shallower and have smaller volumes compared to the oceans, where dilution and convection can mitigate high CO 2 inputs both from the atmosphere and land. further experiments 1. If time allows, continue to record the ph until no further changes can be measured. Take note of how long it takes and what the final ph of the water in the two beakers is. After some time the ph in both beakers will stabilise corresponding to the point when the amount of CO 2 in the air and in the water is in equilibrium. 2. Collect water from different lakes or sources to compare the buffering capacity of each lakes. See if you can find hard water and soft water lakes. 3. Compare the buffering capacity of water with different salinities by dissolving different amounts of sea salt in water. 31

32 32 experiment 6
33 teacher ph regulation in seawater: The role of carbonate (CO 3 2- ) and bicarbonate (HCO 3 - ) Dissolved inorganic carbon (DIC) represents the largest carbon pool in the ocean. This reservoir includes the dissolved carbon dioxide (CO 2 ) and bicarbonate (HCO 3 - ) and carbonate ions (CO 3 2- ). The ph of seawater depends on the relative proportions of these components. The ph of our oceans is currently in the basic range, 7.8 to 8.5, where HCO 3 - ions dominate. If the ph increases, the concentration of carbonate ions also increases. If more CO 2 dissolves in seawater, it turns more acidic and the ph drops. The chemical reaction in water forms carbonic acid (H 2 CO 3 ). This is relatively unstable and dissociates immediately into bicarbonate and hydrogen ions. Some of the hydrogen ions produced during decomposition of carbonic acid react with further with carbonate to form additional bicarbonate ions. The concentration of carbonate ions decreases accordingly. The ions are responsible for the buffering function of seawater. Seawater can resist significant fluctuations in ph, even after addition of weak bases or acids. The carbonate ions can react with the large quantities of calcium ions present in seawater. This reaction generates calcium carbonate (limestone, CaCO 3 ), the material which mussel shells, coral skeletons and shells of some microalgae are made of. This experiment illustrates how bicarbonate and carbonate regulate the ph of seawater, and clearly demonstrates how seawater can buffer ph changes. experiment p 6 summary Preparation time: Activity time: For pupils aged: Application: Time for data analysis and discussion: Prior knowledge required: Degree of difficulty: Safety note: 5 minutes 30 minutes years physics or chemistry lesson, after-school activity 20 minutes acid-base interaction, concept of indicators medium although the universal indicator is not toxic, the pupils should only blow air into the bottles and avoid sucking up the liquid materials 3 to 6 bottles of the same size with lids distilled water seawater 6 drinking straws sodium carbonate (Na 2 CO 3 ) sodium bicarbonate (baking soda, NaHCO 3 ) universal indicator (McCrumb) with colour chart pipette eggshells (optional) 33
34 experiment 6 procedure 1. Fill three bottles with the equal amounts of seawater and the other three with the same amount of distilled water. Add a small pinch of sodium carbonate to one of the bottles containing seawater and to one containing distilled water. Do the same for the sodium bicarbonate. Figure 1: The six bottles after the indicator is added. 2. Compare the colours of the water inside the bottles. Do you see any differences? 3. Add 20 drops of the McCrumb indicator solution to each bottle. Determine the ph of the water in each bottle using the colour chart. Can you see any differences now? 4. Insert drinking straws through the openings of the bottles making sure that they are immersed in the water. Figure 2: The colour of the water after blowing into the bottles for 20 seconds. 5. Blow air through the drinking straw to introduce CO 2 into the bottles. Try to blow uniformly for 20 seconds into each bottle. Replace the lids of the bottles and determine the ph. Record the ph in the table below. 6. Repeat step 5 but instead blow for 40 seconds and 60 seconds into the bottles. Do you notice any differences? Figure 3: The colour of the water after blowing into the bottles for 60 seconds. 34 Log (concentration (mol kg-1)) -1,5-2 -2,5-3 -3,5-4 -4,5 CO 2 H+ OH- Surface ocean ph HCO - 3 CO ph Figure 4: If the amount of dissolved CO 2 increases, the ph is low. At higher ph, bicarbonate and carbonate are the dominant species.
35 teacher table 1: results estimated ph (see colour chart) initial colour after addition of indicator water samples after blowing for 20 seconds after blowing for 40 seconds after blowing for 60 seconds seawater seawater with NaHCO 3 seawater with Na 2 CO 3 distilled water distilled water with NaHCO 3 distilled water with Na 2 CO 3 results 1. Do you notice any differences in the appearance of the water in the different bottles before the addition of the indicator solution? 2. Compare the ph of the water in the different bottles. How did the addition of sodium carbonate and sodium bicarbonate to seawater and distilled water prior to bubbling with CO 2 affect the ph? 3. What happens to the ph of the water in the bottles after blowing in CO 2 into them? Does addition of sodium carbonate and sodium bicarbonate to seawater and to distilled water make any difference with regard to ph changes? 4. Eggshells are made of CaCO 3. Add powdered eggshells to the acidic seawater and to the acidic distilled water. Do you notice any changes in the ph? Why? What is the difference between the carbonate - in the powdered eggshell and in Na 2 CO 3? 5. Can you now make a conclusion about the roles of bicarbonate and carbonate - in the buffering capacity of seawater? 35
36 experiment 6 notes 1. Even just a small pinch of Na 2 CO 3 can cause a supersaturation of the seawater with carbonate. The pupils may get a cloudy solution when Na 2 CO 3 is added to seawater (supersaturation means that the given volume of solvent, in this case seawater, already contains more of the dissolved material, here Na 2 CO 3, than it can normally dissolve). This will not be observed for distilled water. 2. Upon addition of the indicator solution, the pupils will see differences in what seemed to be similar looking water samples. 3. The table below shows the estimated ph of the different water samples after addition of different amounts of CO 2, varied by different durations of blowing into the sample. If the teacher has a way of adding exact amounts of CO 2 to the samples, for example from a CO 2 cylinder, then it is advised to do this, especially for older pupils. It is also recommended to test the ph of the seawater and the distilled water which will be used for the experiment beforehand. The seawater should have a ph of about 8 and distilled water a ph of 7. If this is not the case, transfer the water samples in containers with large openings or bowls and let the samples stand overnight or alternatively aerate the samples. This way, the gases in the samples will equilibrate with those in the air. estimated ph (see colour chart) water samples initial colour after addition of indicator after blowing for 20 seconds after blowing for 40 seconds after blowing for 60 seconds seawater clear seawater clear with NaHCO 3 seawater clear with Na 2 CO 3 (may be cloudy) distilled clear water distilled clear water with NaHCO 3 distilled clear water with Na 2 CO 3 From the table above, it is apparent that the ph of distilled water changes quite rapidly when CO 2 is added. The ph change of seawater is not as quick and not as large. However, further addition of CO 2 may also lower the ph of seawater to the acidic range. In both seawater and distilled water, no ph changes can be observed when NaHCO 3 or Na 2 CO 3 is added. 4. The addition of eggshells to the acidic seawater and distilled water will not cause any ph changes in the water sample even though eggshells are made of CaCO 3. The reason is, that the carbonate in the eggshell is not dissolved. Remind the pupils that the ph of seawater is determined by the dissolved inorganic carbon species in seawater. 36

37 teacher further experiments 1. Let the pupils determine ph changes in distilled water samples with increasing concentrations of Na 2 CO 3. If you have a good balance in school, weigh different amounts of Na 2 CO 3 and add this to the distilled water. Then blow CO 2 into the samples as described above. The pupils will observe that the less Na 2 CO 3 they add, the more the ph of the sample will change with addition of CO 2. Explain to them that seawater also has a limited amount of CO 3 2- and that the capacity of the ocean to take up CO 2 is not unlimited. 2. Let pupils design their own experiments with the water samples. Let them find out what happens to the ph of a water sample with NaHCO 3, if you add Na 2 CO 3, and what happens if they add them in the other order. This will show them that the ph of the water is dependent on which form of the dissolved inorganic carbon ion is predominant. This exercise can also lead them to understand that addition of HCO 3 - to supersaturation will not make the water more basic and it can even make the water less basic (not more acidic) if added in excess to a basic solution containing Na 2 CO 3. This is best seen in the graph at the start of this activity. National Center for Atmospheric Research Community Climate System Model 3.1 (CCSM3) modelled decadal mean ph at the sea surface for 1875, 1995, 2050 and Source: after Feely et al., Oceanography (2009). coral reefs 37

38 38 experiment 7
39 teacher Carbon dioxide fertilization of marine microalgae cultures (Dunaliella sp.) Tiny, single-celled plants that live in seawater called marine microalgae, need carbon dioxide (CO 2 ) in order to grow. Like plants on land, they help to remove CO 2 from the air, and thus contribute to the function of the ocean as a carbon sink. This experiment illustrates the importance of CO 2 for the growth of the microalgae, Dunaliella sp., in seawater. The conditions simulated in this experiment are, however, not a true reflection of the natural environment since the ocean is always re-supplied with CO 2 from the atmosphere. New research results show that growth may be accelerated in some types of oceanic algae by an increased CO 2 concentration. experiment p 7 summary Preparation time: Activity time: For pupils aged: Application: Time for data analysis and discussion: Prior knowledge required: Degree of difficulty: 20 minutes 1 2 weeks years biology 1 hour photosynthesis medium materials Erlenmeyer culture flasks (200 ml) rubber stoppers with one hole fitting into the mouths of the flasks (or cotton balls wrapped into transparent films) pipettes filter paper glass fibre filter (GF/F) drinking straws culture water: pond or lake water, seawater (salinity: 35), brackish water (salinity: 15) nutrients for algae culture: nitrate (NO 3 ), phosphate (PO 4 ), silicate (Si(OH) 4 ), vitamin mix, metal mix (If nutrients are not available, a plant fertilizer with high nitrate and phosphate content will also do. Use 5 10 millilitres per litre of culture water.) stock culture of freshwater or marine microalgae, e.g. Dunaliella sp. (If no stock culture is available, natural populations will do. Use a plankton net to gather phytoplankton from a lake, pond or from the sea. It may take a little more time until results can be seen with natural populations. Natural Dunaliella sp. does not require silicate.) 39
40 experiment 7 procedure 1. Filter the culture water first with the paper filters and then with the GF/F filters. Filter sterilization is optional, although this minimises bacterial and foreign algal contamination. 2. Prepare common culture water for all the treatments by adding the nutrients to the filtered water. Here, one millilitre of each solution from nitrate, phosphate, silicate and metal mix plus 500 microlitres of the vitamin mix is used for 1 litre filtered culture water. 3. Add about 5 millilitres of the stock algal culture, for example Dunaliella sp. to the prepared culture medium. The exact amount depends on the density of the algal culture. The more of a stock culture you add, the faster the new culture will grow. If you run this experiment in winter, it is better to use a bit more than in summer when higher temperatures and light promote growth. 4. Rinse and then fill the culture flasks with the prepared algal culture up to the 150 millilitres mark. Then you can decide what treatments you would like to make. For example: Treatment 1 (T1): Treatment 2 (T2): Treatment 3 (T3): CO 2 limited - flask covered tightly CO 2 fertilised - flask covered with a cotton wad made airtight by wrapping it in transparent film with a straw inserted in the middle for CO 2 introduction by blowing control (no CO 2 fertilisation) - flask covered with a cotton wad 5. Make three replicates of each treatment. Place the flasks in a bright place but not in direct sunlight. Treatments 1 and 3 should be gently shaken at least twice daily. For treatment 2, air should be blown into the culture for seconds twice a day. results Observe the algae cultures over two weeks. How do the colours in the flasks change? What do the changes tell you about the growth of the algae under the different treatments? 40


41 teacher notes The following changes should occur: Day 0 Initial stage: water clear Day 4 Green tinge in T2 Day 6 Light green in T2, green tinge in T1 and T3. Day 10 Darker green in T2, T3 becomes darker than T1. Day 13 Darker green in T2, T3 catching up with T2, T1 lightest green. Day 14 No further change in T2 and T3, no change in colour in T1. T1 much lighter colour than T2 and T3. Figure 1: From left to right: The CO 2 limited treatment (T1), the CO 2 fertilised culture (T2) and the control treatment (T3) at the start of the experiment. Figure 2: From left to right: T1, T2 and T3 after six days. Clear differences can be seen: The growth of the algae in T2 has nearly reached its plateau stage where no more algae will grow because of the depletion of the nutrients and will therefore not become much darker in colour. Figure 3: From left to right: T1, T2 and T3 after 14 days. T2 and T3 become similar in colour. T1 still shows very little growth. 41

42 42 experiment 8
43 teacher How much carbon dioxide is in the classroom? How much carbon dioxide (CO 2 ) is contained in the air of a classroom? What factors lead to more CO 2 production and to its removal? In this experiment, students work as a team to document how CO 2 concentration develops during a given time period (here: within a week) and how CO 2 concentrations change as a result of different activities in the classroom (in this case, within two weeks). experiment p 8 summary Activity time: For pupils aged: Application: Time for data analysis and discussion: Prior knowledge required: Degree of difficulty: Safety note: materials one week for the basic measurements, one week or longer for further experiments years group activity in biology, chemistry, geography, or maths lesson, interdisciplinary projects 1 4 lessons dependent on the experiments easy moderate Because candles are used, this experiment should be carried out under supervision of an adult handheld CO 2 sensor with data logger (example: TSI IAQ-Calc 7535) stand and clamp computer extension cables adhesive tape digital photo camera candles matches plants aquarium tap water or seawater ph meter aquarium pump, plastic tube, air-stones 43

44 experiment 8 procedure 1. Introduction Introduce the pupils to the carbon cycle by having them measure the carbon dioxide concentrations in different parts of the school with the hand-held CO 2 sensor, for example, in the schoolyard, in the parking lot, inside a small closed room with a different number of persons inside, on the school roof and other places. 2. Task allocation After the pupils have been acquainted with the use of the sensor, the pupils can be divided into groups with each group responsible for a given task: Analysts: This includes the whole class. After all the data and graphs have been created, the entire class will discuss their results together for the final presentation. Photographers: Two pupils to document all the steps of the activity with a camera. Setup team: Two pupils to setup the sensor in the classroom and ensure that it functions and records data correctly during the entire activity. Recorders: Three pupils to download the data from the sensor into the computer and produce the graphs for the class. Reporters: Two pupils to summarise the whole activity and prepare a presentation. Monitors: Two pupils to record everything that happens inside the classroom: When did the first person enter the classroom in the morning? How many people are there in the classroom? When were the doors and/or windows opened? How long were they open for? When did the whole class enter the classroom? When did it leave it? When did the last person leave the room? What were the weather conditions like outside (sunny, cloudy, rainy, snowing, etc.)? It would also be interesting to note in which subject (Maths, History, etc.) the pupils produce the most CO Installing the CO 2 sensor a) Place the CO 2 sensor at the back of the classroom with the help of the teacher. If possible, put it in an elevated place so the pupils are not distracted during normal class hours. b) Fasten the CO 2 sensor to the stand with the clamp and, if necessary, secure this with adhesive tape. Be sure that the there is free air circulation around the CO 2 sensor. c) If a thermometer and a hygrometer are available, measurement of the room temperature and humidity can also be included. d) If you use extension cables, make sure that they are well fixed so that no one will trip over them. e) The setup team should check regularly if the CO 2 sensor is recording and storing data correctly. Figure 1: The CO 2 sensor is mounted on a stand and held with a clamp on a cupboard at the back of the classroom. This way the pupils are not distracted. Ensure free air circulation around the sensor. 44
45 teacher 4. Baseline measurements a) The recorders register the daily fluctuations of CO 2 inside the classroom and produce a baseline (Figure 2). b) The monitors write down the length of time the students were inside the classroom or when the windows or doors were opened. They can also correlate the CO 2 concentration to the number of people inside the classroom or try to find out if more CO 2 is produced during normal lessons or when tests are written. To have more fun, the pupils can also try to influence the CO 2 level by intensive breathing, or jumping and jogging on the spot. c) The photographers should take pictures showing the classroom and the activity of the pupils. The reporters could use the photos later in their presentation. Figure 2: Monday Tuesday Wednesday CO2 concentration (ppm) :46 11:26 13:06 14:36 16:26 18:06 19:46 21:26 23:06 00:46 02:26 04:06 05:46 07:26 09:06 11:34 13:14 14:54 16:34 18:14 19:54 21:34 23:14 00:54 02:34 04:14 05:54 07:34 09:14 10:53 12:33 14:13 15:53 17:33 19:13 20:53 22:33 time The baseline shows regular fluctuations of the CO 2 concentration in the classroom under normal conditions. As soon as a pupil enters the room in the morning, the CO 2 concentration starts to rise. It is interesting to observe the fluctuations due to the class changing rooms for the different subjects. In the afternoon, when classes are over, the CO 2 concentration starts to decline. 45
46 experiment 8 5a. How do plants affect the CO 2 concentrations inside the classroom? Ask the pupils to each bring a potted plant to school. Place the plants on the windowsill and measure the changes in the CO 2 concentrations. Record the changes over one week and then the students can compare the CO 2 levels with the baseline measurements (Figure 3) Monday Tuesday Wednesday CO2 concentration (ppm) :46 12:26 15:06 17:46 20:26 23:06 01:46 04:26 07:06 10:34 13:14 15:54 18:34 21:14 time 23:54 02:34 05:14 07:54 10:33 13:13 15:53 18:33 21:13 23:53 without plants :44 12:24 15:04 17:44 20:24 23:04 01:44 04:24 07:04 09:44 12:24 15:04 17:44 20:24 23:04 01:44 04:24 07:04 09:44 12:24 15:03 17:43 20:23 23:03 with plants Figure 3: Comparison of the CO 2 concentration in the classroom with and without plants. The CO 2 concentration decreases to lower levels in the presence of plants. 46
47 teacher 5b. How do we simulate the burning of fossil fuels in the classroom? Let the pupils light candles and extinguish them after 15 minutes. This should be done with supervision of a teacher to avoid the children playing with the fire. To combine this with the first experiment (5a), they can light candles with plants and without plants in the classroom (Figure 4 and 5). CO2 concentration (ppm) without plants, without candles 07:08 07:23 07:38 07:53 08:08 08:23 08:38 08:53 09:08 09:23 09:38 09:53 10:08 10:23 10:38 10:53 11:08 with plants, without candles a c time without plants, with candles 07:03 07:23 07:43 08:03 08:23 08:43 09:03 09:23 09:43 10:03 10:23 10:43 11:03 with plants, with candles b candles blown out d candles blown out 07:07 07:27 07:47 08:07 08:27 08:47 09:07 09:27 09:47 10:07 10:27 10:47 11:07 07:03 07:23 07:43 08:03 08:23 08:43 09:03 09:23 09:43 10:03 10:23 10:43 11:03 Figure 4: Results of different experiments. The profiles show CO 2 concentrations inside the classroom on the same day of the week so that the classroom activities are the same during each experiment. (a) baseline without plants and candles: up to 3000 ppm CO 2 (ppm: parts per million). (b) without plants, with candles: increase of CO 2 up to 5000 ppm. (c) with plants, without candles: increase of CO 2 up to 3000 ppm, but decrease to less than 1000 ppm after class which is lower than the baseline. (d) with plants, with candles: increase of CO 2 up to 5000 ppm but faster decrease after the candles were blown out. 47
48 experiment 8 Figure 5: The effect of plants in the classroom candles burning break CO2 concentration (ppm) : :03 08:13 08:23 08:33 08:43 08:53 09:03 09:13 09:23 09:33 09:43 09:53 10:03 10:13 10:23 10:33 08:13 10:43 08:23 08:33 08:43 09:03 09:13 09:23 09:33 09:43 09:53 10:03 10:13 10:23 10:33 10:43 10:53 without plants with plants The effect of the presence of plants in the classroom: When candles are lit, the CO 2 concentration rises up to 5000 ppm with or without plants. After the candles have been extinguished, the CO 2 level decreases quickly if plants are in the room. 48
49 teacher 5c. How do increased CO 2 concentrations affect the ocean? Set up an aquarium at the back of the classroom. Fill the aquarium with distilled water (or seawater). Aerate the aquarium with a pump to ensure that the water is aerated with the surrounding air. Place the probe of a ph-meter in the water and measure the ph continuously (Figure 6). Correlate the ph values of the water with the CO 2 concentrations in the air (Figure 7). experimental setup Figure 6: ph probe ph meter airstone aquarium pump CO 2 CO2 concentration inside the classroom :53 10:43 10:34 11:24 11:44 10:23 11:33 11:53 13:13 09:23 10:23 12:13 5,55 5,5 5,45 5,4 5,35 5,3 5,25 5,2 5,85 5,8 5,75 5,7 5,65 6 5,95 5,9 5,85 5,8 5,75 5,7 5,65 5,6 ph of the water inside the aquarium ph time Figure 7: Effect of CO 2 on the ph of water. When the CO 2 concentration in the air rises, the ph of the water sinks i.e. it becomes more acidic. 49
50 The Other CO 2 Problem Worksheets for Students


51
52 experiment 1 The gas exchange between ocean and atmosphere The oceans exchange gases such as oxygen and carbon dioxide (CO 2 ) with the atmosphere. This occurs at the boundary layer where the air and water surface meet. In addition to temperature, the corresponding CO 2 pressure and chemical reactions between previously dissolved carbon dioxide and other dissolved material in the water determine how much CO 2 the ocean can absorb. Various other biological and physical processes determine if CO 2 is released or taken up. This experiment illustrates the exchange of gases between water and the atmosphere and how the concentration of gases in these media is always in balance. The effect of temperature on this process will also be observed. At the end of the experiment, you will use your observations to explain where the oceans release CO 2 and where the oceans absorb CO 2. you will need 3 bottles or flasks of the same size (any material or size will do) 3 beakers or drinking glasses large enough for the bottles to fit in 1 drinking straw 1 small pipette universal indicator (McCrumb) water: distilled water, tap water or seawater are suitable hot water ice cubes procedure 1. Fill the bottles half-full with water. Use either distilled water, tap water or seawater for all three bottles. Put several drops of indicator solution into the bottles using the pipette until the water in the bottles has reached the same shade of green. Make sure you add the same amount of indicator in all bottles. The amount of indicator required depends on what water is used and its volume. Figure 1: The bottles with distilled water and McCrumb indicator. 52
53 students 2. The air you exhale contains carbon dioxide. Use the drinking straw, blow air into the bottles until the colour changes from green to yellow. This means that the ph of the water has changed from basic to acidic. Keep blowing air through the straw until there is no further colour change. Figure 2: CO 2 was added by blowing air into the bottles. The yellow colour indicates that the water became more acidic. 3. Fill one beaker half-full with water at room temperature. Fill the second beaker half-full with hot water and the last beaker with ice water. Figure 3: The bottles sit uncapped in water baths of different temperatures. 4. Put one uncapped bottle in each beaker and observe the change in colour of the water inside the bottles. Depending on the temperature of your water bath, this may take about an hour until the change becomes visible. results 1. Did the colour of the water in the bottles change? 2. What does the colour change in the bottles mean? further experiments 1. Compare the differences in your results when distilled water, tap water or seawater is used for the experiment. 2. To investigate how the size of the surface area where water and air interact influences the degassing process, bottles or containers with different diameters can be used. Add the same amount of water to every container. Observe how fast the colour changes and try to explain your observations. 53
54 experiment 2 Acidification in the boundary layer between ocean and atmosphere In lakes, rivers or the ocean, there is a constant exchange of gases between the air and the surface waters. Depending on the temperature and the amount of carbon dioxide (CO 2 ) already dissolved, the water either absorbs CO 2 from the atmosphere or releases it to the atmosphere. Captured carbon dioxide can be transported into deeper layers in the ocean when the surface waters are cooled, become heavier and then sink we then talk about the ocean as a carbon sink. If this does not occur, the dissolved gas remains at the surface and equilibration takes place with the atmosphere. This experiment illustrates the gas exchange at the interface between water and air. It also shows how temperature affects the process. Observations made during the experiment can thus illustrate the processes which occur at the interface between ocean and atmosphere. you will need 6 salad bowls of the same diameter distilled water at room temperature frozen distilled water (ice cubes) 12 floating candles or tealight candles, preferably white matches white background (paper, napkin, kitchen towel) universal indicator (McCrumb) pipette To save on materials, you can do the experiments one after the other. In this case, you only need two salad bowls of the same size and four candles. It is essential to use water which has equilibrated with the surrounding air. Place the water in an open container and leave it to stand overnight in the room, better still outdoors. To speed up the process, the water can be aerated using an aquarium pump. procedure 1. Place three bowls on top of the white paper. Fill these with the same volume of distilled water. These bowls represent three oceans. Cool one bowl by adding the frozen distilled water (ice cubes). It is important that all three bowls are filled to the same level, about two-thirds. Add the same amount of indicator to each bowl. Make sure that they have the same intensity of green colour. Figure 1: Bowl of water with green indicator. 54
55 student 2. Light eight candles and place four in the bowl with frozen distilled water and four in another bowl. Put the four unlit candles in the third bowl. This will serve as your control. Cover the bowls with the remaining empty bowls. Take note of the colour of the water at the start of the experiment. Figure 2: Four burning candles float in the bowl with green indicator. 3. Watch how candles burn out and how the colour of the water in the bowls changes. This will take a few minutes. Look closely at the boundary between air and water. Can you explain why the candles burn out? What gas do the candles release when they burn? Figure 3 and 4: The bowl with the burning candles is covered with a second bowl. After several minutes, the candles burn out. results 1. What colour change did you observe? What does this indicate? 2. Where does the colour change take place? Did all the water in the bowl change its colour? What does this imply in relation to the oceans? 3. In which bowl was the colour change most visible? What is the reason for this? a further experiment Remove the covering bowl and let the setup stand for a while. Observe the colour change at the surface of the water and try to explain what has happened. 55
56 experiment 3 Acidification of the oceans - The increase in carbon dioxide partial pressure in the atmosphere Rising carbon dioxide concentrations in the air also mean an increasing partial pressure of carbon dioxide (CO 2 ) in the atmosphere i.e. an increasing proportion of this gas within the gas mixture in the atmosphere. In order to restore the balance of the CO 2 partial pressure between the atmosphere and the ocean, the CO 2 diffuses to where the partial pressure is lower: This means diffusion of CO 2 from the atmosphere into the ocean. In this simple experiment we see the impact of the steady increase in CO 2 partial pressure in the air on the ocean. you will need 2 large test tubes 2 rubber stoppers with 2 holes for the test tubes 2 glass tubes which fit into the holes of the rubber stoppers 2 thermometers a small amount of modelling clay 1 rubber tube test tube rack universal indicator (McCrumb) tap water or seawater and distilled water at room temperature effervescent vitamin tablets, split into quarters procedure 1. Insert one glass tube and a thermometer into the holes of each rubber stopper. Connect the two glass tubes in each plug with the rubber tubing. 2. Close the test tubes with the rubber stoppers. Make your setup airtight using modelling clay to plug the air space on the holes of the stopper where you inserted the thermometers and the glass tubes. Note down the temperature of the air inside the test tubes as soon as it has stabilised. 3. Fill one test tube half-full with distilled water and add some drops of indicator until the water attains a dark shade of green. Replace the stopper making sure that the thermometer does not touch the water. Place the test tube in the rack. This is test tube A. 4. Put one quarter of an effervescent tablet in the other test tube and add a generous amount of tap water to cover the tablet. Close the test tube immediately with the rubber stopper. Place the test tube in the stand next to the first one. This is test tube B. 5. Note down the temperature of the air inside the two test tubes. 6. Look at the colour of the water with the indicator in test tube A. Do you already notice a change? 56
57 student 7. Put another quarter of the effervescent tablet into test tube B and close it immediately. Wait about 3 to 5 minutes and note the colour of the water in test tube A again. Do you observe a change now? Keep adding a quarter of an effervescent tablet until the colour changes, waiting for at least 5 minutes after each addition. Write down the temperature each time you add another quarter. 8. Repeat the experiment with seawater or tap water. experimental setup rubber tube thermometer glass tube water with indicator A B quarter of an effervescent tablet addition of effervescent tablets distilled water tap water temp ( C) observation 0 1/4 1/2 3/ /4 colour /ph temp ( C) colour /ph temp ( C) colour /ph temp ( C) colour /ph temp ( C) colour /ph temp ( C) colour /ph seawater results 1. Describe any changes in colour of the water in test tube A after the first quarter of an effervescent tablet was dissolved in test tube B. What happened after adding another quarter? And another? What does the visible change mean? 2. What happened to the temperature in the test tubes after the effervescent tablets were added? What does this temperature rise indicate? 3. At what temperature does the colour change at the surface of the distilled water become visible? How does this compare to when tap water or seawater is used? What is the reason for the differences? 57
58 experiment 4 How does temperature affect the solubility of CO 2 in water? If the proportion of carbon dioxide (CO 2 ) increases within the atmosphere, the resulting greenhouse effect leads to an increase in temperature of the air and the ocean. Do these increasing water temperatures have a positive or negative effect on the water s ability to absorb CO 2? Will this effect be observed globally or regionally? This simple experiment illustrates how much gas can be dissolved in cold and in warm water. What does this mean for the oceans in the polar regions and in the tropics and subtropics? materials big transparent bowl or an aquarium 250 ml transparent graduated cylinder funnel petri dish covers stand and clamp (optional) ice cubes / cold water water heater / warm water effervescent vitamin tablets It is easier to compare the experiment with warm and cold water if you run both experiments simultaneously. Colour the water with food colouring (e.g. blue and red) to distinguish the warm and cold experiments and see the results more effectively. procedure 1. Fill the bowl half-full with cold or warm water. 2. Fill the graduated cylinder to the brim with water from the bowl and place it carefully upside down in the bowl. Be sure that no water spills out of the cylinder so that no air bubbles are formed. To do this, cover the opening of the full cylinder with a petri dish, invert the cylinder and immerse this in the bowl. Remove the petri dish after the mouth of the cylinder is already underwater. 3. Tilt the graduated cylinder and place the funnel in the opening of the cylinder taking care that there is minimal space between the funnel and the opening of the cylinder and hold it in place. Eventually, the cylinder should sit safely on the funnel without being held. Figure 1: Place the funnel carefully underneath the cylinder. 58
59 student 4. Place an effervescent tablet carefully but quickly under the funnel. It will dissolve immediately in the water. Notice how an air pocket develops at the top of the upside down cylinder. Record the volume of the air space formed in the table below. Repeat the trial several times. For each trial discard the used water and replace this with the same volume of fresh water. 5. Compare the results you get when using warm and cold water and record your results in the table. What happens with the air space when warm water is used? Figure 2: Holding the cylinders to keep them in place. formation of an air space inside the graduated cylinder number of effervescent tablets volume of air space formed (ml) trial number cold water warm water 1 2 results 1. Which produces a larger volume of air space inside the graduated cylinder: cold water or warm water? 2. What will be the consequence of a warming ocean? How will this affect the role of the oceans as a CO 2 sink? 3. In which areas of the world will you expect more CO 2 uptake into the ocean? Where will it be less? further experiments 1. Try the experiment with different salinities. 2. Try adding two tablets, one after the other to the same funnel. Use the same water temperature. 3. Run this experiment with normal water and with water acidified with vinegar to find out how the ph influences the amount of CO 2 that can be taken up by the water. 59
60 experiment 5 The effects of increased CO 2 concentration in the air on seawater and distilled water More than 70 per cent of the earth s surface is covered with water - we truly live on a blue planet! Only about three per cent of it is fresh water, whereas the remaining 67 per cent consist of more or less salty seawater. How do rising carbon dioxide concentrations in the atmosphere affect the ph of seawater and bodies of freshwater, such as lakes and rivers? This experiment shows that salinity has an impact on how oceans and lakes respond to carbon dioxide (CO 2 ), which reaches the water from the air. It is clear that seawater can withstand acidification longer than fresh water. you will need large transparent basin or a large aquarium 2 beakers (500 ml) 2 ph meters aquarium pump plastic tubing and 2 airstones with regulator valves seawater*, distilled water* 5 tealight candles matches stopwatch * Leave the water to stand overnight in an open container to allow it to equilibrate with the surrounding air. Aerating the water with the aquarium pump is also advisable. experimental setup regulator valve ph electrode large empty aquarium aquarium pump airstone D S 7,00 8,00 ph meter ph meter D = distilled water S = seawater candles 60
61 student procedure 1. Fill one beaker half-full with seawater and the other half full with distilled water. Aerate the water in the beakers with the airstones connected to the aquarium pump. Regulate the aeration with the valves so that both beakers are bubbled with air to the same degree. Figure 1: The same amount of bubbling in the two beakers. 2. Place one ph electrode in each beaker and connect these to the ph meters. Make an initial reading and record this in the table. Figure 2: The initial ph is recorded. 3. Light the candles and place them next to the beakers. Place the entire setup under the inverted aquarium. The aquarium pump should also be inside the aquarium. If the aquarium is not big enough, the ph meters can be placed outside. Figure 3: The burning candles are placed next to the beakers. 4. Record the ph of the water in the beakers for 10 minutes at 1-minute intervals. Note down the time when all the candles are extinguished. 5. Make a graph of the results you recorded in the table. Figure 4: The ph is recorded every minute. 61
 Figure 5: Pencil urchin.")
62 experiment 5 table 1: results Change of ph of distilled water and seawater ph of the water in the beakers time (min) ph seawater distilled water Change of ph over time ph 8,00 7,50 7,00 6,50 6,00 5,50 5,00 4,50 4, time (min) Figure 5: Pencil urchin. Will marine animals building their shells from calcium carbonate be able to resist the change of ph in seawater? 62

63 student results 1. In which beaker was there a larger change in ph? Did the water become more basic or acidic? 2. Many aquatic organisms cannot tolerate big ph changes in their environment. What do you think will be the effect of a high CO 2 environment to organisms in a lake and in the ocean? 3. Why should the water in the beakers be aerated? Why should the pump also be placed inside the inverted aquarium? 4. What do the burning candles do to the air inside the aquarium? Where does the oxygen go? What gas do the burning candles produce? further experiments 1. If time allows, continue to record the ph until no further changes can be measured. Take note of how long this takes and what the final ph of the water in the two beakers is. 2. Collect water from different lakes and try to compare the buffering capacity of each lake. See if you can find hard water and soft water lakes. 3. Compare the buffering capacity of water with different salinities by dissolving different amounts of sea salt in water. Figure 6: Scientists investigate how cold-water corals react to ocean acidification and warming in laboratory experiments. 63
64 experiment 6 ph regulation in seawater: The role of carbonate (CO 3 2- ) and bicarbonate (HCO 3 - ) Dissolved inorganic carbon (DIC) represents the largest carbon pool in the ocean. This reservoir includes the dissolved carbon dioxide (CO 2 ) and bicarbonate (HCO 3 - ) and carbonate ions (CO 3 2- ). The ph of seawater depends on the relative proportions of these components. The ph of our oceans is currently in the basic range, 7.8 to 8.5, where HCO 3 - ions dominate. If the ph increases, the concentration of carbonate ions also increases. If more CO 2 dissolves in seawater, it turns more acidic and the ph drops. This is because when carbon dioxide dissolves in water, the chemical reaction forms carbonic acid (H 2 CO 3 ). This is relatively unstable and dissociates immediately into bicarbonate and hydrogen ions. Some of the hydrogen ions produced during decomposition of carbonic acid react with further with carbonate to form additional bicarbonate ions. The concentration of carbonate ions decreases accordingly. These ions are responsible for the buffering function of seawater: Seawater can resist significant fluctuations in ph, even after addition of weak acids or bases. The carbonate ions can react with the large quantities of calcium ions present in seawater. This reaction generates calcium carbonate (limestone, CaCO 3 ), the material which mussel shells, coral skeletons and shells of some microalgae are made of. This experiment illustrates how bicarbonate and carbonate regulate the ph of seawater, and clearly demonstrates its ability to buffer changes in ph. you will need 3 to 6 bottles of the same size with lids distilled water seawater 6 drinking straws sodium carbonate (Na 2 CO 3 ) sodium bicarbonate (baking soda (NaHCO 3 ) universal indicator (McCrumb) with colour chart pipette eggshells (optional) 64

65 student procedure 1. Fill three bottles with equal amounts of seawater and the other three with the same amount of distilled water. Add a small pinch of sodium carbonate to one of the bottles containing seawater and to one containing distilled water. Do the same for the sodium bicarbonate. 2. Compare the colours of the water inside the bottles. Do you see any differences? 3. Add 20 drops of the McCrumb indicator solution to each bottle. Determine the ph of the water in each bottle using the colour chart. Can you see any differences now? 4. Insert drinking straws through the openings of the bottles making sure that they are immersed in the water. Figure 1: The bottles after the indicator is added. 5. Blow air through the drinking straw to introduce CO 2 into the bottles. Try to blow uniformly for 20 seconds into each bottle. Replace the lids of the bottles and determine the ph. Record the ph in the table below. 6. Repeat step 5 but instead blow for 40 seconds and 60 seconds into the bottles. Do you notice any differences? 65
66 experiment 6 table 1: results water samples estimated ph (see colour chart) initial colour after addition of indicator after blowing for 20 seconds after blowing for 40 seconds after blowing for 60 seconds seawater seawater with NaHCO 3 seawater with Na 2 CO 3 distilled water distilled water with NaHCO 3 distilled water with Na 2 CO 3 results 1. Do you notice any differences in the appearance of the water in the different bottles before the addition of the indicator solution? 2. Compare the ph of the water in the different bottles. How did the addition of sodium carbonate and sodium bicarbonate to seawater and distilled water prior to bubbling with CO 2 affect the ph? 3. What happens to the ph of the water in the bottles after blowing in CO 2 into them? Does addition of sodium carbonate and sodium bicarbonate to seawater and to distilled water make any difference with regard to ph changes? 4. Eggshells are made of CaCO 3. Add powdered eggshells to the acidic seawater and to the acidic distilled water. Do you notice any changes in the ph? Why? What is the difference between the carbonate in the powdered eggshell and in Na 2 CO 3? 5. Can you now make a conclusion about the roles of HCO 3 - and carbonate in the buffering capacity of seawater? 66
) -1,5-2 -2,5-3 -3,5-4 -4,5 CO 2 H+ OH- Surface ocean ph HCO - 3 CO 2-3 -5 0 2 4 6 8 10 12 14 ph further experiments 1.")
67 student Figure 2: If the amount of dissolved CO 2 is high, the ph is low. At higher ph, bicarbonate and carbonate are instead the dominant species. Log (concentration (mol kg-1)) -1,5-2 -2,5-3 -3,5-4 -4,5 CO 2 H+ OH- Surface ocean ph HCO - 3 CO ph further experiments 1. Determine how ph of distilled water changes with increasing concentrations of NaHCO 3. Weigh different amounts of Na 2 CO 3 and add this to different distilled water samples. Then blow CO 2 into the samples as described above. What happens to the ph? 2. Design your own experiments with the water samples. What happens to the ph of a water sample with NaHCO 3 if you add Na 2 CO 3? Or if you do it the other way round? Figure 3: Marine scientists also record the ph of the oceans using probes attached to a rosette water sampler. 67
68 experiment 7 Carbon dioxide fertilization of marine microalgae cultures (Dunaliella sp.) Tiny single-celled plants that live in seawater, called marine microalgae, need carbon dioxide (CO 2 ) in order to grow. Like plants on land, they help to remove CO 2 from the air, and thus contribute to the function of the ocean as a carbon sink. This experiment illustrates the importance of CO 2 for the growth of the microalgae Dunaliella sp. in seawater. you will need Erlenmeyer culture flasks (200 ml) rubber stoppers with one hole fitting into the mouths of the flasks (or cotton balls wrapped into transparent films) pipettes filter paper glass fibre filter (GF/F) drinking straws culture water: pond or lake water, seawater (salinity: 35), brackish water (salinity: 15) nutrients for algae culture: nitrate (NO 3 ), phosphate (PO 4 ), silicate (Si(OH) 4 ), vitamin mix, metal mix (If nutrients are not available, a plant fertilizer with high nitrate and phosphate contents will also do. Use 5 10 millilitres per litre of culture water.) Stock culture of freshwater or marine microalgae, e.g. Dunaliella sp. (If no stock culture is available, natural populations will do. Use a plankton net to gather phytoplankton from a lake, pond or from the sea. It may take a little more time until results can be seen with natural populations. Natural Dunaliella sp. does not require silicate.) procedure 1. Filter the culture water first with the paper filters and then with the GF/F filters. Filter sterilization is optional, although this minimises bacterial and foreign algal contamination. 2. Prepare common culture water for all the treatments by adding the nutrients to the filtered water. Here, one millilitre of each solution from nitrate, phosphate, silicate and metal mix plus 500 microlitres of the vitamin mix is used for 1 litre filtered culture water. 3. Add about 5 millilitres of the stock algal culture, for example Dunaliella sp. to the prepared culture medium. The exact amount depends on the density of the algal culture. The more of a stock culture you add, the faster the new culture will grow. If you run this experiment in winter, it is better to use a bit more than in summer when higher temperatures and light promote growth. 4. Rinse and then fill the culture flasks with the prepared algal culture up to the 150 millilitre mark. Then you can decide what treatments you would like to make. 68
 - flask covered with a cotton wad Figure 1:")

69 student three treatments for the algal culture Treatment 1 (T1): Treatment 2 (T2): Treatment 3 (T3): CO 2 limited - flask covered tightly CO 2 fertilised - flask covered with a cotton wad made airtight by wrapping it in transparent film with a straw inserted in the middle for CO 2 introduction by blowing control (no CO 2 fertilisation) - flask covered with a cotton wad Figure 1: Experimental setup 5. Make three replicates of each treatment. Place the flasks in a bright place but not in direct sunlight. Treatments 1 and 3 should be gently shaken at least twice daily. For treatment 2, air should be blown into the culture for seconds twice a day. results Observe the algae cultures over two weeks. How do the colours in the flasks change? What do the changes tell you about the growth of the algae under the different treatments? Figure 2: The microalgae Dunaliella sp. seen through a microscope. Every single cell has a diameter of 10 micrometres (μm). This is a tenth of the thickness of a human hair. 69
 and how CO 2 concentrations change as a result of different activities in the")
70 experiment 8 How much carbon dioxide is in the classroom? How much carbon dioxide (CO 2 ) is contained in the air of a classroom? What factors lead to more CO 2 production, and to its removal? In this experiment, you will document how CO 2 concentration develops during a given time period (here: within a week) and how CO 2 concentrations change as a result of different activities in the classroom (in this case within two weeks). you will need handheld CO 2 sensor with data logger (example: TSI IAQ-Calc 7535) stand and clamp computer extension cables adhesive tape digital photo camera candles matches plants aquarium tap water or seawater ph meter aquarium pump, plastic tube, airstones 1. Introduction Practise using the hand-held CO 2 sensor by measuring the carbon dioxide concentrations in different parts of the school grounds. What is the CO 2 concentration in the schoolyard, in the parking lot, inside a small closed room with different numbers of people inside, on the school roof and other places? 2. When everybody knows how to use the CO 2 sensor, you can form groups for the following tasks: Analysts: This includes the whole class. After all the data and graphs have been created, the entire class will discuss their results together for the final presentation. Photographers: Two pupils to document all the steps of the activity with a camera. Setup team: Two pupils to setup the sensor in the classroom and make sure that it functions and records data correctly during the entire activity. Recorders: Three pupils to download the data from the sensor into the computer and produce the graphs for the class. Reporters: Two pupils to summarise the whole activity and prepare a presentation. Monitors: Two pupils to record everything that happens inside the classroom. Figure 1: In order to practice the handling of the CO2 analyser you can measure the air at various locations around the school and inside the building. 70
71 student 3. The setup team places the CO 2 sensor at the back of the classroom with the help of the teacher. If possible, put it in an elevated place. Fasten the CO 2 sensor onto the stand with the clamp and, if necessary, secure this with adhesive tape. Check once a day, if the CO 2 sensor is recording and storing data correctly. 4. The recorders note down the data from the sensor and produce the graphs for the class. 5. The graph becomes more interesting if you mark when your classmates were inside the classroom or when windows and doors were open. Therefore, the monitors record the following information together with the precise date and time: When did the first person enter the classroom in the morning? How many people are there in the classroom? When were the doors and/or windows opened? How long were they open for? When did the whole class enter the classroom? When did it leave it? When did the last person leave the room? What were the weather conditions like outside (sunny, cloudy, rainy, snowing, etc.)? What lesson were you in (maths, history, etc.)? 6. Find out if the CO 2 level rises when you jump or jog on the spot for a few minutes. 7. The photographers will take pictures to document all the activities done during the experiment. They should also take pictures of the classroom. These will all be used for the final presentation. 8. After you have analysed you everyday school life in this way, you can modify your classroom. For example: (a) Each pupil brings a potted plant. Place the plants on the windowsill and measure the changes in the CO 2 concentrations again over one week. Take a good look at the data measured during the night. What effect do the plants have? (b) Each pupil lights a candle and extinguishes it after 15 minutes. Then measure the CO 2. What effect do the candles have? (c) Combine plants and candles. What data can be measured now? (d) Set up an aquarium at the back of the classroom. Fill the aquarium with distilled water or seawater. Aerate the aquarium with a pump to ensure that the water is aerated with the surrounding air. Place the probe of a ph-meter in the water and measure the ph continuously. How do your activities influence the ph of the water? Can you correlate the ph values of the water with the CO 2 concentrations in the air? Figure 2: experimental setup ph probe ph meter airstone aquarium pump 71
72 publisher project partner Alfred-Wegener-Institut für Polar- und Meeresforschung, Bremerhaven Carl von Ossietzky Universität Oldenburg Christian-Albrechts-Universität zu Kiel ICBM / ICBM-Terramare, Oldenburg und Wilhelmshaven Helmholtz-Zentrum für Ozeanforschung Kiel (GEOMAR) Heinrich-Heine-Universität, Düsseldorf Jacobs-University, Bremen Leibniz-Institut für Gewässerökologie und Binnenfischerei, Berlin Leibniz-Institut für Ostseeforschung Warnemünde Ludwig-Maximilians-Universität München Max-Planck-Institut für Marine Mikrobiologie, Bremen PreSens Precision Sensing GmbH, Regensburg Ruhr-Universität Bochum Universität Bremen Universität Hamburg Universität Rostock Westfälische Wilhelms-Universität Münster Zentrum für Marine Tropenökologie (ZMT), Bremen project coordination Prof. Dr. Ulf Riebesell Helmholtz Centre for Ocean Research Kiel (GEOMAR) Wischhofstr. 1-3 D Kiel Telefon: Telefax: [email protected] Website: BIOACID 72 Since September 2009, more than one hundred marine biologists, chemists, physicists as well as molecular biologists, palaeontologists, physicians, mathematicians and engineers from 14 German institutes, have been jointly investigating the consequences of ocean acidification on marine organisms under the umbrella of BIOACID. The seven capital letters stand for Biological Impacts of Ocean Acidification. Furthermore, the project title combines the term BIO, for all living creatures in the sea, with ACID, as the culprit in this matter. The project, during the first phase until mid-2012, received support from the Federal Ministry for Education and Research (BMBF) to the sum of 8.5 million Euros. In 2009, BIOACID was the first national joint research project on ocean acidification. Meanwhile, a network has been established with the European Project on Ocean Acidification (EPOCA) and other international research ventures. These experiments were developed as part of CarboSchools with support from the Seventh Framework Programme of the European Union.


73 73
74 imprint about published by BIOACID / GEOMAR Helmholtz Centre for Ocean Research Kiel September 2012 experiments: Dr. Sally Soria-Dengg, CarboSchools, GEOMAR (experiment 3 in cooperation with Dr. Sven Hille, IOW and Kristina Neumann, Rostock University) introduction: Maike Nicolai, GEOMAR photos: Maike Nicolai, except: S.2: Stephanie Pohl/Sabrina Warnk/Alena Gall, S. 4/5: S. 4/5: Prof. Dr. Ulf Riebesell, S.21: Mario Müller, S. 38, S. 69: Annegret Stuhr, S. 62: Jan Schröder, S. 63: Dr. Armin Form, S. 67: Martina Nielsen (all GEOMAR) layout: Katharina Marg, formkombinat further links BIOACID: CarboSchools: EPOCA: UKOA: MedSeA: 74
75 75

76
ph Regulation of Seawater: The Role of Carbonate (CO3) and Bicarbonate (HCO3)
 and Bicarbonate (HCO3)") http://www.carboschools.org ph Regulation of Seawater: The Role of Carbonate (CO3) and Bicarbonate (HCO3) Introduction: The major carbon reservoir in the ocean is in the dissolved inorganic carbon (DIC),
http://www.carboschools.org ph Regulation of Seawater: The Role of Carbonate (CO3) and Bicarbonate (HCO3) Introduction: The major carbon reservoir in the ocean is in the dissolved inorganic carbon (DIC),
Comparison of the Effects of Increased CO 2 in the Air to Seawater and Distilled Water
 http://www.carboschools.org Comparison of the Effects of Increased CO 2 in the Air to Seawater and Distilled Water The majority of the earth s surface is covered with water (70%) and only 3% of this is
The Solubility of Calcium Carbonate
 1 The Solubility of Calcium Carbonate Lesson Plan Developed by: John Thurmond, Plainfield North High School, Plainfield, Illinois Based on Presentation June, 2011. Northwestern University, Climate Change
Global warming and climate change an experimental approach
 Bernd Blume, [email protected] Klaus Morgenstern, [email protected] Global warming and climate change an experimental approach In the following twelve experiments, students carry out individual work in
Can Gases Act Like a Greenhouse?
 Can Gases Act Like a Greenhouse? Activity 1 Following a discussion that enables student to express what they already know about the greenhouse effect, students conduct a controlled experiment to confirm
SOLUBILITY OF A SALT IN WATER AT VARIOUS TEMPERATURES LAB
 SOLUBILITY OF A SALT IN WATER AT VARIOUS TEMPERATURES LAB Purpose: Most ionic compounds are considered by chemists to be salts and many of these are water soluble. In this lab, you will determine the solubility,
ph Measurements of Common Substances
 Chem 100 Section Experiment 10 Name Partner s Name Introduction ph Measurements of Common Substances The concentration of an acid or base is frequently expressed as ph. Historically, ph stands for the
SECOND GRADE 1 WEEK LESSON PLANS AND ACTIVITIES
 SECOND GRADE 1 WEEK LESSON PLANS AND ACTIVITIES WATER CYCLE OVERVIEW OF SECOND GRADE WATER WEEK 1. PRE: Exploring the properties of water. LAB: Experimenting with different soap mixtures. POST: Analyzing
Chapter 3: Water and Life
 Name Period Chapter 3: Water and Life Concept 3.1 Polar covalent bonds in water result in hydrogen bonding 1. Study the water molecules at the right. On the central molecule, label oxygen (O) and hydrogen
Solids, Liquids, and Gases
 Solids, Liquids, and Gases nd Intended for Grade: 2 Grade Subject: Science Description: Activities to help students understand solids, liquids, gases, and the changes between these states. Objective: The
Lesson 5: Water Conductivity and Total Dissolved Solids Water Quality Sampling
 Lesson 5: Water Conductivity and Total Dissolved Solids Water Quality Sampling Time Frame: Two 45-50 minute class periods Grade Level: 8 th 12 th Grade Overview: There are a wide variety of inorganic substances
Properties of Acids and Bases
 Lab 22 Properties of Acids and Bases TN Standard 4.2: The student will investigate the characteristics of acids and bases. Have you ever brushed your teeth and then drank a glass of orange juice? What
Teacher Demo: Photosynthesis and Respiration: Complementary Processes
 SNC1D/1P Sustainable Ecosystems/ Sustainable Ecosystems and Human Activity Teacher Demo: Photosynthesis and Respiration: Complementary Processes Topics photosynthesis and respiration gas tests for oxygen
Multiple Choice For questions 1-10, circle only one answer.
 Test Bank - Chapter 1 The questions in the test bank cover the concepts from the lessons in Chapter 1. Select questions from any of the categories that match the content you covered with students. The
Unit 1 - Pure Substances and Mixtures Chapter 2: Solutions
 2.1 Solutes & Solvents Vocabulary: Unit 1 - Pure Substances and Mixtures Chapter 2: Solutions solvent the larger part of a solution - the part of a solution into which the solutes dissolve solute the smaller
ES 106 Laboratory # 3 INTRODUCTION TO OCEANOGRAPHY. Introduction The global ocean covers nearly 75% of Earth s surface and plays a vital role in
 ES 106 Laboratory # 3 INTRODUCTION TO OCEANOGRAPHY 3-1 Introduction The global ocean covers nearly 75% of Earth s surface and plays a vital role in the physical environment of Earth. For these reasons,
CHEMICAL DETERMINATION OF EVERYDAY HOUSEHOLD CHEMICALS
 CHEMICAL DETERMINATION OF EVERYDAY HOUSEHOLD CHEMICALS Purpose: It is important for chemists to be able to determine the composition of unknown chemicals. This can often be done by way of chemical tests.
To measure the solubility of a salt in water over a range of temperatures and to construct a graph representing the salt solubility.
 THE SOLUBILITY OF A SALT IN WATER AT VARIOUS TEMPERATURES 2007, 1995, 1991 by David A. Katz. All rights reserved. Permission for academic use provided the original copyright is included. OBJECTIVE To measure
The Influence of Carbon Dioxide on Algae Growth
 The Influence of Carbon Dioxide on Algae Growth The first objective of this experiment is to show that increased atmospheric concentrations of carbon dioxide, CO 2, can stimulate algae growth. The second
GUZZLER LEARNS ABOUT CHEMICAL ENERGY: DESIGN AND MAKE A LAVA LAMP
 Equipment Vegetable oil, water, 2 measuring jugs one for water and one for oil, clear plastic bottle*, funnel, food colouring and dropper, a tablet that does not fizz when added to water (eg a non-effervescent
Solubility Curve of Sugar in Water
 Solubility Curve of Sugar in Water INTRODUCTION Solutions are homogeneous mixtures of solvents (the larger volume of the mixture) and solutes (the smaller volume of the mixture). For example, a hot chocolate
Oxygen Give and Take. Correlation to National Science Education Standards
 Chemistry and Environmental Sciences Oxygen Give and Take Summary This is a series of three activities followed by a worksheet. The concepts taught include gas production (O 2 and CO 2 ), chemical reactions,
Lab Exercise 3: Media, incubation, and aseptic technique
 Lab Exercise 3: Media, incubation, and aseptic technique Objectives 1. Compare the different types of media. 2. Describe the different formats of media, plate, tube etc. 3. Explain how to sterilize it,
Neutralizing an Acid and a Base
 Balancing Act Teacher Information Objectives In this activity, students neutralize a base with an acid. Students determine the point of neutralization of an acid mixed with a base while they: Recognize
Experiment 16-Acids, Bases and ph
 Definitions acid-an ionic compound that releases or reacts with water to form hydrogen ion (H + ) in aqueous solution. They taste sour and turn litmus red. Acids react with certain metals such as zinc,
sciencemuseumoutreach Kitchen Science 1 Demonstrations to do at home
 sciencemuseumoutreach Kitchen Science 1 Demonstrations to do at home The Creative Canal Project (CCP) is part of the Science Museum s Outreach Department, which works with teachers, students, families
The Properties of Water
 1 Matter & Energy: Properties of Water, ph, Chemical Reactions EVPP 110 Lecture GMU Dr. Largen Fall 2003 2 The Properties of Water 3 Water - Its Properties and Its Role in the Fitness of Environment importance
Mixtures and Pure Substances
 Unit 2 Mixtures and Pure Substances Matter can be classified into two groups: mixtures and pure substances. Mixtures are the most common form of matter and consist of mixtures of pure substances. They
Mixtures. reflect. How is seawater different from pure water? How is it different from rocky soil?
 reflect Everything around us is made out of tiny bits of matter. These particles may combine in different ways to produce new materials. Sometimes we need to separate the parts of a material. If we know
KINDERGARTEN WATER 1 WEEK LESSON PLANS AND ACTIVITIES
 KINDERGARTEN WATER 1 WEEK LESSON PLANS AND ACTIVITIES WATER CYCLE OVERVIEW OF KINDERGARTEN WEEK 1. PRE: Defining the states of matter. LAB: Discovering the properties of water. POST: Analyzing the water
The Water Cycle Now You See It, Now You Don t
 The Water Cycle Now You See It, Now You Don t Unit: Salinity Patterns & the Water Cycle l Grade Level: Elementary l Time Required: Introduction - 30 min. - Activity as groups 45min Wrap Up 20 min l Content
Experiment 3: Extraction: Separation of an Acidic, a Basic and a Neutral Substance
 1 Experiment 3: Extraction: Separation of an Acidic, a Basic and a Neutral Substance Read pp 142-155, 161-162, Chapter 10 and pp 163-173, Chapter 11, in LTOC. View the videos: 4.2 Extraction (Macroscale);
Taking Apart the Pieces
 Lab 4 Taking Apart the Pieces How does starting your morning out right relate to relief from a headache? I t is a lazy Saturday morning and you ve just awakened to your favorite cereal Morning Trails and
ACID-BASE TITRATIONS: DETERMINATION OF CARBONATE BY TITRATION WITH HYDROCHLORIC ACID BACKGROUND
 #3. Acid - Base Titrations 27 EXPERIMENT 3. ACID-BASE TITRATIONS: DETERMINATION OF CARBONATE BY TITRATION WITH HYDROCHLORIC ACID BACKGROUND Carbonate Equilibria In this experiment a solution of hydrochloric
Determining the Quantity of Iron in a Vitamin Tablet. Evaluation copy
 Determining the Quantity of Iron in a Vitamin Tablet Computer 34 As biochemical research becomes more sophisticated, we are learning more about the role of metallic elements in the human body. For example,
Pressure. Curriculum for Excellence. Weather and Climate Cross-curricular project Section 2. Background Information:
 Curriculum for Excellence Weather and Climate Cross-curricular project Section 2 Pressure Background Information: Air pressure is the force exerted by air particles. The air around us pushes on us and
Determination of calcium by Standardized EDTA Solution
 Determination of calcium by Standardized EDTA Solution Introduction The classic method of determining calcium and other suitable cations is titration with a standardized solution of ethylenediaminetetraacetic
Chapter 5 Student Reading
 Chapter 5 Student Reading THE POLARITY OF THE WATER MOLECULE Wonderful water Water is an amazing substance. We drink it, cook and wash with it, swim and play in it, and use it for lots of other purposes.
Test Bank - Chapter 3 Multiple Choice
 Test Bank - Chapter 3 The questions in the test bank cover the concepts from the lessons in Chapter 3. Select questions from any of the categories that match the content you covered with students. The
Experiment 7: Titration of an Antacid
 1 Experiment 7: Titration of an Antacid Objective: In this experiment, you will standardize a solution of base using the analytical technique known as titration. Using this standardized solution, you will
EXAMPLE EXERCISE 4.1 Change of Physical State
 EXAMPLE EXERCISE 4.1 Change of Physical State State the term that applies to each of the following changes of physical state: (a) Snow changes from a solid to a liquid. (b) Gasoline changes from a liquid
CLASS ZERO EMISSION CLIMATE CHANGE EXPERIMENTS
 CLASS ZERO EMISSION CLIMATE CHANGE EXPERIMENTS 2 This Class Zero Emission: Climate Change Experiment booklet has been produced by the International Polar Foundation. Partial of full reproduction of this
Measuring volume of gas produced Measuring precipitation (because sulphur is produced) e.g. look for X to disappear Measure mass lost
 e.g. look for X to disappear Measure mass lost") Introduction My investigation is about the rate of reaction. A rate of reaction is defined as how fast or slow a reaction takes place. For example, the oxidation of iron under the atmosphere is a slow
Introduction My investigation is about the rate of reaction. A rate of reaction is defined as how fast or slow a reaction takes place. For example, the oxidation of iron under the atmosphere is a slow
Lesson Plan: How Do We Clean Polluted Water?
 Lesson Plan: How Do We Clean Polluted Water? Oil Spill Cleanup / Phosphate Cleanup / Groundwater Contamination / Water Treatment Simulation Estimated Time: 2-4 days State Standards taught and addressed
A Teaching Unit for Years 3 6 children
 A Teaching Unit for Years 3 6 children 1 SEREAD and ARGO: Concept Overview for Years 3-6 Teaching Programme This is the overview for the first part of the SEREAD programme link with ARGO. The overview
Chapter 3: Separating Mixtures (pg. 54 81)
") Chapter 3: Separating Mixtures (pg. 54 81) 3.2: Separating Mechanical Mixtures (PB Pg. 40 5 & TB Pg. 58 61): Name: Date: Check Your Understanding & Learning (PB pg. 40 & TB pg. 61): 1. What are four methods
Chapter 3: Separating Mixtures (pg. 54 81) 3.2: Separating Mechanical Mixtures (PB Pg. 40 5 & TB Pg. 58 61): Name: Date: Check Your Understanding & Learning (PB pg. 40 & TB pg. 61): 1. What are four methods
Desalination of Sea Water E7-1
 Experiment 7 Desalination of Sea Water E7-1 E7-2 The Task The goal of this experiment is to investigate the nature and some properties of sea water. Skills At the end of the laboratory session you should
climate science A SHORT GUIDE TO This is a short summary of a detailed discussion of climate change science.
 A SHORT GUIDE TO climate science This is a short summary of a detailed discussion of climate change science. For more information and to view the full report, visit royalsociety.org/policy/climate-change
PREPARATION FOR CHEMISTRY LAB: COMBUSTION
 1 Name: Lab Instructor: PREPARATION FOR CHEMISTRY LAB: COMBUSTION 1. What is a hydrocarbon? 2. What products form in the complete combustion of a hydrocarbon? 3. Combustion is an exothermic reaction. What
Balloon Inside a Bottle
 Balloon Inside a Bottle What is Needed * One small party balloon * One small bottle. A 16 ounce pop bottle works well. What to Do Put approximately 1 tablespoon of water into the empty pop bottle. Then
Chapter 6. Solution, Acids and Bases
 Chapter 6 Solution, Acids and Bases Mixtures Two or more substances Heterogeneous- different from place to place Types of heterogeneous mixtures Suspensions- Large particles that eventually settle out
Experiment 12- Classification of Matter Experiment
 Experiment 12- Classification of Matter Experiment Matter can be classified into two groups: mixtures and pure substances. Mixtures are the most common form of matter and consist of mixtures of pure substances.
Density Lab. If you get stuck or are uncertain, please ask questions and/or refer to the hints at the end of the lab. Name: Section: Due Date:
 Name: Section: Due Date: Lab 01B-1 If you get stuck or are uncertain, please ask questions and/or refer to the hints at the end of the lab. Density Lab Density is an important concept in oceanography,
VCE CHEMISTRY UNIT 2 Environmental Chemistry SAMPLE COURSE OUTLINE
 VCE CHEMISTRY UNIT 2 Environmental Chemistry SAMPLE COURSE OUTLINE Week Area of Study Key knowledge Possible activities Key skills 1 1 Water Role of water in maintaining life in the environment unique
5.0 EXPERIMENT ON DETERMINATION OF TOTAL HARDNESS
 5.0 EXPERIMENT ON DETERMINATION OF TOTAL HARDNESS Sl. No. Contents Preamble 5.1 Aim 5.2 Introduction 5.2.1 Environmental Significance 5.3 Principle 5.4 Materials Required 5.4.1 Apparatus Required 5.4.2
Natural Resources. Air and Water Resources
 Natural Resources Key Concepts Why is it important to manage air and water resources wisely? How can individuals help manage air and water resources wisely? Air and Water Resources What do you think? Read
Metabolism: Cellular Respiration, Fermentation and Photosynthesis
 Metabolism: Cellular Respiration, Fermentation and Photosynthesis Introduction: All organisms require a supply of energy and matter to build themselves and to continue to function. To get that supply of
Dissolved Oxygen and Aquatic Primary Productivity1
 Dissolved Oxygen and Aquatic Primary Productivity1 INTRODUCTION 2 Oxygen is critical to the maintenance of the life processes of nearly all organisms. In the aquatic environment, oxygen must be in solution
Syllabus OC18 Use litmus or a universal indicator to test a variety of solutions, and classify these as acidic, basic or neutral
 Chemistry: 9. Acids and Bases Please remember to photocopy 4 pages onto one sheet by going A3 A4 and using back to back on the photocopier Syllabus OC18 Use litmus or a universal indicator to test a variety
Teacher Demo: Turning Water into Wine into Milk into Beer
 SNC2D/2P Chemical Reactions/Chemical Reactions and their Practical Applications Teacher Demo: Turning Water into Wine into Milk into Beer Topics evidence of chemical change types of chemical reactions
Separation by Solvent Extraction
 Experiment 3 Separation by Solvent Extraction Objectives To separate a mixture consisting of a carboxylic acid and a neutral compound by using solvent extraction techniques. Introduction Frequently, organic
Hands-On Labs SM-1 Lab Manual
 EXPERIMENT 4: Separation of a Mixture of Solids Read the entire experiment and organize time, materials, and work space before beginning. Remember to review the safety sections and wear goggles when appropriate.
Determination of the Amount of Acid Neutralized by an Antacid Tablet Using Back Titration
 Determination of the Amount of Acid Neutralized by an Antacid Tablet Using Back Titration GOAL AND OVERVIEW Antacids are bases that react stoichiometrically with acid. The number of moles of acid that
Section 1 The Earth System
 Section 1 The Earth System Key Concept Earth is a complex system made up of many smaller systems through which matter and energy are continuously cycled. What You Will Learn Energy and matter flow through
6 th Grade Science Assessment: Weather & Water Select the best answer on the answer sheet. Please do not make any marks on this test.
 Select the be answer on the answer sheet. Please do not make any marks on this te. 1. Weather is be defined as the A. changes that occur in cloud formations from day to day. B. amount of rain or snow that
Evaluation copy. Enzyme Action: Testing Catalase Activity (Method 1 O 2 Gas Sensor) Computer 2
 Computer 2") Enzyme Action: Testing Catalase Activity (Method 1 O 2 Gas Sensor) Computer 2 Many organisms can decompose hydrogen peroxide (H 2 O 2 ) enzymatically. Enzymes are globular proteins, responsible for most
Enzyme Action: Testing Catalase Activity (Method 1 O 2 Gas Sensor) Computer 2 Many organisms can decompose hydrogen peroxide (H 2 O 2 ) enzymatically. Enzymes are globular proteins, responsible for most
Chapter 3 Communities, Biomes, and Ecosystems
 Communities, Biomes, and Ecosystems Section 1: Community Ecology Section 2: Terrestrial Biomes Section 3: Aquatic Ecosystems Click on a lesson name to select. 3.1 Community Ecology Communities A biological
6 H2O + 6 CO 2 (g) + energy
 + energy") AEROBIC RESPIRATION LAB DO 2.CALC From Biology with Calculators, Vernier Software & Technology, 2000. INTRODUCTION Aerobic cellular respiration is the process of converting the chemical energy of organic
AEROBIC RESPIRATION LAB DO 2.CALC From Biology with Calculators, Vernier Software & Technology, 2000. INTRODUCTION Aerobic cellular respiration is the process of converting the chemical energy of organic
ACIDS AND BASES SAFETY PRECAUTIONS
 ACIDS AND BASES Mild acids and bases are used in cooking (their reaction makes biscuits and bread rise). Acids such as those in our stomachs eat away at food or digest it. Strong acids and bases are used
Complexometric Titration Analysis of Ca 2+ and Mg 2+ in seawater
 Complexometric Titration Analysis of Ca 2+ and Mg 2+ in seawater Introduction As the mountains on the continents are draped with snow, the mountains on the ocean floor are draped with sediment rich in
BRSP-7 Page 1. A Open B Covered C Covered / Water. Two different experiments are presented, each experiment using a different pair of models:
 BRSP-7 Page 1 Perhaps you have heard of the greenhouse effect. In a greenhouse, short-wave radiation from sunlight passes freely through the glass and is converted to long-wave radiation inside. But the
Apparatus error for each piece of equipment = 100 x margin of error quantity measured
 1) Error Analysis Apparatus Errors (uncertainty) Every time you make a measurement with a piece of apparatus, there is a small margin of error (i.e. uncertainty) in that measurement due to the apparatus
Calibration of Volumetric Glassware
 Chemistry 119: Experiment 2 Calibration of Volumetric Glassware For making accurate measurements in analytical procedures, next in importance to the balance is volumetric equipment. In this section volumetric
4.0 EXPERIMENT ON DETERMINATION OF CHLORIDES
 4.0 EXPERIMENT ON DETERMINATION OF CHLORIDES Sl. No. Contents Preamble 4.1 Aim 4.2 Introduction 4.2.1 Environmental Significance 4.3 Principle 4.4 Materials Required 4.4.1 Apparatus Required 4.4.2 Chemicals
(1) e.g. H hydrogen that has lost 1 electron c. anion - negatively charged atoms that gain electrons 16-2. (1) e.g. HCO 3 bicarbonate anion
 e.g. H hydrogen that has lost 1 electron c. anion - negatively charged atoms that gain electrons 16-2. (1) e.g. HCO 3 bicarbonate anion") GS106 Chemical Bonds and Chemistry of Water c:wou:gs106:sp2002:chem.wpd I. Introduction A. Hierarchy of chemical substances 1. atoms of elements - smallest particles of matter with unique physical and
GS106 Chemical Bonds and Chemistry of Water c:wou:gs106:sp2002:chem.wpd I. Introduction A. Hierarchy of chemical substances 1. atoms of elements - smallest particles of matter with unique physical and
Chloride and Salinity
 INTRODUCTION Chloride Chloride and Chloride, in the form of the Cl ion, is one of the major inorganic anions, or negative ions, in saltwater and freshwater. It originates from the dissociation of salts,
Designing An Experiment Using Baking Soda and Vinegar
 Designing An Experiment Using Baking Soda and Vinegar Introduction: Kinetics is the study of chemical reaction rates. It is the study of how fast different chemicals react with one another to form new
Oxidation States of Copper Two forms of copper oxide are found in nature, copper(i) oxide and copper(ii) oxide.
 oxide and copper(ii) oxide.") The Empirical Formula of a Copper Oxide Reading assignment: Chang, Chemistry 10 th edition, pp. 55-58. Goals The reaction of hydrogen gas with a copper oxide compound will be studied quantitatively. By
The Empirical Formula of a Copper Oxide Reading assignment: Chang, Chemistry 10 th edition, pp. 55-58. Goals The reaction of hydrogen gas with a copper oxide compound will be studied quantitatively. By
TEACHER ACTIVITY GUIDE
 Page 1/5 TEACHER ACTIVITY GUIDE EFFECT OF HEAT & ph ON COLOR & TEXTURE OF GREEN VEGETABLES Taken from IFT Experiments in Food Science Series Color plays a key role in establishing consumer acceptability
KS3 Science: Chemistry Contents
 summary KS3 Science MyWorks Guide Chemistry KS3 Science: Chemistry Mini zes: 40 Super zes: 5 Extension zes: 4 Skills zes: 6 TOTAL 54 What are MyWorks zes? MyWorks zes are short individual learning tasks
Experiment 8 Preparation of Cyclohexanone by Hypochlorite Oxidation
 Experiment 8 Preparation of Cyclohexanone by ypochlorite xidation In this experiment we will prepare cyclohexanone from cyclohexanol using hypochlorite oxidation. We will use common household bleach that
Carbon Dioxide in Fish Ponds
 SRAC Publication No. 468 Southern Regional Aquaculture Center April 1996 PR VI Carbon Dioxide in Fish Ponds John Hargreaves and Martin Brunson* * Mississippi State University A pond breathes in and out
Enzyme Pre-Lab. Using the Enzyme worksheet and Enzyme lab handout answer the Pre-Lab questions the pre-lab must be complete before beginning the lab.
 Enzyme Pre-Lab Using the Enzyme worksheet and Enzyme lab handout answer the Pre-Lab questions the pre-lab must be complete before beginning the lab. Background: In this investigation, you will study several
ANSWER KEY. Acids, Bases, and Solutions. Chapter Project Worksheet 1 1. Answers will vary. Sample: cherries, blueberries,
 Chapter Project Worksheet 1 1. Answers will vary. Sample: cherries, blueberries, and grass 2. Answers will vary. Sample: Cut 5 g of cherries into small pieces and place in blender. Blend for two minutes,
GETTING TO THE CORE: THE LINK BETWEEN TEMPERATURE AND CARBON DIOXIDE
 DESCRIPTION This lesson plan gives students first-hand experience in analyzing the link between atmospheric temperatures and carbon dioxide ( ) s by looking at ice core data spanning hundreds of thousands
Enzyme Action: Testing Catalase Activity
 Enzyme Action: Testing Catalase Activity Experiment 6A Many organisms can decompose hydrogen peroxide (H 2 O 2 ) enzymatically. Enzymes are globular proteins, responsible for most of the chemical activities
Temperature affects water in the air.
 KEY CONCEPT Most clouds form as air rises and cools. BEFORE, you learned Water vapor circulates from Earth to the atmosphere Warm air is less dense than cool air and tends to rise NOW, you will learn How
Pond Ecosystem Field Study MOLS
 This multi-week lab involves field studies comparing ecosystem-level ecology between 2 freshwater ponds in Marshfield Outdoor Learning Sanctuary. We will be investigating a correlation between weather
LOGARITHMS AND THE ph SCALE
 NAME: DATE: LOGARITHMS AND THE ph SCALE A scientific application of Logarithms is the ph scale which is used to measure the concentration of H + ions in an acidic or basic solution. ph is equal to the
Understanding Basic Concepts demonstrate an awareness of air as a substance that surrounds us and takes up space, and whose movement we feel as wind
 Designation: Ontario Curriculum: Science and Technology Earth and Space Systems: Grade 2 Air and Water in the Environment Written by: Andrea Schultz-Allison, Department of Earth Sciences, The University
(Walter Glogowski, Chaz Shapiro & Reid Sherman) INTRODUCTION
 INTRODUCTION") Convection (Walter Glogowski, Chaz Shapiro & Reid Sherman) INTRODUCTION You know from common experience that when there's a difference in temperature between two places close to each other, the temperatures
Convection (Walter Glogowski, Chaz Shapiro & Reid Sherman) INTRODUCTION You know from common experience that when there's a difference in temperature between two places close to each other, the temperatures
Worksheet A Environmental Problems
 Worksheet A Environmental Problems Vocabulary Can you talk about Environmental issues in English? With a partner, try to explain the terms in the diagram below. Why are the words divided into two groups
Chemistry B11 Chapter 6 Solutions and Colloids
 Chemistry B11 Chapter 6 Solutions and Colloids Solutions: solutions have some properties: 1. The distribution of particles in a solution is uniform. Every part of the solution has exactly the same composition
The Properties of Water (Instruction Sheet)
") The Properties of Water (Instruction Sheet) Property : High Polarity Activity #1 Surface Tension: PILE IT ON. Materials: 1 DRY penny, 1 eye dropper, water. 1. Make sure the penny is dry. 2. Begin by estimating
The Properties of Water (Instruction Sheet) Property : High Polarity Activity #1 Surface Tension: PILE IT ON. Materials: 1 DRY penny, 1 eye dropper, water. 1. Make sure the penny is dry. 2. Begin by estimating
http://video.nationalgeographic.com/video/oceans narrated by sylvia earle/oceans overview 71% is covered by the Earth's Ocean
 Chapter 13 Exploring the Oceans Section 1 Earth's Ocean List the major divisions of the global ocean. Describe the history of Earth's oceans Identify the properties of ocean water. Describe the interactions
Atmosphere, pressure and wind the story for teachers
 Atmosphere, pressure and wind the story for teachers These notes are reproduced from materials accompanying the CPD workshop Science Through the Window, by permission of the Scottish Earth Science Education
Chemical Reactions Practice Test
 Chemical Reactions Practice Test Chapter 2 Name Date Hour _ Multiple Choice Identify the choice that best completes the statement or answers the question. 1. The only sure evidence for a chemical reaction
Experiment 5 Preparation of Cyclohexene
 Experiment 5 Preparation of yclohexene In this experiment we will prepare cyclohexene from cyclohexanol using an acid catalyzed dehydration reaction. We will use the cyclohexanol that we purified in our
Experiment 8 - Double Displacement Reactions
 Experiment 8 - Double Displacement Reactions A double displacement reaction involves two ionic compounds that are dissolved in water. In a double displacement reaction, it appears as though the ions are