Connectivity Scorecard 2009
|
|
|
- Damon Arnold
- 10 years ago
- Views:
Transcription
1 Connectivity Scorecard 2009 Leonard Waverman, Fellow of the London Business School and Dean and Professor at the Haskayne School of Business at the University of Calgary Kalyan Dasgupta, Managing Consultant at LECG With assistance from Nicholas Brooks, LECG 0

2 Contents 1 Foreword About this report The Connectivity Scorecard Concept Connectivity Scorecard Appendix 1: Connectivity Scorecard 2008, further details...45 Connectivity Scorecard 2008: Methodology and weighting...46 Appendix 2: Some Q&As related to 2009 methodology...55 Bibliography

3 1 Foreword For an economist, this is a particularly interesting moment at which to be analysing the impact of Information and Communications Technology on economic growth the central tenet of the Connectivity Scorecard. With economies across the world seemingly in rapid retreat, and governments and corporations working overtime to adapt to their new circumstances and to find a way to halt the reverse, I believe the debate about how ICT (Information and Communications Technology) can stimulate growth is more relevant than ever, and if anything assumes a great deal more urgency. At a time when economic growth is proving elusive, many countries will be able to look at the Connectivity Scorecard and see that there is great potential for them in using ICT to stimulate growth, and as a number of governments assess their options for stimulus plans they might well look at this sector as an area where their investment would be well rewarded. Connectivity Scorecard 2009 shows, just as its pioneering predecessor did last year, that no country has any room for complacency in its deployment and usage of ICT infrastructure. Even the US, which has a significantly improved score and retains its leadership of the rankings of innovation-driven countries, has room for improvement. From hundreds of conversations with government officials and policy-makers that the first Connectivity Scorecard in 2008 prompted, we know that there is intense interest in official circles about how the full power of ICT can be harnessed to help drive economic and social improvement. The widespread and intense interest in Connectivity Scorecard 2008 took us all by surprise initially and has prompted us to double the number of countries examined in 2009 to 50, with 9 new innovation-driven economies ranked, including Denmark, Singapore and Greece, and 16 new efficiency and resource-driven economies across Africa, Asia and Latin America. We certainly hope that the Scorecard and the individual analyses of each country s performance will encourage nations to develop a roadmap to realize the latent social and economic potential of telecommunications networks. Our focus on productivity and 2
 can stimulate growth is more relevant than ever, and if anything assumes a great deal more urgency.")
4 economic growth makes the Connectivity Scorecard different from the other indices measuring ICT usage. From the outset in 2008, it has been our intention to broaden the regularly used definition of connectivity from the number of lines, or the number of subscriptions, to include the tools required to make Telecommunications and ICT truly productivity enhancing. For the purposes of the Scorecard and this report, connectivity refers to the holistic interaction between a country s ICT infrastructure incorporating telecoms systems as well other hardware and software and the end users, including the various skills they need to get the best usage from the tools. This interaction defines the roadmap and the needed improvements in infrastructure, complementary capital (e.g. software), skills, and importantly, the attitude towards ICT. We use data and analyses for the three key areas of society consumer, government and business, taking relevant data from the best possible sources that chart such development. For 2009, we have had to change some data sources because of the doubling of the number of countries examined. These changes unfortunately make exact comparisons with Connectivity Scorecard 2008 difficult. To that raw data, we have applied the Connectivity Scorecard s unique weighting. Because we are primarily interested in the ability of ICT to promote economic growth, the methodology of the Scorecard has been designed to use actual country data on the relevant shares of activities that trigger growth. Thus, the Scorecard is relatively heavily weighted towards the business sector. As a result, countries that perhaps have superior fibre residential broadband networks, or perhaps high mobile subscriber rates, will find themselves weighed down if there has not been a corresponding investment in business infrastructure and the necessary capital and skills to turn infrastructure into productivity enhancing vehicles. What we hope this has produced is a measure of useful connectivity, which is connectivity that contributes to economic growth, especially through improvements to productivity. After all, productivity is the key to sustained economic prosperity in the longer term. With governments poised to mount huge infrastructure programs, our Connectivity Scorecard has three implications one, communications networks are the infrastructure of the 21 st century and these networks are very large construction programs; two, infrastructure is also people, and investment in training would be extremely important now with the retooling required to move out of the recession; three, infrastructure is also the complementary assets such as servers, internet hosting, and 3

5 software. Therefore, considerations need to be given to incentives for investment here as well. Len Waverman Fellow of the London Business School, and Dean and Professor at the Haskayne School of Business at the University of Calgary 4

6 2 About this report This report accompanies the release of Connectivity Scorecard It has the following structure: Section 3 is designed to introduce the Connectivity Scorecard and our findings from the first version of this Scorecard released in January 2008; Section 4 summarises Connectivity Scorecard 2009, which uses newer data, and doubles the country coverage of the Scorecard. This summary is in the form of a series of questions and answers, with some of the questions and answers based upon the feedback that we have received in the last 12 months; Appendix 1 provides further details of the methodology and key results from the 2008 Scorecard; and Appendix 2 is a short technical section with further questions and answers focussing on the weighting system, scoring system and methodology used. 5

7 3 The Connectivity Scorecard Concept Connectivity It is widely accepted that most modern economies are Information economies, and that a significant amount of economic growth and productivity growth in the developed nations of Europe, North America and the Far East is driven by information and communications technology (ICT). What is less widely accepted and understood is that actually all economies are information economies. The free flow and availability of information lowers the barriers to economic activity and stimulates growth and productivity in even those economies that we do not normally regard as fully developed. Connectivity is usually understood to be the copper wires, fibre-optic cables and networked computers, and more recently mobile phones and base stations that enable the fast flow of information regardless of distance. The associated costs are much lower than the costs of physical travel, and much lower than these costs were just 15 or 20 years ago. Connectivity is the key enabler of the flow of information that defines modern economies, and it is the key enabler of an ongoing (and sometimes overlooked) transformation in the economic fortunes of many Asian and African countries. We define connectivity in a much broader way to embrace more than just infrastructure and hardware. The notion of connectivity should be expanded to include also the complementary assets (software) and skills embodied in people, governments and businesses that determine just how productively the hardware and infrastructure are used. In summary, we use the term connectivity to refer to the totality of interaction between a nation s telecommunications infrastructure, hardware, software, networks, and users of these networks, hardware and software. Thus broadband lines, PCs, advanced corporate data networks and advanced use of wireless data services are certainly measures of connectivity, but so are human skills relevant to the usage of these infrastructures, technologies and networks. Useful connectivity The Connectivity Scorecard that we have designed is an attempt to rank countries according to a measure of what we call useful connectivity. Useful connectivity or usefully connected are phrases that we use often in this report and in our 6

8 presentational materials. They refer to the ability of connectivity to contribute to economic growth, especially through improvements in productivity that are widely held to be the key to sustained economic prosperity. The concept of useful connectivity is first and foremost an attempt to recognise that the economic value generated by connectivity depends not just on conventional measures such as broadband lines or computers connected, but also on who is using those lines businesses or consumers and how well they are able to use the lines (captured by measures such as user skills, software assets, use of voice-over-ip and the number of intranet hosts per capita). The Scorecard aims to measure useful connectivity by making a link between connectivity and economic performance. Below, we explain how this link is made. What makes this Scorecard different? The linkage between connectivity and economic performance While there has been a significant body of academic research that looks at the relationship between various elements of connectivity on the one hand (Computers, Telecommunications, or more generally ICT ), and economic growth and productivity on the other, the insights of this literature have not been crystallised in existing Scorecards or Indices, or rankings of the Digital Economy. However, given our emphasis on useful connectivity, we felt that our methodology must attempt to incorporate the findings of the academic research. Some widely recognised facts that emerge from existing research are the following: The United States has seen more clear-cut productivity gains from ICT than has Europe, and a major source of this U.S. productivity advantage is the usage of ICT by businesses that are not themselves producers of ICT for example, retailing 1. Within Europe, Nordic countries have seen a greater contribution from ICT than other parts of Europe; The impacts of ICT are enhanced by investment in complementary assets such as worker training, learning and education 2 ; 1 Robert Inklaar, Bart Van Ark and Robert McGuckin, ICT and Productivity in the United States and Europe: Where Do the Differences Come From?, Conference Board Working Paper, Susanto Basu, John G. Fernald, Nicholas Oulton, and Sylaja Srinivasan, Does Information Technology Explain Why Productivity Accelerated in the United States But Not the United Kingdom?, Federal Reserve Bank of Chicago, Working Paper

9 Productivity growth is the key to sustained improvements in living standards (productivity growth is one major way in which the trend rate of economic growth the long-term potential growth rate of the economy can be improved). Thus in constructing a scorecard that purported to measure useful connectivity, we wanted to take into account not just how many broadband lines were being deployed, but who was using those broadband lines businesses or consumers? How smart were the uses of these lines for example, what proportion of the workforce had what the European Commission s i2010 research programme describes as ICT user skills? The results from academic research suggested that in order to construct an index or scorecard of connectivity that actually linked connectivity to economic performance, we needed to look at: whether countries were connecting up in the right places e.g., countries were deploying infrastructure and making use of telecommunications and ICT in those sectors of the economy that were most important to generating long-term economic growth, whether investment in infrastructure was being matched up by investment in usage or skills, and how economically beneficial investment in infrastructure was, as opposed to investment in usage and skills. We therefore had to answer the following questions: If the economy was divided into its constituent actors the government sector, the business sector and the consumer sector how to weight the importance of these sectors in a way that captures the role of the business sector in terms of productivity contributions? How can we rank countries according to, not just the availability of infrastructure and the penetration rate of infrastructure, but also the usage level of the infrastructure by consumers, businesses and governments? How can we factor in the complementary investments in human and organisational capital, particularly by businesses, i.e. in what we call useful connectivity? 8

10 Thus the Connectivity Scorecard methodology: divided the economy into the consumer sector, the business sector, and the government sector, gave weights to the consumer sector, business sector and government sector that matched their importance in economic activity, split each of the consumer, business and government categories into infrastructure and usage and skills components and allocated individual measures to either of these two sub-categories 3, and allocated weights to the infrastructure and usage and skills categories. A wide range of individual measures/metrics/indicators was selected, reflecting elements of both infrastructure and usage. A full list of these indicators is presented after the tables and figures in Section 4 of this report Connectivity Scorecard The weighting of the infrastructure and usage and skills categories was based upon economic considerations and are unique in the literature. First, the weights for each sector are country-specific and are drawn from national GNP accounts. The weights for the infrastructure versus skills subcomponents used data from research into the sources of productivity enhancement 4. Thus the selection of categories, sub-categories and weights reflects an ambitious attempt to capture whether countries are investing in the right places, are matching their infrastructure investment with the right skills, and whether they are succeeding in enabling adequate levels of both access to, and usage of, key technologies. 3 For example, education or skills measures, or measures such as minutes of usage per customer, were allocated to usage and skills, while measures such as line counts or hardware investment were allocated to infrastructure. 4 For example, businesses and governments are concerned with productivity and generating growth. Thus, a theoretically sensible split between infrastructure and usage and skills would look at the contribution of investment in infrastructure relative to the contribution of human capital or investment in complementary capital in generating economic growth. In practice, we used data drawn from the EU KLEMS database that allowed us to examine the relative importance of ICT investment and improvements in labour force skills to economic growth over a recent 10-year period. For consumers, utility, or consumer welfare, is of paramount importance. Consumers can subscribe to a telephone service (or broadband service) based upon two considerations: (a) the value that they place on having access to the network, which is often called an option value, and (b) the value that they derive from actual usage of that network. Unfortunately, while the economics literature has ample theoretical discussion on the option value of access, there is little quantitative guidance about the proportion of consumer welfare derived from access versus the proportion derived from usage. In the absence of such evidence, we gave equal weights to the infrastructure and usage and skills sub-categories for consumers. 9

11 For instance, consider the case of Korea. Korea s telecommunications industry has invested heavily with substantial government encouragement in very advanced technologies such as fibre-to-the-home (FTTH) broadband. Korea scores very highly on some indices that might have a similar aim as the Connectivity Scorecard, such as the International Telecommunication Union (ITU s) Digital Opportunity Index (DOI). However, Korea is also a very heavily business-driven economy in that the levels of business investment and intermediate consumption (which is a measure of B2B activity) are very high compared to the level of consumption by the consumer sector. Thus in our methodology the business sector gets a very high weight for Korea, and it is on measures such as business spending on enterprise telephony, data services and the like that Korea s performance might be termed lacklustre. Korea finished 11 th out of the 16 countries that were studied in the 2008 Scorecard. This is in stark contrast to its exalted position in the Digital Opportunity Index. It is our belief that because the business sector is especially important in Korea, connecting up the business sector and encouraging businesses to spend more on ICT and complementary skills would have more of an impact on long-term economic performance than investing in residential technologies. Our intuition is that Korea is less usefully connected than several other OECD countries, and certainly less usefully connected than it could be. The Connectivity Scorecard ranking for Korea reflects that intuition. Figure 1 provides a schematic of our methodology, while Appendix 1 provides further amplification of the methodology underpinning the Scorecard. Figure 1: Schematic representation of methodology 10
 are very high compared to the")
12 Connectivity Scorecard 2008: What we did and what we found In January 2008 we computed two separate Connectivity Scorecards the first for a group of 16 countries, covering mostly the innovation-driven (Tier 3) economies but also some economies that are making the transition towards being innovation-driven: Hungary, Poland, the Czech Republic and Korea are examples. The second Connectivity Scorecard covers nine countries, and uses different assessment metrics. The countries covered by the second Scorecard are resource and efficiency-driven economies. The terms resource and efficiency-driven and innovation-driven are borrowed from the World Economic Forum (WEF) s classification. We looked at the scores for each country, on each metric, on a benchmarked basis (relative to best in class in its category). In this Scorecard, the highest theoretical score for any country is 10, although this would require the country to be the best on every single metric. The table below summarises the 2008 Connectivity Scorecard results. The United States and Malaysia topped their respective categories. The major surprise in the Scorecard was the low ranking of Korea, which we discussed above. 11
 s classification.")

13 Connectivity Scorecard 2008: Results 12

14 Connectivity Scorecard 2008: Implications and Messages Little room for complacency Although the Scorecard s primary goal was to generate rankings of countries, it was nonetheless striking to see how low many of the absolute scores were. Our conclusion was the following: Even the world s best-connected countries have little room for complacency and much work to do. While a perfect 10 is a possibility if and only if a country topped all of the components, the wide dispersion of scores and the failure of any country to score even 7 out of 10 shows that there is not one country that is uniformly strong on all dimensions of connectivity. For example, the U.S. registered mediocre performance in broadband relative to the existing best performers today. This shows the potential for catch-up that exists even in the most usefully connected nation. Untapped potential equals significant economic gain Given that ours is a composite measure of connectivity which links usefulness to economic performance, there are major economic gains to be had from improving connectivity (as we define it). For example, a well-known study in the United States (by Crandall and Jackson) 5 put the long-term benefits to the U.S. of increased broadband penetration at $500 billion. Holistic improvements in performance could yield long-term economic gains that are multiples of the figure obtained by Crandall and Jackson. The 2008 Connectivity Scorecard showed that there is much untapped potential in even the most advanced markets. Countries that one normally thinks of as highly connected still score poorly on this scorecard. For example, Korea has a relatively low spend on certain business telephony measures, suggesting that there is considerable room for growth, given the size and wealth of the country and the quality of some of the supporting infrastructure. Likewise, there is still potential for extensive new infrastructure deployments and far more intensive usage of technology in the United States, the country that ranked first on the 2008 Connectivity Scorecard. Notably, the United States did not rank first in any of the three components business, consumer and government but did well enough on all three to be first overall. 5 Robert Crandall and Charles L. Jackson, The $500 billion opportunity, Prepared for Verizon Communications,

15 Lessons for policy-makers, businesses and telecoms operators Our conclusions in this regard were as follows: Governments and policy-makers Policy-makers need to evaluate where their country falls short in connectivity performance and strive to either develop the infrastructure and complementary assets that would facilitate better performance, or eliminate the barriers and rigidities that prevent it. A lot of the necessary change will not be easy in the short term, and it may require governments to remove (for example) the barriers that make it harder for businesses to re-organise themselves around ICT, or the import tariffs that protect domestic producers but cost societies much more by raising the price of access and usage of the relevant infrastructure. Businesses Businesses clearly have a role to play. The economic gains described above are gains to both consumers and to businesses, which are able to perform much more efficiently if they use more technology more effectively. Businesses also have to accept change, while perhaps investing more in complementary capital, such as worker training, which will enable them to reap larger benefits from technology. Further, businesses have to show imagination in the way they use technology. As a complement to the first Connectivity Scorecard, we surveyed IT managers who operated internationally to gauge their satisfaction with the fixed-line and mobile infrastructures and services offered in a range of countries. Somewhat to our surprise, most were quite satisfied with the state of affairs they found. This could suggest that the low scores on our Scorecard are misleading, but it more likely suggests that businesses do not grasp that even existing technologies can be used much more intensively. For example, some mobile banking services and electronic transaction services are better developed in African countries than in the U.S. or Canada. The Telecommunications industry For telecommunications operators, the Connectivity Scorecard shows that few markets are truly saturated. Operators will have to look at the specific strengths and weaknesses of each country and spot the potential for expansion. In India, there are opportunities everywhere to expand the existing coverage of mobile and broadband networks, and to increase the usage of these technologies from the existing revenue base. However, other less prominent emerging markets also have significant infrastructure and connectivity needs, and operators may benefit from moving early to 14
 the barriers that make it harder for businesses to re-organise themselves")
16 convert those needs into opportunities. In addition, we emphasise useful connectivity, i.e., the ability of connectivity to contribute to economic growth. Hence, there is much room for operators to assist firms by providing best-in-class training in usage. Thus operators need to re-focus their attention on the kind of sales that take into account this concept of useful connectivity. 15

17 4 Connectivity Scorecard 2009 The first version of the Nokia Siemens Networks Connectivity Scorecard was released in January Since then, the level of interest in the Scorecard has exceeded our expectations. Governments and policy-makers around the world appear intrigued by our results and methodology. The first iteration of the Scorecard was a proof of concept many noted policy-makers, academics and analysts appeared to embrace the concept. Their substantial interest led us to seek to extend the findings of our Scorecard to cover significantly more countries and to re-examine the indicators and methodologies that we used in the first instance. This second report on the Connectivity Scorecard is the result of a sustained effort and collaboration between Nokia Siemens Networks and LECG to respond to the many questions and expressions of interest that we have received. We summarise the changes and developments in the Scorecard by way of a series of Questions and Answers (Q & A). 16

18 Results of Connectivity Scorecard 2009 Innovation driven economies Connectivity score Resource & efficiency driven economies Connectivity score United States 7.71 Sweden 7.47 Denmark 7.18 Netherlands 6.75 Norway 6.51 United Kingdom 6.44 Canada 6.15 Australia 6.14 Singapore 5.99 Japan 5.87 Finland 5.82 Ireland 5.70 Germany 5.37 Hong Kong SAR 5.33 France 5.22 New Zealand 4.85 Belgium 4.65 Korea 4.17 Italy 3.99 Czech Republic 3.71 Spain 3.49 Portugal 3.02 Hungary 2.72 Greece 2.62 Poland 2.49 Malaysia 7.07 Turkey 6.71 Chile 6.59 South Africa 5.76 Mexico 5.39 Russia 5.37 Argentina 5.14 Brazil 5.12 Colombia 4.08 Botswana 3.98 Thailand 3.75 Iran 3.62 Ukraine 3.60 Tunisia 3.50 China 3.19 Philippines 3.17 Egypt 3.02 Sri Lanka 2.87 Vietnam 2.75 India 1.88 Indonesia 1.87 Kenya 1.75 Bangladesh 1.60 Pakistan 1.54 Nigeria 1.30 Note: The data and metrics used to assess the resource and efficiency-driven economies are very different from those used to assess innovation-driven economies. It would be simply incorrect to interpret Malaysia s score of 7.07 as meaning that Malaysia performs better than the Netherlands or Norway. In fact, Malaysia would finish below Poland if we used the same metrics and benchmarks for Malaysia as used for the innovation-driven economies. 17

19 Why a new Connectivity Scorecard? The 2008 release of the Connectivity Scorecard sparked significant interest in expanding the Scorecard to cover additional countries. Connectivity Scorecard 2009 covers 50 countries in total. While it was not our intention to alter the methodological precepts of the Scorecard, we did take the opportunity to review the methodology, data sources and metrics used for the 2008 version, and based on these reviews have made a few changes to our data sources and some of the individual metrics that we utilise, although the methodology is entirely unchanged. How does this version of the Scorecard differ from the first version? This current version of the Connectivity Scorecard differs from the first version in two principal ways: The sample of countries that we have covered has been substantially extended. In the initial version of the Scorecard, we surveyed 16 innovation-driven economies and 9 resource and efficiency-driven economies. 6 In this version, we survey 25 innovation-driven economies and 25 resource and efficiencydriven economies; We have added some additional indicators (e.g., indicators on the spread of Next Generation access Networks, or NGN) to the Scorecard. We have also replaced some of the original data sources that we used with data sources that are preferable in terms of robustness and transparency. Has the methodology used to create the Scorecard been altered? The methodology behind the Scorecard has not been altered. The distinctive feature of the first version of the Scorecard was the weighting system. Recognising that the principal way in which connectivity impacts upon the wider economy is through its impact on business productivity, we had sought out a weighting system that captures this high impact of business. Thus we had measured business-driven activity as consisting of both investment and intermediate consumption, to capture all B2B activity. 6 The website for the Scorecard, contains definitions of innovation-driven and resource and efficiency-driven economies, and also provides guidance on key methodological matters, most of which have been unchanged since the first version. 18

20 The other novelty in the weighting system was the manner in which we allocated weights to the business infrastructure and business usage and skills sub-indices. These weights were based on the relative contribution of information technology investment and increases in the quality of the workforce to economic growth. Where such refined splits were not obtainable (e.g. for the resource and efficiency-driven economies) we used data on the relative contribution of overall capital investment and labour composition to overall economic growth. The idea behind this methodology was to utilise some notion of how much of economic growth has been driven by improvements in infrastructure versus how much has been driven by improvements in the quality of the users of that infrastructure (the work-force). The major difference between this year s Scorecard and the first version was that we were fortunate to obtain a more complete set of relevant weights for the extended sample of countries. Many of the weights were supplied by Barry Bosworth from the Brookings Institution, whose co-operation we gratefully acknowledge. We have conducted an extensive set of sensitivities to respond to questions that have been raised about the methodology. These sensitivities and some further Q&A are explored in Appendix 1 to this report. Have the results of the Scorecard changed? The results of the Scorecard have indeed changed. Table Results of Connectivity Scorecard 2009 on page 17 summarises the baseline results that we report and refer to in the body of this report. As with last year s ranking, there are separate scores for innovation-driven and for resource and efficiency-driven economies. Also as with last year s scorecard, the United States and Malaysia finish at the top of their respective categories. However, the addition of a number of other countries has obviously had an impact on the rankings. In general, however, there is a high degree of consistency between last year s scores and this year s scores. 7 Thus, the same patterns and correlations that emerged in last year s Scorecard are also apparent in this year s Scorecard. These patterns may be summarised as follows: Relatively low average scores, especially for the resource and efficiency-driven economies (Table, Results of Connectivity Scorecard 2009 on page 17). The 7 There are some changes. For instance, Finland falls from 6th to 10th place in the rankings. However, this fall is almost certainly attributable to the inclusion of Denmark, the Netherlands, Norway and Singapore all technologically advanced countries to this year s list. 19
 we used data on the relative contribution of overall capital investment and labour composition to overall economic growth.")
21 median score for the innovation-driven economies is The median score for the resource and efficiency-driven economies is lower, at This suggests a greater gulf between the best-performing resource and efficiency-driven economies and the rest of the group, while there is significantly less (but still substantial) dispersion in the performance of the innovation-driven economies; Relatively high levels of correlation with GDP per capita, the UN Human Development Index, and other measures of general development, wealth and technology deployment (Figures 2-5). How comparable are this year s scores to last year s? How should one interpret changes in a country s score from year-to-year? Both the inclusion of additional countries and the use of revised metrics mean that it is not possible to interpret changes in country s scores from last year to the current year as being improvements or deteriorations in connectivity. This is for the following reasons: The scorecard uses a relative scoring method. On any individual metric e.g., penetration of 3G handsets a given country is scored relative to the best in class. Over time, even if 3G penetration in the given country improves, the relative position of the country may not improve. Thus one could have situations in which connectivity or the individual elements that comprise connectivity shows improvement in absolute terms but not in relative terms. Therefore, a country could increase penetration of 3G handsets but still fall in the rankings or even in the score it receives on the Connectivity Scorecard because other countries did so at a faster rate. If the best in class represents the frontier of performance, the relative score that each country gets on each individual metric reflects the potential for that country to catch-up. When one uses relative scoring methods, the goalposts keep shifting, which limits the ease with which one can make comparisons over time; New metrics have been included and the data sources used for existing measures have been revised. The practical implication is the following: while the underlying methodology and conceptual basis underpinning this year s effort are identical to the methodology and conceptual basis for last year s effort, the fact that we have expanded the information base that we rely on to assess scores means that changes in scores are not necessarily a reflection of improved connectivity or reduced connectivity. The Scorecard essentially 20
22 captures the extent to which nations are under-deploying and under-utilising ICT relative to the frontier of performance today. The Scorecard does not measure absolute levels of connectivity. Indeed there is no such thing as an absolute level of connectivity, comparable to absolute levels of GDP, weight, height and other quantitative measures. Thus, a more relevant way to assess country s performance from year-to-year would be to assess changes in rankings. Over a short period, one would expect a very good degree of stability in the rankings. Can you comment more on the backwards compatibility between Connectivity Scorecard 2008 and Connectivity Scorecard 2009? There is limited backwards compatibility by design between Connectivity Scorecard 2008 and Connectivity Scorecard First and foremost, a limitation of composite indices that produce relative rankings is that comparisons over time ( inter-temporal comparisons ) are hard to make and absolute scores difficult to interpret. Connectivity is a composite of many different attributes, many of which have different units and different dimensions. For example, the United Nations Human Development Index (HDI) is another composite index that uses a relative scoring system, as it must, to capture several attributes of a country. In both these cases, it is simply very difficult to talk of absolute levels of human development or connectivity, the way it is possible to talk about levels of simple measures such as height, weight or even GDP per capita. This important, conceptual point aside, Connectivity Scorecard 2008 was an ambitious initial effort, but we felt that it was imperative to accommodate both the feedback that we had received on Connectivity Scorecard 2008 and the continued evolution of technology and networks. We added 25 new countries, which created its own set of research issues: for example, we could not continue to use some sources of data that were used for Connectivity Scorecard 2008 as they only covered a limited subset of the original 25 countries. We also wanted to take into account several key realities of this technology sector. If one looks merely at mobile penetration and broadband penetration in OECD nations, there is a fair amount of convergence across these nations, with average penetration rates exceeding 90 percent for mobile, and 50 percent (by households) for broadband. However, if one instead looked at the variables that reflect the most recent investment efforts in the most recent technologies, then this picture of convergence is disrupted. For instance, only Korea, Japan and Sweden have measurably high rates of fibre-to-thehome broadband penetration (greater than 5 percent), with many countries having a 21
23 virtually zero penetration rate. In only 8 out of 25 innovation-driven economies was the incumbent telecoms operator offering broadband speeds of greater than 50 Mbps as of December G penetration rates are also highly variable, with most countries now catching up with the Far East, but from a much lower level of initial penetration. In much of the feedback and commentary that we obtained, there was a great deal of interest in our ability to capture these forward-looking dimensions of connectivity. We also wanted to take the opportunity to revise and improve Connectivity Scorecard 2008 wherever possible. Connectivity Scorecard 2009 relies on data sources that offer wider country coverage and more up-to-date data. We intend to maintain these data sources in the future, wherever possible. We offer more comment on the sources of change in individual countries scores between Connectivity Scorecard 2008 and Connectivity Scorecard 2009 in the country factsheets available from How can one explain the fall of Japan from 3 rd place to 10 th place in the current Scorecard? Japan was one of the few countries whose ranking and score was significantly affected by the switch to different data sources and the choice of different metrics. Most specifically, we eliminated some indicators of mobile and Internet usage that were based on proprietary survey data. Japan was a top-scorer on these indicators but these data had their inherent limitations, and in any case could not be used as we substantially expanded the sample of countries that we were surveying. We instead include a measure of mobile enterprise messaging usage, in which Japan continues to score highly. Why did the United States score improve from 6.97 to 7.71? Table 2 shows the US performance on the six major sub-indices of the Scorecard last year and this year. It can be seen that the US performance improved on the Consumer infrastructure front, partly driven by the fact that the US has a modest but growing penetration of fibre-to-the-home and is also one of a handful of countries in which ultrahigh-speed broadband is available on a widespread basis from an incumbent operator. We included these measures in the latest version of the Scorecard. The US continued to score very highly on business infrastructure, which receives a high weight in the US economy. Again, one cannot strictly talk about improvements in the US performance between this year and last year. Rather one can say that the US high ranking in the previous Scorecard was a very robust finding. Even after expanding the sample of 22
24 countries to include very advanced nations such as Denmark, the Netherlands and Norway, the United States still performed very well. The inclusion of forward-looking metrics seems to have helped the United States. However, as we repeatedly emphasise in this document, the Connectivity Scorecard is, first and foremost, a relative ranking of countries. Thus the real focus should be on the US continued top ranking, rather than the absolute score it achieved. How big a factor is the choice of weights in generating the current results? Table 3 (at the end of this section) shows that the weights and the methodology that we used have a limited impact on the Scorecard overall, but produce some interesting divergences from more orthodox weighting techniques used in Index construction. One standard weighting methodology used in the construction of other Indexes is Principal Components Analysis (PCA), which assigns uniform weights (same for all countries) to each of the six sub-indices that make up the Scorecard. If we utilise this weighting scheme, one sees that while some innovation-driven economy rankings (e.g., Korea) have changed from the Table on page 17, the similarities in the rankings and score are more striking than the differences. The composition of the top 10 countries in the innovation category is unchanged, although there are some movements in rankings within this group. (Since we determined the PCA weights based only on data from the innovation-driven economies, we did not apply these to the resource and efficiencydriven countries). We believe that our weighting scheme is superior to uniform weights. How can one interpret the significance of differences between the scores of individual countries on the current Scorecard? For example, Sweden scores a 7.47 and the United States scores a Are these countries really different? Absolute differences in scores (e.g., the 0.24 difference between the US and Sweden) are admittedly difficult to analyse in any meaningful and rigorous way. Nevertheless, it is still worth asking based on rankings alone whether Sweden is really less usefully connected than the United States. We looked to statistical and analytical methods to provide guidance as to how one might examine the issue of statistical difference in scores Cluster analysis is one such available method that can be used in a visually appealing way. Cluster analysis looks at the pair-wise distance between individual countries on one or several measures in order to create groupings or clusters of countries on those 23
25 measures. For example, the difference between the US and Sweden on the Connectivity Scorecard is The difference between Sweden and Denmark is The difference between Denmark and the next-nearest country (the Netherlands) is Thus a logical cluster is formed by the United States, Sweden and Denmark as the differences in scores between members of this cluster are far smaller than the difference in scores between the lowest-scoring member of this cluster and the next highest-scoring country 8. We used cluster analysis to divide our countries into seven distinctive clusters based on their ranking on the Connectivity Scorecard. Roughly speaking, countries that belong to the same cluster are more similar to each other in terms of their performance on the Connectivity Scorecard than they are to members of any other cluster. Thus the US, Sweden and Denmark have connectivity performance that might be depicted as being in a class of its own. There is then a considerable difference between this cluster and the next cluster, whose members include the Netherlands, Norway and the UK. The green bubbles on Figure 6 (page 35) represent these clusters. The size of the green bubble shows the number of members in each cluster. The distance between the green bubbles shows the distinctiveness of each cluster from its neighbouring cluster. It can be seen that the first cluster is farther apart from the second cluster than the second is from the third. Finally, there is a clear league of under-performers in Eastern and Southern Europe. It is instructive to look at how this grouping of countries maps to a similar grouping or clustering constructed based on GDP. The red bubbles show a similar analysis that groups countries into seven clusters according to per capita GDP. The solid arrows leading from these red bubbles to the green bubbles depict the countries that underperform in terms of connectivity these are countries whose connectivity cluster is at least 2 ranks below their GDP cluster. Sweden is the only country that is clearly in a higher connectivity cluster than would be predicted based on GDP alone. Thus, it is the only major out-performer. Figure 7 shows a similar analysis for the resource and efficiency-driven economies, with Malaysia standing out in its own distinctive cluster at the top. 8 One could also perform the cluster analysis using the 28 indicators that make up the Scorecard for the Innovation-driven economies; the measure of distance between countries is the Euclidean or Geometric distance instead of the simple arithmetic difference that one can use for a one-dimensional variable. 24
26 These bubble charts serve to re-emphasise the message from Connectivity Scorecard 2008 that countries are under-performing relative to potential. For example, Italy is part of the same cluster as Finland on a per capita GDP basis, but it is in a much lower cluster on a connectivity basis. Given that three countries receive a score above 7 out of 10, does the statement that every country still has work to do hold? Will any country ever get a perfect 10? While the primary purpose of the Connectivity Scorecard is to generate rankings of countries at a given moment in time, there are some inferences that can be gleaned from looking at the actual country scores. The basic conclusions from last year s scorecard still hold. There are individual metrics, such as 3G penetration, where the US is below average with penetration below 1/3 rd the level of the leading country. While the US is one of the relatively small number of nations where mass-market fibre deployment is becoming a reality and the only nation where this deployment is entirely commercially driven the fact is that fibre penetration is less than 1/10 th that of Korean levels. The US score would improve to 8.2 if it performed at Korean levels on just these two metrics alone. As discussed last year, it would be very difficult for a country to get a 10 out of 10, as it would have to be the best country on each metric to achieve this. However, if countries were generally performing well one would expect to see many countries gaining relatively high scores, and one would also expect to see less dispersion in the overall scores. One sees significant dispersion (as measured by the Coefficient of Variation) in all the six sub-indices of the Scorecard, especially in the consumer and business infrastructure categories. This dispersion is even more pronounced for the resource and efficiency-driven economies than for the innovation-driven economies. Given the current economic crisis, why should anyone care about the Connectivity Scorecard and its findings? People should care about the findings of the Connectivity Scorecard because of the implications for economic policy contained within these findings. Take Italy, for example. Despite years of lacklustre economic growth, Italy is still a relatively prosperous country, and based on the cluster analysis in Figure 6, one might roughly say that it is in the same league of prosperity as Finland. Nevertheless, Italy is 19 th out of 25 innovationdriven economies on the Connectivity Scorecard. Figure 8 (page 37) shows that investment in ICT is a lower share of total investment in Italy than in virtually any other 25
27 OECD nation. The circumstantial evidence (rigorous statistical evidence would require a detailed separate study) certainly suggests that Italy has not been using ICT or telecommunications as an engine for economic growth. In the current economic situation, however, this finding assumes more urgency. Several sectors ranging from automobiles to insurance are encountering serious financial troubles, and in many cases governments are being asked to provide bail-outs or public assistance to prevent job losses and spur growth. Yet there are many countries such as Italy that are performing below their potential when it comes to utilising ICT as an engine for growth. Governments should consider the unused potential of ICT in the calculations they make in the coming months. It may be that there is significant economic growth to be had from unleashing the potential of ICT by designing supportive regulatory policies, and even considering the selective use of public funds to promote broadband deployment in under-served areas, or offering employers incentives to provide ICT training. Are there any insights from the new Scorecard specific to the resource and efficiency-driven economies? Yes. The tendency for countries to achieve low scores is especially pronounced in the resource and efficiency-driven economies. There is also a suggestion that there are clearer constraints on performance for some countries. For the bottom 5 or 6 performers, it is very difficult to separate out ICT or connectivity from the overall developmental challenges that these countries face. It may well be the case that any effort to kick-start economic growth by investing heavily in connectivity-related infrastructure may provide only a limited return as the human capital and infrastructure capital roads, electricity, schools that is required to successfully utilise connectivity infrastructure will remain under-developed. This is best illustrated by the case of India, which may be a tech powerhouse in some respects, but also suffers from enormous problems relating to basic infrastructure and services. Connectivity and ICT can be an important part of economic growth for India, but at some point, connectivity will invariably be limited by the fact that there are large swathes of Indian society that do not have the human capital or the infrastructure (reliable power supply, for example) to make the most of connectivity. 26
28 Other indexes measuring technological or Internet achievement also consider factors such as business environment, rule of law, and quality of institutions. Why does the Connectivity Scorecard not look at these factors? In our view, the impact of these institutional and cultural factors is captured in the penetration rates and usage levels for technology, i.e. this impact is already embodied in the metrics that underpin the Connectivity Scorecard. Countries with good regulatory environments, good institutions and less corruption will tend to have higher connectivity. By adding in these factors as separate elements of the Scorecard, we would indeed be adding significant quantities of additional data, but not much more additional useful information. Are the scores of the innovation-driven economies and resource and efficiency-driven economies comparable? No. Our goal is to measure useful connectivity. Since the economic needs of the resource and efficiency-driven economies are different from those of the innovationdriven economies, it is appropriate to use different indicators/metrics for these countries. More extensive discussion of the methodology behind the Scorecard can be found in Appendix 2. Where can I find more information on individual countries? Country summaries will be made available on the website related to the Scorecard, 27
29 Table 1: Connectivity Scorecard 2009 results Rank Country Final Score Rank Country Final Score 1 United States Malaysia Sweden Turkey Denmark Chile Netherlands South Africa Norway Mexico United Kingdom Russia Canada Argentina Australia Brazil Singapore Colombia Japan Botswana Finland Thailand Ireland Iran Germany Ukraine Hong Kong SAR Tunisia France China New Zealand Philippines Belgium Egypt Korea Sri Lanka Italy Vietnam Czech Republic India Spain Indonesia Portugal Kenya Hungary Bangladesh Greece Pakistan Poland Nigeria
30 Table 2: United States 2009 performance versus 2008 performance Component 2009 Score Weight Consumer 0.57 (0.88)* 0.18 Infrastructure Consumer Usage & Skills Business Infrastructure Business Usage & Skills Government Infrastructure 0.69 (0.69)* (0.89)* (0.72)* (0.93)* 0.06 Government 0.94 (0.94)* 0.02 Usage & Skills Component 2008 Score Weight Consumer 0.44 (0.92)* 0.18 Infrastructure Consumer Usage & Skills Business Infrastructure Business Usage & Skills Government Infrastructure Government Usage & Skills 0.78 (0.80)* (0.84)* (0.80)* (0.91)* (0.90)* 0.03 *: The scores in brackets refer to the score achieved by the leading country in each subcategory. Thus, the leading country on consumer infrastructure achieved a score of 0.88 in 2009 on this sub-category alone. 29
31 Table 3: Scores for innovation-driven economies using Principal Components Analysis weights Rank Country Final Score 1 United States Sweden Denmark Norway Netherlands Canada Finland Singapore United Kingdom Australia Japan Korea Hong Kong SAR France Ireland Germany New Zealand Belgium Italy Spain Portugal Czech Republic Hungary Greece Poland
32 Figure 2: Correlation between Connectivity Scorecard 2009 and GDP per capita (at PPP rates) Innovation-driven economies R 2 = Connectivity Scorecard ,000 10,000 15,000 20,000 25,000 30,000 35,000 40,000 45,000 GDP PPP $ 31
33 Figure 3: Correlation between Connectivity Scorecard 2009 and GDP per capita (at PPP rates) Resource and efficiency-driven economies R 2 = Connectivity Scorecard ,000 4,000 6,000 8,000 10,000 12,000 14,000 16,000 GDP PPP $ 32
34 Figure 4: Correlation between Connectivity Scorecard 2009 and UN Human Development Index Innovation-driven economies R 2 = Connectivity Scorecard HDI 33
35 Figure 5: Correlation between Connectivity Scorecard 2009 and UN Human Development Index Resource and efficiency-driven economies R 2 = Connectivity Scorecard HDI 34
36 Figure 6: Comparative Cluster analysis of Connectivity Scorecard 2009 and GDP per capita (PPP) Innovation-driven economies US Norway Ireland Denmark United Kingdom Hong Kong Canada Sweden Netherlands Australia Singapore Finland Japan Germany France Belgium Italy New Zealand Spain Korea Greece Portugal Hungary Czech Republic Poland Ireland Italy Spain Greece Sweden Hong Kong US Sweden Denmark Netherlands Norway United Kingdom Australia Canada Singapore Finland Japan Ireland Germany France Hong Kong New Zealand Belgium Korea Italy Czech Republic Spain Greece Hungary Poland Portugal GDP (PPP) NSNSC2 35
37 Figure 7: Comparative Cluster analysis of Connectivity Scorecard 2009 and GDP per capita (PPP) Resource and efficiency-driven economies Argentina Malaysia Chile South Africa Russia Mexico Botswana Turkey Brazil Thailand Iran Tunisia Colombia China Ukraine Philippines Egypt Sri Lanka Indonesia Vietnam India Kenya Bangladesh Pakistan Nigeria Argentina Botswana Thailand, Iran, Tunisia Indonesia Malaysia Turkey Chile South Africa Russia Mexico Argentina Brazil Colombia Botswana Thailand Iran Tunisia Ukraine Philippines China Egypt Sri Lanka Vietnam Indonesia India Kenya Bangladesh Pakistan Nigeria GDP (PPP) NSNSC2 36
38 Figure 8: Investment in ICT as a share of total investment 37
39 Table 4: Mapping indicators onto categories Innovation Scorecard Category Indicator 38
40 Table 5: Mapping indicators onto categories Resource and efficiency Scorecard Category Indicator 39
41 Table 6: Sources Innovation Scorecard Indicator Main Source Population "World Telecommunication/ICT Indicators", International Telecommunication Union, 2007 Number of 3G subscribers per 100 inhabitants Informa, 2007 Average teledensity Various national (regulatory) authorities Broadband household penetration Various national (regulatory) authorities Fastest advertised broadband OECD Broadband Statistics portal, Table 5e, 2007 Fibre broadband per 100 inhabitants Various national (regulatory) authorities Internet users per 100 inhabitants "World Telecommunication/ICT Indicators", International Telecommunication Union, 2007 Internet banking (% of population) "Preparing Europe s digital future i2010 Mid-Term Review, Volume 3: ICT Country Profiles", Commission to the European Communities, April 2008 PSTN, mobile and VOIP minutes per capita Various national (regulatory) authorities SMS messages per capita Informa, 2007 Adjusted software spending by consumers "Digital Planet 2008", World Information Technology and Services Alliance Personal computers per 100 inhabitants "ICT at a Glance Tables", from "Information and Communications for Development 2006: Global Trends and Policies", The World Bank, 2006 Application secure internet servers per million "2007 World Development Indicators, Table 5.11: The Information Age", The World Bank 40
42 Indicator Main Source Adjusted business software and hardware spending per capita "Digital Planet 2008", World Information Technology and Services Alliance Enterprise access lines per 1,000 inhabitants The Yankee Group, Global Enterprise Forecast, October 2008 update Internet selling, % of businesses with 10 or more employees Internet buying, % of businesses with 10 or more employees "OECD Key ICT Indicators, Table 7b. Internet selling and purchasing by industry, 2007" "OECD Key ICT Indicators, Table 7b. Internet selling and purchasing by industry, 2007" % of persons employed with ICT user skills "Preparing Europe s digital future i2010 Mid-Term Review, Volume 3: ICT Country Profiles", Commission to the European Communities, April 2008 % of persons employed with ICT specialist skills "Preparing Europe s digital future i2010 Mid-Term Review, Volume 3: ICT Country Profiles", Commission to the European Communities, April 2008 Ratio of corporate data revenue to switched access revenue Adjusted computer services spending by business per capita The Yankee Group, Global Enterprise Forecast, October 2008 update "Digital Planet 2008", World Information Technology and Services Alliance Share of IP and Ethernet in corporate data revenue The Yankee Group, Global Enterprise Forecast, October 2008 update Mobile enterprise messaging B2B ARPU The Yankee Group, Global Enterprise Forecast, October 2008 update e-government ranking "Improving Technology Utilization in Electronic Government around the World, 2008", Darrell M. West, Governance Studies, The Brookings Institution 41
43 Indicator Main Source % of schools with broadband access "Preparing Europe s digital future i2010 Mid-Term Review, Volume 3: ICT Country Profiles", Commission to the European Communities, April 2008 Adjusted government software and hardware spending per capita Adjusted computer services spending by government per capita "Digital Planet 2008", World Information Technology and Services Alliance "Digital Planet 2008", World Information Technology and Services Alliance % of population using e-government services "Preparing Europe s digital future i2010 Mid-Term Review, Volume 3: ICT Country Profiles", Commission to the European Communities, April 2008 % of enterprises using e-government services "Preparing Europe s digital future i2010 Mid-Term Review, Volume 3: ICT Country Profiles", Commission to the European Communities, April
44 Table 7: Sources Resource and efficiency Scorecard Indicator Main Source PSTN subscriptions per capita Various national (regulatory) authorities Mobile cellular subscribers per 100 inhabitants Internet subscribers per 100 inhabitants "World Telecommunication/ICT Indicators", International Telecommunication Union, 2007 "World Telecommunication/ICT Indicators", International Telecommunication Union, 2007 Broadband household penetration (%) Various national (regulatory) authorities Population covered by mobile telephony (%) "ICT at a Glance Tables", The World Bank, 2006 Literacy rate UNESCO Institute for Statistics, Data Centre Internet users per 100 inhabitants % of internet users who are female "World Telecommunication/ICT Indicators", International Telecommunication Union, 2007 "Female internet users as % of total internet users", International Telecommunication Union, 2002 PSTN, mobile and VOIP minutes per capita Various national (regulatory) authorities SMS messages per capita Informa, 2007 Secure internet servers per million inhabitants "ICT at a Glance Tables", The World Bank, 2006 Personal computers per 100 inhabitants "ICT at a Glance Tables", The World Bank, 2006 International internet bandwidth bits per capita Adjusted business software and hardware spending per capita "2007 World Development Indicators, Table 5.11: The Information Age", The World Bank "Digital Planet 2008", World Information Technology and Services Alliance 43
45 Indicator Main Source School enrolment, secondary (% net) UNESCO Institute for Statistics, Data Centre International outgoing fixed telephone traffic (minutes per person) Adjusted computer services spending by business per capita "World Telecommunication/ICT Indicators", International Telecommunication Union, 2007 "Digital Planet 2008", World Information Technology and Services Alliance e-government ranking "Improving Technology Utilization in Electronic Government around the World, 2008", Darrell M. West, Governance Studies, The Brookings Institution Adjusted government software and hardware spending per capita Adjusted computer services spending by government per capita "Digital Planet 2008", World Information Technology and Services Alliance "Digital Planet 2008", World Information Technology and Services Alliance Government services online "Improving Technology Utilization in Electronic Government around the World, 2008", Darrell M. West, Governance Studies, The Brookings Institution 44
46 Appendix 1: Connectivity Scorecard 2008, further details This section recapitulates sections 3 and 4 of the report that accompanied the launch of Connectivity Scorecard These sections provide further methodological detail and context, which may be particularly useful for those not familiar with the 2008 Scorecard. In particular, we summarize our discussion of some of the results that were the focus of significant comment e.g., the positions of Korea and the United States in the innovation-driven economies, and the positions of Russia, China and India in the resource and efficiency-driven economies. These discussions might be a useful background against which to judge the results of Connectivity Scorecard
47 Connectivity Scorecard 2008: Methodology and weighting Basic methodology and weighting scheme Conceptual basis As a starting point, we divided the economy into three distinct groups of economic actors businesses, consumers and governments. We then considered how best to assign weights to these three distinctive sets of economic actors. Several options were available to us: using an analytical basis to derive weights, such as Principal Components Analysis (PCA) or Data Envelopment Analysis (DEA); expert-based weighting systems, such as budget allocations, focus groups or opinion surveys; or deriving the relative weights from fundamental economic precepts. 9 The last option was the most appealing to us, since it had a thoroughly intuitive basis and could be derived on a basis that was consistent with existing research on the role of ICT in expanding economic growth and productivity. For example, much of the economic literature attributes significant gains in productivity from the wider diffusion of ICT into the economy. However, this same literature finds that gains from ICT have been uneven, with the U.S. and Australia gaining the most, and European countries gaining rather less, and the gains from ICT arise from both technological gains and enhanced efficiencies in ICT production, and also from increasing and more sophisticated ICT usage. 9 Weighting methods, aggregation methods and imputation of missing data in the construction of complex composite Indexes are described in detail in the OECD s Handbook on Constructing Composite Indicators: Methodology and User Guide, OECD Statistics Working Paper, August
48 Thus, we needed to consider infrastructure, spending and usage aspects of ICT, and decide how to weight these aspects on the basis suggested by existing economic estimates. 10 Our ultimate strategy can be summarised as follows: In order to allocate weights between the three over-arching categories of consumers, governments and businesses we use data from national statistical offices. In particular, we made extensive use of national Input-Output tables. We measured the weight of business in the economy as the ratio of intermediate consumption and investment relative to the sum of intermediate consumption, investment and consumption by governments and consumers. Government s share is thus estimated as the share of government consumption in the sum of intermediate consumption, investment and consumption by governments and consumers. Consumers share is computed in a similar way. We then had to allocate weights to the infrastructure and usage and skills sub-categories for consumers, businesses and governments alike. We derived these splits by considering the relative contribution of infrastructure and usage and skills to productivity growth (using labour force skills as a proxy for usage and skills ) for businesses and governments, and hoped to do so for utility (for consumers); Estimates of the sources of productivity/economic growth can be obtained for many OECD economies. For example, for the United States, we based the split between infrastructure and usage contributions (to business and government productivity) on estimates of the contribution of ICT capital and labour skills to GDP growth in the United States. These estimates are provided in Jorgenson and Stiroh (2004). The most harmonised measures that we could find were contained in the EU Klems database available from the Groningen Growth and Development Centre (GGDC). For consumers, we attempted to find literature that showed the relative welfare contribution of access to infrastructure (e.g., having access to basic telephone service) 10 There are many studies on the impact of ICT on economic growth and productivity. Among the ones that we have referenced are Ho, Jorgenson and Stiroh (2004), and O Mahony, Timmer and Van Ark (2007), along with a host of publications from National Statistical Offices such as Statistics Canada and the Australian Productivity Commission. 47
49 versus usage of that infrastructure (e.g., from making telephone calls). For example, a study that calculated the consumer surplus from having the option to make calls (i.e., having access to a telephone) versus consumer surplus from minutes spent on the telephone would have matched our goals. While there is considerable literature on consumer surplus from telephony, we were unable to find studies that clearly divided that surplus between the access and usage facets of telephony. 11 Thus, we gave equal weight to both usage and infrastructure for consumers. Non-OECD country exceptions For resource and efficiency-driven economies, it is harder to find good data, or academic studies, that estimate the contribution of ICT capital to growth. Thus, we have used the contribution of overall physical capital relative to labour composition changes to growth in several developing countries. Some estimates can be found in (for example) Bosworth and Collins (2001). In many cases, however, we have had to impute data using standard techniques of imputation referred to in the OECD s handbook on Index construction 12. Indicators and sources used Once we had established the conceptual basis for the weightings that we had used, we then had to choose specific indicators and assign them to various categories. We relied upon a wide variety of sources the World Bank, the ITU, the OECD, and the i2010 programme of ICT statistics being implemented by Europe s national statistical agencies were major sources of information for much of the basic data on infrastructure, such as broadband penetration rates, telephone lines in use, literacy rates, and even gender breakdowns of Internet usage. Other useful sources of information were individual countries statistical offices, Brown University s E-government rankings and private vendors such as Frost and Sullivan and Gartner. We also used proprietary data from Nokia Siemens Networks to construct measures of mobile and Internet usage. For each component of the Scorecard, countries are benchmarked against the best in class in their tier; thus if a country was best in all dimensions, it would score a maximum 11 Several authors such as Lester Taylor (1994) refer to valuing access as an option value, but there are few clear-cut studies that quantify this option value in the way that we would have been able to use. 12 Handbook on constructing composite indicators: methodology and user guide (Nardo et al., 2005) 48
50 of If a country scores a 5.0 for example, that means it is 50% of the best in-class over all countries in its category. The large number of business infrastructure and usage indicators in our Scorecard clearly distinguishes our efforts from those of previous researchers. We have collected data on business lines, the proportion of such lines that are VoIP-based, the prevalence and extent of business-dominated services such as value-added data services and web hosting. In addition, we have been fortunate enough to access very recent survey data from Nokia Siemens Networks on mobile usage by business users. The actual calculation of the Connectivity Scorecard results can be represented mathematically as follows: Index Score = + + w ci w w bi gi 1 CI 1 BI 1 GI CI j = 1 BI l = 1 GI S n = 1 Country j S S Country l Country n _ i _ i _ i w cu w w bu gu 1 CU 1 BU 1 GU CU k = 1 BU m = 1 GU S p = 1 Country k S S Country m Country p _ i _ i _ i Where: w ci = weighting for consumer infrastructure w cu = weighting for consumer usage & skills w bi = weighting for business infrastructure w bu = weighting for business usage & skills w g i = weighting for government infrastructure w gu = weighting for government usage & skills CI = number of consumer infrastructure indicators CU = number of consumer usage & skills indicators BI = number of business infrastructure indicators BU = number of business usage & skills indicators GI = number of government infrastructure indicators GU = number of government usage & skills indicators S j Country i = score on indicator j for country_i Table A-1 provides a listing of the countries for which we have prepared a Scorecard, grouped according to their WEF classification. 49
51 Table A-1: Countries according to WEF Classification Tier Country Country Resource-driven economies China Nigeria India Philippines Efficiency-driven economies Czech Republic Poland Brazil Russia Hungary Korea Mexico South Africa Malaysia Innovation-driven economies Sweden Germany Spain UK Hong Kong Canada France Italy Finland Japan United States Australia 50
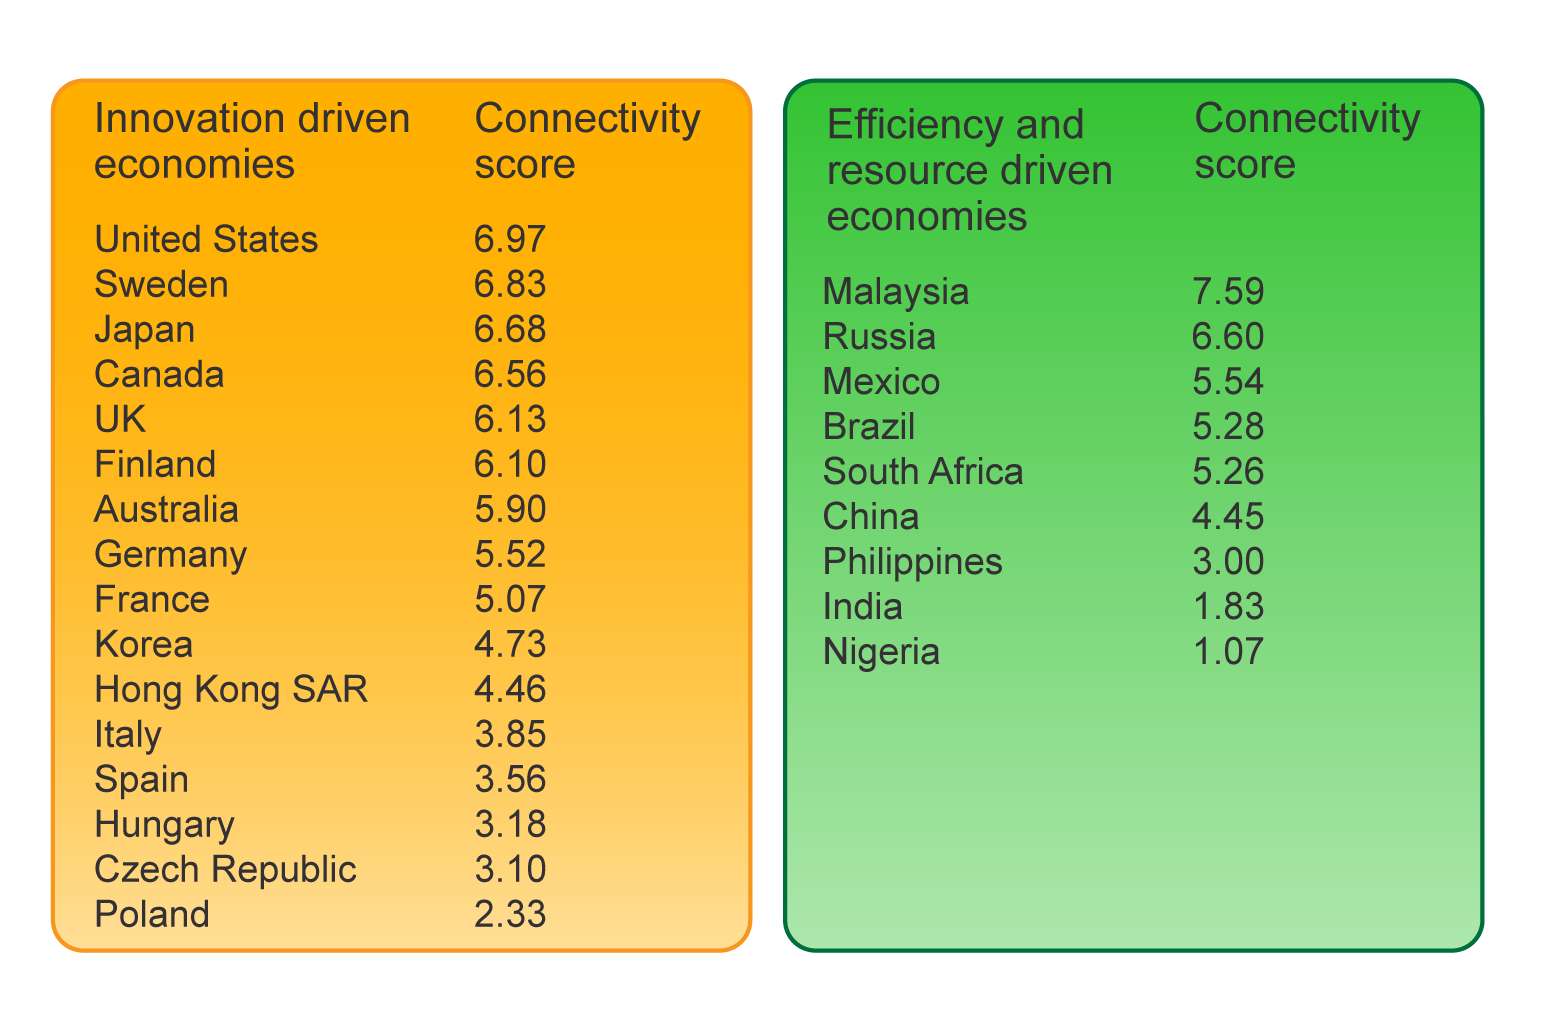
52 Connectivity Scorecard 2008: Discussion of results Major findings Low scores The average scores on our Scorecard are significantly lower than scores on other Indexes. The leading country in the Connectivity Scorecard has a connectivity score of 6.97 out of 10. By contrast, this same country (the U.S.) scores nearly 9 out of 10 on the e-readiness Index. This is a reflection of the multi-dimensional nature of our Scorecard, the weighting system that we utilised, and the attention to country-specific economic structures that are embedded in the weightings. Low scores are a reflection of unutilised potential from connectivity. They can be interpreted as a call to arms for governments and businesses. They crucially also suggest significant potential for further economic gains from connectivity. Dispersion and a connectivity elite Even among countries that are considered relatively advanced and affluent economies, there is considerable dispersion in connectivity performance. We find a relatively small number of countries scoring six or above on the Scorecard. Most of these are either Anglo-Saxon or Nordic countries with the one exception of Japan. Our findings suggest a scope for considerable catch-up potential in Continental and Eastern Europe. It appears that in some countries there is adequate infrastructure, which is not matched by creative use of the infrastructure by businesses and government. Substantial work to do The Connectivity Scorecard shows clearly that almost every nation has substantial work to do before achieving an ideal level of connectivity. The mean level of connectivity in the 16 Tier 4 and Tier 5 economies is just over five. Thus, there is no room for complacency in even the most advanced or connected of economies and much work to be done in all sectors of all economies. The best of connectivity is yet to come Even the best performing countries score below 5 out of 10 on at least one indicator. Since performance is benchmarked against the existing best-in-class performers, this strongly suggests that in all nations there at least some technologies that are being 51
53 under-deployed or under used. Our research shows strong potential for significant economic gains merely from better use of existing technology. When we consider that even more transformative technology is on the horizon, we find it difficult to believe that any country is saturated with ICT. The best of connectivity is yet to come. Discussion of individual country results Korea s relatively low score One of the most surprising results of our Scorecard is the relatively low ranking of Korea. Korea typically scores very highly on other indices; it is the top performer on the ITU s DOI, and on the E-Readiness Index, Korea is again a strong performer, finishing 8 th out of 69 countries. Using our weights and set of indicators, however, Korea finishes only 10 th in the rankings of 16 innovation-driven and emerging economies benchmarked. Korea scores well in the government and consumer components of the Scorecard, which tend to dominate other indices, but quite poorly in business usage and complementary assets and services. Simply put, Korea has spent a good deal of public money to encourage the spread of a very sophisticated broadband infrastructure, and this tends to push up its score on measures where implicitly or explicitly such measures are given a high weighting. However, Korea does not appear to be a top performer in the business arena indeed, Korean productivity on a per worker basis is much lower than European or North American productivity, and the difference is even more pronounced on a per-hour worked basis given that Korean workers work several hundred hours per year more than their counterparts in Europe. Other sources (not used in computing index scores) confirm that in business telephony usage and spending, Korea lags well behind other Asia-Pacific innovation-driven nations like Japan and Australia in the use of business enterprise telephony solutions. Frost and Sullivan data show that: In 3Q 2005, the Korean market for IP telephony generated revenues of $11.8 million, compared to $110.5 million for Japan, and $49.3 million for Australia; In 3Q 2005, the Japanese enterprise telephony market generated revenues of $285 million, compared to $41 million for Korea, and $93 million for Australia; and The differences between Korea, Japan and Australia cannot be explained in terms of population Australia s population is half the size of Korea s, and Japan s markets are between 6 and 10 times the size of Korea s, although the population is only 2.5 times that of the Korean population. 52
54 United States in 1 st position A perhaps unanticipated result of our research is the U.S. finishes first. Other indices have ranked the U.S. fairly low relative to Western Europe and East Asia, although the EIU e-readiness index also ranked the U.S. first. When one considers consumer infrastructure measures as is typical of most indices the U.S. performance is mediocre on some metrics. However, our results are actually consistent with much published research showing that the U.S. economy has benefited more strongly from ICT than most others, with the primary difference lying in more intensive ICT use by business. India, China and Russia Another striking disparity in our Connectivity Scorecard is in the resource and efficiencydriven economies. The key difference is between China and India. India scores just 1.83 on our modified Scorecard for resource and efficiency-driven economies, compared to 4.45 for China. Both countries, of course, have a significantly long way to go before they can claim that they are meaningfully connected societies, but the Indian performance is especially poor. Much has been made of late of the burgeoning competition between the two superpower economies of the future, but it is clear from this research that both India and China still lag a considerable way behind the innovation-driven economies and indeed behind many Efficiency driven economies. India scores lower than China on virtually every major dimension of connectivity consumer infrastructure and usage, business infrastructure and usage, and government infrastructure and usage. Literacy in India is substantially lower, and there is a glaring gender disparity in Internet access (only 23% of Internet users are female in India). For India, the immediate connectivity priority would appear to be better infrastructure provision, followed by better provision of complementary capital (e.g., better overall education). It may surprise some that Russia performs well in our Scorecard. However, when benchmarked against China, India and Latin American economies, it is not surprising that Russia does well. Russia scores well in literacy, gender equality in Internet access, and in usage of technologies such as mobile by business users. The Scorecard captures the fact that Russia has a relatively strong human capital endowment that may serve it well in making the transition to being an innovation-driven economy. 53
55 Table 4 below provides some comparisons between India, China and Russia, the three giants among emerging markets (these are giants in terms of their population size and endowment of military and natural resources). Table A-2: India, China and Russia compared on basic metrics Indicator India China Russia Adult literacy rate 61% 91% 99% Female home internet users 23% 40% 38% Mobile usage (Business users) Mobile internet usage (Business users) N.B: We have discontinued use of the mobile and Internet usage measures for the 2009 scorecard, owing to data limitations 13 Mobile and Internet usage by business users are composite measures created by LECG using Nokia Siemens Networks Pulse and mobile penetration data. The composite measures capture mobile phone penetration, access to technology and frequency of use. A higher score reflects a higher rate of mobile or Internet usage among business use. 54
56 Appendix 2: Some Q&As related to 2009 methodology What as the merits of preparing separate scorecards for the innovation-driven and resource and efficiency-driven economies? By separating out innovation-driven from resource and efficiency-driven economies, we have been able to incorporate variables for the innovation-driven economies that would not have been usable in a combined Scorecard for both types of economy. This has allowed us to avoid falling into the trap of focussing only on basic connectivity metrics such as mainline and mobile telephones that are available for all countries, and include measures such as fibre-to-the-home penetration and 3G penetration in the Scorecard, measures on which even the advanced countries show significant levels of heterogeneity. One of the early criticisms of the United Nations Human Development Index (HDI) was that it focussed too much on basic development needs, and thus it was difficult to separate out performance between the advanced (what we call innovationdriven) nations. For instance, the adult literacy rate in most advanced nations exceeded 95 percent, and life expectancy levels were quite similar. Sen and Anand (1994) suggested using an augmented HDI that was better able to capture the heterogeneities that were relevant to assessing advanced nations performance. 14 As an example of just how non-comparable the scores between countries are, we looked at the ranking and the score that Malaysia would have received had it been ranked using the same measures as the innovation-driven economies. Malaysia would have scored below Poland, which was then the worst performing economy in the innovation Scorecard. 14 Amartya Sen and Sudhir Anand, Human Development Index: Methodology and Measurement, United Nations Human Development Report Office, Occasional Paper,
57 Is the Connectivity Scorecard measuring an absolute level of connectivity? The Connectivity Scorecard has a primary goal of providing information about the relative performance of countries, with the emphasis being on the ranking of countries. The absolute scores that countries achieve are secondary in importance, although there is significant information contained in the absolute scores. For instance, the relatively low average absolute scores, and the dispersion of these scores, provide significant evidence that countries are under-performing in terms of utilising the full potential of computers, telecommunications and software. In this sense, the Connectivity Scorecard is very similar to the UN Human Development Index and other indices that are essentially relative rankings. Connectivity is not a concept that can be easily defined in terms of units for instance, it makes no sense to talk about a connectivity level of 6.7, just at it makes no sense to talk about a Human Development level of 6.7. However, it makes eminent sense to talk of a broadband penetration rate of 16 lines per 100 inhabitants, or GDP per capita of $15,000, for example. Connectivity and human development are composites of many different attributes with different units, and thus are not absolute measures. In this sense, the Connectivity Scorecard is no different from a Beauty Scorecard or a Humanity Scorecard. Given the above, does it make sense to even talk about connectivity if it is such a subjective concept? How do we know that the Scorecard is measuring anything meaningful? The issues that we are dealing with in defining connectivity are no different from those that other researchers face in combining several different attributes (or metrics or indicators ) into a composite attribute. Fortunately, there are statistical measures that can be utilised to measure whether the attributes are measuring the same underlying concept. One such measure is called the Cronbach Alpha reliability test, which yields an Alpha Statistic of when performed on the indicators that make up the Scorecard for Innovation-driven economies. Values of 0.70 or above are normally considered as acceptable evidence that the underlying indicators are measuring the same latent construct or are uni-dimensional. Thus, at the very least, the Scorecard is not a collection of random indicators that we have grouped together. Rather these indicators are measuring well the same underlying phenomenon, which we label connectivity. 56
58 However, is it still not true that the Connectivity Scorecard is a collection of subjectively chosen indicators that are then combined and weighted subjectively? Yes, the Connectivity Scorecard is ultimately based upon subjective decisions about which indicators to include or exclude and how to weight these indicators. However, this is true of virtually any composite Scorecard or index. That said, there should be some logical or statistical merit to the choice of indicators and weights. Why did you not use conventional statistical techniques to generate weightings? Conventional statistical techniques do not always have an appealing intuitive basis. As mentioned previously, we looked at using Principal Components Analysis to look at appropriate weightings for the six major sub-segments. Principal Components Analysis suggested that the highest weight should be put on government usage, but this has little intuitive appeal and no basis in economics. The fact that the rankings of countries are fairly similar when we do use PCA was, however, reassuring (see Table 3 of the main report). Intermediate consumption is not part of GDP. Why are you using it in your weightings for the consumer, business and government segments? Intermediate consumption is one indication of the level of business-to-business activity that GDP does not measure. Had we simply used shares of GDP in the weights, then the only business component would have been investment or gross fixed capital formation (GFCF), and the consumer segment would have accounted for 50% to 70% weight in most countries. Given that business usage of ICT and telecommunications is the key driver of productivity and that productivity gains are the key driver of sustainable long-term growth, rewarding countries for high levels of consumer-oriented technology deployment would have missed this obvious link to economic performance. The split between infrastructure and usage/skills is based upon the historical contribution to growth/productivity of ICT capital deepening relative to improvements in the composition of labour effort supplied. Please comment on this choice. An ideal measure of the split between infrastructure and usage/skills would have involved utilising information about the relative marginal returns from ICT capital relative to labour composition. However, such data are not available especially at a country-bycountry level. Thus, information about the contribution to growth of capital relative to 57
59 labour composition provided at least one way of making a linkage to economic performance. The weights placed on individual categories vary by country. In many other Scorecards and composite indices weights are constant across countries. Please comment on the effect that this has on the Scorecard? The overall effect of the weighting system on the Scorecard is simply not that great. This can be seen either by looking at the results when we use Principal Components Analysis to weight the major sub-categories, or by looking at the results when we use simple unweighted scores (i.e., all indicators are given equal weights). Table A-3 shows the results for the Innovation-driven economies if we simply used an un-weighted approach. There are some differences from the scorecard results that we get using our weighted approach, but since the emphasis is on rankings rather than absolute scores, it is worth noting that the general findings from the Scorecard still hold true. In any case, the use of individual country-level weights is economically more sensible than the use of uniform weights. Countries simply have different economic structures and different needs and priorities. 58
60 Table A-3: Scorecard results using un-weighted approach Rank Country Final Score 1 United States Sweden Denmark Netherlands Norway Canada Finland Singapore United Kingdom Hong Kong SAR Australia Japan Korea France Ireland Germany New Zealand Belgium Italy Spain Portugal Czech Republic Hungary Greece Poland 2.51 Can you comment on the allocation of indicators to the consumer, business or government categories? There are some indicators e.g., broadband penetration, minutes of use for telephony services, and PC penetration that likely reflect both business and consumer infrastructure uptake and usage. Thus, there were some choices involved in allocating these categories to different buckets. A measurement issue that we and other researchers have to contend with is incredibly poor data relating to business users, particularly with respect to broadband lines. Moving on to the scoring system, can you explain why you used a relative to best in class approach? How sensitive are your results to this approach? As with every composite index that includes many different indicators that are denominated in different units, we had to use some form of normalisation in constructing the score. The formulation that we used had some intuitive appeal for the following reasons: a country s score is measured by where it stands on a continuum ranging from 59
61 zero to the best known performance by any country. The best known performance can be seen as a frontier, while the country s relative performance can be seen as one indication of how close it is to this frontier. The frontier itself might be seen as representing potential performance, and thus the country s normalised score can be seen as an indicator of how much potential the country has for improvement. This scoring method is actually quite similar to the scoring method used in the UN Human Development Index. There the normalised score that a country, denoted by i, receives on a particular indicator x is given by xi x max x x min = min x score, i In this method, (the HDI method ) the score is the ratio of the difference between an individual country s distance from the worst country to the best performing country s difference from the worst performing country. In other words, the worst performing country is set as a reference point. The practical effect of using this UN Human Development Index approach in our Connectivity Scorecard would have been to increase dispersion on those metrics where the average scores that countries achieved were high and where the standard deviation of country scores was relatively low. Thus for instance if the average level of a variable was 65 percent, with the worst country scoring 30 percent, and the best country 90 percent, then under the HDI scoring system the average country would receive a score of (65-30)/(90-30) = 35/60 =0.58. Under the scoring system that we have used, the score would be 65/90 or The UN HDI system results in a 0 to 1 continuum on each variable, which our methodology does not. The result is that using the former method significantly increases the dispersion of the country scores. Table A-4 provides these results. The methodology used by the UN Human Development Index might be more appropriate if there is a high degree of heterogeneity among groups of countries (e.g., as there is among advanced nations on basic literacy metrics) on certain variables. 60
62 Table A-4: Results from Connectivity Scorecard 2009 using UN Human Development Index scoring method Innovation Scorecard Resource and efficiency Scorecard Rank Country Final Score 1 United States Sweden Denmark Netherlands Norway United Kingdom Singapore Canada Australia Finland Japan Ireland Hong Kong SAR Germany France New Zealand Belgium Italy Korea Czech Republic Spain Portugal Hungary Greece Poland 1.02 Rank Country Final Score 1 Malaysia Turkey Chile South Africa Russia Argentina Mexico Brazil Colombia Thailand Botswana Ukraine Iran Tunisia China Philippines Egypt Sri Lanka Vietnam Indonesia India Kenya Nigeria Bangladesh Pakistan
63 In both these scoring methods, the goalposts keep shifting. That is countries are affected by other countries performance. Is this not a problem? The use of normalised scoring techniques that look at distance from a reference point that changes over time does make certain inter-temporal comparisons quite difficult. For instance, if one country improves its broadband penetration and other countries do not, then that country scores more highly on the Connectivity Scorecard. But, if as is more realistic, most countries improve their performance on broadband penetration, then this may even mean that an improvement in the absolute score of a given country could be dwarfed by a deterioration in the country s relative position, and it is this relative position that is important in indexes such as the Connectivity Scorecard or the UN HDI. The practical implication is that it is hard to make comparisons of absolute scores over time. The reality is that ultimately the purpose of the Connectivity Scorecard is to provide an indication of rankings of countries on a construct called connectivity, but there is ultimately no absolute level of connectivity that one can talk about. Thus, the Scorecard is best viewed as a snapshot of where countries stand relative to each other at this moment in time, and not as an indicator of an absolute level of achievement. Two particular problems (already discussed in the body of the report) with respect to comparisons of Connectivity Scorecard 2009 with Connectivity Scorecard 2008 are that we used different indicators and different data sources, and we added 25 more countries to our sample. These factors make comparisons of absolute scores even more hazardous than usual. Given this information, is there really any merit to updating the data? Yes. Countries relative rankings change over time. In a dynamic setting such as the telecommunications and technology sector, countries frequently catch-up and leapfrog each other at rapid rates. For example, the US relative position on broadband penetration has declined greatly since 2000/2001, when it was fourth in the world. The Connectivity Scorecard notices such changes in relative position. 62
64 Is there no rigorous way to provide meaningful inter-temporal comparisons? Sen and Anand (1994) suggest that a logical way to make inter-temporal comparisons for indexes such as the Human Development Index and the Connectivity Scorecard is to fix the goalposts. They propose doing this by looking at maximum and minimum values for individual variables over the entire period of time that is one is analysing. For example, if there were two variables in the index telephone mainline penetration and adult literacy rates one could fix the goalposts so that the maximum to which we were referring to was the maximum for the entire period under consideration. If country i increased its mainline telephone penetration rate from 5 lines per 100 population to 15 lines per 100 population over the period from 1980 to 2009, and the maximum penetration rate that any country achieved over this period was 50 per 100 population, country i s score on mainline telephone penetration would have increased from 0.1 to 0.3 (on a 0 to 1 scale). This would arguably be a measure of absolute progress against a fixed reference point. Likewise, literacy rates could be referenced against a maximum in the same manner. The complication with the Sen and Anand methodology is that they state that it is necessary to consider not just the maximum (and minimum, if relevant) over the entire period to date, but also to consider the theoretical maximum and minimum achievable in the foreseeable future. In any case, inter-temporal comparisons may only make sense when one has several years of data that one can track. Thus, it may not be worth comparing countries between 2007 and 2008, but between 2005 and 2010, the exercise may make more sense. 63
65 Bibliography Robert W. Crandall and Charles L. Jackson (Jul 2001), The $500 Billion Opportunity: The Potential Economic Benefit of Widespread Diffusion of Broadband Internet Access, as of 22 January 2008 Mary O'Mahony, Marcel P. Timmer and Bart van Ark (Apr 2007), EU KLEMS Growth and Productivity Accounts: an Overview, National Institute Economic Review, No. 200, pp Dale W. Jorgenson, Mun S. Ho and Kevin J. Stiroh (Dec 2004), Will the US Productivity Resurgence Continue?, Current Issues in Economics and Finance, Vol. 10, pp. 1-7 Lester D. Taylor (1994), Telecommunications Demand in Theory and Practice, Springer, edition 1 Barry P. Bosworth and Susan M. Collins (1999), Capital Flows to Developing Economies: Implications for Saving and Investment, Brookings Papers on Economic Activity, Vol. 1999, No. 1, pp Michela Nardo et al. (Aug 2005), Handbook on Constructing Composite Indicators: Methodology and User Guide, OECD Statistics Working Paper Amartya Sen and Sudhir Anand, Human Development Index: Methodology and Measurement, United Nations Human Development Report Office, Occasional Paper,
2015 Country RepTrak The World s Most Reputable Countries
 2015 Country RepTrak The World s Most Reputable Countries July 2015 The World s View on Countries: An Online Study of the Reputation of 55 Countries RepTrak is a registered trademark of Reputation Institute.
The Role of Banks in Global Mergers and Acquisitions by James R. Barth, Triphon Phumiwasana, and Keven Yost *
 The Role of Banks in Global Mergers and Acquisitions by James R. Barth, Triphon Phumiwasana, and Keven Yost * There has been substantial consolidation among firms in many industries in countries around
Appendix 1: Full Country Rankings
 Appendix 1: Full Country Rankings Below please find the complete rankings of all 75 markets considered in the analysis. Rankings are broken into overall rankings and subsector rankings. Overall Renewable
Consumer Credit Worldwide at year end 2012
 Consumer Credit Worldwide at year end 2012 Introduction For the fifth consecutive year, Crédit Agricole Consumer Finance has published the Consumer Credit Overview, its yearly report on the international
Global payments trends: Challenges amid rebounding revenues
 34 McKinsey on Payments September 2013 Global payments trends: Challenges amid rebounding revenues Global payments revenue rebounded to $1.34 trillion in 2011, a steep increase from 2009 s $1.1 trillion.
41 T Korea, Rep. 52.3. 42 T Netherlands 51.4. 43 T Japan 51.1. 44 E Bulgaria 51.1. 45 T Argentina 50.8. 46 T Czech Republic 50.4. 47 T Greece 50.
 Overall Results Climate Change Performance Index 2012 Table 1 Rank Country Score** Partial Score Tendency Trend Level Policy 1* Rank Country Score** Partial Score Tendency Trend Level Policy 21 - Egypt***
The big pay turnaround: Eurozone recovering, emerging markets falter in 2015
 The big pay turnaround: Eurozone recovering, emerging markets falter in 2015 Global salary rises up compared to last year But workers in key emerging markets will experience real wage cuts Increase in
Composition of Premium in Life and Non-life Insurance Segments
 2012 2nd International Conference on Computer and Software Modeling (ICCSM 2012) IPCSIT vol. 54 (2012) (2012) IACSIT Press, Singapore DOI: 10.7763/IPCSIT.2012.V54.16 Composition of Premium in Life and
Foreign Taxes Paid and Foreign Source Income INTECH Global Income Managed Volatility Fund
 Income INTECH Global Income Managed Volatility Fund Australia 0.0066 0.0375 Austria 0.0045 0.0014 Belgium 0.0461 0.0138 Bermuda 0.0000 0.0059 Canada 0.0919 0.0275 Cayman Islands 0.0000 0.0044 China 0.0000
International good practices in data collection and comparison
 International good practices in data collection and comparison Dr Tim Kelly Head, Strategy & Policy Unit, International Telecommunication Union (ITU) Workshop on benchmarking performance in network and
World Consumer Income and Expenditure Patterns
 World Consumer Income and Expenditure Patterns 2014 14th edi tion Euromonitor International Ltd. 60-61 Britton Street, EC1M 5UX TableTypeID: 30010; ITtableID: 22914 Income Algeria Income Algeria Income
Global Dynamism Index (GDI) 2013 summary report. Model developed by the Economist Intelligence Unit (EIU)
 2013 summary report. Model developed by the Economist Intelligence Unit (EIU)") Global Dynamism Index (GDI) 2013 summary report Model developed by the Economist Intelligence Unit (EIU) What is the Global Dynamism Index (GDI)? the GDI assesses the dynamism of 60 of the world's largest
Global Dynamism Index (GDI) 2013 summary report Model developed by the Economist Intelligence Unit (EIU) What is the Global Dynamism Index (GDI)? the GDI assesses the dynamism of 60 of the world's largest
2012 Country RepTrak Topline Report
 2012 Country RepTrak Topline Report The World s View on Countries: An Online Study of the Reputation of 50 Countries RepTrak is a registered trademark of Reputation Institute. Global Reputation Knowledge
Excerpt Sudan Fixed Telecommunications: Low Penetration Rates Get a Boost from Broadband Internet and VoIP Services
 Excerpt Sudan Fixed Telecommunications: Low Penetration Rates Get a Boost from Broadband Internet and VoIP Services This report is part of Pyramid Research s series of Africa & Middle East Country Intelligence
Triple-play subscriptions to rocket to 400 mil.
 Triple-play criptions to rocket to 400 mil. Global triple-play criptions will reach 400 million by 2017; up by nearly 300 million on the end-2011 total and up by 380 million on the 2007 total, according
360 o View of. Global Immigration
 360 o View of Global Immigration In a fast moving global economy, remaining compliant with immigration laws, being informed and in control is more challenging than ever before. We are a globally linked
Reporting practices for domestic and total debt securities
 Last updated: 4 September 2015 Reporting practices for domestic and total debt securities While the BIS debt securities statistics are in principle harmonised with the recommendations in the Handbook on
Benchmarking Broadband. New Zealand s path to generating global broadband envy
 Benchmarking Broadband New Zealand s path to generating global broadband envy September 2013 New Zealand s broadband story Fast broadband availability has increased significantly We are a broadband growth
E-Seminar. Financial Management Internet Business Solution Seminar
 E-Seminar Financial Management Internet Business Solution Seminar Financial Management Internet Business Solution Seminar 3 Welcome 4 Objectives 5 Financial Management 6 Financial Management Defined 7
HAS BRAZIL REALLY TAKEN OFF? BRAZIL LONG-RUN ECONOMIC GROWTH AND CONVERGENCE
 HAS BRAZIL REALLY TAKEN OFF? BRAZIL LONG-RUN ECONOMIC GROWTH AND CONVERGENCE COUNTRY PROFILE: A COUNTRY IN TRANSFORMATION POLICY RECOMENDATIONS COUNTRY PROFILE Brazilian Equivalent Population in The World
2015 Growth in data center employment continues but the workforce is changing
 Published in Conjunction with MARKET BRIEFING GLOBAL DATA CENTER EMPLOYMENT 2015 2015 Growth in data center employment continues but the workforce is changing Globally, the number of people working in
How To Get A New Phone System For Your Business
 Cisco Phone Systems Telemarketing Script Cold Call 1. Locate Contact: Name listed Owner General Manager / Office Manager Chief BDM (Business Decision Maker) Note: Avoid talking to IT since this is not
How many students study abroad and where do they go?
 From: Education at a Glance 2012 Highlights Access the complete publication at: http://dx.doi.org/10.1787/eag_highlights-2012-en How many students study abroad and where do they go? Please cite this chapter
Wireless network traffic worldwide: forecasts and analysis 2014 2019
 Research Forecast Report Wireless network traffic worldwide: forecasts and analysis 2014 2019 October 2014 Rupert Wood 2 About this report This report presents 5-year forecasts of wireless data traffic
FOR IMMEDIATE RELEASE CANADA HAS THE BEST REPUTATION IN THE WORLD ACCORDING TO REPUTATION INSTITUTE
 FOR IMMEDIATE RELEASE CANADA HAS THE BEST REPUTATION IN THE WORLD ACCORDING TO REPUTATION INSTITUTE Study reveals interesting developments in countries reputations amidst the Euro crisis, the rise of Asia
Digital TV Research. http://www.marketresearch.com/digital-tv- Research-v3873/ Publisher Sample
 Digital TV Research http://www.marketresearch.com/digital-tv- Research-v3873/ Publisher Sample Phone: 800.298.5699 (US) or +1.240.747.3093 or +1.240.747.3093 (Int'l) Hours: Monday - Thursday: 5:30am -
Doing Business in Australia and Hong Kong SAR, China
 Doing Business in Australia and Hong Kong SAR, China Mikiko Imai Ollison Private Sector Development Specialist Nan Jiang Private Sector Development Specialist Washington, DC October 29, 2013 What does
EMEA BENEFITS BENCHMARKING OFFERING
 EMEA BENEFITS BENCHMARKING OFFERING COVERED COUNTRIES SWEDEN FINLAND NORWAY ESTONIA R U S S I A DENMARK LITHUANIA LATVIA IRELAND PORTUGAL U. K. NETHERLANDS POLAND BELARUS GERMANY BELGIUM CZECH REP. UKRAINE
MAUVE GROUP GLOBAL EMPLOYMENT SOLUTIONS PORTFOLIO
 MAUVE GROUP GLOBAL SOLUTIONS PORTFOLIO At Mauve Group, we offer a variety of complete employee management services such as Global Employment Solutions (GES), Professional Employment Outsourcing (PEO),
IOOF QuantPlus. International Equities Portfolio NZD. Quarterly update
 IOOF QuantPlus NZD Quarterly update For the period ended 31 March 2016 Contents Overview 2 Portfolio at glance 3 Performance 4 Asset allocation 6 Overview At IOOF, we have been helping Australians secure
OCTOBER 2010. Russell-Parametric Cross-Sectional Volatility (CrossVol ) Indexes Construction and Methodology
 Indexes Construction and Methodology") OCTOBER 2010 Russell-Parametric Cross-Sectional Volatility (CrossVol ) Indexes Construction and Methodology SEPTEMBER 2010 Russell-Parametric Cross-Sectional Volatility (CrossVol) Indexes Construction
OCTOBER 2010 Russell-Parametric Cross-Sectional Volatility (CrossVol ) Indexes Construction and Methodology SEPTEMBER 2010 Russell-Parametric Cross-Sectional Volatility (CrossVol) Indexes Construction
World Broadband Statistics
 World Broadband Statistics Q1 2013 June 2013 Point Topic Ltd 73 Farringdon Road London EC1M 3JQ, UK Tel. +44 (0) 20 3301 3303 Email [email protected] 2 Contents 1 Introduction 3 2 Global and
Sulfuric Acid 2013 World Market Outlook and Forecast up to 2017
 Brochure More information from http://www.researchandmarkets.com/reports/2547547/ Sulfuric Acid 2013 World Market Outlook and Forecast up to 2017 Description: Sulfuric Acid 2013 World Market Outlook and
Hong Kong s Health Spending 1989 to 2033
 Hong Kong s Health Spending 1989 to 2033 Gabriel M Leung School of Public Health The University of Hong Kong What are Domestic Health Accounts? Methodology used to determine a territory s health expenditure
World Leasing Yearbook 2016
 Brochure More information from http://www.researchandmarkets.com/reports/3687603/ World Leasing Yearbook 2016 Description: The 2016 edition provides valuable reference data for all players in the field,
Global Effective Tax Rates
 www.pwc.com/us/nes Global s Global s April 14, 2011 This document has been prepared pursuant to an engagement between PwC and its Client. As to all other parties, it is for general information purposes
The Case for International Fixed Income
 The Case for International Fixed Income June 215 Introduction Investing in fixed-income securities outside of the United States is often perceived as a riskier strategy than deploying those assets domestically,
Verdict Financial: Wealth Management. Data Collection and Forecasting Methodologies
 Verdict Financial: Wealth Management Data Collection and Forecasting Methodologies April 2014 Contents Global Wealth Markets Methodology Methodology Methodology 2 Global Wealth Markets Section 1: Global
WHITE PAPER SIX ESSENTIAL CONSIDERATIONS WHEN CHOOSING A FIELD SERVICE SOFTWARE SOLUTION
 WHITE PAPER SIX ESSENTIAL CONSIDERATIONS WHEN CHOOSING A FIELD SERVICE SOFTWARE SOLUTION CONTENT DESIGNED AND DEVELOPED SPECIFICALLY FOR FIELD SERVICE... 3 FULLY INTEGRATED FIELD SERVICE FUNCTIONALITY...
Broadband Mapping 2013
 Broadband Mapping 2013 Broadband Mapping 2013 Summary Publisher: The Danish Business Authority A full Danish edition can be downloaded from the website of the Danish Business Authority: www.erst.dk BROADBAND
Dow Jones Titans Indices Methodology
 Dow Jones Titans Indices Methodology March 2014 S&P Dow Jones Indices: Index Methodology Table of Contents Introduction 4 Highlights and Index Family 4 Eligibility Criteria and Index Construction 7 Dow
DSV Air & Sea, Inc. Aerospace Sector. DSV Air & Sea, Inc. Aerospace
 DSV Air & Sea, Inc. Aerospace Sector DSV Air & Sea, Inc. Aerospace Introduction to DSV DSV is a global supplier of transport and logistics services. We have offices in more than 70 countries and an international
WHITE PAPER IMPROVING PERFORMANCE WITH AN ADAPTIVE PLATFORM FOR ENTERPRISE OPERATIONAL INTELLIGENCE HIGHLIGHTS P1 P4 P5.
 WHITE PAPER IMPROVING PERFORMANCE WITH AN ADAPTIVE PLATFORM FOR ENTERPRISE OPERATIONAL INTELLIGENCE October, 2015 HIGHLIGHTS P1 P4 P5 Competitive companies that succeed are the ones that embrace change.
A Nielsen Report Global Trust in Advertising and Brand Messages. April 2012
 A Nielsen Report Global Trust in Advertising and Brand Messages April 2012 CONSUMER TRUST IN EARNED ADVERTISING GROWS IN IMPORTANCE Earned media sources remain most credible Trust in traditional paid advertising
Data Modeling & Bureau Scoring Experian for CreditChex
 Data Modeling & Bureau Scoring Experian for CreditChex Karachi Nov. 29 th 2007 Experian Decision Analytics Credit Services Help clients with data and services to make business critical decisions in credit
Brochure More information from http://www.researchandmarkets.com/reports/3278449/
 Brochure More information from http://www.researchandmarkets.com/reports/3278449/ The 2016 World Forecasts of Hand-Operated Date, Sealing, or Numbering Stamps; Devices for Printing or Embossing Labels;
GLOBAL DATA CENTER SPACE 2013
 2013 CENSUS REPORT: Global Data Center Space 2013 GLOBAL DATA CENTER SPACE 2013 Top 3 data center markets account for almost half of all global data center space. In spite of a slowdown in the amount of
BT Premium Event Call and Web Rate Card
 BT Managed Event and BT Self-Managed Event (also referred to as Express, Plus and Premium) Conference Bridge and Call for Booked Audio Conferencing Services will comprise the following for each phone-conference:
www.pwc.co.uk/economics Global wage projections to 2030 September 2013
 www.pwc.co.uk/economics Global wage projections to 2030 Summary: Wage gap between emerging and advanced economies will shrink significantly by 2030 By 2030, our projections in this report suggest that
2013 GLOBAL PERFORMANCE MANAGEMENT SURVEY REPORT
 2013 GLOBAL PERFORMANCE MANAGEMENT SURVEY REPORT Executive Summary contents Overview Key Findings: Critical Drivers of Performance Management Success Industry Insights Regional and Country Insights Participant
STATISTICS FOR THE FURNITURE INDUSTRY AND TRADE
 STATISTICS FOR THE FURNITURE INDUSTRY AND TRADE Möbel Zahlen Daten STATISTICS FOR THE FURNITURE INDUSTRY AND TRADE 01/36 Economical growth in the regions of the world-economy Changes of the gross domestic
USAGE OF METRICS AND ANALYTICS IN EMEA MOVING UP THE MATURITY CURVE
 USAGE OF METRICS AND ANALYTICS IN EMEA MOVING UP THE MATURITY CURVE USAGE OF METRICS AND ANALYTICS IN EMEA MOVING UP THE MATURITY CURVE When we asked business executives about the importance of human capital
Classifying South Korea as a Developed Market
 WHITE PAPER REPORT FTSE PUBLICATIONS Classifying South Korea as a Developed Market JANUARY 2013 Christopher Woods Managing Director, Governance & Policy, FTSE The success of FTSE s market indices is founded
WHITE PAPER FIELD SERVICE MANAGEMENT SOFTWARE FOR ENTERPRISE COMPANIES
 WHITE PAPER FIELD SERVICE MANAGEMENT SOFTWARE FOR ENTERPRISE COMPANIES CONTENT LEVEL 1... 1 LEVEL 2... 2 LEVEL 3... 2 LEVEL 4... 3 DYNAMIC SCHEDULING... 4 PREDICTIVE ANALYTICS... 6 CONCLUSION... 7 ABOUT
ON OECD I-O DATABASE AND ITS EXTENSION TO INTER-COUNTRY INTER- INDUSTRY ANALYSIS " Norihiko YAMANO"
 ON OECD I-O DATABASE AND ITS EXTENSION TO INTER-COUNTRY INTER- INDUSTRY ANALYSIS " Norihiko YAMANO" OECD Directorate for Science Technology and Industry" " 1 February 2012" INTERNATIONAL WORKSHOP ON FRONTIERS
We decided that we would build IFS Applications on standards so our customers would not be locked into any particular technology. We still do.
 IFS Applications for Enterprise Asset Management OUR SOLUTION S DNA When we first set out to create IFS Applications over 25 years ago, our goal was to make the most usable business software on the market.
Accuracy counts! SENSORS WITH ANALOG OUTPUT
 Accuracy counts! SENSORS WITH ANALOG OUTPUT OTHER APPLICATIONS: KEY ADVANTAGES: Distance measurement Positioning Profile detection Deformation monitoring Vibration monitoring Process monitoring Detection
The Determinants of Global Factoring By Leora Klapper
 The Determinants of Global Factoring By Leora Klapper Factoring services can be traced historically to Roman times. Closer to our own era, factors arose in England as early as the thirteenth century, as
List of tables. I. World Trade Developments
 List of tables I. World Trade Developments 1. Overview Table I.1 Growth in the volume of world merchandise exports and production, 2010-2014 39 Table I.2 Growth in the volume of world merchandise trade
THE ZENDESK BENCHMARK
 zendesk.com Q THE ZENDESK BENCHMARK IN FOCUS: ANALYTICS Norway Canada New Zealand The Zendesk Benchmark Q/ Table of Contents Global Customer Satisfaction Summary Background on the Zendesk Benchmark Page
- 2 - Chart 2. Annual percent change in hourly compensation costs in manufacturing and exchange rates, 2010-2011
 For release 10:00 a.m. (EST) Wednesday, December 19, 2012 USDL-12-2460 Technical Information: (202) 691-5654 [email protected] www.bls.gov/ilc Media Contact: (202) 691-5902 [email protected] INTERNATIONAL
CISCO METRO ETHERNET SERVICES AND SUPPORT
 SERVICES OVERIVEW CISCO METRO ETHERNET SERVICES AND SUPPORT In the ever-changing communications market, incumbent service providers are looking for ways to grow revenue. One method is to deploy service
Maximizing Your Value-Add: Conducting a Best-in-Class Market Analysis
 Maximizing Your Value-Add: Conducting a Best-in-Class Market Analysis Dr. George L. Harris, President Calyptus Consulting Group, Inc. 781-674-0041; [email protected] 93 rd Annual International
The value of accredited certification
 Certified Once Accepted Everywhere The value of accredited certification Survey Report Published May 212 In 21/11, the IAF carried out a global survey to capture market feedback on the value of certification.
What Proportion of National Wealth Is Spent on Education?
 Indicator What Proportion of National Wealth Is Spent on Education? In 2008, OECD countries spent 6.1% of their collective GDP on al institutions and this proportion exceeds 7.0% in Chile, Denmark, Iceland,
The face of consistent global performance
 Building safety & security global simplified accounts The face of consistent global performance Delivering enterprise-wide safety and security solutions. With more than 500 offices worldwide Johnson Controls
It looks like your regular telephone.
 It looks like your regular telephone. But it s a lot better. CISCO PHONE SYSTEM SOLUTIONS FOR SMALL AND MEDIUM BUSINESSES Between the increased productivity and administrative savings we ve experienced,
IMD World Talent Report. By the IMD World Competitiveness Center
 2014 IMD World Talent Report By the IMD World Competitiveness Center November 2014 IMD World Talent Report 2014 Copyright 2014 by IMD: Institute for Management Development, Lausanne, Switzerland For further
Lawson Talent Management
 Lawson Talent Imagine Knowing: Which employees have the highest potential how to recruit more talent like them. Imagine Understanding: Which employees are a flight risk how your compensation plans could
2011 ICT Facts and Figures
 The World in 211 ICT Facts and Figures One third of the world s population is online 45% of Internet users below the age of 25 Share of Internet users in the total population Users, developed Using Internet:
EXTERNAL DEBT AND LIABILITIES OF INDUSTRIAL COUNTRIES. Mark Rider. Research Discussion Paper 9405. November 1994. Economic Research Department
 EXTERNAL DEBT AND LIABILITIES OF INDUSTRIAL COUNTRIES Mark Rider Research Discussion Paper 9405 November 1994 Economic Research Department Reserve Bank of Australia I would like to thank Sally Banguis
Chinese students and the higher education market in Australia and New Zealand.
 Chinese students and the higher education market in Australia and New Zealand. by Ma Xiaoying English Department North China Electric University, Beijing, China and Malcolm Abbott Centre for Research in
Bahrain Telecom Pricing International Benchmarking. April 2014
 Bahrain Telecom Pricing International Benchmarking April 2014 2014 Contents of this report Report overview 3 PSTN basket results for GCC countries, including time series 4 Mobile basket results for GCC
Long-term macroeconomic forecasts Key trends to 2050
 A special report from The Economist Intelligence Unit www.eiu.com Contents Overview 2 Top ten economies in 5 at market exchange rates 3 The rise of Asia continues 4 Global dominance of the top three economies
MERCER S COMPENSATION ANALYSIS AND REVIEW SYSTEM AN ONLINE TOOL DESIGNED TO TAKE THE WORK OUT OF YOUR COMPENSATION REVIEW PROCESS
 MERCER S COMPENSATION ANALYSIS AND REVIEW SYSTEM AN ONLINE TOOL DESIGNED TO TAKE THE WORK OUT OF YOUR COMPENSATION REVIEW PROCESS MERCER S COMPENSATION ANALYSIS AND REVIEW SYSTEM www.imercer.com/cars Mercer
Health and welfare Humanities and arts Social sciences, bussiness and law. Ireland. Portugal. Denmark. Spain. New Zealand. Argentina 1.
 Indicator to Which fields of education are students attracted? Women represent the majority of students and graduates in almost all OECD countries and largely dominate in the fields of education, health
Wireless Broadband Access
 Wireless Broadband Access Fueling Growth in Latin America, Today and Tomorrow Tony Sarallo Director of Distribution, Latin America Motorola Canopy Products Telephony/IT Connectivity Workshop Santiago,
A new ranking of the world s most innovative countries: Notes on methodology. An Economist Intelligence Unit report Sponsored by Cisco
 A new ranking of the world s An Economist Intelligence Unit report Sponsored by Cisco Economist Intelligence Unit Limited 2009 A new ranking of the world s Preface In April 2009, the Economist Intelligence
A BETTER RETIREMENT PORTFOLIO FOR MEMBERS IN DC INVESTMENT DEFAULTS
 A BETTER RETIREMENT PORTFOLIO FOR MEMBERS IN DC INVESTMENT DEFAULTS JUNE 2014 TALENT HEALTH RETIREMENT INVESTMENTS EXECUTIVE SUMMARY The majority of defined contribution (DC) plan members typically end
Carnegie Mellon University Office of International Education Admissions Statistics for Summer and Fall 2013
 Carnegie Mellon University Admissions Statistics for and Fall 2013 New International Students and Fall 2012 Undergraduate 270 14.3% Master's 1301 68.7% Doctorate 192 10.1% Exchange 99 5.2% 31 1.6% Total
Sustainable Solutions. Switch to future thinking
 Switch to future thinking Increased global competition, rapid advances in technology, risks from natural disasters, resource shortages today s business leaders must adapt to operating in a changing world,
Australia s position in global and bilateral foreign direct investment
 Australia s position in global and bilateral foreign direct investment At the end of 213, Australia was the destination for US$592 billion of global inwards foreign direct investment (FDI), representing
Local Access Circuit Price Benchmarking for Key Asia Pacific Countries vs. Each Other, the European Union & OECD Countries. Executive Summary Report
 Local Access Circuit Price Benchmarking for Key Asia Pacific Countries vs. Each Other, the European Union & OECD Countries Executive Summary Report A report produced by Teligen for a group of Global Operators
White paper. Engineer to Order Manufacturing
 White paper Selecting ERP for Engineer to Order Manufacturing content Are you getting the real deal?... 3 Conclusion... 4 About IFS... 5 Selecting ERP for Engineer to Order Manufacturing By Peter Gross
Carnegie Mellon University Office of International Education Admissions Statistics for Summer and Fall 2010
 Carnegie Mellon University Admissions Statistics for and Fall 2010 New International Students and Fall 2010 Undergraduate 208 16.1% Master's 799 61.7% Doctorate 177 13.7% Exchange 80 6.2% 31 2.4% Total
3 Steps to Transform your Business with Next-Generation Networking
 e-guide The Wireless Revolution 3 Steps to Transform your Business with Next-Generation Networking Welcome to the era of the Wireless Revolution! With easy access to technology, setting up a wireless network
International Financial Reporting Standards
 International Financial Reporting Standards Of Growing Importance for U.S. Companies Assurance Services there is no longer a choice Three factors may influence your need to consider IFRS. First, many organizations
Global Corporate Capital Flows, 2008/9 to 2013/14
 Global Corporate Capital Flows, 2008/9 to 2013/14 A study of the investment intentions of companies in 15 countries around the world. June 2008 TAX Across KPMG s global network of member firms, we have
Overview of the OECD work on transfer pricing
 Overview of the OECD work on transfer pricing Written contribution to the Conference Alternative Methods of Taxation of Multinationals (13-14 June 2012, Helsinki, Finland) by Marlies de Ruiter, Head of
Point Topic s Broadband Operators and Tariffs
 1 Point Topic s Broadband Operators and Tariffs Broadband tariff benchmarks: Q2 2013 July 2013 Point Topic Ltd 73 Farringdon Road London EC1M 3JQ, UK Tel. +44 (0) 20 3301 3303 Email [email protected]
Hybrid Wide-Area Network Application-centric, agile and end-to-end
 Hybrid Wide-Area Network Application-centric, agile and end-to-end How do you close the gap between the demands on your network and your capabilities? Wide-area networks, by their nature, connect geographically
October 2007. Trust in Advertising. a global Nielsen
 October 2007 Trust in Advertising a global Nielsen consumer report Word-of-mouth the most powerful selling tool: Nielsen Survey Traditional Media Advertising Still More Credible Worldwide Than Ads on Search
International investment continues to struggle
 FDI IN FIGURES December 2014 International investment continues to struggle Figures for the first half of 2014 point to stalled FDI flows Findings FDI fell in the first quarter of 2014 before rebounding
Brochure More information from http://www.researchandmarkets.com/reports/1339929/
 Brochure More information from http://www.researchandmarkets.com/reports/1339929/ The 2011 World Forecasts of Machine Tools That Remove Material by Laser or Light, Photon, Ultrasonic, Electro-Discharge,
White paper. Selecting ERP for Enterprise 2.0 and Social Media Functionality
 White paper Selecting ERP for Enterprise 2.0 and Social Media Functionality Content The critical role of security... 2 Stay focused on business... 2 Wikis for lean... 3 Selecting ERP with Enterprise 2.0...