Unsupervised Learning (II) Dimension Reduction
|
|
|
- Stuart Carter
- 7 years ago
- Views:
Transcription
1 [ Statistical Machine Learning, Spring, 2016] Unsupervised Learning (II) Dimension Reduction Jun Zhu State Key Lab of Intelligent Technology & Systems Tsinghua University March 8, 2016
2 Outline What is dimension reduction? Why dimension reduction? Dimension reduction algorithms Principal Component Analysis (PCA) Local linear embedding Feature selection
3 What is dimension reduction? Dimension reduction refers to the mapping of the original high-dim data onto a lower-dim space Criterion for dimension reduction can be different based on different problem settings Unsupervised setting: minimize the information loss Supervised setting: maximize the class discrimination Given a set of data points of p variables Compute the linear transformation (projection)
4 What is dimension reduction? linear case Original data reduced data Linear transformation
5 Why dimension reduction? Most machine learning and data mining techniques may not be effective for high-dimensional data Curse of Dimensionality Query accuracy and efficiency degrade rapidly as the dimension increases. The intrinsic dimension may be small. For example, the number of genes responsible for a certain type of disease may be small.
6 Why dimension reduction? Visualization: projection of high-dimensional data onto 2D or 3D. Data compression: efficient storage and retrieval. Noise removal: positive effect on query accuracy.
7 Example: a job satisfaction questionnaire A questionnaire with 7 items
8 Example: a job satisfaction questionnaire A questionnaire with 7 items, each item corresponds to a variable N = 200 (participants) Strong correlation means high redundancy satisfaction with supervision satisfaction with pay
9 Redundant? which one is redundant? highly redundant data are likely to be compressible -- essential idea for dimension reduction

10 More examples Face recognition: Representation: a high-dimensional vector (e.g., 20 x 28 = 560) where each dimension represents the brightness of one pixel Underlying structure parameters: different camera angles, pose and lighting condition, face expression, etc.

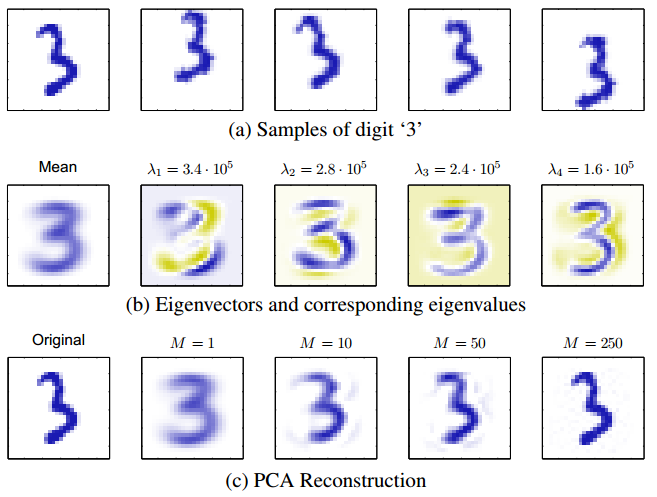
11 More examples Character recognition: Representation: a high-dimensional vector (e.g., 28 x 28 = 784) where each dimension represents the brightness of one pixel Underlying structure parameters: orientation, curvature, style (e.g., 2 with/without loops)

12 More examples Text document analysis: Representation: a high-dimensional vector (e.g., 10K) of term frequency over the vocabulary of the word Underlying structure parameters: topic proportions, clustering structure

13 More examples Motion capture: Representation: pose is determined, e.g., by the 3D coordinates of multiple points on the body Underlying structure parameters: pose type Motion can be viewed as a trajectory on the manifold
 gene")
14 More examples Microarray gene expression: Representation: vector of gene expression values or sequences of such vectors Underlying structure parameters: correlated (or dependent) gene groups
 LDA, CCA, PLS Non-linear Isomap, LLE, MDR Learning with Non-linear kernels We will cover PCA and LLE as")
15 Dimension reduction algorithms Many methods have been developed Unsupervised Supervised Linear PCA, ICA, SVD, LSA (LSI) LDA, CCA, PLS Non-linear Isomap, LLE, MDR Learning with Non-linear kernels We will cover PCA and LLE as examples
16 PCA: Principal Component Analysis probably the most widely-used and well-known of the standard multivariate methods invented by Karl Pearson (1901) and independently developed by Harold Hotelling (1933) first applied in ecology by Goodall (1954) under the name factor analysis ( principal factor analysis is a synonym of PCA).
17 Review: Eigenvector, Eigenvalue For a square matrix A (p x p), the eigenvector is defined as where u is an eigenvector and is the corresponding eigenvalue Put in a matrix form For symmetric matrices, the eigenvectors can be orthogonal Thus:
18 PCA for dimension reduction An eigen-decomposition process to data covariance matrix Minus the empirical mean to get centered data Compute the covariance Doing eigenvalue decomposition Let U be the eigenvectors of S corresponding to the top d eigenvalues Encode data Reconstruct data
19 Apply to data covariance -- eigensystem The eigenvectors of the covariance define a new axis system Any point in the X-axis system, is the data mean, the coordinate in the U-axis system is:
20 A 2D Example 2D data represented in 1D dimensions [
21 A 2D Example 2D data represented in 1D dimensions [
22 A 3D Example 3D data represented in 2D dimensions [
23 A high-dimensional Example
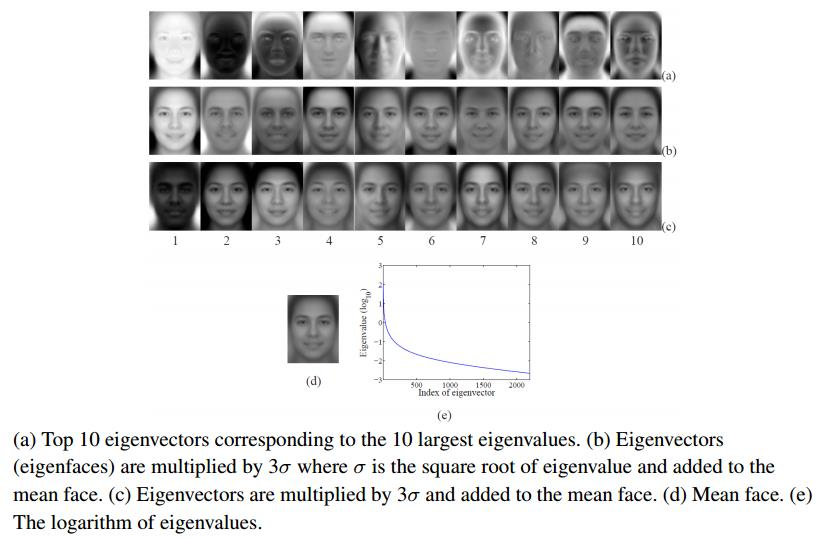
24 Eigenfaces
25 How to choose d? Measure the total variance accounted for by the d principal components the percentage of the variance accounted for by the i-th eigenvector: Account for a minimum percentage of total variance, e.g., 95%:
26 Theory of PCA There are three types of interpretation Minimum variance Least reconstruct error Probabilistic model
27 Maximum Variance Formulation Given a set of data points Goal: Project the data into an d-dimensional (d < p) space while maximizing the variance of the projected data N N p X d Y
28 Maximum Variance Formulation Let s start with the 1-dimensional projection, i.e., d = 1 We only care about the projection direction, not the scale, so we assume The projection is Mean and variance of projected data: sample covariance
29 Maximum Variance Formulation Now, we get a constrained optimization problem where Solve it using Lagrangian methods, we get The eigenvector problem The lagrange multiplier is the eigenvalue The eigenvector corresponds to largest eigenvalue is 1 st PC.
30 Maximum Variance Formulation Additional components can be incrementally found where and Solve this problem with Lagrangian method, we have which leads to Left multiplying, we get (remember is eigenvector) Thus,
31 Maximum Variance Formulation For the general case of an d dimensional subspace, it is obtained by the d eigenvectors of the data covariance matrix S corresponding to the d largest eigenvalues
32 Minimum Error Formulation A set of complete orthonormal basis Each data point can be represented as Due to the orthonormal property, we can get
33 Minimum Error Formulation A set of complete orthonormal basis We consider a low-dimensional approximation where are constants for all data points The best approximation is to minimize the error
34 Minimum Error Formulation A set of complete orthonormal basis The best approximation is to minimize the error we get (proof?) Use the general representation, we get that the displacement lines in the orthogonal subspace
35 Minimum Error Formulation With the result We get the error The optimization problem where
36 Minimum Error Formulation Consider a 2-dimensional space (p=2) and a 1-dimensional principal subspace (d=1). Then, we choose that minimizes We have: We therefore obtain the minimum value of J by choosing as the eigenvector corresponding to the smaller eigenvalue We choose the principal subspace by the eigenvector with the large eigenvalue
37 Minimum Error Formulation The general solution is to choose the eigenvectors of the covariance matrix with d largest eigenvalues where The distortion measure (i.e., reconstruction error) becomes
38 PCA Reconstruction By the minimum error formulation, the PCA approximation can be written as: We have Essentially, this representation implies compression of p-dim data into a d-dim vector with components
39 Probabilistic PCA A simple linear-gaussian model Let z be a latent feature vector In Bayesian, we assume it s prior A linear-gaussian model this gives the likelihood the columns of W span a linear subspace
40 Probabilistic PCA By the properties of Gaussian, we can get the marginal
41 Unidentifiability issue Any rotation of the latent dimensions leads to invariance of the predictive distribution Let R be an orthogonal matrix with Define Then, we have which is independent of R
42 Inverse of the Covariance matrix Evaluating the inverse of the covariance matrix C has complexity. We can do inversion as follows where the d x d matrix M is: Evaluating the inverse of M has complexity
43 Probabilistic PCA By the properties of Gaussian, we can get the posterior The posterior mean depends on x (a linear projection of x) Posterior covariance is independent of x
44 Maximum Likelihood PCA Given a set of observations, the log-likelihood is We get the MLE: and
45 Maximum Likelihood PCA Log-likelihood The stationary points can be written as (Tipping & Bishop, 1999) is diagonal with eigenvalues ; R is an arbitrary d x d orthogonal matrix; is p x d matrix whose columns are eigenvectors of S The maximum of likelihood is obtained while the d eigenvectors are chosen to be those whose eigenvalues are the d largest MLE for is: The average variance associated with the discarded dimensions Read proof at [Tipping & Bishop. Probabilistic Principal Component Analysis, JRSS, 1999]
46 Maximum Likelihood PCA Since the choice of R doesn t affect the covariance matrix, we can simply choose Recover the conventional PCA Take the limit, we get the posterior mean which is an orthogonal projection of the data point into the latent space So we recover the standard PCA
47 EM Algorithm for PPCA E-step: evaluate expectation of complete likelihood where M-step: optimizes over parameters
48 Bayesian PCA A prior is assumed on the parameters W Inference can be done in closed-form, as in GP regression Fully Bayesian treatment put priors on
49 Factor Analysis Another simple linear-gaussian model Let z be a latent feature vector In Bayesian, we assume it s prior A linear-gaussian model is a diagonal matrix this gives the likelihood the columns of W span a linear subspace
50 Factor Analysis We can the inference tasks almost the same as in PCA The predictive distribution is Gaussian EM algorithm can be applied to maximum likelihood estimation
51 PCA in high-dimensions What is p is very large, e.g., p >> N? which is a matrix Finding the eigenvectors typically has complexity Computationally expensive The number of nonzero eigenvalues is no larger than N Waste of time to work with S How about working with the full rank Gram matrix?
52 Dual PCA PCA in high-dimensions For centered data, we have with eigenvalues and eigenvectors with eigenvalues and eigenvectors By left-multiplying to, we get, Thus,
53 Kernel PCA PCA is linear: the reduced dimension representation is generated by linear projections Kernel PCA is nonlinear by exploring kernel trick Apply dual PCA in the Hilbert space where k(.,.) is the reproducing kernel [Scholkopf, Smola, Muller. Kernel Principal Component Analysis, 1999]
54 Example of Kernel PCA
55 Example of Kernel PCA
56 Nonlinear Dimension Reduction (Manifold Learning)
57 Manifold Learning Manifold: a smooth, curved subset of an Euclidean space, in which it is embedded A d-dim manifold can be arbitrarily well-approximated by a d-dim linear subspace, the tangent space, by taking a sufficiently small region about any point
58 Manifold Learning If our data come from a manifold, we should be able to do a local linear approximation around each part of the manifold, and then smoothly interpolate them together into a single global system To do dimension reduction, we want to find the global low-dim coordinates

59 Locally linear embedding (LLE) A nonlinear dimension reduction technique to preserve neighborhood structure Intuition: nearby points in the high dimensional space remain nearby and similarly co-located w.r.t one another in the low dimensional space [Roweis & Saul, Science, Vol 290, 2000; Saul & Roweis, JMLR 2003]
60 How does LLE work? Step 2: minimize reconstruction error Step 3: neighborhood-preserving embedding geometric structure W

61 Implementation details Free parameter: K number of neighbors per data point Original manifold Embedding results by LLE with various K samples
62 Implementation details Step 1: choose neighborhood many choices Note: different points can have different numbers of neighbors
63 Implementation details Step 2: minimize reconstruction error each data point can be done in parallel locality Solution (Lagrange methods):
64 Implementation details What s happening if K > p? The space spanned by k distinct vectors is the whole space Each data point can be perfectly reconstructed from its neighbors G is singular! (fewer constraints than parameters) The reconstruction weights are no longer uniquely defined Example (D=2, K=4)
65 Implementation details What s happening if K > p? The space spanned by k distinct vectors is the whole space Each data point can be perfectly reconstructed from its neighbors G is singular! The reconstruction weights are no longer uniquely defined Regularized opt. problem: (save ill-posed problems) Solution (Lagrange methods):
66 Implementation details Step 3: neighborhood-preserving embedding centered around the origin unit covariance all data points are coupled together global coordinates Solution (Lagrange methods) eigenvalue problem: Find the d eigenvectors with the lowest eigenvalues

67 More examples [Roweis & Saul, Science, Vol 290, 2000; Saul & Roweis, JMLR 2003]

68 More examples 1965 grayscale 20 x 28 images (D=560); K = 12 [Roweis & Saul, Science, Vol 290, 2000; Saul & Roweis, JMLR 2003]
69 Many other algorithms [van der Maaten et al., Dimension Reduction: A Comparative Review, 2008]
70 Note: n is N; D is p in our slides [van der Maaten et al., Dimension Reduction: A Comparative Review, 2008]
71 No Free Lunch The curvier your manifold, the denser your data must be!

72 Matlab Toolbox Laurens van der Maaten (34 techniques for dimensionality reduction and metric learning)
73 What is dimension reduction? linear case Original data reduced data Linear transformation
74 What is feature selection? Original data reduced data Linear transformation
75 Feature selection methods FS is popular in supervised learning by maximizing some function of predictive accuracy Selecting an optimal set of features is NP-hard (Weston et al., 2003) Approximate methods: Filter methods [Kira & Rendell, 1992] (Separate) Based on feature ranking (individual predictive power); A pre-processing step and independent of prediction models (optimal under very strict assumptions!) [Guyon & Elisseeff, 2003] Wrapper methods [Kohavi & John, 1997] (Halfintegrated) Use learning machine as a black box to score subsets of variables according to their predictive power Can waste of resources to do many re-training! Embedded methods (Integrated) Perform FS during the process of training; Usually specific to given learning machines Data efficient and Can avoid many re-training! FS FS FS & Learning Learning Learning
76 Unsupervised feature selection x and y are redundant in discriminating the two clusters (i.e., each one decides the clustering results)
77 Unsupervised feature selection y is irredundant in discriminating the two clusters Note: irrelevant features can misguide clustering
78 Unsupervised feature selection Different feature subsets lead to different clustering Which one should we pick?
79 Unsupervised feature selection A wrapper framework for unsupervised feature selection Some key issues: Different feature subsets have different numbers of clusters The feature selection criteria have biases w.r.t feature subset dimensionality
80 Feature Search An exhaustive search is intractable ( subsets) Greedy search: Sequential forward search Starting from 0 features possible feature Add one feature at a time to maximize the gain of some criterion Stop when no improvement Sequential backward elimination Start from the full set Eliminate one feature at a time to minimize the loss of some criterion Stop when no change
81 Clustering algorithm Any clustering algorithms can be used in the wrapper framework
82 Feature subset section criteria different classifications [clusterings] are right for different purpose, so we cannot say any one classification is best (Hartigan, 1985) Some commonly used criteria: Scatter separability (applicable for any clustering methods)
83 Feature subset section criteria different classifications [clusterings] are right for different purpose, so we cannot say any one classification is best (Hartigan, 1985) Some commonly used criteria: Maximum likelihood (applicable for probabilistic methods)
84 The need for finding the number of clusters The number of clusters varies with dimension Some selection methods exist for K (Dy & Brodley, 2003) [Dy & Brodley, Feature section for unsupervised learning, JMLR 2003]
85 What you need to know Motivations for dimension reduction Derivations of PCA LLE Feature selection
86 Homework 1 out, due in two weeks! Reading materials: Chapter 12 of Bishop s PRML References in slides
Supervised Feature Selection & Unsupervised Dimensionality Reduction
 Supervised Feature Selection & Unsupervised Dimensionality Reduction Feature Subset Selection Supervised: class labels are given Select a subset of the problem features Why? Redundant features much or
Unsupervised and supervised dimension reduction: Algorithms and connections
 Unsupervised and supervised dimension reduction: Algorithms and connections Jieping Ye Department of Computer Science and Engineering Evolutionary Functional Genomics Center The Biodesign Institute Arizona
Distance Metric Learning in Data Mining (Part I) Fei Wang and Jimeng Sun IBM TJ Watson Research Center
 Fei Wang and Jimeng Sun IBM TJ Watson Research Center") Distance Metric Learning in Data Mining (Part I) Fei Wang and Jimeng Sun IBM TJ Watson Research Center 1 Outline Part I - Applications Motivation and Introduction Patient similarity application Part II
Distance Metric Learning in Data Mining (Part I) Fei Wang and Jimeng Sun IBM TJ Watson Research Center 1 Outline Part I - Applications Motivation and Introduction Patient similarity application Part II
Dimension Reduction. Wei-Ta Chu 2014/10/22. Multimedia Content Analysis, CSIE, CCU
 1 Dimension Reduction Wei-Ta Chu 2014/10/22 2 1.1 Principal Component Analysis (PCA) Widely used in dimensionality reduction, lossy data compression, feature extraction, and data visualization Also known
Manifold Learning Examples PCA, LLE and ISOMAP
 Manifold Learning Examples PCA, LLE and ISOMAP Dan Ventura October 14, 28 Abstract We try to give a helpful concrete example that demonstrates how to use PCA, LLE and Isomap, attempts to provide some intuition
Comparison of Non-linear Dimensionality Reduction Techniques for Classification with Gene Expression Microarray Data
 CMPE 59H Comparison of Non-linear Dimensionality Reduction Techniques for Classification with Gene Expression Microarray Data Term Project Report Fatma Güney, Kübra Kalkan 1/15/2013 Keywords: Non-linear
Review Jeopardy. Blue vs. Orange. Review Jeopardy
 Review Jeopardy Blue vs. Orange Review Jeopardy Jeopardy Round Lectures 0-3 Jeopardy Round $200 How could I measure how far apart (i.e. how different) two observations, y 1 and y 2, are from each other?
Principal components analysis
 CS229 Lecture notes Andrew Ng Part XI Principal components analysis In our discussion of factor analysis, we gave a way to model data x R n as approximately lying in some k-dimension subspace, where k
Linear Algebra Review. Vectors
 Linear Algebra Review By Tim K. Marks UCSD Borrows heavily from: Jana Kosecka kosecka@cs.gmu.edu http://cs.gmu.edu/~kosecka/cs682.html Virginia de Sa Cogsci 8F Linear Algebra review UCSD Vectors The length
Gaussian Process Latent Variable Models for Visualisation of High Dimensional Data
 Gaussian Process Latent Variable Models for Visualisation of High Dimensional Data Neil D. Lawrence Department of Computer Science, University of Sheffield, Regent Court, 211 Portobello Street, Sheffield,
Data, Measurements, Features
 Data, Measurements, Features Middle East Technical University Dep. of Computer Engineering 2009 compiled by V. Atalay What do you think of when someone says Data? We might abstract the idea that data are
Component Ordering in Independent Component Analysis Based on Data Power
 Component Ordering in Independent Component Analysis Based on Data Power Anne Hendrikse Raymond Veldhuis University of Twente University of Twente Fac. EEMCS, Signals and Systems Group Fac. EEMCS, Signals
Introduction to Principal Components and FactorAnalysis
 Introduction to Principal Components and FactorAnalysis Multivariate Analysis often starts out with data involving a substantial number of correlated variables. Principal Component Analysis (PCA) is a
So which is the best?
 Manifold Learning Techniques: So which is the best? Todd Wittman Math 8600: Geometric Data Analysis Instructor: Gilad Lerman Spring 2005 Note: This presentation does not contain information on LTSA, which
A Survey on Pre-processing and Post-processing Techniques in Data Mining
 , pp. 99-128 http://dx.doi.org/10.14257/ijdta.2014.7.4.09 A Survey on Pre-processing and Post-processing Techniques in Data Mining Divya Tomar and Sonali Agarwal Indian Institute of Information Technology,
Nonlinear Iterative Partial Least Squares Method
 Numerical Methods for Determining Principal Component Analysis Abstract Factors Béchu, S., Richard-Plouet, M., Fernandez, V., Walton, J., and Fairley, N. (2016) Developments in numerical treatments for
SYMMETRIC EIGENFACES MILI I. SHAH
 SYMMETRIC EIGENFACES MILI I. SHAH Abstract. Over the years, mathematicians and computer scientists have produced an extensive body of work in the area of facial analysis. Several facial analysis algorithms
APPM4720/5720: Fast algorithms for big data. Gunnar Martinsson The University of Colorado at Boulder
 APPM4720/5720: Fast algorithms for big data Gunnar Martinsson The University of Colorado at Boulder Course objectives: The purpose of this course is to teach efficient algorithms for processing very large
Machine Learning for Data Science (CS4786) Lecture 1
 Lecture 1") Machine Learning for Data Science (CS4786) Lecture 1 Tu-Th 10:10 to 11:25 AM Hollister B14 Instructors : Lillian Lee and Karthik Sridharan ROUGH DETAILS ABOUT THE COURSE Diagnostic assignment 0 is out:
Machine Learning for Data Science (CS4786) Lecture 1 Tu-Th 10:10 to 11:25 AM Hollister B14 Instructors : Lillian Lee and Karthik Sridharan ROUGH DETAILS ABOUT THE COURSE Diagnostic assignment 0 is out:
Statistics Graduate Courses
 Statistics Graduate Courses STAT 7002--Topics in Statistics-Biological/Physical/Mathematics (cr.arr.).organized study of selected topics. Subjects and earnable credit may vary from semester to semester.
Introduction to Matrix Algebra
 Psychology 7291: Multivariate Statistics (Carey) 8/27/98 Matrix Algebra - 1 Introduction to Matrix Algebra Definitions: A matrix is a collection of numbers ordered by rows and columns. It is customary
T-61.3050 : Email Classification as Spam or Ham using Naive Bayes Classifier. Santosh Tirunagari : 245577
 T-61.3050 : Email Classification as Spam or Ham using Naive Bayes Classifier Santosh Tirunagari : 245577 January 20, 2011 Abstract This term project gives a solution how to classify an email as spam or
CS 591.03 Introduction to Data Mining Instructor: Abdullah Mueen
 CS 591.03 Introduction to Data Mining Instructor: Abdullah Mueen LECTURE 3: DATA TRANSFORMATION AND DIMENSIONALITY REDUCTION Chapter 3: Data Preprocessing Data Preprocessing: An Overview Data Quality Major
Feature Selection vs. Extraction
 Feature Selection In many applications, we often encounter a very large number of potential features that can be used Which subset of features should be used for the best classification? Need for a small
Adaptive Face Recognition System from Myanmar NRC Card
 Adaptive Face Recognition System from Myanmar NRC Card Ei Phyo Wai University of Computer Studies, Yangon, Myanmar Myint Myint Sein University of Computer Studies, Yangon, Myanmar ABSTRACT Biometrics is
Object Recognition and Template Matching
 Object Recognition and Template Matching Template Matching A template is a small image (sub-image) The goal is to find occurrences of this template in a larger image That is, you want to find matches of
STA 4273H: Statistical Machine Learning
 STA 4273H: Statistical Machine Learning Russ Salakhutdinov Department of Statistics! rsalakhu@utstat.toronto.edu! http://www.cs.toronto.edu/~rsalakhu/ Lecture 6 Three Approaches to Classification Construct
CS 5614: (Big) Data Management Systems. B. Aditya Prakash Lecture #18: Dimensionality Reduc7on
 Data Management Systems. B. Aditya Prakash Lecture #18: Dimensionality Reduc7on") CS 5614: (Big) Data Management Systems B. Aditya Prakash Lecture #18: Dimensionality Reduc7on Dimensionality Reduc=on Assump=on: Data lies on or near a low d- dimensional subspace Axes of this subspace
CS 5614: (Big) Data Management Systems B. Aditya Prakash Lecture #18: Dimensionality Reduc7on Dimensionality Reduc=on Assump=on: Data lies on or near a low d- dimensional subspace Axes of this subspace
Unsupervised Data Mining (Clustering)
") Unsupervised Data Mining (Clustering) Javier Béjar KEMLG December 01 Javier Béjar (KEMLG) Unsupervised Data Mining (Clustering) December 01 1 / 51 Introduction Clustering in KDD One of the main tasks in
Unsupervised Data Mining (Clustering) Javier Béjar KEMLG December 01 Javier Béjar (KEMLG) Unsupervised Data Mining (Clustering) December 01 1 / 51 Introduction Clustering in KDD One of the main tasks in
CS 2750 Machine Learning. Lecture 1. Machine Learning. http://www.cs.pitt.edu/~milos/courses/cs2750/ CS 2750 Machine Learning.
 Lecture Machine Learning Milos Hauskrecht milos@cs.pitt.edu 539 Sennott Square, x5 http://www.cs.pitt.edu/~milos/courses/cs75/ Administration Instructor: Milos Hauskrecht milos@cs.pitt.edu 539 Sennott
Orthogonal Diagonalization of Symmetric Matrices
 MATH10212 Linear Algebra Brief lecture notes 57 Gram Schmidt Process enables us to find an orthogonal basis of a subspace. Let u 1,..., u k be a basis of a subspace V of R n. We begin the process of finding
1816 IEEE TRANSACTIONS ON IMAGE PROCESSING, VOL. 15, NO. 7, JULY 2006. Principal Components Null Space Analysis for Image and Video Classification
 1816 IEEE TRANSACTIONS ON IMAGE PROCESSING, VOL. 15, NO. 7, JULY 2006 Principal Components Null Space Analysis for Image and Video Classification Namrata Vaswani, Member, IEEE, and Rama Chellappa, Fellow,
Chapter 6. Orthogonality
 6.3 Orthogonal Matrices 1 Chapter 6. Orthogonality 6.3 Orthogonal Matrices Definition 6.4. An n n matrix A is orthogonal if A T A = I. Note. We will see that the columns of an orthogonal matrix must be
Similarity and Diagonalization. Similar Matrices
 MATH022 Linear Algebra Brief lecture notes 48 Similarity and Diagonalization Similar Matrices Let A and B be n n matrices. We say that A is similar to B if there is an invertible n n matrix P such that
Exploratory Data Analysis with MATLAB
 Computer Science and Data Analysis Series Exploratory Data Analysis with MATLAB Second Edition Wendy L Martinez Angel R. Martinez Jeffrey L. Solka ( r ec) CRC Press VV J Taylor & Francis Group Boca Raton
Mehtap Ergüven Abstract of Ph.D. Dissertation for the degree of PhD of Engineering in Informatics
 INTERNATIONAL BLACK SEA UNIVERSITY COMPUTER TECHNOLOGIES AND ENGINEERING FACULTY ELABORATION OF AN ALGORITHM OF DETECTING TESTS DIMENSIONALITY Mehtap Ergüven Abstract of Ph.D. Dissertation for the degree
Principle Component Analysis and Partial Least Squares: Two Dimension Reduction Techniques for Regression
 Principle Component Analysis and Partial Least Squares: Two Dimension Reduction Techniques for Regression Saikat Maitra and Jun Yan Abstract: Dimension reduction is one of the major tasks for multivariate
CHAPTER 8 FACTOR EXTRACTION BY MATRIX FACTORING TECHNIQUES. From Exploratory Factor Analysis Ledyard R Tucker and Robert C.
 CHAPTER 8 FACTOR EXTRACTION BY MATRIX FACTORING TECHNIQUES From Exploratory Factor Analysis Ledyard R Tucker and Robert C MacCallum 1997 180 CHAPTER 8 FACTOR EXTRACTION BY MATRIX FACTORING TECHNIQUES In
Machine Learning and Data Analysis overview. Department of Cybernetics, Czech Technical University in Prague. http://ida.felk.cvut.
 Machine Learning and Data Analysis overview Jiří Kléma Department of Cybernetics, Czech Technical University in Prague http://ida.felk.cvut.cz psyllabus Lecture Lecturer Content 1. J. Kléma Introduction,
Learning Gaussian process models from big data. Alan Qi Purdue University Joint work with Z. Xu, F. Yan, B. Dai, and Y. Zhu
 Learning Gaussian process models from big data Alan Qi Purdue University Joint work with Z. Xu, F. Yan, B. Dai, and Y. Zhu Machine learning seminar at University of Cambridge, July 4 2012 Data A lot of
How To Cluster
 Data Clustering Dec 2nd, 2013 Kyrylo Bessonov Talk outline Introduction to clustering Types of clustering Supervised Unsupervised Similarity measures Main clustering algorithms k-means Hierarchical Main
Text Mining in JMP with R Andrew T. Karl, Senior Management Consultant, Adsurgo LLC Heath Rushing, Principal Consultant and Co-Founder, Adsurgo LLC
 Text Mining in JMP with R Andrew T. Karl, Senior Management Consultant, Adsurgo LLC Heath Rushing, Principal Consultant and Co-Founder, Adsurgo LLC 1. Introduction A popular rule of thumb suggests that
Subspace Analysis and Optimization for AAM Based Face Alignment
 Subspace Analysis and Optimization for AAM Based Face Alignment Ming Zhao Chun Chen College of Computer Science Zhejiang University Hangzhou, 310027, P.R.China zhaoming1999@zju.edu.cn Stan Z. Li Microsoft
Machine Learning in Computer Vision A Tutorial. Ajay Joshi, Anoop Cherian and Ravishankar Shivalingam Dept. of Computer Science, UMN
 Machine Learning in Computer Vision A Tutorial Ajay Joshi, Anoop Cherian and Ravishankar Shivalingam Dept. of Computer Science, UMN Outline Introduction Supervised Learning Unsupervised Learning Semi-Supervised
BIOINF 585 Fall 2015 Machine Learning for Systems Biology & Clinical Informatics http://www.ccmb.med.umich.edu/node/1376
 Course Director: Dr. Kayvan Najarian (DCM&B, kayvan@umich.edu) Lectures: Labs: Mondays and Wednesdays 9:00 AM -10:30 AM Rm. 2065 Palmer Commons Bldg. Wednesdays 10:30 AM 11:30 AM (alternate weeks) Rm.
Bildverarbeitung und Mustererkennung Image Processing and Pattern Recognition
 Bildverarbeitung und Mustererkennung Image Processing and Pattern Recognition 1. Image Pre-Processing - Pixel Brightness Transformation - Geometric Transformation - Image Denoising 1 1. Image Pre-Processing
Supporting Online Material for
 www.sciencemag.org/cgi/content/full/313/5786/504/dc1 Supporting Online Material for Reducing the Dimensionality of Data with Neural Networks G. E. Hinton* and R. R. Salakhutdinov *To whom correspondence
EM Clustering Approach for Multi-Dimensional Analysis of Big Data Set
 EM Clustering Approach for Multi-Dimensional Analysis of Big Data Set Amhmed A. Bhih School of Electrical and Electronic Engineering Princy Johnson School of Electrical and Electronic Engineering Martin
Non-negative Matrix Factorization (NMF) in Semi-supervised Learning Reducing Dimension and Maintaining Meaning
 in Semi-supervised Learning Reducing Dimension and Maintaining Meaning") Non-negative Matrix Factorization (NMF) in Semi-supervised Learning Reducing Dimension and Maintaining Meaning SAMSI 10 May 2013 Outline Introduction to NMF Applications Motivations NMF as a middle step
Non-negative Matrix Factorization (NMF) in Semi-supervised Learning Reducing Dimension and Maintaining Meaning SAMSI 10 May 2013 Outline Introduction to NMF Applications Motivations NMF as a middle step
Accurate and robust image superresolution by neural processing of local image representations
 Accurate and robust image superresolution by neural processing of local image representations Carlos Miravet 1,2 and Francisco B. Rodríguez 1 1 Grupo de Neurocomputación Biológica (GNB), Escuela Politécnica
Applied Linear Algebra I Review page 1
 Applied Linear Algebra Review 1 I. Determinants A. Definition of a determinant 1. Using sum a. Permutations i. Sign of a permutation ii. Cycle 2. Uniqueness of the determinant function in terms of properties
Advanced Signal Processing and Digital Noise Reduction
 Advanced Signal Processing and Digital Noise Reduction Saeed V. Vaseghi Queen's University of Belfast UK WILEY HTEUBNER A Partnership between John Wiley & Sons and B. G. Teubner Publishers Chichester New
Linear Threshold Units
 Linear Threshold Units w x hx (... w n x n w We assume that each feature x j and each weight w j is a real number (we will relax this later) We will study three different algorithms for learning linear
Lecture 3: Linear methods for classification
 Lecture 3: Linear methods for classification Rafael A. Irizarry and Hector Corrada Bravo February, 2010 Today we describe four specific algorithms useful for classification problems: linear regression,
Syllabus for MATH 191 MATH 191 Topics in Data Science: Algorithms and Mathematical Foundations Department of Mathematics, UCLA Fall Quarter 2015
 Syllabus for MATH 191 MATH 191 Topics in Data Science: Algorithms and Mathematical Foundations Department of Mathematics, UCLA Fall Quarter 2015 Lecture: MWF: 1:00-1:50pm, GEOLOGY 4645 Instructor: Mihai
Final Project Report
 CPSC545 by Introduction to Data Mining Prof. Martin Schultz & Prof. Mark Gerstein Student Name: Yu Kor Hugo Lam Student ID : 904907866 Due Date : May 7, 2007 Introduction Final Project Report Pseudogenes
Going Big in Data Dimensionality:
 LUDWIG- MAXIMILIANS- UNIVERSITY MUNICH DEPARTMENT INSTITUTE FOR INFORMATICS DATABASE Going Big in Data Dimensionality: Challenges and Solutions for Mining High Dimensional Data Peer Kröger Lehrstuhl für
Factor analysis. Angela Montanari
 Factor analysis Angela Montanari 1 Introduction Factor analysis is a statistical model that allows to explain the correlations between a large number of observed correlated variables through a small number
1 Spectral Methods for Dimensionality
 1 Spectral Methods for Dimensionality Reduction Lawrence K. Saul Kilian Q. Weinberger Fei Sha Jihun Ham Daniel D. Lee How can we search for low dimensional structure in high dimensional data? If the data
Overview of Violations of the Basic Assumptions in the Classical Normal Linear Regression Model
 Overview of Violations of the Basic Assumptions in the Classical Normal Linear Regression Model 1 September 004 A. Introduction and assumptions The classical normal linear regression model can be written
Introduction Epipolar Geometry Calibration Methods Further Readings. Stereo Camera Calibration
 Stereo Camera Calibration Stereo Camera Calibration Stereo Camera Calibration Stereo Camera Calibration 12.10.2004 Overview Introduction Summary / Motivation Depth Perception Ambiguity of Correspondence
Probabilistic Latent Semantic Analysis (plsa)
") Probabilistic Latent Semantic Analysis (plsa) SS 2008 Bayesian Networks Multimedia Computing, Universität Augsburg Rainer.Lienhart@informatik.uni-augsburg.de www.multimedia-computing.{de,org} References
Probabilistic Latent Semantic Analysis (plsa) SS 2008 Bayesian Networks Multimedia Computing, Universität Augsburg Rainer.Lienhart@informatik.uni-augsburg.de www.multimedia-computing.{de,org} References
Statistical Machine Learning
 Statistical Machine Learning UoC Stats 37700, Winter quarter Lecture 4: classical linear and quadratic discriminants. 1 / 25 Linear separation For two classes in R d : simple idea: separate the classes
Basics of Statistical Machine Learning
 CS761 Spring 2013 Advanced Machine Learning Basics of Statistical Machine Learning Lecturer: Xiaojin Zhu jerryzhu@cs.wisc.edu Modern machine learning is rooted in statistics. You will find many familiar
An Initial Study on High-Dimensional Data Visualization Through Subspace Clustering
 An Initial Study on High-Dimensional Data Visualization Through Subspace Clustering A. Barbosa, F. Sadlo and L. G. Nonato ICMC Universidade de São Paulo, São Carlos, Brazil IWR Heidelberg University, Heidelberg,
1 2 3 1 1 2 x = + x 2 + x 4 1 0 1
 (d) If the vector b is the sum of the four columns of A, write down the complete solution to Ax = b. 1 2 3 1 1 2 x = + x 2 + x 4 1 0 0 1 0 1 2. (11 points) This problem finds the curve y = C + D 2 t which
Text Analytics (Text Mining)
") CSE 6242 / CX 4242 Apr 3, 2014 Text Analytics (Text Mining) LSI (uses SVD), Visualization Duen Horng (Polo) Chau Georgia Tech Some lectures are partly based on materials by Professors Guy Lebanon, Jeffrey
CSE 6242 / CX 4242 Apr 3, 2014 Text Analytics (Text Mining) LSI (uses SVD), Visualization Duen Horng (Polo) Chau Georgia Tech Some lectures are partly based on materials by Professors Guy Lebanon, Jeffrey
CS Master Level Courses and Areas COURSE DESCRIPTIONS. CSCI 521 Real-Time Systems. CSCI 522 High Performance Computing
 CS Master Level Courses and Areas The graduate courses offered may change over time, in response to new developments in computer science and the interests of faculty and students; the list of graduate
A Partially Supervised Metric Multidimensional Scaling Algorithm for Textual Data Visualization
 A Partially Supervised Metric Multidimensional Scaling Algorithm for Textual Data Visualization Ángela Blanco Universidad Pontificia de Salamanca ablancogo@upsa.es Spain Manuel Martín-Merino Universidad
Multidimensional data and factorial methods
 Multidimensional data and factorial methods Bidimensional data x 5 4 3 4 X 3 6 X 3 5 4 3 3 3 4 5 6 x Cartesian plane Multidimensional data n X x x x n X x x x n X m x m x m x nm Factorial plane Interpretation
Mixtures of Robust Probabilistic Principal Component Analyzers
 Mixtures of Robust Probabilistic Principal Component Analyzers Cédric Archambeau, Nicolas Delannay 2 and Michel Verleysen 2 - University College London, Dept. of Computer Science Gower Street, London WCE
17. Inner product spaces Definition 17.1. Let V be a real vector space. An inner product on V is a function
 17. Inner product spaces Definition 17.1. Let V be a real vector space. An inner product on V is a function, : V V R, which is symmetric, that is u, v = v, u. bilinear, that is linear (in both factors):
13 MATH FACTS 101. 2 a = 1. 7. The elements of a vector have a graphical interpretation, which is particularly easy to see in two or three dimensions.
 3 MATH FACTS 0 3 MATH FACTS 3. Vectors 3.. Definition We use the overhead arrow to denote a column vector, i.e., a linear segment with a direction. For example, in three-space, we write a vector in terms
Visualization of General Defined Space Data
 International Journal of Computer Graphics & Animation (IJCGA) Vol.3, No.4, October 013 Visualization of General Defined Space Data John R Rankin La Trobe University, Australia Abstract A new algorithm
Contributions to high dimensional statistical learning
 Contributions to high dimensional statistical learning Stéphane Girard INRIA Rhône-Alpes & LJK (team MISTIS). 655, avenue de l Europe, Montbonnot. 38334 Saint-Ismier Cedex, France Stephane.Girard@inria.fr
LABEL PROPAGATION ON GRAPHS. SEMI-SUPERVISED LEARNING. ----Changsheng Liu 10-30-2014
 LABEL PROPAGATION ON GRAPHS. SEMI-SUPERVISED LEARNING ----Changsheng Liu 10-30-2014 Agenda Semi Supervised Learning Topics in Semi Supervised Learning Label Propagation Local and global consistency Graph
Principal Component Analysis
 Principal Component Analysis ERS70D George Fernandez INTRODUCTION Analysis of multivariate data plays a key role in data analysis. Multivariate data consists of many different attributes or variables recorded
Analysis of kiva.com Microlending Service! Hoda Eydgahi Julia Ma Andy Bardagjy December 9, 2010 MAS.622j
 Analysis of kiva.com Microlending Service! Hoda Eydgahi Julia Ma Andy Bardagjy December 9, 2010 MAS.622j What is Kiva? An organization that allows people to lend small amounts of money via the Internet
A Simple Introduction to Support Vector Machines
 A Simple Introduction to Support Vector Machines Martin Law Lecture for CSE 802 Department of Computer Science and Engineering Michigan State University Outline A brief history of SVM Large-margin linear
Inner Product Spaces and Orthogonality
 Inner Product Spaces and Orthogonality week 3-4 Fall 2006 Dot product of R n The inner product or dot product of R n is a function, defined by u, v a b + a 2 b 2 + + a n b n for u a, a 2,, a n T, v b,
by the matrix A results in a vector which is a reflection of the given
 Eigenvalues & Eigenvectors Example Suppose Then So, geometrically, multiplying a vector in by the matrix A results in a vector which is a reflection of the given vector about the y-axis We observe that
MS1b Statistical Data Mining
 MS1b Statistical Data Mining Yee Whye Teh Department of Statistics Oxford http://www.stats.ox.ac.uk/~teh/datamining.html Outline Administrivia and Introduction Course Structure Syllabus Introduction to
A New Method for Dimensionality Reduction using K- Means Clustering Algorithm for High Dimensional Data Set
 A New Method for Dimensionality Reduction using K- Means Clustering Algorithm for High Dimensional Data Set D.Napoleon Assistant Professor Department of Computer Science Bharathiar University Coimbatore
Least-Squares Intersection of Lines
 Least-Squares Intersection of Lines Johannes Traa - UIUC 2013 This write-up derives the least-squares solution for the intersection of lines. In the general case, a set of lines will not intersect at a
BEHAVIOR BASED CREDIT CARD FRAUD DETECTION USING SUPPORT VECTOR MACHINES
 BEHAVIOR BASED CREDIT CARD FRAUD DETECTION USING SUPPORT VECTOR MACHINES 123 CHAPTER 7 BEHAVIOR BASED CREDIT CARD FRAUD DETECTION USING SUPPORT VECTOR MACHINES 7.1 Introduction Even though using SVM presents
Notes on Orthogonal and Symmetric Matrices MENU, Winter 2013
 Notes on Orthogonal and Symmetric Matrices MENU, Winter 201 These notes summarize the main properties and uses of orthogonal and symmetric matrices. We covered quite a bit of material regarding these topics,
Visualization by Linear Projections as Information Retrieval
 Visualization by Linear Projections as Information Retrieval Jaakko Peltonen Helsinki University of Technology, Department of Information and Computer Science, P. O. Box 5400, FI-0015 TKK, Finland jaakko.peltonen@tkk.fi
Multimedia Databases. Wolf-Tilo Balke Philipp Wille Institut für Informationssysteme Technische Universität Braunschweig http://www.ifis.cs.tu-bs.
 Multimedia Databases Wolf-Tilo Balke Philipp Wille Institut für Informationssysteme Technische Universität Braunschweig http://www.ifis.cs.tu-bs.de 14 Previous Lecture 13 Indexes for Multimedia Data 13.1
ViSOM A Novel Method for Multivariate Data Projection and Structure Visualization
 IEEE TRANSACTIONS ON NEURAL NETWORKS, VOL. 13, NO. 1, JANUARY 2002 237 ViSOM A Novel Method for Multivariate Data Projection and Structure Visualization Hujun Yin Abstract When used for visualization of
Lecture 5: Singular Value Decomposition SVD (1)
") EEM3L1: Numerical and Analytical Techniques Lecture 5: Singular Value Decomposition SVD (1) EE3L1, slide 1, Version 4: 25-Sep-02 Motivation for SVD (1) SVD = Singular Value Decomposition Consider the system
EEM3L1: Numerical and Analytical Techniques Lecture 5: Singular Value Decomposition SVD (1) EE3L1, slide 1, Version 4: 25-Sep-02 Motivation for SVD (1) SVD = Singular Value Decomposition Consider the system
3 Orthogonal Vectors and Matrices
 3 Orthogonal Vectors and Matrices The linear algebra portion of this course focuses on three matrix factorizations: QR factorization, singular valued decomposition (SVD), and LU factorization The first
Volume 2, Issue 9, September 2014 International Journal of Advance Research in Computer Science and Management Studies
 Volume 2, Issue 9, September 2014 International Journal of Advance Research in Computer Science and Management Studies Research Article / Survey Paper / Case Study Available online at: www.ijarcsms.com
Computational Optical Imaging - Optique Numerique. -- Deconvolution --
 Computational Optical Imaging - Optique Numerique -- Deconvolution -- Winter 2014 Ivo Ihrke Deconvolution Ivo Ihrke Outline Deconvolution Theory example 1D deconvolution Fourier method Algebraic method
Chapter 7. Lyapunov Exponents. 7.1 Maps
 Chapter 7 Lyapunov Exponents Lyapunov exponents tell us the rate of divergence of nearby trajectories a key component of chaotic dynamics. For one dimensional maps the exponent is simply the average
Exploratory Factor Analysis
 Exploratory Factor Analysis Definition Exploratory factor analysis (EFA) is a procedure for learning the extent to which k observed variables might measure m abstract variables, wherein m is less than
The Singular Value Decomposition in Symmetric (Löwdin) Orthogonalization and Data Compression
 Orthogonalization and Data Compression") The Singular Value Decomposition in Symmetric (Löwdin) Orthogonalization and Data Compression The SVD is the most generally applicable of the orthogonal-diagonal-orthogonal type matrix decompositions Every
The Singular Value Decomposition in Symmetric (Löwdin) Orthogonalization and Data Compression The SVD is the most generally applicable of the orthogonal-diagonal-orthogonal type matrix decompositions Every
Dimensionality Reduction: Principal Components Analysis
 Dimensionality Reduction: Principal Components Analysis In data mining one often encounters situations where there are a large number of variables in the database. In such situations it is very likely
Statistical Data Mining. Practical Assignment 3 Discriminant Analysis and Decision Trees
 Statistical Data Mining Practical Assignment 3 Discriminant Analysis and Decision Trees In this practical we discuss linear and quadratic discriminant analysis and tree-based classification techniques.
Acknowledgments. Data Mining with Regression. Data Mining Context. Overview. Colleagues
 Data Mining with Regression Teaching an old dog some new tricks Acknowledgments Colleagues Dean Foster in Statistics Lyle Ungar in Computer Science Bob Stine Department of Statistics The School of the
Modelling, Extraction and Description of Intrinsic Cues of High Resolution Satellite Images: Independent Component Analysis based approaches
 Modelling, Extraction and Description of Intrinsic Cues of High Resolution Satellite Images: Independent Component Analysis based approaches PhD Thesis by Payam Birjandi Director: Prof. Mihai Datcu Problematic