Standard Eurobarometer 85 Spring Public opinion in the European Union
|
|
|
- Blaise Cooper
- 7 years ago
- Views:
Transcription

1 Public opinion in the European Union Survey requested and co-ordinated by the European Commission, Directorate-General for Communication Fieldwork May 2016 Publication July 2016 This document does not represent the point of view of the European Commission. The interpretations and opinions contained in it are solely those of the authors. Wave EB85.2 TNS opinion & social
2 Public opinion in the European Union Fieldwork: May 2016 Survey conducted by TNS opinion & social at the request of the European Commission, Directorate-General for Communication Survey co-ordinated by the European Commission, Directorate-General for Communication (DG COMM Strategy, Corporate Communication Actions and Eurobarometer Unit) 1
3 Project number Project title Public opinion in the European Union, Language version EN Catalogue number NA EN-N ISBN doi: /476 European Union,
4 TABLE OF CONTENTS INTRODUCTION 2 I. THE MAIN CONCERNS OF EUROPEANS 4 1 Main concerns at European level: evolutions 4 2 Main concerns at European level: national results 6 3 Main concerns at national level: evolutions 8 4 Main concerns at national level: national results 10 5 Main concerns at personal level: national results 12 II. EUROPEANS AND POLITICAL INSTITUTIONS 14 1 Trust in national governments and parliaments and in the European Union: trend 14 2 The image of the European Union: trend 15 3 The image of the European Union: national results 16 4 My voice counts in the European Union: trend 17 5 My voice counts in the European Union: national results 18 6 The future of the European Union: trend 19 7 The future of the European Union: national results 20 III. THE ECONOMIC SITUATION 21 1 Current situation of the economy at national level: national results and evolutions 21 2 Impact of the crisis on jobs: trend 24 3 Impact of the crisis on jobs: national results and evolutions 25 IV. EUROPEAN UNION'S POLITICAL PRIORITIES 27 1 Stimulating investment 27 2 Digital Single Market 29 3 Energy Union 30 4 Internal Market: free movement 31 5 Support for the euro 32 6 Support for a free trade and investment agreement between the European Union and the United States 34 7 Migration issues 35 8 The European Union as a global actor 37 V. EUROPEAN CITIZENSHIP 38 1 Feeling like a citizen of the European Union: national results 38 2 Most positive results of the European Union: evolutions 39 CONCLUSION 40 ANNEXES Technical specifications 1
5 INTRODUCTION This report presents the first results of the Standard Eurobarometer survey of spring 2016 (EB85), which was carried out between 21 and 31 May 2016 in 34 countries or territories 1 : the 28 European Union (EU) Member States, five candidate countries (the Former Yugoslav Republic of Macedonia, Turkey, Montenegro, Serbia and Albania) and the Turkish Cypriot Community in the part of the country that is not controlled by the government of the Republic of Cyprus. This report provides a selection of data on topics such as the European political situation and the economy. It focuses on the results obtained in the 28 EU Member States and is published jointly with the results of the Standard Eurobarometer questions, which are set out in an annex. All the results of the Standard Eurobarometer of spring 2016 will be analysed in the "Full report". The Standard Eurobarometer survey of spring 2016 was conducted shortly after the publication of the European Commission's spring 2016 European economic forecast 2. It showed contrasting results: while unemployment is still declining, the GDP growth forecast for 2016 is lower than the official figure for Economic growth is expected to remain modest at 1.8% in the EU and 1.6% in the euro area. 3. Unemployment has continued to decline both in the EU as a whole and in the euro area: the unemployment rate has fallen below the 9% threshold in the EU28 for the first time since 2009 (8.7%, -0.9 percentage points, down from 9.6% in April 2015) 4. A similar decrease is observed in the euro area (10.2%, -0.8 down from 11.0%). After the peak registered in August, September and October 2015, the number of persons entering Europe has fallen month on month 5. On 18 March 2016, the EU Heads of State or Government and Turkey reached an agreement aimed at stopping the flow of irregular migration via Turkey to the European Union. Since the Standard Eurobarometer survey of autumn 2015, Brussels has been struck by deadly terrorist attacks on 22 March 2016, in the Maelbeek metro station, and at the Brussels Zaventem airport, following the attacks in Paris and Copenhagen in National elections have taken place in Spain, Ireland and Slovakia and presidential elections have been held in Portugal and Austria. Just after beginning of fieldwork, parliamentary elections were held in Cyprus, on 22 May On 3 December 2015, the Danes rejected EU rules on cross-border policing in a referendum. In the Netherlands, the Dutch rejected the association agreement between the EU and Ukraine, also via a referendum, on 6 April The fieldwork was carried out during the campaign for the referendum on the United Kingdom's EU membership. The referendum took place on 23 June 2016, three weeks after the end of the fieldwork. 1 Please consult the technical specifications for the exact fieldwork dates in each Member State
6 The methodology used is that of the Standard Eurobarometer surveys carried out by the Directorate-General for Communication ( Strategy, Corporate Communication Actions and Eurobarometer Unit) 6. It is the same for all countries and territories covered in the survey. A technical note concerning the interviews conducted by the member institutes of the TNS Opinion & Social network is annexed to this report. It also specifies the confidence intervals 7. Note: In this report, countries are referred to by their official abbreviation. The abbreviations used in this report correspond to: Belgium BE Lithuania LT Bulgaria BG Luxembourg LU Czech Republic CZ Hungary HU Denmark DK Malta MT Germany DE The Netherlands NL Estonia EE Austria AT Ireland IE Poland PL Greece EL Portugal PT Spain ES Romania RO France FR Slovenia SI Croatia HR Slovakia SK Italy IT Finland FI Republic of Cyprus CY * Sweden SE Latvia LV United Kingdom UK Turkish Cypriot Community CY(tcc) Albania AL Turkey TR Montenegro ME Serbia RS Former Yugoslav Republic of Macedonia (FYROM) MK ** European Union weighted average for the 28 Member States EU28 BE, FR, IT, LU, DE, AT, ES, PT, IE, NL, FI, EL, EE, SI, CY, MT, SK, LV, LT Euro area BG, CZ, DK, HR, HU, PL, RO, SE, UK Non euro area * Cyprus as a whole is one of the 28 European Union Member States. However, the acquis communautaire has been suspended in the part of the country which is not controlled by the government of the Republic of Cyprus. For practical reasons, only the interviews carried out in the part of the country controlled by the government of the Republic of Cyprus are included in the CY category and in the EU28 average. ** Provisional abbreviation which in no way prejudges the definitive name of this country, which will be agreed once the current negotiations at the United Nations have been completed We wish to thank the people throughout the European Union who have given their time to take part in this survey. Without their active participation, this study would not have been possible The results tables are annexed. It should be noted that the total of the percentages indicated in the tables in this report may exceed 100% when the respondent was able to choose several answers to the same question. 3
7 I. THE MAIN CONCERNS OF EUROPEANS 1 Main concerns at European level: evolutions Migration and terrorism are very clearly ahead in terms of concerns at EU level. Close to half of Europeans see immigration as one of the two most important issues facing the EU (48%); however, this item has lost 10 percentage points since the previous survey of autumn 2015 after a 20-point increase between spring and autumn This is the first time that mentions of immigration have declined since spring After a 14-point increase, terrorism is now mentioned by 39% of Europeans, consolidating its position as second most important concern. This is the fourth successive increase since autumn 2014 (+33, up from 6%). The item economic situation (19%, -2) is in third place. Since spring 2012, mentions of the economic situation have decreased continuously (-40, down from 59% in autumn 2011). 4
8 5
9 2 Main concerns at European level: national results Mentioned by 48% of citizens at EU level, immigration is among the top two concerns in every Member State except Portugal. It continues to be seen as the most important issue facing the EU in 20 Member States (down from 27 in autumn 2015), led by Estonia (73%), Denmark (71%), and the Czech Republic, Latvia and Hungary (all 67%). In the remaining countries, except Portugal, immigration is seen as the second most important issue facing the EU. After a sharp 14-point increase, terrorism is now mentioned by 39% of Europeans. Terrorism is among the top two concerns in every Member State except Greece. It is the leading item in eight Member States Ireland (50%), Cyprus (50%), Romania (49%), Croatia (48%), Luxembourg (47%), Portugal (40%), France (39%) and Spain (35%), and is in second position in 19 countries. Cited by 19% of citizens, the economic situation is in third place at EU level. It reaches its highest scores in Greece (35%), where it is seen as the second most important issue, and in Spain (29%), Cyprus (28%) and Finland (25%). The state of Member States' public finances is in fourth position at EU level, mentioned by 16% of Europeans, but by more than a third of respondents in Portugal (34%), where it stands in second place. Unemployment is mentioned by 15% of respondents at EU level, in fifth position, and achieves its highest score in Portugal (28%, in third place). 6

10 7
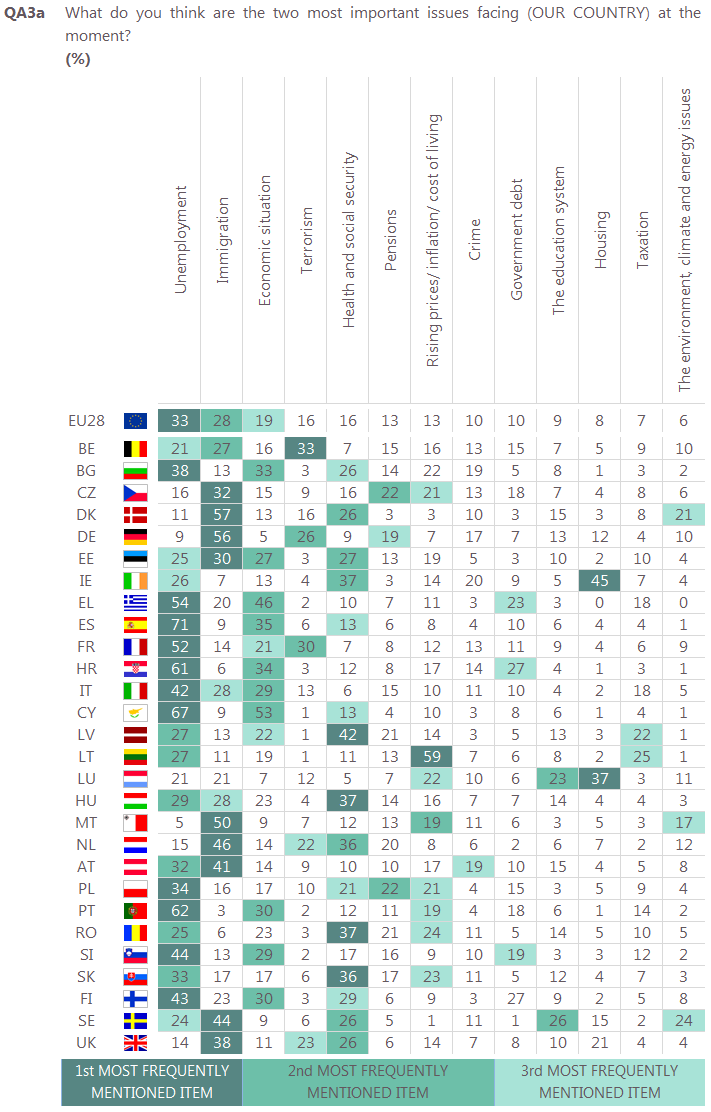
11 3 Main concerns at national level: evolutions A third of Europeans see unemployment as the most important issue facing their country (33%, -3 percentage points since autumn 2015). This item has been the most important national concern since spring 2012, but its score has steadily decreased since autumn 2013 (-18 percentage points, down from 51% in spring 2013). Immigration remains the second most important issue at the national level (28%, -8).. The economic situation is in third position (19%, unchanged), while health and social security (16%, +2) and terrorism (16%, +5) share fourth place. After a 3-point increase, pensions are the sixth concern of Europeans at national level (13%), in equal place with rising prices/inflation/cost of living (13%, -1). 8
12 9
13 4 Main concerns at national level: national results In first place at EU level with 33% of mentions, unemployment is in first place in 11 countries, led by Spain (71%), Cyprus (67%), Portugal (62%), Croatia (61%), Greece (54%) and France (52%). Unemployment is seen as the second most important national issue in six other Member States. Mentioned by 28% of Europeans, and in second place at EU level, immigration is in first position in nine Member States, and is mentioned by at least half of respondents in Denmark (57%), Germany (56%) and Malta (50%). The economic situation is in third place at EU level, mentioned by 19% of Europeans, and stands in second place in nine Member States, reaching its highest scores in Cyprus (53%) and Greece (46%). Mentioned by 16% of EU citizens, terrorism is in fourth place at EU level and comes first in Belgium (33%) and second in France (30%) and Germany (26%). Sharing the fourth place at EU level with terrorism, health and social security is the leading national issue in four Member States: Latvia (42%), Hungary and Romania (both 37%) and Slovakia (36%). Rising prices/inflation/cost of living is the most mentioned item in Lithuania (59%, compared with 13% at EU level, in equal sixth place with pensions), whereas housing, in 11th position at EU level (8%), comes first in Ireland (45%) and Luxembourg (37%). 10
14 11
15 5 Main concerns at personal level: national results The ranking of concerns at personal level remains stable. 26% of Europeans (-1 percentage point since autumn 2015) say that rising prices/inflation/cost of living are the most important personal issue. Since autumn 2012, this item has lost ground almost continuously (-19 percentage points, down from 45% in spring 2012), though it has retained its first place. In second position, pensions are mentioned by 16% of Europeans (+2). Health and social security (15%, unchanged) and the household financial situation (15%, -1) share the third place, these two items having generally changed little since spring In fifth place, unemployment is mentioned by 14% of Europeans (unchanged), just above taxation (13%, also unchanged). All other items are mentioned by less than one in ten respondents. 12

16 13
17 II. EUROPEANS AND POLITICAL INSTITUTIONS 1 Trust in national governments and parliaments and in the European Union: trend Around a third of Europeans trust the European Union (33%). After the sharp fall registered in the autumn 2015 survey (-8 percentage points between spring and autumn 2015), the downward trend has been halted: trust in the EU has increased slightly (+1 since autumn 2015). Meanwhile, trust in the national political institutions has remained stable, but at a lower level than trust in the EU: 28% of Europeans tend to trust their national parliament (unchanged) and 27% their national government (unchanged). While the proportions of Europeans who tend not to trust their national political institutions has risen slightly (65% for the national parliament, +1 percentage point since autumn 2015, and 68% for the national government, +2), the proportion of EU citizens who do not trust the European Union has remained stable (55%, unchanged). 14
18 2 The image of the European Union: trend A majority of Europeans say they have a neutral image of the EU (38%, unchanged since autumn 2015). This result has remained very stable since spring 2012, hovering between 39% and 37%, with no more than a single percentage point evolution in each subsequent survey. The proportion of Europeans for whom the EU conjures up a positive image has decreased by three percentage points, to 34%, while the proportion who have a negative image of the EU has risen to 27% (+4 since autumn 2015). 15
: Ireland (58%), Bulgaria (51%), Poland (47%), Luxembourg (45%), Portugal (41%), France (36%)")
19 3 The image of the European Union: national results The European Union tends to conjure up a predominantly neutral image in 17 Member States (up from 15 in autumn 2015). A majority of respondents have a positive image of the EU in seven countries (down from 11 in autumn 2015): Ireland (58%), Bulgaria (51%), Poland (47%), Luxembourg (45%), Portugal (41%), France (36%) and Belgium (35%). As in spring and autumn 2015, respondents in Cyprus (41%) and Austria (37%) have a negative image of the EU. This is now also the case in Greece (51%) and the United Kingdom (36%), where the EU s image was predominantly neutral in autumn Since autumn 2015, the positive image of the EU has lost ground in 20 Member States, most strikingly in Romania (42%, -15 percentage points), Croatia (37%, -14), and Lithuania (43%, -10). However, it has gained ground in seven Member States, led by Austria (32%, +9), Cyprus (27%, +5) and Ireland (58%, +4). 16
20 4 My voice counts in the European Union: trend Fewer than four in ten Europeans agree that their "voice counts in the EU" (38%, -1 percentage point since autumn 2015), while 55% disagree with this statement (+1). Though the feeling that my voice counts in the EU is slightly less widespread than in spring 2014 (- 4, down from 42% in the survey conducted just after the 2014 European elections 8 ), it remains at a equal or higher level than during the period between spring and autumn EB81, the Standard Eurobarometer survey of spring 2014 was conducted between 31 May and 14 June 2014, just after the eighth European elections that took place across the EU between 22 and 25 May EB71, the Standard Eurobarometer survey of spring 2009 was conducted between 12 June and 6 July

21 5 My voice counts in the European Union: national results A majority of respondents agree that their voice counts in the European Union in ten Member States; conversely, majorities disagree with this statement in 16 countries, while respondents are evenly divided in Germany and in Ireland. The highest proportions of respondents who consider that their voice counts in the EU are found in Sweden (66%), Denmark (63%), Croatia (54%), the Netherlands (53%) and Belgium (53%). At the other end of the scale, this opinion is the least widespread in Cyprus and Greece (16% in both countries). 18
22 6 The future of the European Union: trend Half of EU citizens are optimistic about the future of the EU (50%, -3 percentage points since autumn 2015), while 44% are pessimistic (+3). At +6, the index of optimism 10 has lost six points since autumn 2015 and 16 points since spring 2015; it has fallen to its lowest level since the survey of spring 2013 (where it stood at +3). 10 Difference between the answers optimistic and pessimistic. 19
, Romania (70%), Malta (67%) and Lithuania (66%). Conversely, majorities of respondents are pessimistic in Greece (28% optimistic vs.")
23 7 The future of the European Union: national results In 21 Member States, majorities of respondents are optimistic about the future of the EU (down from 22 in autumn 2015), with the highest proportions observed in Ireland (77%), Romania (70%), Malta (67%) and Lithuania (66%). Conversely, majorities of respondents are pessimistic in Greece (28% optimistic vs. 70% pessimistic ), Cyprus (40% vs. 54%), Germany (42% vs. 51%), France (44% vs. 51%) and the Czech Republic (48% vs. 50%) five countries where this was already the case in autumn 2015, Hungary (44% vs. 52%) and the United Kingdom (44% vs. 46%). Since Autumn 2015, optimism has increased in ten Member States, most strikingly in Austria (50%, +10 percentage points). It has lost ground in 17 Member States.. In France, optimism has remained unchanged (44%). 20
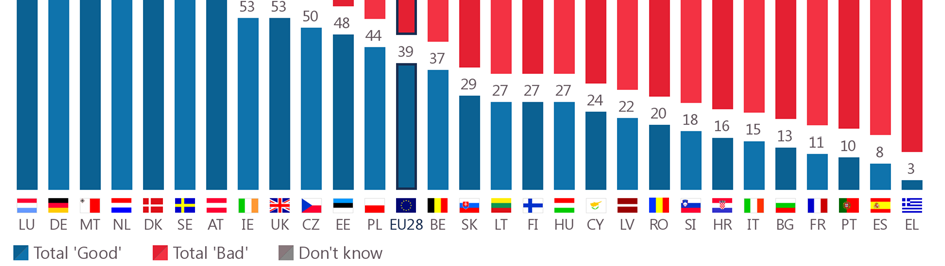
24 III. THE ECONOMIC SITUATION 1 Current situation of the economy at national level: national results and evolutions Close to four in ten Europeans say that the present national economic situation is good (39%, -1 percentage point since autumn 2015), while 57% think it is bad (unchanged). The upward trend since autumn 2013, with increasing proportions of respondents who see their national economy in a positive light (+14 percentage points, from 26% in spring 2013 up to 40% in autumn 2015), has halted. Though slightly fewer people now say their national economy is good, the gap between countries has widened even more and has reached a new record: 85 points separate Luxembourg, where 88% of the population say that the situation of their national economy is good, from Greece, where 3% do so. Majorities of respondents say that the national economic situation is good in 11 countries (down from 12 in autumn 2015), while a majority of respondents are pessimistic in 17 Member States. More than threequarters of the population see their national economy in a positive light in Luxembourg (88%), Germany (83%), Malta (80%), the Netherlands (78%), Denmark (77%) and Sweden (76%). They are followed by a second group of countries where the majorities are smaller, ranging from 48% to 59%: Austria (59%), Ireland (53%), the United Kingdom (53%), the Czech Republic (50%) and Estonia (48% vs. 46%). Minorities of respondents describe the national economy as good in the remaining countries, with the lowest proportions in Greece (3%), Spain (8%) and Portugal (10%). Positive impressions of the national economy have gained ground in eight Member States, remained unchanged in three, and decreased in 17. The largest rise is in Cyprus (24%, +10 percentage points), while good answers have decreased most steeply in Lithuania (27%, -10), Belgium (37%, -10), Denmark (77%, -6), Romania (20%, -5) and Malta (80%, -5). 21
25 22
26 23
27 2 Impact of the crisis on jobs: trend A majority of Europeans consider that in terms of the impact of the economic crisis on jobs the worst is still to come (47%, +1 percentage point since autumn 2015, and +5 since spring 2015), whereas 41% think that the impact of the crisis on jobs has already reached its peak (-3 since autumn 2015, and -7 since spring 2015). This is the first time that optimism has lost ground twice in a row, and at -6, the index of optimism is now at its lowest level since autumn 2013, when it stood at Difference between the scores for the impact of the crisis on jobs has already reached its peak and the worst is still to come. 24
.")
28 3 Impact of the crisis on jobs: national results and evolutions In 13 Member States, majorities of respondents believe that the impact of the crisis on jobs has already reached its peak (up from 12 in autumn 2015). This opinion is shared by more than half of respondents in Ireland (71%), the Netherlands (68%), Denmark (67%), Finland (54%), Croatia and the Czech Republic (both 53%), Hungary (52%) and Malta (51%). Conversely, majorities of citizens say that the worse is still to come in 13 Member States, most strikingly in Greece (69%), France (60%), Lithuania and Belgium (both 57%). Opinion is evenly divided in Spain (47% vs. 47%) and Slovakia (45% vs. 45%). Optimism has risen in 13 Member States (up from three in autumn 2015), led by Finland (54%, +13 percentage points), Sweden (49%, +8) and Luxembourg (38%, +7). Conversely, it has declined in 15 Member States, falling most markedly in Poland (37%, -9), Italy (48%, -9), Spain (47%, -8) and Estonia (30%, -7). Because of these evolutions, optimism has become the majority view in Finland, Bulgaria and Sweden, where pessimism was predominant in autumn 2015; opinion has also reversed in Poland, where the majority are now pessimistic. In Slovakia, where pessimism was the majority view in autumn 2015, and Spain, where the majority were previously optimistic, respondents are now evenly divided. 25
29 26
30 IV. EUROPEAN UNION'S POLITICAL PRIORITIES 1 Stimulating investment More than half of Europeans agree that public money should be used to stimulate private sector investment at EU level (56%, -2 percentage points since autumn 2015); close to three in ten disagree (29%, +1), and 15% say that they don t know (+1). Agreement with this statement has been declining since the question was introduced in autumn 2014, when 61% of respondents agreed, compared with 59% in spring 2015, 58% in autumn 2015 and 56% in spring Majorities of citizens agree with this statement in 25 Member States (down from 26 in autumn 2015), with the highest proportions in Cyprus (77%), Malta (76%), Germany (70%), Croatia (69%), and Slovenia and Belgium (both 66%). At the other end of the scale, the majority of respondents disagree in Spain (41% vs. 40% agree ), whereas public opinion in the United Kingdom (41% vs. 41%) and Sweden (45% vs. 45%) is evenly divided. In 16 Member States, the proportion of respondents who agree that public money should be used to stimulate private sector investment at EU level has fallen, most strikingly in Greece (64%, -8 percentage points), Portugal (56%, -7) and Slovakia (57%, -7). It has remained unchanged in four countries and has increased in eight, most steeply in Bulgaria (64%, +6). 27
31 28
.")
32 2 Digital Single Market More than half of Europeans support a digital single market within the EU (56%, +3 percentage points since autumn 2015), while more than a fifth are opposed (22%, unchanged), and the same proportion say that they don t know (22%, -3). At least half the respondents are in favour of a digital single market in 26 Member States, led by Lituania and Slovenia (both 72%), Estonia (71%) and Croatia (70%). Compared with autumn 2015, support has gained ground in 22 Member States, most strikingly in Ireland (68%, +12 percentage points). 29

33 3 Energy Union Seven Europeans in ten are in favour of a common energy policy among EU Member States (70%) while 20% are opposed, and 10% say they don t know. These proportions are unchanged since autumn Absolute majorities of respondents are in favour of a common energy policy in all Member States, led by Luxembourg (84%), Germany (82%), and Belgium (81%). 30
34 4 Internal Market: free movement Close to eight Europeans in ten support the free movement of EU citizens who can live, work, study and do business anywhere in the EU (79%, +1 percentage point since autumn 2015). This opinion is shared by large proportions of the population in all Member States, ranging from 63% in the United Kingdom to 95% in Latvia. Since autumn 2015, support for the free movement of EU citizens who can live, work, study and do business anywhere in the EU has increased in 22 Member States, most strikingly in Ireland (68%, +12 percentage points), Estonia (71%, +9), Bulgaria (47%, +8), the Czech Republic (50%, +7), Denmark (58%, +7), France (57%, +7), Finland (60%, +7) and the United Kingdom (40%, +7). It has remained unchanged in Hungary (60%) and Slovakia (64%), and has lost ground in Portugal (54%, -4), Greece (61%, -3), Poland (58%, -1) and Germany (61%, -1). 31
35 5 Support for the euro Support for the European economic and monetary union with a single currency, the euro: trend A large majority of Europeans support a European economic and monetary union with one single currency, the euro (55% for, -1 percentage point), whereas 38% say they are against (+1). While more than two-thirds of respondents support the euro within the euro area (68%, vs. 26%, both unchanged), a majority oppose the single currency outside the euro area (61% against, +3 percentage points), where support has fallen slightly (31% for, -1). 32
, including all those belonging to the euro area.")
36 Support for the European economic and monetary union with a single currency, the euro: national results and evolutions In 22 Member States majorities of citizens say they are in favour of a European economic and monetary union with one single currency, the euro (as in autumn 2015), including all those belonging to the euro area. In nine countries, more than three-quarters of respondents agree: Luxembourg (82%), Ireland (80%), Slovenia (80%), Latvia (78%), Estonia (78%), Slovakia (78%), the Netherlands (77%), Belgium (77%) and Finland (76%). Majorities of respondents are against the single currency in six Member States, all outside the euro area: the United Kingdom (76% against ), the Czech Republic (75%), Sweden (71%), Denmark (65%), Poland (55%) and Bulgaria (46% vs. 42% for ). In the remaining three countries outside the euro area, majorities support the single currency: Romania (57% for vs. 33% against ), Croatia (54% vs. 38%) and Hungary (51% vs. 41%). While support for the euro has decreased slightly at EU level since autumn 2015, it has gained ground in 17 Member States, most strikingly in Austria (69%, +7 percentage points) and Latvia (78%, +6). It has remained stable in two countries and has fallen in nine, led by Greece (62%, -8) and Romania (57%, -6). 33
, while just above a third are opposed to it (34%, +2), and 15% don t know (unchanged).")
37 6 Support for a free trade and investment agreement between the European Union and the United States Around half of Europeans are in favour of a free trade and investment agreement between the European Union and the United States (51%, -2 percentage points since autumn 2015), while just above a third are opposed to it (34%, +2), and 15% don t know (unchanged). Since this question was first asked autumn in 2014, approval has decreased continuously (from 58% in autumn 2014 down to 51%), whereas opposition has gained ground (from 25% up to 34%). Majorities of respondents support a free trade and investment agreement between the European Union and the United States in 24 Member States (the same countries as in autumn 2015), with highest proportions in Lithuania (77%), Ireland (70%), Romania and Sweden (both 68%) and Denmark (67%). At the other end of the scale, majorities of citizens oppose such an agreement in Austria (70% against vs. 20% for ), Germany (59% vs. 26%), Slovenia (52% vs. 37%) and Luxembourg (50% vs. 36%). Support for a free trade and investment agreement has declined in 18 countries, most steeply in Croatia (47%, -8 percentage points), Spain (55%, -8) and Poland (59%, -7). It has remained stable in Bulgaria (58%), the Netherlands (53%) and France (50%), and has gained ground in seven Member States: Sweden (68%, +8), the Czech Republic (56%, +7), Estonia (64%, +6), Denmark (67%, +5), the United Kingdom (64%, +2), Hungary (55%, +2) and Ireland (70%, +1). 34
38 7 Migration issues Support for a common European policy on migration A large majority of Europeans support a common European policy on migration (67%, -1 percentage point since autumn 2015, -6 since spring 2015), while more than a quarter are against (26%, +2 since autumn 2015, +6 since spring 2015), and 7% don t know (-1). Majorities of respondents are in favour of a common European policy on migration in 26 Member States (down from 27 in autumn 2015), most strikingly in Luxembourg (81%), the Netherlands (81%) and Spain (80%). The Czech Republic (54% against vs. 41%) and Estonia (44% vs. 42%) are the only countries where majorities of respondents oppose a common policy on migration. Support for a common European policy on migration has gained ground in 11 Member States since autumn 2015, most steeply in France (71%, +7 percentage points). It has remained unchanged in four countries, and has declined in 13, in particular in Poland (48%, -6) and in Hungary (49%, -6). 35
39 Does immigration evoke positive or negative feelings? Close to six Europeans in ten say that the immigration of people from other EU Member States evokes a positive feeling (58%, +3 percentage points since autumn 2015, +7 since spring 2015); conversely, 35% (-3 since autumn 2015, -5 since spring 2015) say that it evokes a negative feeling for them. However, just above a third of Europeans say that immigration of people from outside the EU evokes a positive feeling (34%, unchanged), while a majority of Europeans have negative views (58%, -1). As in autumn 2015, positive feelings about the immigration of people from other EU Member States are predominant in 23 countries, with the highest proportions in Luxembourg (81% positive ), Sweden (78%), and Ireland and Finland (both 77%). Conversely, majorities of respondents have negative feelings in Cyprus (58% negative ), Latvia (51%), the Czech Republic (49% vs. 44% positive ), Slovakia (49% vs. 45%) and Italy (46% vs. 45%). The proportion of respondents with positive feelings about the immigration of people from other EU Member States has increased in 18 countries, most steeply in Greece (55%, +7 percentage points), Ireland (77%, +6) and Austria (60%, +6). Positive feelings have lost ground in nine countries, but nowhere by more than three percentage points. In 24 Member States, majorities of respondents have a negative feeling about the immigration of people from outside the EU (down from 25 in autumn 2015), with more than eight in ten respondents holding this view in Latvia (86%), Slovakia (84%) and Hungary (83%). As in autumn 2015, positive feelings are predominant in Sweden (62%), Ireland (53%) and Spain (50%), but also in Luxembourg, which has joined this restricted group of countries for the first time (53%). Negative opinions about the immigration of people from outside the EU have lost ground in 18 countries, in particular in Luxembourg (40%, -12 percentage points), Croatia (45%, -8), Slovenia (68%, -8) and France (57%, -7). Conversely, they have increased in eight countries, most steeply in Romania (64%, +10) and Sweden (36%, +9). 36

40 8 The European Union as a global actor More than two in three Europeans think that the EU s voice counts in the world (68%), while a quarter disagree (25%), and 7% say that they don t know. These proportions have remained unchanged since autumn More than three-quarters of the population share this opinion in the Nordic countries (Sweden (84%), Finland (79%) and Denmark (78%)), Malta (81%), Ireland (80%), Portugal (78%), Poland (77%) and Lithuania (76%). 37
41 V. EUROPEAN CITIZENSHIP 1 Feeling like a citizen of the European Union: national results Two in three Europeans feel that they are citizens of the EU (66%, +2 percentage points since autumn 2015), while a third still do not (33%, -1). In 26 Member States, most people say that they feel they are citizens of the EU (up from 24 in autumn 2015). This opinion is most widespread in Luxembourg (93%), Malta (84%), Finland (82%) and Ireland (80%). A majority of people in the UK (53%) say they feel they are citizens of the EU, more than in Italy (49%), Bulgaria (49%) and Greece (46%). 38
42 2 Most positive results of the European Union: evolutions The free movement of people, goods and services within the EU (56% of the total answers, +1 percentage point since autumn 2015) and peace among the Member States of the EU (55%, -1) are still seen by Europeans as the two most positive results of the EU. Both items have held a clear lead since December 2011 when this question was asked for the first time 12. All other items are cited by a quarter of Europeans or less, in almost the same order as in autumn 2015: the euro is perceived as the third most positive result of the EU (25%, unchanged), ahead of student exchange programmes such as ERASMUS (23%, +1 percentage point), in fourth place. Mentioned by less than a fifth of EU citizens, the political and diplomatic influence of the EU in the rest of the world (19%, =) is in fifth position, the economic power of the EU (18%, -1) in sixth, and the level of social welfare (healthcare, education, pensions) in the EU (17%, -1) in seventh place. The Common Agricultural Policy lags behind, mentioned by less than a tenth of Europeans (8%, -2). Both within and outside the euro area, the free movement of people, goods and services within the EU (55% in the euro area, 56% in the non-euro area) and peace among the Member States of the EU (55% in both areas) are seen as the two most positive results of the EU. Behind these two, the hierarchy then diverges: in the euro area, the euro is in third place (32%), ahead of student exchange programmes such as Erasmus (25%, in fourth position), Outside the euro area, the level of social welfare (healthcare, education, pensions) in the EU is in third place (21%), and is followed by student exchange programmes such as ERASMUS, the economic power of the EU and the political and diplomatic influence of the EU in the rest of the world, all in joint fourth place with 19% of mentions. 12 Special Eurobarometer 379: the Future of Europe, December
43 CONCLUSION This Standard Eurobarometer survey (EB85) was conducted between 21 and 31 May 2016, a few months after the terrorist attacks in Paris (13 November 2015) and Brussels (22 March 2016) and a few weeks before the EU referendum in the United Kingdom (23 June 2016). Migration and terrorism are now the dominant concerns. While immigration remains the most important issue facing the EU for Europeans, terrorism has consolidated its second place, after a steep increase in concern. It is now also the fourth most important concern at the national level. Trust in the EU remains stable. After declining between the Eurobarometer surveys of spring 2015 (EB83) and autumn 2015 (EB84), trust in the EU has regained a little ground: at 33%, it remains higher than trust in national parliaments and governments, which have both remained unchanged. A majority of Europeans have a neutral image of the EU; just above a third have a positive image, this proportion having decreased for the second consecutive time. Half of Europeans remain optimistic about the future of the EU, but this proportion has also declined for a second time in a row. Though it has fallen slightly, at 38% the proportion of EU citizens who think that their voice counts in the EU is still equal to or higher than it was between 2009 and 2013, between the 2009 and the 2014 European elections. Improvements in Europeans perceptions of their national economy, which had been almost continuous since autumn 2013 have halted: close to four in ten respondents now say that they perceive the national economic situation as good (39%), while 57% say that it is bad. Close to half of respondents say that the the worst is still to come in terms of the impact of the crisis on the job market. Pessimism has grown in two consecutive surveys for the first time since this question was introduced, in spring Around four in ten respondents think that the impact of the crisis on the job market has already reached its peak. Support for the European Union's political priorities remains strong: more than half of respondents agree that public money should be used to stimulate private investment at EU level, while less than three in ten disagree. More than half of Europeans are in favour of a European economic and monetary union with one single currency, the euro. Majorities of respondents support the euro in 22 Member States. Around eight Europeans in ten are in favour of the free movement of EU citizens who can live, work, study and do business anywhere in the EU. Support for a free trade and investment agreement between the European Union and the United States is less widespread, though it is the majority view in 24 Member States: around half of Europeans are in favour, but this proportion has declined steadily since autumn Around two-thirds of Europeans are in favour of a common European policy on migration. Compared with autumn 2015, more Europeans now have positive feelings about the immigration of people from other EU Member States: 58% of respondents share this view. However, the same proportion say that the immigration of people from outside the EU evokes a negative feeling for them. Finally, around two thirds of Europeans feel they are citizens of the EU and majorities of respondents do so in 26 Member States. 40
44 Technical specifications TECHNICAL SPECIFICATIONS Between the 21 st and the 31 st May 2016, TNS opinion & social, a consortium created between TNS political & social, TNS UK and TNS opinion, carried out the wave 85.2 of the EUROBAROMETER survey, on request of the EUROPEAN COMMISSION, Directorate-General for Communication, Strategy, Corporate Communication Actions and Eurobarometer Unit. The wave 85.2 is the STANDARD EUROBAROMETER 85 and covers the population of the respective nationalities of the European Union Member States, resident in each of the 28 Member States and aged 15 years and over. The STANDARD EUROBAROMETER 85 survey has also been conducted in five candidate countries (Turkey, the Former Yugoslav Republic of Macedonia, Montenegro, Serbia and Albania) and in the Turkish Cypriot Community. In these countries and in the Turkish Cypriot Community, the survey covers the national population of citizens and the population of citizens of all the European Union Member States that are residents in these countries and territories and have a sufficient command of the national languages to answer the questionnaire. TS 1
45 Technical specifications The basic sample design applied in all states is a multi-stage, random (probability) one. In each country, a number of sampling points was drawn with probability proportional to population size (for a total coverage of the country) and to population density. In order to do so, the sampling points were drawn systematically from each of the "administrative regional units", after stratification by individual unit and type of area. They thus represent the whole territory of the countries surveyed according to the EUROSTAT NUTS II 1 (or equivalent) and according to the distribution of the resident population of the respective nationalities in terms of metropolitan, urban and rural areas. In each of the selected sampling points, a starting address was drawn, at random. Further addresses (every Nth address) were selected by standard "random route" procedures, from the initial address. In each household, the respondent was drawn, at random (following the "closest birthday rule"). All interviews were conducted face-to-face in people's homes and in the appropriate national language. As far as the data capture is concerned, CAPI (Computer Assisted Personal Interview) was used in those countries where this technique was available. For each country a comparison between the sample and the universe was carried out. The Universe description was derived from Eurostat population data or from national statistics offices. For all countries surveyed, a national weighting procedure, using marginal and intercellular weighting, was carried out based on this Universe description. In all countries, gender, age, region and size of locality were introduced in the iteration procedure. For international weighting (i.e. EU averages), TNS opinion & social applies the official population figures as provided by EUROSTAT or national statistic offices. The total population figures for input in this post-weighting procedure are listed here. Readers are reminded that survey results are estimations, the accuracy of which, everything being equal, rests upon the sample size and upon the observed percentage. With samples of about 1,000 interviews, the real percentages vary within the following confidence limits: 1 Figures updated in August 2015 TS 2

46 Technical specifications TS 3
INNOBAROMETER 2015 - THE INNOVATION TRENDS AT EU ENTERPRISES
 Eurobarometer INNOBAROMETER 2015 - THE INNOVATION TRENDS AT EU ENTERPRISES REPORT Fieldwork: February 2015 Publication: September 2015 This survey has been requested by the European Commission, Directorate-General
THE ROLE OF PUBLIC SUPPORT IN THE COMMERCIALISATION OF INNOVATIONS
 Flash Eurobarometer THE ROLE OF PUBLIC SUPPORT IN THE COMMERCIALISATION OF INNOVATIONS REPORT Fieldwork: January February 2014 Publication: May 2014 This survey has been requested by the European Commission,
EUROPEAN CITIZENS DIGITAL HEALTH LITERACY
 Flash Eurobarometer EUROPEAN CITIZENS DIGITAL HEALTH LITERACY REPORT Fieldwork: September 2014 Publication: November 2014 This survey has been requested by the European Commission, Directorate-General
INNOVATION IN THE PUBLIC SECTOR: ITS PERCEPTION IN AND IMPACT ON BUSINESS
 Flash Eurobarometer INNOVATION IN THE PUBLIC SECTOR: ITS PERCEPTION IN AND IMPACT ON BUSINESS REPORT Fieldwork: February-March 22 Publication: June 22 This survey has been requested by the European Commission,
EUROPEAN AREA OF SKILLS AND QUALIFICATIONS
 EUROPEAN AREA OF SKILLS AND QUALIFICATIONS REPORT Fieldwork: April - May 2014 Publication: June 2014 This survey has been requested by the European Commission, Directorate-General for Education and Culture
EUROPEANS SATISFACTION WITH RAIL SERVICES
 Flash Eurobarometer 382a EUROPEANS SATISFACTION WITH RAIL SERVICES SUMMARY Fieldwork: September 2013 Publication: December 2013 This survey has been requested by the European Commission, Directorate-General
Special Eurobarometer 431 DATA PROTECTION REPORT
 Special Eurobarometer 431 DATA PROTECTION REPORT Fieldwork: March 2015 Publication: June 2015 This survey has been requested by the European Commission, Directorate-General for Justice and Consumers and
Monitoring the social impact of the crisis: public perceptions in the European Union (wave 6) REPORT
 REPORT") Eurobarometer Monitoring the social impact of the crisis: public perceptions in the European Union (wave 6) REPORT Fieldwork: December 2011 Publication: April 2012 This survey has been requested by Directorate-General
Eurobarometer Monitoring the social impact of the crisis: public perceptions in the European Union (wave 6) REPORT Fieldwork: December 2011 Publication: April 2012 This survey has been requested by Directorate-General
ATTITUDES OF EUROPEANS TOWARDS BUILDING THE SINGLE MARKET FOR GREEN PRODUCTS
 Flash Eurobarometer 367 ATTITUDES OF EUROPEANS TOWARDS BUILDING THE SINGLE MARKET FOR GREEN PRODUCTS SUMMARY Fieldwork: December 2012 Publication: July 2013 This survey has been requested by the European
INTRODUCTION... 2. I. Participation in the 2014 European elections... 3
 ?? Directorate-General for Communication PUBLIC OPINION MONITORING UNIT 2014 EUROPEAN ELECTIONS DESK RESEARCH Brussels, April 2015 Profile of voters and abstainees in the European elections 2014 INTRODUCTION...
THE EUROPEAN EMERGENCY NUMBER 112
 Flash Eurobarometer 368 THE EUROPEAN EMERGENCY NUMBER 112 SUMMARY Fieldwork: January 2013 Publication: February 2013 This survey has been requested by the European Commission, Directorate-General for Communications
EUROPEAN YOUTH: PARTICIPATION IN DEMOCRATIC LIFE
 Flash Eurobarometer EUROPEAN YOUTH: PARTICIPATION IN DEMOCRATIC LIFE REPORT Fieldwork: April 2013 Publication: May 2013 This survey has been requested by the European Commission, Directorate-General for
INVESTING IN INTANGIBLES: ECONOMIC ASSETS AND INNOVATION DRIVERS FOR GROWTH
 Flash Eurobarometer INVESTING IN INTANGIBLES: ECONOMIC ASSETS AND INNOVATION DRIVERS FOR GROWTH REPORT Fieldwork: January February 213 Publication: May 213 This survey has been requested by the European
Special Eurobarometer 379 FUTURE OF EUROPE REPORT. This survey has been requested by the European Commission, Directorate-General for Communication.
 Special Eurobarometer 379 FUTURE OF EUROPE REPORT Fieldwork: December 2011 Publication: April 2012 This survey has been requested by the European Commission, Directorate-General for Communication. http://ec.europa.eu/public_opinion/index_en.htm
HOW COMPANIES INFLUENCE OUR SOCIETY: CITIZENS VIEW
 Flash Eurobarometer HOW COMPANIES INFLUENCE OUR SOCIETY: CITIZENS VIEW REPORT Fieldwork: October-November 2012 Publication: April 2013 This survey has been requested by the European Commission, Directorate-General
User language preferences online. Analytical report
 Flash Eurobarometer 313 The Gallup Organization Flash Eurobarometer European Commission User language preferences online Analytical report Fieldwork: January 2011 Publication: May 2011 This survey was
YOUNG PEOPLE AND DRUGS
 Eurobarometer YOUNG PEOPLE AND DRUGS REPORT Fieldwork: June 2014 Publication: August 2014 This survey has been requested by the European Commission, Directorate-General for Justice and co-ordinated by
ERMInE Database. Presentation by Nils Flatabø SINTEF Energy Research. ERMInE Workshop 2 - Northern Europe Oslo, 1. November 2006
 ERMInE Database Presentation by Nils Flatabø SINTEF Energy Research ERMInE Workshop 2 - Northern Europe Oslo, 1. November 26 Overview Content of the Ermine Database Electronic Questionnaire RTD&D Data
PREFERENCES OF EUROPEANS TOWARDS TOURISM
 Flash Eurobarometer 414 PREFERENCES OF EUROPEANS TOWARDS TOURISM SUMMARY Fieldwork: January 2015 Publication: March 2015 This survey has been requested by the European Commission, Directorate-General for
2013 SMEs Access to Finance survey. Analytical Report
 2013 SMEs Access to Finance survey Analytical Report Date: 14/11/2013 2013 SMEs Access to Finance survey Analytical Report 14 November 2013 Contents Introduction... 2 Summary... 6 1. SMEs most pressing
PREFERENCES OF EUROPEANS TOWARDS TOURISM
 Eurobarometer PREFERENCES OF EUROPEANS TOWARDS TOURISM REPORT Fieldwork: January 2014 Publication: February 2014 This survey has been requested by the European Commission, Directorate-General for Enterprise
E-COMMUNICATIONS HOUSEHOLD SURVEY
 Special Eurobarometer 396 E-COMMUNICATIONS HOUSEHOLD SURVEY REPORT Fieldwork: February - March 2013 Publication: November 2013 This survey has been requested by the European Commission, Directorate-General
Pan-European opinion poll on occupational safety and health
 PRESS KIT Pan-European opinion poll on occupational safety and health Results across 36 European countries Press kit Conducted by Ipsos MORI Social Research Institute at the request of the European Agency
GDP per capita, consumption per capita and comparative price levels in Europe
 Economy and finance Author: Lars SVENNEBYE Statistics in focus 2008 GDP per capita, consumption per capita and comparative price levels in Europe Final results for 2005 and preliminary results for 2006
RETAIL FINANCIAL SERVICES
 Special Eurobarometer 373 RETAIL FINANCIAL SERVICES REPORT Fieldwork: September 211 Publication: April 212 This survey has been requested by the European Commission, Directorate-General Internal Market
SURVEY ON THE TRAINING OF GENERAL CARE NURSES IN THE EUROPEAN UNION. The current minimum training requirements for general care nurses
 SURVEY ON THE TRAINING OF GENERAL CARE NURSES IN THE EUROPEAN UNION This survey serves as a background document for the discussion of the Commission's legislative proposal to modernize the minimum requirements
RETAIL FINANCIAL SERVICES
 Special Eurobarometer 373 RETAIL FINANCIAL SERVICES REPORT Fieldwork: September 211 Publication: March 212 This survey has been requested by Directorate-General Internal Market and Services and co-ordinated
SMES, RESOURCE EFFICIENCY AND GREEN MARKETS
 Eurobarometer SMES, RESOURCE EFFICIENCY AND GREEN MARKETS REPORT Fieldwork: September 2013 Publication: December 2013 This survey has been requested by the European Commission, Directorate-General for
Towards a safer use of the Internet for children in the EU a parents perspective. Analytical report
 Flash Eurobarometer 248 The Gallup Organisation Analytical Report Flash EB N o 251 Public attitudes and perceptions in the euro area Flash Eurobarometer European Commission Towards a safer use of the Internet
RETAILERS ATTITUDES TOWARDS CROSS- BORDER TRADE AND CONSUMER PROTECTION
 Eurobarometer RETAILERS ATTITUDES TOWARDS CROSS- BORDER TRADE AND CONSUMER PROTECTION REPORT Fieldwork: September - October 2012 Publication: June 2013 This survey has been requested by the European Commission,
THE ELECTRONIC CUSTOMS IMPLEMENTATION IN THE EU
 Flash Eurobarometer THE ELECTRONIC CUSTOMS IMPLEMENTATION IN THE EU REPORT Fieldwork: April-May 214 Publication: October 214 This survey has been requested by the European Commission, Directorate-General
ENTERING THE EU BORDERS & VISAS THE SCHENGEN AREA OF FREE MOVEMENT. EU Schengen States. Non-Schengen EU States. Non-EU Schengen States.
 ENTERING THE EU BORDERS & VISAS THE SCHENGEN AREA OF FREE MOVEMENT An area without internal borders where EU citizens and non-eu nationals may move freely EU Schengen States Non-Schengen EU States IS Azores
European Research Council
 ERC Advanced Grants 2011 Outcome: Indicative Statistics Reproduction is authorised provided that the source ERC is acknowledged NB: In these graphs grantee refers to a candidate selected for ERC funding
E-COMMUNICATIONS AND TELECOM SINGLE MARKET HOUSEHOLD SURVEY
 Special Eurobarometer 414 E-COMMUNICATIONS AND TELECOM SINGLE MARKET HOUSEHOLD SURVEY REPORT Fieldwork: January 2014 Publication: March 2014 This survey has been requested by the European Commission, Directorate-General
CROSS-BORDER ACCESS TO ONLINE CONTENT
 Flash Eurobarometer 411 CROSS-BORDER ACCESS TO ONLINE CONTENT SUMMARY Fieldwork: January 2015 Publication: August 2015 This survey has been requested by the European Commission, Directorate-General for
Dublin, March 2013. EPSO Network of Experts in the field of Personnel Selection 14th March 2013
 Dublin, March 2013 EPSO Network of Experts in the field of Personnel Selection 14th March 2013 On-going and upcoming competitions AD2012 by Citizenship AD2012 Citizenship %EU Population validated application
COMPANIES ENGAGED IN ONLINE ACTIVITIES
 Flash Eurobarometer 413 COMPANIES ENGAGED IN ONLINE ACTIVITIES SUMMARY Fieldwork: January-February 2015 Publication: May 2015 This survey has been requested by the European Commission, Directorate-General
Special Eurobarometer 397 CORRUPTION REPORT
 Special Eurobarometer 397 CORRUPTION REPORT Fieldwork: February - March 213 Publication: February 214 This survey has been requested by the European Commission, Directorate-General for Home Affairs and
ATTITUDES OF EUROPEANS TOWARDS WASTE MANAGEMENT AND RESOURCE EFFICIENCY
 Flash Eurobarometer ATTITUDES OF EUROPEANS TOWARDS WASTE MANAGEMENT AND RESOURCE EFFICIENCY REPORT Fieldwork: December 0 Publication: June 0 This survey has been requested by the European Commission, Directorate-General
ATTITUDES OF EUROPEANS TOWARDS BUILDING THE SINGLE MARKET FOR GREEN PRODUCTS
 Eurobarometer ATTITUDES OF EUROPEANS TOWARDS BUILDING THE SINGLE MARKET FOR GREEN PRODUCTS REPORT Fieldwork: December 2012 Publication: July 2013 This survey has been requested by the European Commission,
Responsible Research and Innovation (RRI), Science and Technology
, Science and Technology") Special Eurobarometer 401 Responsible Research and Innovation (RRI), Science and Technology REPORT Fieldwork: April - May 2013 Publication: November 2013 This survey has been requested by the European
Special Eurobarometer 401 Responsible Research and Innovation (RRI), Science and Technology REPORT Fieldwork: April - May 2013 Publication: November 2013 This survey has been requested by the European
Special Eurobarometer 390 CYBER SECURITY REPORT
 Special Eurobarometer 390 CYBER SECURITY REPORT Fieldwork: March 2012 Publication: July 2012 This survey has been requested by the European Commission, Directorate-General Home Affairs and co-ordinated
PUBLIC ATTITUDES TOWARDS ROBOTS
 Special Eurobarometer 382 PUBLIC ATTITUDES TOWARDS ROBOTS REPORT Fieldwork: February - March 2012 Publication: September 2012 This survey has been requested by Directorate-General for Information Society
Special Eurobarometer 423 CYBER SECURITY REPORT
 Special Eurobarometer 423 CYBER SECURITY REPORT Fieldwork: October 2014 Publication: February 2015 This survey has been requested by the European Commission, Directorate-General for Home Affairs and co-ordinated
SMES, RESOURCE EFFICIENCY AND GREEN MARKETS
 Flash Eurobarometer 381 SMES, RESOURCE EFFICIENCY AND GREEN MARKETS SUMMARY Fieldwork: September 2013 Publication: December 2013 This survey has been requested by the European Commission, Directorate-General
BUSINESS-TO-BUSINESS ALTERNATIVE DISPUTE RESOLUTION IN THE EU
 Flash Eurobarometer BUSINESS-TO-BUSINESS ALTERNATIVE DISPUTE RESOLUTION IN THE EU REPORT Fieldwork: March-April 22 Publication: November 22 This survey has been requested by Directorate-General for Justice
PATIENTS RIGHTS IN CROSS-BORDER HEALTHCARE IN THE EUROPEAN UNION
 Special Eurobarometer 425 PATIENTS RIGHTS IN CROSS-BORDER HEALTHCARE IN THE EUROPEAN UNION REPORT Fieldwork: October 2014 Publication: May 2015 This survey has been requested by the European Commission,
Special Eurobarometer 423 CYBER SECURITY SUMMARY
 Special Eurobarometer 423 CYBER SECURITY SUMMARY Fieldwork: October 2014 Publication: February 2015 This survey has been requested by the European Commission, Directorate-General for Home Affairs and co-ordinated
Our patent and trade mark attorneys are here to help you protect and profit from your ideas, making sure they re working every bit as hard as you do.
 Our patent and trade mark attorneys are here to help you protect and profit from your ideas, making sure they re working every bit as hard as you do. Our people work with everyone from multi-nationals
Family Law. Fieldwork: June 2006 Report: October 2006
 The Gallup Organization Flash EB N o 188 Consular Protection and Family Law Flash Eurobarometer European Commission Family Law Summary Fieldwork: June 06 Report: October 06 Flash Eurobarometer 188 The
Family Law. Analytical Report
 Flash Eurobarometer European Commission Family Law Analytical Report Fieldwork: June 2006 Report: October 2006 Flash Eurobarometer 188 The Gallup Organization This survey was requested by Directorate-General
ATTITUDES OF EUROPEANS TOWARDS TOBACCO AND ELECTRONIC CIGARETTES
 Special Eurobarometer 429 ATTITUDES OF EUROPEANS TOWARDS TOBACCO AND ELECTRONIC CIGARETTES REPORT Fieldwork: November-December 2014 Publication: May 2015 This survey has been requested by the European
European Research Council
 ERC Starting Grant Outcome: Indicative statistics Reproduction is authorised provided the source ERC is acknowledged ERCEA/JH. ERC Starting Grant: call Submitted and selected proposals by domain Submitted
72/2015-21 April 2015
 72/2015-21 April 2015 Provision of deficit and debt data for 2014 - first notification Euro area and EU28 government deficit at 2.4% and 2.9% of GDP respectively Government debt at 91.9% and 86.8% In 2014,
European judicial training 2014. Justice
 European judicial training 2014 Justice Europe Direct is a service to help you find answers to your questions about the European Union. Freephone number (*): 00 800 6 7 8 9 10 11 (*) Certain mobile telephone
The coverage rate of social benefits. Research note 9/2013
 Research note 9/2013 SOCIAL SITUATION OBSERVATORY INCOME DISTRIBUTION AND LIVING CONDITIONS APPLICA (BE), EUROPEAN CENTRE FOR THE EUROPEAN CENTRE FOR SOCIAL WELFARE POLICY AND RESEARCH (AT), ISER UNIVERSITY
Attitudes towards vocational education and training
 Special Eurobarometer 369 European Commission Attitudes towards vocational education and training SUMMARY Special Eurobarometer 369 / Wave EB75.4 TNS opinion & social Fieldwork: June 2011 Publication:
Attitudes towards vocational education and training
 Special Eurobarometer 369 European Commission Attitudes towards vocational education and training REPORT Special Eurobarometer 369 / Wave TNS opinion & social Fieldwork: June Publication: September This
EUROPEAN SEMESTER THEMATIC FICHE ACCESS TO FINANCE
 EUROPEAN SEMESTER THEMATIC FICHE ACCESS TO FINANCE Access to finance is key to business development. Investment and innovation are not possible without adequate financing. A difficulty in getting finance
CONSUMERS ATTITUDES TOWARDS CROSS- BORDER TRADE AND CONSUMER PROTECTION
 Eurobarometer CONSUMERS ATTITUDES TOWARDS CROSS- BORDER TRADE AND CONSUMER PROTECTION REPORT Fieldwork: September 2011 Publication: May 2012 This survey has been requested by the European Commission, Directorate-General
BUILDING THE DIGITAL SINGLE MARKET CROSS BORDER DEMAND FOR CONTENT SERVICES
 Special Eurobarometer 366 BUILDING THE DIGITAL SINGLE MARKET CROSS BORDER DEMAND FOR CONTENT SERVICES REPORT Fieldwork: April - May 2011 This survey has been requested by the European Commission, Directorate-General
WOMEN IN DECISION-MAKING POSITIONS
 Special Eurobarometer 376 WOMEN IN DECISION-MAKING POSITIONS REPORT Fieldwork: September 2011 Publication: March 2012 This survey has been requested by Directorate-General Justice and co-ordinated by Directorate-
How To Understand The Differences Between The Different Types Of Phone Access In European Countries
 Special Eurobarometer 381 E-COMMUNICATIONS HOUSEHOLD SURVEY REPORT Fieldwork: December 2011 Publication: June 2012 This survey has been requested by the European Commission, Directorate-General for Information
Special Eurobarometer 398 INTERNAL MARKET REPORT
 Special Eurobarometer 398 INTERNAL MARKET REPORT Fieldwork: April - May 2013 Publication: October 2013 This survey has been requested by the European Commission, Directorate-General Internal Market and
EUROPE 2020 TARGET: EARLY LEAVERS FROM EDUCATION AND TRAINING
 EUROPE 2020 TARGET: EARLY LEAVERS FROM EDUCATION AND TRAINING By 2020, the share of early leavers from education and training (aged 18-24) should be less than 10% Early school leaving 1 is an obstacle
Health and long-term care in the European Union
 Special Eurobarometer European Commission Health and long-term care in the European Union Fieldwork: May June 2007 Publication: December 2007 Report Special Eurobarometer 283/ Wave 67.3 TNS Opinion & Social
Flash Eurobarometer 355 SPACE ACTIVITIES REPORT
 Flash Eurobarometer SPACE ACTIVITIES REPORT Fieldwork: July 2012 Publication: September 2012 This survey has been requested by the European Commission, Directorate-General Enterprise and Industry and co-ordinated
How To Study The Small Ruminant Population In The European Land Animals
 1 Joint Research Centre (JRC) Economic Analysis of Electronic Identification (EID) of Small Ruminants in Member States IPSC - Institute for the Protection and Security of the Citizen Ispra - Italy http://ipsc.jrc.ec.europa.eu/
CO2 BASED MOTOR VEHICLE TAXES IN THE EU IN 2015
 CO2 BASED MOTOR VEHICLE TAXES IN THE EU IN 2015 COUNTRY AT (AUSTRIA) BE (BELGIUM) BG (BULGARIA) CO2/FUEL CONSUMPTION TAXES A fuel consumption tax (Normverbrauchsabgabe or NoVA) is levied upon the first
OVERVIEW OF PURCHASE AND TAX INCENTIVES FOR ELECTRIC VEHICLES IN THE EU
 01.04.2014 OVERVIEW OF PURCHASE AND TAX INCENTIVES FOR ELECTRIC VEHICLES IN THE EU This table provides an overview of the incentives that are granted in the Member States of the European Union for the
Public Debt and Contingent Liabilities: A Cross-Country Comparison
 Public Debt and Contingent Liabilities: A Cross-Country Comparison Melchior Vella and Gevit Duca * 1. Contingent Liabilities 1.1 What are contingent liabilities? Contingent liabilities are obligations
The Future European Constitution
 Flash Eurobarometer European Commission The Future European Constitution Fieldwork : January 2004 Publication : February 2004 Flash Eurobarometer 159 - TNS Sofres / EOS Gallup Europe This survey was requested
I have asked for asylum in the EU which country will handle my claim?
 EN I have asked for asylum in the EU which country will handle my claim? A Information about the Dublin Regulation for applicants for international protection pursuant to article 4 of Regulation (EU) No
Digital Agenda Targets Progress report. Digital Agenda Scoreboard 2014
 Digital Agenda Targets Progress report Digital Agenda Scoreboard 2014 1 NGA coverage: Fast broadband technologies capable of providing at least 30 Mbps are available to 64%, up from 54% a year ago Among
Broadband Coverage in Europe Final Report 2009 Survey Data as of 31 December 2008. DG INFSO 80106 December 2009 IDATE 1
 Broadband Coverage in Europe Final Report 2009 Survey Data as of 31 December 2008 DG INFSO 80106 December 2009 IDATE 1 Table of contents 1. Methodological notes...5 2. Executive summary...7 3. European
Digital Inclusion and Skills. Digital Agenda Scoreboard 2014
 Digital Inclusion and Skills Digital Agenda Scoreboard 2014 1 72% of EU population uses the internet weekly and 57% of disadvantaged do so. Most of EU population (62%) uses the internet every day. The
Statistical Data on Women Entrepreneurs in Europe
 Statistical Data on Women Entrepreneurs in Europe September 2014 Enterprise and Industry EUROPEAN COMMISSION Directorate-General for Enterprise and Industry Directorate D SMEs and Entrepreneurship Unit
Domestic Violence against Women. Report. Fieldwork: February March 2010 Publication: September 2010. Special Eurobarometer 344
 Special Eurobarometer 344 European Commission Domestic Violence against Women Report Fieldwork: February March 2010 Publication: September 2010 Special Eurobarometer 344 / Wave TNS Opinion & Social This
the environment towards Special Eurobarometer 365 Special Eurobarometer 365 / Wave EB75.2 TNS opinion & social This document of the authors.
 Special Eurobarometer 365 European Commission Attitudes of European citizens towards the environment REPORT Special Eurobarometer 365 / Wave TNS opinion & social Fieldwork: April-May 2011 Publication:
Study on comparison tools and third-party verification schemes
 Justice and Consumers Study on comparison tools and third-party verification schemes ECCG 25/03/2015 Julien Brugerolle JUST E6 Introduction Study objectives Explore consumer behavioural patterns in the
Finnish foreign trade 2014 Figures and diagrams. 27.2.2015 FINNISH CUSTOMS Statistics 1
 Finnish foreign trade 214 Figures and diagrams 27.2.215 FINNISH CUSTOMS Statistics 1 IMPORTS, EXPORTS AND TRADE BALANCE 199-214 7 billion e 6 5 4 3 2 1-1 9 91 92 93 94 95 96 97 98 99 1 2 3 4 5 6 7 8 9
Patient safety and quality of healthcare
 Special Eurobarometer European Commission Patient safety and quality of healthcare Full report Fieldwork September-October 2009 Publication April 2010 Special Eurobarometer 327 / Wave - European Opinion
Tourism trends in Europe and in Mediterranean Partner Countries, 2000-2006
 Industry, trade and services Author: Ulrich SPÖREL, Volker TÄUBE Statistics in focus 95/28 Tourism trends in Europe and in Mediterranean Partner Countries, 2-26 Tourism is a growth industry in Europe and
Comparison of annuity markets (OECD National Annuity Markets: Features and Implications, Rusconi 2008) Mercer
 Mercer") May 2009 Retirement Income/Annuities Around the World What US Policy Makers Might Learn Barbara Marder, Baltimore Global Defined Contribution Consulting Leader www.mercer.com 1 Comparison of annuity markets
May 2009 Retirement Income/Annuities Around the World What US Policy Makers Might Learn Barbara Marder, Baltimore Global Defined Contribution Consulting Leader www.mercer.com 1 Comparison of annuity markets
Factsheet Swiss European Mobility Programme (SEMP/ex-Erasmus)
") Factsheet Swiss European Mobility Programme (SEMP/ex-Erasmus) Academic year 2016-2017 1. Institutional Information 1.1. Institutional details Name of the institution Code Institution website Online course
Factsheet Swiss European Mobility Programme (SEMP/ex-Erasmus) Academic year 2016-2017 1. Institutional Information 1.1. Institutional details Name of the institution Code Institution website Online course
E-Communications Household Survey. Report. Fieldwork: November - December 2009 Publication: October 2010. Special Eurobarometer 335
 Special Eurobarometer 335 European Commission E-Communications Household Survey Report Fieldwork: November - December 2009 Publication: October 2010 Special Eurobarometer 335 / Wave TNS Opinion & Social
Broadband markets Digital Agenda Scoreboard 1 2014
 Broadband markets Digital Agenda Scoreboard 2014 1 Broadband coverage: Basic broadband is available to everyone in the EU, while fixed technologies cover 97% leaving 6 million homes unconnected. Next Generation
Attitudes of Europeans towards Tobacco. Report. Special Eurobarometer. Fieldwork October - November 2006 Publication May 2007
 Special Eurobarometer European Commission Attitudes of Europeans towards Tobacco Fieldwork October - November 2006 Publication May 2007 Report Special Eurobarometer 272c / Wave 66.2 TNS Opinion & Social
Implementing the cooperation mechanisms of the RES directive current status and open questions
 Implementing the cooperation mechanisms of the RES directive current status and open questions Corinna Klessmann, Ecofys Germany RE-SHAPING Workshop, Vilnius, 16.05.2011 Supported by Intelligent Energy
Energy prices in the EU Household electricity prices in the EU rose by 2.9% in 2014 Gas prices up by 2.0% in the EU
 92/2015-27 May 2015 Energy prices in the EU Household electricity prices in the EU rose by 2.9% in 2014 Gas prices up by 2.0% in the EU In the European Union (EU), household electricity prices 1 rose by
AIDS Prevention. Fieldwork September to December 2005 Publication February 2006
 Special Eurobarometer European Commission AIDS Prevention Fieldwork September to December 2005 Publication February 2006 Special Eurobarometer 240 / Wave 64.1 and 64.3 TNS Opinion & Social This survey
Poverty and Social Exclusion in Central, Eastern and South-Eastern European Member States. Michael Knogler
 Department of Economics Policy Issues No. May 1 Institut für Ost- und Südosteuropaforschung Landshuter Straße, D-937 Regensburg Telefon: ++9 (9 1) 93 5-1 E-Mail: info@ios-regensburg.de Internet: www.ios-regensburg.de
SMALL AND MEDIUM-SIZED ENTERPRISES' ACCESS TO FINANCE
 EUROPEAN SEMESTER THEMATIC FICHE SMALL AND MEDIUM-SIZED ENTERPRISES' ACCESS TO FINANCE Thematic fiches are supporting background documents prepared by the services of the Commission in the context of the
Fieldwork September October 2006 Publication March 2007
 Special Eurobarometer European Commission Roaming Fieldwork September October 2006 Publication March 2007 Special Eurobarometer 269 / Wave 66.1 TNS Opinion & Social This survey was requested by Directorate
How To Understand The Habits Of Smokers In The European Union
 Special Eurobarometer 385 ATTITUDES OF EUROPEANS TOWARDS TOBACCO REPORT Fieldwork: February - March 2012 Publication: May 2012 This survey has been requested by the European Commission, Directorate-General
Special Eurobarometer 413 FUTURE OF EUROPE REPORT
 Special Eurobarometer 413 FUTURE OF EUROPE REPORT Fieldwork: January 2014 Publication: March 2014 This survey has been requested by the European Commission, Directorate-General for Communication and co-ordinated
ERGP (12) 33 ERGP report on data collection ERGP REPORT WITH DATA ON INDICATORS ON THE POSTAL MARKET
 33 ERGP report on data collection ERGP REPORT WITH DATA ON INDICATORS ON THE POSTAL MARKET") ERGP REPORT WITH DATA ON INDICATORS ON THE POSTAL MARKET April 2013 Contents List of Tables... 3 List of Figures... 3 Country codes... 5 Executive Summary... 6 Part 1 Background and objectives... 8 Part
ERGP REPORT WITH DATA ON INDICATORS ON THE POSTAL MARKET April 2013 Contents List of Tables... 3 List of Figures... 3 Country codes... 5 Executive Summary... 6 Part 1 Background and objectives... 8 Part
E-Communications Household Survey. Summary. Fieldwork: November - December 2009 Publication: October 2010. Special Eurobarometer 335
 Special Eurobarometer 335 European Commission E-Communications Household Survey Summary Fieldwork: November - December 2009 Publication: October 2010 Special Eurobarometer 335 / Wave 72.5 TNS Opinion &
Internal Market: Awareness, Perceptions and Impacts
 Special Eurobarometer 363 European Commission Internal Market: Awareness, Perceptions and Impacts REPORT Special Eurobarometer 363 / Wave TNS opinion & social Fieldwork: February-March 2011 Publication:
Social dumping and free movement: Overview of current issues from an economic point of view
 Social dumping and free movement: Overview of current issues from an economic point of view Prof. dr. Jozef Pacolet & Frederic De Wispelaere Design Charles & Ray Eames - Hang it all Vitra Statistics on