Performance Based Learning and Assessment Task
|
|
|
- Alexina Collins
- 7 years ago
- Views:
Transcription
1 Performance Based Learning and Assessment Task Staircases and Ramps I. ASSESSSMENT TASK OVERVIEW & PURPOSE: The students will use slope to describe the characteristics of ramps versus the stairs between the same two levels of elevation. After practical observation of stairs and ramps, the students will discuss the physical reasons for stairs to be steeper than ramps. Teachers will direct this discussion into talking about the slopes of the stairs and ramps. Students should measure these stairs and the corresponding ramp and transfer their information onto a graphical representation of each. Students will then analyze the slopes and equations of the lines represented by the stairs and the ramps and compare them. After an analysis, students should be able to write an explanation of the relationship of the slope of the lines to the heights and lengths of stairs and ramps and be able to answer teacher questions in an interview. II. III. IV. UNIT AUTHOR: Jennifer M. Sprouse, Cave Spring Middle School, Roanoke County Public Schools COURSE: Algebra I CONTENT STRAND: Algebra V. OBJECTIVES: The learner will be able to determine why ramps are longer than stairs. The learner will be able to calculate the slope of both the stairs and the ramp. The learner will be able to illustrate graphically how slope effects the length of ramps and stairs. VI. VII. VIII. IX. REFERENCE/RESOURCE MATERIALS: Stairs and corresponding ramps, Graph paper, Graphing Calculator, and Measuring tapes PRIMARY ASSESSMENT STRATEGIES: The task includes an assessment component that performs two functions: (1) for the student it will be a checklist and provide a self-assessment and (2) for the teacher it will be used as a rubric. Teachers will look at two aspects of the students work and comprehension. First the teacher will look at the graphs and written explanations from the students and follow the assessment list for this portion. Second the students will be called by group to participate in a small group interview by the teacher in which the teacher will have the students verbally describe to them what is happening between the stairs and ramps. The teacher will use the questions attached as guidelines and the assessment list for the interview. EVALUATION CRITERIA: Assessment lists for the paper and interview portions, and corresponding rubrics INSTRUCTIONAL TIME: minutes.

2 Activity/Task Title Strand Algebra Mathematical Objective(s) The students will make connections between graphical and real-world representations. The students will work with slope to understand the aspects of it. The students will investigate the nature of slope and how it affects linear equations. Related SOL SOL A.4: The student will solve multistep linear and quadratic equations in two variables, including o d) solving multistep linear equations algebraically and graphically; o f) solving real-world problems involving equations and systems of equations. Graphing calculators will be used both as a primary tool in solving problems and to verify algebraic solutions. SOL A.6: The student will graph linear equations and linear inequalities in two variables, including o a) determining the slope of a line when given an equation of the line, the graph of the line, or two points on the line. Slope will be described as rate of change and will be positive, negative, zero, or undefined; and o b) writing the equation of a line when given the graph of the line, two points on the line, or the slope and a point on the line. NCTM Standards Understand the meaning of equivalent forms of expressions, equations, inequalities, and relations; Write equivalent forms of equations, inequalities, and systems of equations and solve them with fluency mentally or with paper and pencil in simple cases and using technology in all cases; Use symbolic algebra to represent and explain mathematical relationships; Identify essential quantitative relationships in a situation and determine the class or classes of functions that might model the relationships; Draw reasonable conclusions about a situation being modeled. Approximate and interpret rates of change from graphical and numerical data. Materials/Resources Staircase with corresponding ramp Measuring tape Graph paper Graphing calculator GeoGebra or Excel (optional) Assumption of Prior Knowledge Students should have an understanding of the differences between stairs and ramps. The students should be familiar with the concept of slope. The students should be familiar with the rate of change. The students should know the slope intercept form of linear equations. The students should be able to graph points and linear relationships. 2

3 Introduction: Setting Up the Mathematical Task In this activity, your students will investigate the relationship between staircases and ramps and how the corresponding slopes affect the characteristics of each. As a class, you will want to look at a set of stairs and its corresponding ramp. Lead a discussion with the students about the differences between stairs and ramps. The less you tell them allows them to discover and answer the questions for themselves. Some things will remain to be speculation. One illustration you could make if possible would be to place a piece of plywood or a plank over the stair and have the students experiment with an empty wheelchair or a wheelchair with books in it to give weight. This is a good illustration to help the students understand that it is necessary for ramps to be less steep. Some questions you could ask to start discussion are as follows: Have you ever noticed that ramps take up a lot more space than a corresponding set of stairs? Why is that? We will discuss why ramps are longer than stairs in real-world situations and terminology. After the main discussion, divide the students into groups to make measurements on a set of stairs with a corresponding ramp. They will transfer these measurements into a graphical representation of both the stairs and the ramp. The length is represented by the horizontal change covered by the stairs or ramp. Likewise, the height is the vertical change covered by the stairs or ramp. If you have access to more than one set of stairs with ramp, it might be a good idea to have each group measure different ones. It is also a good idea to have each group measure multiple stairs and ramps for comparison between the groups. Some schools do not have access to this, so focus on the slope if you don t have a multiple set options. If you do have this option, you can always extend the activity to see if the students can figure out the construction regulations for ramps. The students are always excited if they can use their math skills to figure out real world things like that. The students will have the worksheets that are attached to help guide them. There is also an Extended Worksheet to guide the students to estimating the ADA regulations for ramps. The ADA regulations for ramps is a slope of no more than 1/20. Once they have completed the worksheet and graphs, have each student write two full paragraphs explaining what they discovered and their thoughts on it. You should take each group aside as they finish and perform an interview with them to see if they truly understand what they discovered. A set of suggested interview questions is attached. The purpose of this activity is to have the students come to a greater understanding of slope and how it affects linear relationships using real world examples. If understood properly as a ratio, students should be able to determine the length of any set of stairs or ramp given a height needed to connect. After the activity, teachers should help the students transition this information to the normal slope and linear equation problems they see in the textbook. Student Exploration Small Group Work The students will gather in their groups to measure important characteristics of both the ramp and stairs, preferably of a couple of sets of stairs and ramps. Using the data that they gather, they should make pictorial representations of each. The students should then analyze their graphs to make slope and linear equation 3

4 connections for the stairs and the ramps. They should discuss among themselves the similarities and differences they notice between different sets of stairs and ramps, and what role slope plays in their descriptions. The group should then write a two paragraph essay describing their observations and conclusions. Finally, the students should be prepared to discuss how the slope affects the characteristics of the ramp and to make predictions on the length of a ramp when given the height of a set of stairs. These topics will be discussed in an interview with the teacher. Whole Class Sharing/Discussion The whole class will begin this lesson with a discussion about real-world situations surrounding stairs and ramps. Why do ramps exist? Why are ramps longer than stairs? Why are they not as steep? If someone were to smooth out a staircase to make a ramp, what would be the repercussions for those using the ramp? As explained in the Introduction, a mention of standard construction regulations can be mentioned in the beginning or as an extra piece of information that the students may discover throughout the activity. After the interviews have been completed, have the whole class revisit the earlier discussion, but this time, have them discuss the same questions about stairs and ramps using the mathematical terminology to illustrate their connections. If you were able to have the students work with multiple sets of stairs and ramps, have the students share their results at this time and come to a consensus concerning the possible regulations for ramps. Either have them research the ADA regulations for ramps or pull it up on the board as a teacher. Students should discuss if their consensus was correct when compared with the ADA regulations. If not, have the students determine which ramps did not meet the guidelines set forth by the ADA. Student/Teacher Actions: Students should be gathering data and analyzing graphical representations of stairs and ramps for mathematical connections. Students should make pictorial and graphical representations of the stairs and ramps and then analyze them to find slope and linear equations. Students should discuss in groups the effects of slope on the length of the ramp, and write one or two paragraphs explaining their observations. Teachers should be moving between the groups to facilitate learning within the groups. They should be available to answer questions and use their own questioning to prompt students to higher levels of thinking. Teachers should also take groups that are finished with the analysis aside for group interviews to assess learning. Monitoring Student Responses Students will be writing an explanation of their findings and reasoning and submitting this to the teacher. Upon completion of the calculations and explanation, the groups will be taken out for an interview with the teacher to see if they can verbally explain and represent their findings. Suggested questions for the teacher interview portion are attached. Assessment List and Benchmarks During the discussion and measurements portion of the assignment, the students will compile at least two graphical representations of a staircase and a ramp (possibly more of each). These will be taken up by the teacher and graded for clarity and accuracy. The students will then complete the written explanation portion which will be graded according to the attached rubric. Likewise, the interview portion will be graded according to the attached rubric. There is no rubric for the Extended Worksheet, as many teachers may not be able to use it. This is intended as discussion and can be graded to the teacher s discretion. 4

5 Student Worksheet In this activity, you will investigate the relationship between staircases and ramps and how the corresponding slopes affect the characteristics of each. As a class, we will look at a set of stairs and its corresponding ramp. Have you ever noticed that ramps take up a lot more space than a corresponding set of stairs? Why is that? We will discuss why ramps are longer than stairs in real-world situations and terminology. As a group, you will measure several important aspects of both the stairs and the ramp. The height is measured by the distance between the two levels traversed by the stairs and ramp. The length is the horizontal distance between the starting point and ending point of each, not the slant length. You will take these measurements to your graph paper to make pictorial representations of the stairs and ramps. Using slope and linear equations, list as many aspects of the stairs and ramps as you can and see how they relate to each other. You will then write two paragraphs about your findings, and use your information and new understanding to find ramp lengths that correspond to stair heights. As a final assessment, your teacher will interview each group to assess full understanding of the relationships between stairs and ramps with regard to slope. Use each of the following questions to guide you in your investigation: What is the height of stairs? How did you determine this? What is the length of stairs? How did you determine this? What is the height of ramp? How did you determine this? What is the length of ramp? How did you determine this? What is the slope of each? What is the equation of each line? 5

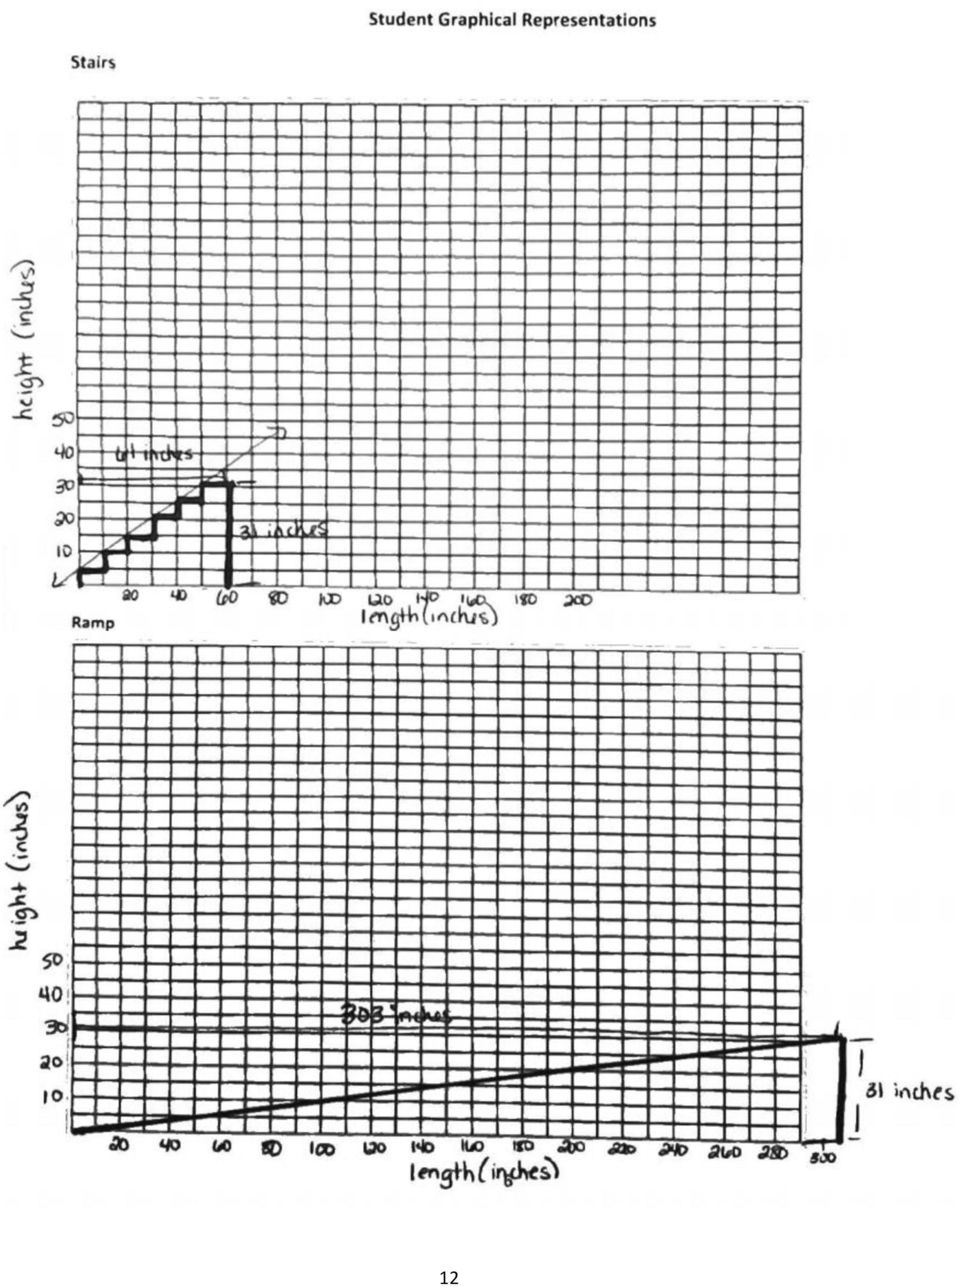
6 Student Graphical Representations Stairs Ramp 6

7 Stairs and Ramps Written Portion Rubric The following rubric and category descriptions will be used to assess your paragraph explanations. Please review the rubric carefully. Number Element Point Value 1 The calculations are complete. 5 2 The writing is the appropriate length. 3 3 The explanation is well organized and neat. 3 4 The explanation is coherent and well written. 4 5 Details are given to back up the students explanations. 6 6 The explanation was well thought out. 5 7 Connections were made to help with understanding slope in a 4 deeper context. Total 30 Self- Graded Teacher Grade Written portion Element 1 The calculations are complete. calculations were completed. 2 The writing is the appropriate length. (Two paragraphs of at least three sentences each.) 3 The explanation is well organized and neat. 4 The explanation is coherent and well written. 5 Students use specific examples of their work to back up their explanations. 6 The explanation was well thought out. 7 Connections were made to help with understanding slope in a deeper context. (as a ratio, between slope and linear relationships, etc.) writing was done. explanation given. explanation given. examples were given. explanation was given. connections were made. 1 Less than half of the calculations were completed. 1 Less than half of the required length. 1 Explanation given but barely legible. 2 Explanation hard to follow. 2 Only one example given. 1 Explanation is too simple. 1 Connections didn t apply to the lesson. 3 At least half of the calculations were completed. 2 At least half of what was required. 2 Explanation is legible but unorganized. 3 Explanation is good but a little confusing. 4 A few examples were given. 3 Explanation is good but more thought could be there. 2 A connection was made weakly. 5 All of the calculations were completed. 3 The writing was the appropriate length. 3 Explanation is neat and organized. 4 Explanation is clear and good. 6 Examples were given for each part of the explanation. 5 Explanation was very well thought out. 4 Connections were strong. 7

8 Stairs and Ramps Interview Portion Rubric The following rubric and category descriptions will be used to assess your paragraph explanations. Please review the rubric carefully. Number Element Point Value 1 Students were polite during the interview. 3 2 All group members participated in the interview. 3 3 All of the questions were answered. 3 4 The answers given were well thought out. 6 5 Students made connections between slope and the 6 characteristics of stairs and ramps. 6 Understanding of the lesson was achieved. 3 7 The students felt confident in their answers and conclusions by 6 the end of the interview. Total 30 Self- Graded Teacher Grade Written portion Element 1 Students were polite during the interview. 2 All group members participated in the interview. 3 All of the questions were answered. 4 The answers given were well thought out. 5 Students made connections between slope and the characteristics of stairs and ramps. 6 Understanding of the lesson was achieved. 7 The students felt confident in their answers and conclusions by the end of the interview. 0 Students were rude and uncooperative. one participated. questions answered. thought was given. connections were made. understanding was achieved. confidence was displayed. 1 Only one student would cooperate. 1 Only one student would speak. 1 Only a couple of questions were answered. 2 Some answers were thought about. 2 Connections didn t apply to the lesson. 1 Some understanding was achieved. 2 Some confidence was displayed. 2 Over half of the students would not cooperate. 2 Over half of the students would speak. 2 Over half of the questions were answered. 4 Most of the answers were thought about. 4 A connection was made with slopes of stairs and ramps, but nothing further. 2 Most of the understanding was achieved. 4 Students were mostly confident. 3 All of the group were polite and cooperative. 3 All of the group participated. 3 All of the questions were answered. 6 All answers were well thought out. 6 Connections were made with slopes of stairs and ramps, and slope in more general situations. 3 Understanding of the lesson was achieved. 6 Students were very confident. 8

9 Suggested Teacher Interview Questions 1) How did you transfer your data into a pictorial or graphical representation? 2) How did you calculate the slope and linear equation for each graph? 3) What did you notice about the slope and the height versus length of the stairs and ramps? 4) What will happen to the ramp if the height of the stairs changes? For example, what if the new height is 6 ft? 5) Using the same scenario as #4, does the length of the stairs change? 6) Why is the slope less for a ramp versus a set of stairs? 7) What can you tell me about slope based on your observations during this activity? 8) What other observations did you make during this activity? 9
 Using the same scenario as #4, does the length of the stairs change? 6) Why is the slope less for a ramp versus a set of stairs?")
10 Extension Worksheet The Americans with Disabilities Act (ADA) has set forth guidelines and regulations regarding the slopes of ramps. Share the slopes that you calculated for your ramp(s) with the class and gather all of their slopes. Discuss in your groups and as a class the calculated slopes and answer the following questions. 1) What were the calculated slopes for the class? List them here. 2) Do you notice any patterns or similarities between the slopes of the different ramps? 3) Are there any consistencies? Inconsistencies? 4) Based on your observations, what do you think the ADA regulations are? 5) After researching, what are the ADA ramp regulations? 6) Were your guesses correct? Why or why not? 7) Did all of your ramps meet the ADA regulations? 10
 Do you notice any patterns or similarities between the slopes of the different ramps? 3) Are there any consistencies? Inconsistencies?")
11 Sample Work: (Actual numbers may vary.) In this activity, you will investigate the relationship between staircases and ramps and how the corresponding slopes affect the characteristics of each. As a class, we will look at a set of stairs and its corresponding ramp. Have you ever noticed that ramps take up a lot more space than a corresponding set of stairs? Why is that? We will discuss why ramps are longer than stairs in real-world situations and terminology. As a group, you will measure several important aspects of both the stairs and the ramp. The height is measured by the distance between the two levels traversed by the stairs and ramp. The length is the horizontal distance between the starting point and ending point of each, not the slant length. You will take these measurements to your graph paper to make pictorial representations of the stairs and ramps. Using slope and linear equations, list as many aspects of the stairs and ramps as you can and see how they relate to each other. You will then write two paragraphs about your findings, and use your information and new understanding to find ramp lengths that correspond to stair heights. As a final assessment, your teacher will interview each group to assess full understanding of the relationships between stairs and ramps with regard to slope. Use each of the following questions to guide you in your investigation: What is the height of stairs? How did you determine this? What is the length of stairs? How did you determine this? What is the height of ramp? How did you determine this? What is the length of ramp? How did you determine this? What is the slope of each? What is the equation of each line? 11

12 12
13 Suggested Teacher Interview Questions (Desired thought processes are included. Students will be answering in the first person format. Use these guidelines to keep them on the right track.) 1) How did you transfer your data into a pictorial or graphical representation? Students should answer this question by discussing how they measured the length and width of the stairs and the ramp. They should have made the connection that the length translated to the x-axis and the height translated to the y-axis. 2) How did you calculate the slope and linear equation for each graph? Hopefully, they made the connection that the slant of the ramp and the tops of the stairs made a line that they were then able to calculate the slope and linear equation from. Another connection that could be made would be that the y-intercept for the ramp would be 0 because it starts at the ground. An interesting discussion could be had about the y-intercept for the stairs. Some would argue that the stairs start at the ground as well, while others will say that since the line was made by connecting the top of the stairs, the y-intercept should be the top of the first step. 3) What did you notice about the slope and the height versus length of the stairs and ramps? Here the students should make the connection that since the slope of the stairs is greater than that of the ramp, for any given height the stairs will have a shorter length than the ramp. Further, observations may also be made as to the relationships between the lengths and heights. 4) What will happen to the ramp if the height of the stairs changes? For example, what if the new height is 6 ft? What we are looking for here is a connection that the height of the stairs and corresponding ramp are the same since they are traversing the same two levels. If the height changes, the length of the ramp will change much more than the stairs. The length will be proportional to the height using slope as the ratio. The students will have to use their calculated slope for the ramp to answer the specific example of a height of 6 ft. 5) Using the same scenario as #4, does the length of the stairs change? The students should realize here that length will change but not as much as the length of the ramp due to the stairs having a much greater slope. The students will have to use their calculated slope for the stairs to answer the specific example of a height of 6 ft. 6) Why is the slope less for a ramp versus a set of stairs? This should be a reiteration of the discussion before the activity. Possible explanations would be that handicapped people wouldn t be able to roll themselves up a ramp that was a steep as the stairs. They need a more gradual incline for safety and practicality. Also, descending a ramp of the same slope as the stairs would be very dangerous and difficult to stop at the end. If the teacher wants a more specific reason, they could have the students add a small research session to answer this question. 7) What can you tell me about slope based on your observations during this activity? The connection that is the hope of this entire activity is that slope is a ratio that stays the same no matter where you are on the line. In other words, finding the slope of stairs and a ramp of a set height, the students would then be able to determine the lengths needed for any height needed for the stairs and ramps. Students should be able to take this information back to the textbook problems to further their knowledge of slope and linear equations. 8) What other observations did you make during this activity? This is kind of open to teacher discretion on the validity of answers for this problem. This is mainly just a way to let the students mention if they discovered anything outside of slope in the activity. Not only does this question potentially open new avenues of discussion for the activity, the students may make an observation that the teacher never thought of. Feel free to add any other questions as these are just suggestions. The answers supplied are also just supplying the line of thinking hoped for in the design of this activity. 13

Performance Based Learning and Assessment Task
 Performance Based Learning and Assessment Task Activity/Task Title I. ASSESSSMENT TASK OVERVIEW & PURPOSE: Students will be asked to find various characteristics of a polynomial function, modeled by a
Performance Based Learning and Assessment Task Polynomial Farm I. ASSESSSMENT TASK OVERVIEW & PURPOSE:
 Performance Based Learning and Assessment Task Polynomial Farm I. ASSESSSMENT TASK OVERVIEW & PURPOSE: This performance task is planned to give students an opportunity to add, subtract, multiply, and divide
Linear Equations. 5- Day Lesson Plan Unit: Linear Equations Grade Level: Grade 9 Time Span: 50 minute class periods By: Richard Weber
 Linear Equations 5- Day Lesson Plan Unit: Linear Equations Grade Level: Grade 9 Time Span: 50 minute class periods By: Richard Weber Tools: Geometer s Sketchpad Software Overhead projector with TI- 83
ASSESSSMENT TASK OVERVIEW & PURPOSE:
 Developing a Trigonometry Phone App I. ASSESSSMENT TASK OVERVIEW & PURPOSE: In this activity, students will be asked to develop a program for a smartphone application that could be used to calculate the
Exponential Growth and Modeling
 Exponential Growth and Modeling Is it Really a Small World After All? I. ASSESSSMENT TASK OVERVIEW & PURPOSE: Students will apply their knowledge of functions and regressions to compare the U.S. population
I. ASSESSSMENT TASK OVERVIEW & PURPOSE:
 Performance Based Learning and Assessment Task Surface Area of Boxes I. ASSESSSMENT TASK OVERVIEW & PURPOSE: In the Surface Area of Boxes activity, students will first discuss what surface area is and
Lines, Lines, Lines!!! Slope-Intercept Form ~ Lesson Plan
 Lines, Lines, Lines!!! Slope-Intercept Form ~ Lesson Plan I. Topic: Slope-Intercept Form II. III. Goals and Objectives: A. The student will write an equation of a line given information about its graph.
Plot the following two points on a graph and draw the line that passes through those two points. Find the rise, run and slope of that line.
 Objective # 6 Finding the slope of a line Material: page 117 to 121 Homework: worksheet NOTE: When we say line... we mean straight line! Slope of a line: It is a number that represents the slant of a line
Lesson 4: Solving and Graphing Linear Equations
 Lesson 4: Solving and Graphing Linear Equations Selected Content Standards Benchmarks Addressed: A-2-M Modeling and developing methods for solving equations and inequalities (e.g., using charts, graphs,
Natural Disaster Recovery and Quadrilaterals
 Natural Disaster Recovery and Quadrilaterals I. UNIT OVERVIEW & PURPOSE: In this unit, students will apply their knowledge of quadrilaterals to solve mathematics problems concerning a tornado that struck
What does the number m in y = mx + b measure? To find out, suppose (x 1, y 1 ) and (x 2, y 2 ) are two points on the graph of y = mx + b.
 and (x 2, y 2 ) are two points on the graph of y = mx + b.") PRIMARY CONTENT MODULE Algebra - Linear Equations & Inequalities T-37/H-37 What does the number m in y = mx + b measure? To find out, suppose (x 1, y 1 ) and (x 2, y 2 ) are two points on the graph of
PRIMARY CONTENT MODULE Algebra - Linear Equations & Inequalities T-37/H-37 What does the number m in y = mx + b measure? To find out, suppose (x 1, y 1 ) and (x 2, y 2 ) are two points on the graph of
Mathematics Online Instructional Materials Correlation to the 2009 Algebra I Standards of Learning and Curriculum Framework
 Provider York County School Division Course Syllabus URL http://yorkcountyschools.org/virtuallearning/coursecatalog.aspx Course Title Algebra I AB Last Updated 2010 - A.1 The student will represent verbal
Performance Based Learning and Assessment Task Exploring Coal Pillar Mining I. ASSESSSMENT TASK OVERVIEW & PURPOSE: The purpose of this activity is
 Performance Based Learning and Assessment Task Exploring Coal Pillar Mining I. ASSESSSMENT TASK OVERVIEW & PURPOSE: The purpose of this activity is to assess the students ability to calculate volume and
Performance Based Learning and Assessment Task Pizza Sector Task I. ASSESSSMENT TASK OVERVIEW & PURPOSE: Students will be introduced to the concept
 Performance Based Learning and Assessment Task Pizza Sector Task I. ASSESSSMENT TASK OVERVIEW & PURPOSE: Students will be introduced to the concept of a sector of a circle and will learn the formula used
Graphing Linear Equations
 Graphing Linear Equations I. Graphing Linear Equations a. The graphs of first degree (linear) equations will always be straight lines. b. Graphs of lines can have Positive Slope Negative Slope Zero slope
https://williamshartunionca.springboardonline.org/ebook/book/27e8f1b87a1c4555a1212b...
 of 19 9/2/2014 12:09 PM Answers Teacher Copy Plan Pacing: 1 class period Chunking the Lesson Example A #1 Example B Example C #2 Check Your Understanding Lesson Practice Teach Bell-Ringer Activity Students
Basic Understandings
 Activity: TEKS: Exploring Transformations Basic understandings. (5) Tools for geometric thinking. Techniques for working with spatial figures and their properties are essential to understanding underlying
N Q.3 Choose a level of accuracy appropriate to limitations on measurement when reporting quantities.
 Performance Assessment Task Swimming Pool Grade 9 The task challenges a student to demonstrate understanding of the concept of quantities. A student must understand the attributes of trapezoids, how to
High School Algebra Reasoning with Equations and Inequalities Solve systems of equations.
 Performance Assessment Task Graphs (2006) Grade 9 This task challenges a student to use knowledge of graphs and their significant features to identify the linear equations for various lines. A student
Mathematics Grade-Level Instructional Materials Evaluation Tool
 Mathematics Grade-Level Instructional Materials Evaluation Tool Quality Review GRADE 8 Textbooks and their digital counterparts are vital classroom tools but also a major expense, and it is worth taking
Algebra I Credit Recovery
 Algebra I Credit Recovery COURSE DESCRIPTION: The purpose of this course is to allow the student to gain mastery in working with and evaluating mathematical expressions, equations, graphs, and other topics,
Performance Based Learning and Assessment Task Triangles in Parallelograms I. ASSESSSMENT TASK OVERVIEW & PURPOSE: In this task, students will
 Performance Based Learning and Assessment Task Triangles in Parallelograms I. ASSESSSMENT TASK OVERVIEW & PURPOSE: In this task, students will discover and prove the relationship between the triangles
Activity 6 Graphing Linear Equations
 Activity 6 Graphing Linear Equations TEACHER NOTES Topic Area: Algebra NCTM Standard: Represent and analyze mathematical situations and structures using algebraic symbols Objective: The student will be
Acquisition Lesson Planning Form Key Standards addressed in this Lesson: MM2A2c Time allotted for this Lesson: 5 Hours
 Acquisition Lesson Planning Form Key Standards addressed in this Lesson: MM2A2c Time allotted for this Lesson: 5 Hours Essential Question: LESSON 2 Absolute Value Equations and Inequalities How do you
EQUATIONS and INEQUALITIES
 EQUATIONS and INEQUALITIES Linear Equations and Slope 1. Slope a. Calculate the slope of a line given two points b. Calculate the slope of a line parallel to a given line. c. Calculate the slope of a line
Unit 7 Quadratic Relations of the Form y = ax 2 + bx + c
 Unit 7 Quadratic Relations of the Form y = ax 2 + bx + c Lesson Outline BIG PICTURE Students will: manipulate algebraic expressions, as needed to understand quadratic relations; identify characteristics
Students will be able to simplify and evaluate numerical and variable expressions using appropriate properties and order of operations.
 Outcome 1: (Introduction to Algebra) Skills/Content 1. Simplify numerical expressions: a). Use order of operations b). Use exponents Students will be able to simplify and evaluate numerical and variable
PLOTTING DATA AND INTERPRETING GRAPHS
 PLOTTING DATA AND INTERPRETING GRAPHS Fundamentals of Graphing One of the most important sets of skills in science and mathematics is the ability to construct graphs and to interpret the information they
High School Functions Interpreting Functions Understand the concept of a function and use function notation.
 Performance Assessment Task Printing Tickets Grade 9 The task challenges a student to demonstrate understanding of the concepts representing and analyzing mathematical situations and structures using algebra.
Section 1.1 Linear Equations: Slope and Equations of Lines
 Section. Linear Equations: Slope and Equations of Lines Slope The measure of the steepness of a line is called the slope of the line. It is the amount of change in y, the rise, divided by the amount of
Acquisition Lesson Plan for the Concept, Topic or Skill---Not for the Day
 Acquisition Lesson Plan Concept: Linear Systems Author Name(s): High-School Delaware Math Cadre Committee Grade: Ninth Grade Time Frame: Two 45 minute periods Pre-requisite(s): Write algebraic expressions
Graphs of Proportional Relationships
 Graphs of Proportional Relationships Student Probe Susan runs three laps at the track in 12 minutes. A graph of this proportional relationship is shown below. Explain the meaning of points A (0,0), B (1,),
Accommodated Lesson Plan on Solving Systems of Equations by Elimination for Diego
 Accommodated Lesson Plan on Solving Systems of Equations by Elimination for Diego Courtney O Donovan Class: Algebra 1 Day #: 6-7 Grade: 8th Number of Students: 25 Date: May 12-13, 2011 Goal: Students will
Performance Assessment Task Bikes and Trikes Grade 4. Common Core State Standards Math - Content Standards
 Performance Assessment Task Bikes and Trikes Grade 4 The task challenges a student to demonstrate understanding of concepts involved in multiplication. A student must make sense of equal sized groups of
Solving Systems of Linear Equations Graphing
 Solving Systems of Linear Equations Graphing Outcome (learning objective) Students will accurately solve a system of equations by graphing. Student/Class Goal Students thinking about continuing their academic
x x y y Then, my slope is =. Notice, if we use the slope formula, we ll get the same thing: m =
 Slope and Lines The slope of a line is a ratio that measures the incline of the line. As a result, the smaller the incline, the closer the slope is to zero and the steeper the incline, the farther the
Standards for Mathematical Practice: Commentary and Elaborations for 6 8
 Standards for Mathematical Practice: Commentary and Elaborations for 6 8 c Illustrative Mathematics 6 May 2014 Suggested citation: Illustrative Mathematics. (2014, May 6). Standards for Mathematical Practice:
Time needed. Before the lesson Assessment task:
 Formative Assessment Lesson Materials Alpha Version Beads Under the Cloud Mathematical goals This lesson unit is intended to help you assess how well students are able to identify patterns (both linear
A Correlation of Pearson Texas Geometry Digital, 2015
 A Correlation of Pearson Texas Geometry Digital, 2015 To the Texas Essential Knowledge and Skills (TEKS) for Geometry, High School, and the Texas English Language Proficiency Standards (ELPS) Correlations
UNIT PLAN: EXPONENTIAL AND LOGARITHMIC FUNCTIONS
 UNIT PLAN: EXPONENTIAL AND LOGARITHMIC FUNCTIONS Summary: This unit plan covers the basics of exponential and logarithmic functions in about 6 days of class. It is intended for an Algebra II class. The
Solving Equations Involving Parallel and Perpendicular Lines Examples
 Solving Equations Involving Parallel and Perpendicular Lines Examples. The graphs of y = x, y = x, and y = x + are lines that have the same slope. They are parallel lines. Definition of Parallel Lines
Glencoe. correlated to SOUTH CAROLINA MATH CURRICULUM STANDARDS GRADE 6 3-3, 5-8 8-4, 8-7 1-6, 4-9
 Glencoe correlated to SOUTH CAROLINA MATH CURRICULUM STANDARDS GRADE 6 STANDARDS 6-8 Number and Operations (NO) Standard I. Understand numbers, ways of representing numbers, relationships among numbers,
1.3 LINEAR EQUATIONS IN TWO VARIABLES. Copyright Cengage Learning. All rights reserved.
 1.3 LINEAR EQUATIONS IN TWO VARIABLES Copyright Cengage Learning. All rights reserved. What You Should Learn Use slope to graph linear equations in two variables. Find the slope of a line given two points
Big Ideas in Mathematics
 Big Ideas in Mathematics which are important to all mathematics learning. (Adapted from the NCTM Curriculum Focal Points, 2006) The Mathematics Big Ideas are organized using the PA Mathematics Standards
GRADE 8 MATH: TALK AND TEXT PLANS
 GRADE 8 MATH: TALK AND TEXT PLANS UNIT OVERVIEW This packet contains a curriculum-embedded Common Core standards aligned task and instructional supports. The task is embedded in a three week unit on systems
A Concrete Introduction. to the Abstract Concepts. of Integers and Algebra using Algebra Tiles
 A Concrete Introduction to the Abstract Concepts of Integers and Algebra using Algebra Tiles Table of Contents Introduction... 1 page Integers 1: Introduction to Integers... 3 2: Working with Algebra Tiles...
PoW-TER Problem Packet A Phone-y Deal? (Author: Peggy McCloskey)
") PoW-TER Problem Packet A Phone-y Deal? (Author: Peggy McCloskey) 1. The Problem: A Phone-y Deal? [Problem #3280] With cell phones being so common these days, the phone companies are all competing to earn
PoW-TER Problem Packet A Phone-y Deal? (Author: Peggy McCloskey) 1. The Problem: A Phone-y Deal? [Problem #3280] With cell phones being so common these days, the phone companies are all competing to earn
Mathematics Curriculum Guide Precalculus 2015-16. Page 1 of 12
 Mathematics Curriculum Guide Precalculus 2015-16 Page 1 of 12 Paramount Unified School District High School Math Curriculum Guides 2015 16 In 2015 16, PUSD will continue to implement the Standards by providing
MATH 60 NOTEBOOK CERTIFICATIONS
 MATH 60 NOTEBOOK CERTIFICATIONS Chapter #1: Integers and Real Numbers 1.1a 1.1b 1.2 1.3 1.4 1.8 Chapter #2: Algebraic Expressions, Linear Equations, and Applications 2.1a 2.1b 2.1c 2.2 2.3a 2.3b 2.4 2.5
High School Algebra Reasoning with Equations and Inequalities Solve equations and inequalities in one variable.
 Performance Assessment Task Quadratic (2009) Grade 9 The task challenges a student to demonstrate an understanding of quadratic functions in various forms. A student must make sense of the meaning of relations
TEMPERATURE BAR GRAPH
 TEMPERATURE BAR GRAPH Outcome (lesson objective) Students will figure mean, median and mode using weather, temperature data, create a bar graph charting one city s high and low temperatures, and formulate
MSLC Workshop Series Math 1148 1150 Workshop: Polynomial & Rational Functions
 MSLC Workshop Series Math 1148 1150 Workshop: Polynomial & Rational Functions The goal of this workshop is to familiarize you with similarities and differences in both the graphing and expression of polynomial
Creating, Solving, and Graphing Systems of Linear Equations and Linear Inequalities
 Algebra 1, Quarter 2, Unit 2.1 Creating, Solving, and Graphing Systems of Linear Equations and Linear Inequalities Overview Number of instructional days: 15 (1 day = 45 60 minutes) Content to be learned
Adding and Subtracting Integers Unit. Grade 7 Math. 5 Days. Tools: Algebra Tiles. Four-Pan Algebra Balance. Playing Cards
 Adding and Subtracting Integers Unit Grade 7 Math 5 Days Tools: Algebra Tiles Four-Pan Algebra Balance Playing Cards By Dawn Meginley 1 Objectives and Standards Objectives: Students will be able to add
Decomposing Numbers (Operations and Algebraic Thinking)
") Decomposing Numbers (Operations and Algebraic Thinking) Kindergarten Formative Assessment Lesson Designed and revised by Kentucky Department of Education Mathematics Specialists Field-tested by Kentucky
Decomposing Numbers (Operations and Algebraic Thinking) Kindergarten Formative Assessment Lesson Designed and revised by Kentucky Department of Education Mathematics Specialists Field-tested by Kentucky
How Many Drivers? Investigating the Slope-Intercept Form of a Line
 . Activity 1 How Many Drivers? Investigating the Slope-Intercept Form of a Line Any line can be expressed in the form y = mx + b. This form is named the slopeintercept form. In this activity, you will
Solving Systems of Linear Equations Substitutions
 Solving Systems of Linear Equations Substitutions Outcome (lesson objective) Students will accurately solve a system of equations algebraically using substitution. Student/Class Goal Students thinking
Revenge of the Angry Birds. Accommodation Assignment. Chosen Student: Elaine
 Revenge of the Angry Birds Accommodation Assignment Chosen Student: Elaine Tracy Harrison 12/5/2013 Title: Revenge of the Angry Birds Date: 12/5/2013 Grade Level: 9-10 Course: Algebra I Time Allotted:
Using the Area Model to Teach Multiplying, Factoring and Division of Polynomials
 visit us at www.cpm.org Using the Area Model to Teach Multiplying, Factoring and Division of Polynomials For more information about the materials presented, contact Chris Mikles mikles@cpm.org From CCA
Task: Representing the National Debt 7 th grade
 Tennessee Department of Education Task: Representing the National Debt 7 th grade Rachel s economics class has been studying the national debt. The day her class discussed it, the national debt was $16,743,576,637,802.93.
Grade Level Year Total Points Core Points % At Standard 9 2003 10 5 7 %
 Performance Assessment Task Number Towers Grade 9 The task challenges a student to demonstrate understanding of the concepts of algebraic properties and representations. A student must make sense of the
Coordinate Plane, Slope, and Lines Long-Term Memory Review Review 1
 Review. What does slope of a line mean?. How do you find the slope of a line? 4. Plot and label the points A (3, ) and B (, ). a. From point B to point A, by how much does the y-value change? b. From point
Using Algebra Tiles from Polynomials to Factoring
 Using Algebra Tiles from Polynomials to Factoring For more information about the materials you find in this packet, contact: Chris Mikles (888) 808-4276 mikles@cpm.org CPM Educational Program 203, all
Administrative - Master Syllabus COVER SHEET
 Administrative - Master Syllabus COVER SHEET Purpose: It is the intention of this to provide a general description of the course, outline the required elements of the course and to lay the foundation for
What Does the Normal Distribution Sound Like?
 What Does the Normal Distribution Sound Like? Ananda Jayawardhana Pittsburg State University ananda@pittstate.edu Published: June 2013 Overview of Lesson In this activity, students conduct an investigation
Chapter 10. Key Ideas Correlation, Correlation Coefficient (r),
,") Chapter 0 Key Ideas Correlation, Correlation Coefficient (r), Section 0-: Overview We have already explored the basics of describing single variable data sets. However, when two quantitative variables
Chapter 0 Key Ideas Correlation, Correlation Coefficient (r), Section 0-: Overview We have already explored the basics of describing single variable data sets. However, when two quantitative variables
CORE Assessment Module Module Overview
 CORE Assessment Module Module Overview Content Area Mathematics Title Speedy Texting Grade Level Grade 7 Problem Type Performance Task Learning Goal Students will solve real-life and mathematical problems
Because the slope is, a slope of 5 would mean that for every 1cm increase in diameter, the circumference would increase by 5cm.
 Measurement Lab You will be graphing circumference (cm) vs. diameter (cm) for several different circular objects, and finding the slope of the line of best fit using the CapStone program. Write out or
Local Government and Leaders Grade Three
 Ohio Standards Connection: Government Benchmark A Identify the responsibilities of the branches of the U.S. government and explain why they are necessary. Indicator 2 Explain the structure of local governments
Polynomial and Rational Functions
 Polynomial and Rational Functions Quadratic Functions Overview of Objectives, students should be able to: 1. Recognize the characteristics of parabolas. 2. Find the intercepts a. x intercepts by solving
In A Heartbeat (Algebra)
") The Middle School Math Project In A Heartbeat (Algebra) Objective Students will apply their knowledge of scatter plots to discover the correlation between heartbeats per minute before and after aerobic
The Middle School Math Project In A Heartbeat (Algebra) Objective Students will apply their knowledge of scatter plots to discover the correlation between heartbeats per minute before and after aerobic
Pushes and Pulls. TCAPS Created June 2010 by J. McCain
 Pushes and Pulls K i n d e r g a r t e n S c i e n c e TCAPS Created June 2010 by J. McCain Table of Contents Science GLCEs incorporated in this Unit............... 2-3 Materials List.......................................
DELAWARE MATHEMATICS CONTENT STANDARDS GRADES 9-10. PAGE(S) WHERE TAUGHT (If submission is not a book, cite appropriate location(s))
 WHERE TAUGHT (If submission is not a book, cite appropriate location(s))") Prentice Hall University of Chicago School Mathematics Project: Advanced Algebra 2002 Delaware Mathematics Content Standards (Grades 9-10) STANDARD #1 Students will develop their ability to SOLVE PROBLEMS
Prentice Hall University of Chicago School Mathematics Project: Advanced Algebra 2002 Delaware Mathematics Content Standards (Grades 9-10) STANDARD #1 Students will develop their ability to SOLVE PROBLEMS
Designer: Nathan Kimball. Stage 1 Desired Results
 Interpolation Subject: Science, math Grade: 6-8 Time: 4 minutes Topic: Reading Graphs Designer: Nathan Kimball Stage 1 Desired Results Lesson Overview: In this activity students work with the direct linear
Tom wants to find two real numbers, a and b, that have a sum of 10 and have a product of 10. He makes this table.
 Sum and Product This problem gives you the chance to: use arithmetic and algebra to represent and analyze a mathematical situation solve a quadratic equation by trial and improvement Tom wants to find
CHICAGO PUBLIC SCHOOLS (ILLINOIS) MATH & SCIENCE INITIATIVE COURSE FRAMEWORK FOR ALGEBRA Course Framework: Algebra
 MATH & SCIENCE INITIATIVE COURSE FRAMEWORK FOR ALGEBRA Course Framework: Algebra") Chicago Public Schools (Illinois) Math & Science Initiative Course Framework for Algebra Course Framework: Algebra Central Concepts and Habits of Mind The following concepts represent the big ideas or
Chicago Public Schools (Illinois) Math & Science Initiative Course Framework for Algebra Course Framework: Algebra Central Concepts and Habits of Mind The following concepts represent the big ideas or
WRITING A CRITICAL ARTICLE REVIEW
 WRITING A CRITICAL ARTICLE REVIEW A critical article review briefly describes the content of an article and, more importantly, provides an in-depth analysis and evaluation of its ideas and purpose. The
LINEAR EQUATIONS IN TWO VARIABLES
 66 MATHEMATICS CHAPTER 4 LINEAR EQUATIONS IN TWO VARIABLES The principal use of the Analytic Art is to bring Mathematical Problems to Equations and to exhibit those Equations in the most simple terms that
Solving Equations. How do you know that x = 3 in the equation, 2x - 1 = 5?
 Question: Solving Equations How do you know that x = 3 in the equation, 2x - 1 = 5? Possible answers to the question are: 1. If you use guess and check, the only number that works for x is 3. 2. Why should
Geometry Solve real life and mathematical problems involving angle measure, area, surface area and volume.
 Performance Assessment Task Pizza Crusts Grade 7 This task challenges a student to calculate area and perimeters of squares and rectangles and find circumference and area of a circle. Students must find
ALGEBRA I (Created 2014) Amherst County Public Schools
 Amherst County Public Schools") ALGEBRA I (Created 2014) Amherst County Public Schools The 2009 Mathematics Standards of Learning Curriculum Framework is a companion document to the 2009 Mathematics Standards of Learning and amplifies
ALGEBRA I (Created 2014) Amherst County Public Schools The 2009 Mathematics Standards of Learning Curriculum Framework is a companion document to the 2009 Mathematics Standards of Learning and amplifies
Algebra 1. Curriculum Map
 Algebra 1 Curriculum Map Table of Contents Unit 1: Expressions and Unit 2: Linear Unit 3: Representing Linear Unit 4: Linear Inequalities Unit 5: Systems of Linear Unit 6: Polynomials Unit 7: Factoring
Tennessee Department of Education. Task: Sally s Car Loan
 Tennessee Department of Education Task: Sally s Car Loan Sally bought a new car. Her total cost including all fees and taxes was $15,. She made a down payment of $43. She financed the remaining amount
Polynomial Operations and Factoring
 Algebra 1, Quarter 4, Unit 4.1 Polynomial Operations and Factoring Overview Number of instructional days: 15 (1 day = 45 60 minutes) Content to be learned Identify terms, coefficients, and degree of polynomials.
UNIT AUTHOR: Elizabeth Hume, Colonial Heights High School, Colonial Heights City Schools
 Money & Finance I. UNIT OVERVIEW & PURPOSE: The purpose of this unit is for students to learn how savings accounts, annuities, loans, and credit cards work. All students need a basic understanding of how
Current Standard: Mathematical Concepts and Applications Shape, Space, and Measurement- Primary
 Shape, Space, and Measurement- Primary A student shall apply concepts of shape, space, and measurement to solve problems involving two- and three-dimensional shapes by demonstrating an understanding of:
Introduction to Quadratic Functions
 Introduction to Quadratic Functions The St. Louis Gateway Arch was constructed from 1963 to 1965. It cost 13 million dollars to build..1 Up and Down or Down and Up Exploring Quadratic Functions...617.2
F.IF.7b: Graph Root, Piecewise, Step, & Absolute Value Functions
 F.IF.7b: Graph Root, Piecewise, Step, & Absolute Value Functions F.IF.7b: Graph Root, Piecewise, Step, & Absolute Value Functions Analyze functions using different representations. 7. Graph functions expressed
Unit Eight (3-4 weeks) Full Speed Ahead! Expressing Growth Through Exponents and Exponential Functions...Page 53
 Full Speed Ahead! Expressing Growth Through Exponents and Exponential Functions...Page 53") ALGEBRA I Algebra I Table of Contents Quarter 1 Unit One (2 weeks) What Comes Next? Representing Numerical Patterns...Page 1 Unit Two (4 weeks) Express Yourself! Using Expressions, Solving Linear Equations
ALGEBRA I Algebra I Table of Contents Quarter 1 Unit One (2 weeks) What Comes Next? Representing Numerical Patterns...Page 1 Unit Two (4 weeks) Express Yourself! Using Expressions, Solving Linear Equations
If the World Were Our Classroom. Brief Overview:
 If the World Were Our Classroom Brief Overview: Using the picture book, If the World Were a Village by David J. Smith, students will gather similar research from their classroom to create their own book.
Measurement with Ratios
 Grade 6 Mathematics, Quarter 2, Unit 2.1 Measurement with Ratios Overview Number of instructional days: 15 (1 day = 45 minutes) Content to be learned Use ratio reasoning to solve real-world and mathematical
ALGEBRA 1 ~ Cell Phone Task Group: Kimberly Allen, Matt Blundin, Nancy Bowen, Anna Green, Lee Hale, Katie Owens
 ALGEBRA 1 ~ Cell Phone Task Group: Kimberly Allen, Matt Blundin, Nancy Bowen, Anna Green, Lee Hale, Katie Owens Math Essential Standards Approximate and interpret rates of change from graphical and numerical
Math: Study Skills, Note Taking Skills, And Test Taking Strategies
 Math: Study Skills, Note Taking Skills, And Test Taking Strategies Math Study Skill Active Study vs. Passive Study Be actively involved in managing the learning process, the mathematics and your study
Models of a Vending Machine Business
 Math Models: Sample lesson Tom Hughes, 1999 Models of a Vending Machine Business Lesson Overview Students take on different roles in simulating starting a vending machine business in their school that
AMSCO S Ann Xavier Gantert
 AMSCO S Integrated ALGEBRA 1 Ann Xavier Gantert AMSCO SCHOOL PUBLICATIONS, INC. 315 HUDSON STREET, NEW YORK, N.Y. 10013 Dedication This book is dedicated to Edward Keenan who left a profound influence
Lesson 3: Using Inequalities to Problem Solve
 Lesson 3: Using Inequalities to Problem Solve Selected Content Standards Benchmarks Addressed: N-1-M Demonstrating that a rational number can be expressed in many forms, and selecting an appropriate form
Solving Rational Equations
 Lesson M Lesson : Student Outcomes Students solve rational equations, monitoring for the creation of extraneous solutions. Lesson Notes In the preceding lessons, students learned to add, subtract, multiply,
Algebra 1 Course Title
 Algebra 1 Course Title Course- wide 1. What patterns and methods are being used? Course- wide 1. Students will be adept at solving and graphing linear and quadratic equations 2. Students will be adept
Part 1: Background - Graphing
 Department of Physics and Geology Graphing Astronomy 1401 Equipment Needed Qty Computer with Data Studio Software 1 1.1 Graphing Part 1: Background - Graphing In science it is very important to find and
Unit #3: Investigating Quadratics (9 days + 1 jazz day + 1 summative evaluation day) BIG Ideas:
 BIG Ideas:") Unit #3: Investigating Quadratics (9 days + 1 jazz day + 1 summative evaluation day) BIG Ideas: Developing strategies for determining the zeroes of quadratic functions Making connections between the meaning
Unit #3: Investigating Quadratics (9 days + 1 jazz day + 1 summative evaluation day) BIG Ideas: Developing strategies for determining the zeroes of quadratic functions Making connections between the meaning