Jerusalem: Facts and Trends 2013
|
|
|
- Ethelbert Blake
- 7 years ago
- Views:
Transcription
1 Jerusalem Institute for Israel Studies Founded by the Charles H. Revson Foundation Jerusalem: Facts and Trends 2013 Maya Choshen Michal Korach Inbal Doron Yael Israeli Yair Assaf-Shapira 2013

2 Publication Number 427 Jerusalem: Facts and Trends 2013 Maya Choshen, Michal Korach, Inbal Doron, Yael Israeli, Yair Assaf-Shapira 2013, The Jerusalem Institute for Israel Studies The Hay Elyachar House 20 Radak St., Jerusalem

3 Table of Contents About the authors... 5 Preface... 6 Area... 7 Population... 7 Population size... 7 Geographic distribution of the population... 9 Population growth... 9 Age of the population Sources of Population Growth Birth Mortality Natural increase Aliyah (Jewish immigration) Internal migration (within Israel) Intranal migration (within Jerusalem) Characteristics of the Family Unit Households Religious identification Marriages and divorces Single-parent families Standard of Living and Welfare Socio-economic characteristics Socio-economic characteristics of statistical areas Extent of poverty Ownership of durables goods Monthly expenditure on consumption Residential density Employment Civilian labor force participation rate Labor force participation rate by religious identification Employment by economic sector Salary and income Satisfaction from various fields of employment... 45

4 Business and Industry Active businesses Business openings and closings Business survivability Industry Education The education system in Jerusalem Hebrew education Arab education Eligibility for matriculation Higher education Housing and Construction Apartments Apartment prices Construction starts Construction completions Tourism Tourist hotels Guests and overnight stays West Jerusalem East Jerusalem Jerusalem compared to select Israeli cities Elections for the 19 th Knesset The Environs of Jerusalem Population size Population growth Age of the population Internal migration

5 - About the Authors - Dr. Maya Choshen is a senior researcher in the Jerusalem Cluster at the Jerusalem Institute for Israel Studies in the fields of urban planning, population and society, public services and evaluation studies. She edits the Statistical Yearbook of Jerusalem, guides the research teams and directs numerous projects in the above-mentioned fields. Michal Korach is a researcher in the Jerusalem Cluster at the Jerusalem Institute for Israel Studies in the fields of population and society and urban planning. She holds a B.A. in Islamic and Middle Eastern Studies and an M.A. in Geography and Urban Planning from Hebrew University of Jerusalem. Inbal Doron is a researcher in the Jerusalem Cluster at the Jerusalem Institute for Israel Studies in the fields of population and society. She holds a B.A. in Geography and History, and leads tours in Jerusalem. Yael Israeli is a researcher in the Jerusalem Cluster at the Jerusalem Institute for Israel Studies in the fields of population and society. She is studying for B.A. in Geography and Psychology at Hebrew University in Jerusalem. Yair Assaf-Shapira is a researcher in the Jerusalem Cluster at the Jerusalem Institute for Israel Studies in the fields of urban planning, population and society, with an expertise in computerized mapping and spatial analysis. He is an architect and holds an M.A. in Geography and Urban Planning from Hebrew University of Jerusalem. 5

6 - Preface - This publication presents an updated and concise picture of Jerusalem and the trends and changes in the city in a wide range of fields, including population, employment, business, education, tourism, construction and the elections for the 19 th Knesset. The publication presents a picture of the current situation in Jerusalem and compares it to the overall situation in Israel and to the situation in Israel s other large cities. It also includes a chapter on local authorities in the environs of Jerusalem. The principal source of the data appearing in this publication is the Statistical Yearbook of Jerusalem, published annually by the Jerusalem Institute for Israel Studies and the Municipality of Jerusalem, with support from the Jerusalem Development Authority (JDA) and the Leichtag Foundation. The data in the Statistical Yearbook of Jerusalem is collected from numerous sources, primarily from the Central Bureau of Statistics and the Municipality of Jerusalem. We would like to thank all those who provided this data for their much-appreciated contribution to both the Statistical Yearbook of Jerusalem and this publication. The entire Yearbook is available on the JIIS website, at: We would like to express our special thanks to Esti Boehm for production, and to Hamutal Appel for preparing the publication for printing. Dr. Maya Choshen Michal Korach Inbal Doron Yael Israeli Yair Assaf-Shapira 6

7 - Area - Jerusalem is the largest city in Israel. Its area of jurisdiction encompasses 125,000 dunams. In comparison, Be er Sheva encompasses 84,000 dunams, Haifa has an area of 69,000 dunams, Rishon Letzion has 59,000 dunams, Tel Aviv 1 has 52,000 dunams, and Ma ale Adumim covers 49,000 dunams. Population size - Population - At the end of 2011, the population of Jerusalem numbered 804,400 residents, including 511,400 Jews 2 and 293,000 Arabs. The Arab population included a Muslim majority (96%) and a Christian minority. Jerusalem s population in 2011 comprised about 10% of the population of Israel; the Jewish population comprised about 8% of the total Jewish population in Israel, while the Arab population comprised about 18% of the total Arab population in Israel. Over the years, there has been a significant decline in the relative size of the Jewish population in Jerusalem, in parallel to an increase in the relative size of the Arab population. The proportion of the Jewish population in Jerusalem declined from 74% Population of Jerusalem, by Population Group, Thousand Arabs Jews & Others In this document, all data on Tel Aviv refers to Tel-Aviv-Jaffa. Hereinafter the Jewish population. In this publication the statistics for the Jewish population include Jews, non-arab Christians and persons without religious classification. 7
 and a Christian minority.")
8 in 1967 to 72% in 1980, to 68% in 2000, and to 64% in This corresponded to an increase in the proportion of the Arab population from 26% in 1967 to 28% in 1980, to 32% in 2000, and to 36% in Population of Jerusalem, by Population Group (percent), % 1% % of total population % 42% 40% 54% 58% 60% 26% 27% 29% 28% 30% 32% 34% 36% 99% 99% 74% 73% 71% 72% 70% 68% 66% 64% Arabs Jews & Others The proportion of the Arab population in Jerusalem (36%) is high in comparison to the Arab population in Israel (21%), in Haifa (10%), and in Tel Aviv (4%). 900 Population in Jerusalem, Tel Aviv and Haifa, by Population Group, Thousands Arabs Jews & Others Jerusalem Tel Aviv Haifa 8
 is high in comparison to the Arab population in")
9 Geographic distribution of the population At the end of 2011, 486,800 of Jerusalem s residents (Jewish and Arab) lived in areas added to the city in 1967, constituting 61% of the city s total population. 196,400 Jewish residents lived in the areas added to the city in 1967, representing 40% of the total number of residents in those areas and 38% of the total Jewish population in the city. Population figures for the large Jewish neighborhoods constructed in the areas added to the city after 1967 included: 41,400 in Ramot Allon; 36,800 in Pisgat Ze ev; 27,800 in Gilo; 18,700 in Neve Ya akov; 14,500 in Ramat Shlomo; 13,800 in Har Homa and 12,500 in East Talpiyot. 290,200 Arab residents lived in the areas added to the city in 1967, constituting 60% of the total population in these areas and 99% of the Arab population in the city. Population in Jerusalem s satellite neighborhoods, Pisgat Ze ev 36,500 38,700 36,800 Neve Ya akov 14,800 29,400 20,300 19,200 18,700 Ramot Allon 21,100 38,100 38,000 41,000 41,400 Gilo 23,900 30,400 28,400 25,400 27,800 East Talpiyot 11,800 15,200 12,850 11,100 12,500 Population growth In 2011, the population of Jerusalem grew by 2.1% (16,300 people): The Jewish population grew by 1.4% (7,200 people), while the Arab population grew by 3.2% (9,100 people). These statistics indicate that the growth rate of the Arab population was higher than that of the Jewish population in both relative and absolute terms. In 2011, the population growth in Jerusalem (2.1%) was slightly higher than the growth rate in Israel (1.8%) and significantly higher than that of Tel Aviv (0.1%) and Haifa (0.8%). The growth of the Jewish population in Jerusalem (1.4%) was lower than the growth of the Jewish population in Israel (1.7%), but significantly higher than that of Tel Aviv (0.0%) and Haifa (0.6%). The Arab population s growth rate in Jerusalem (3.2%) was higher than the Arab population s growth rate in Israel (2.4%). During the years , the population of Jerusalem tripled: The Jewish population grew by a factor of 2.6, while the Arab population grew by a factor of 4.3. During these years, the population of Israel grew by a factor of 2.8: The Jewish population grew by a factor of 2.6, while the Arab population grew by a factor of

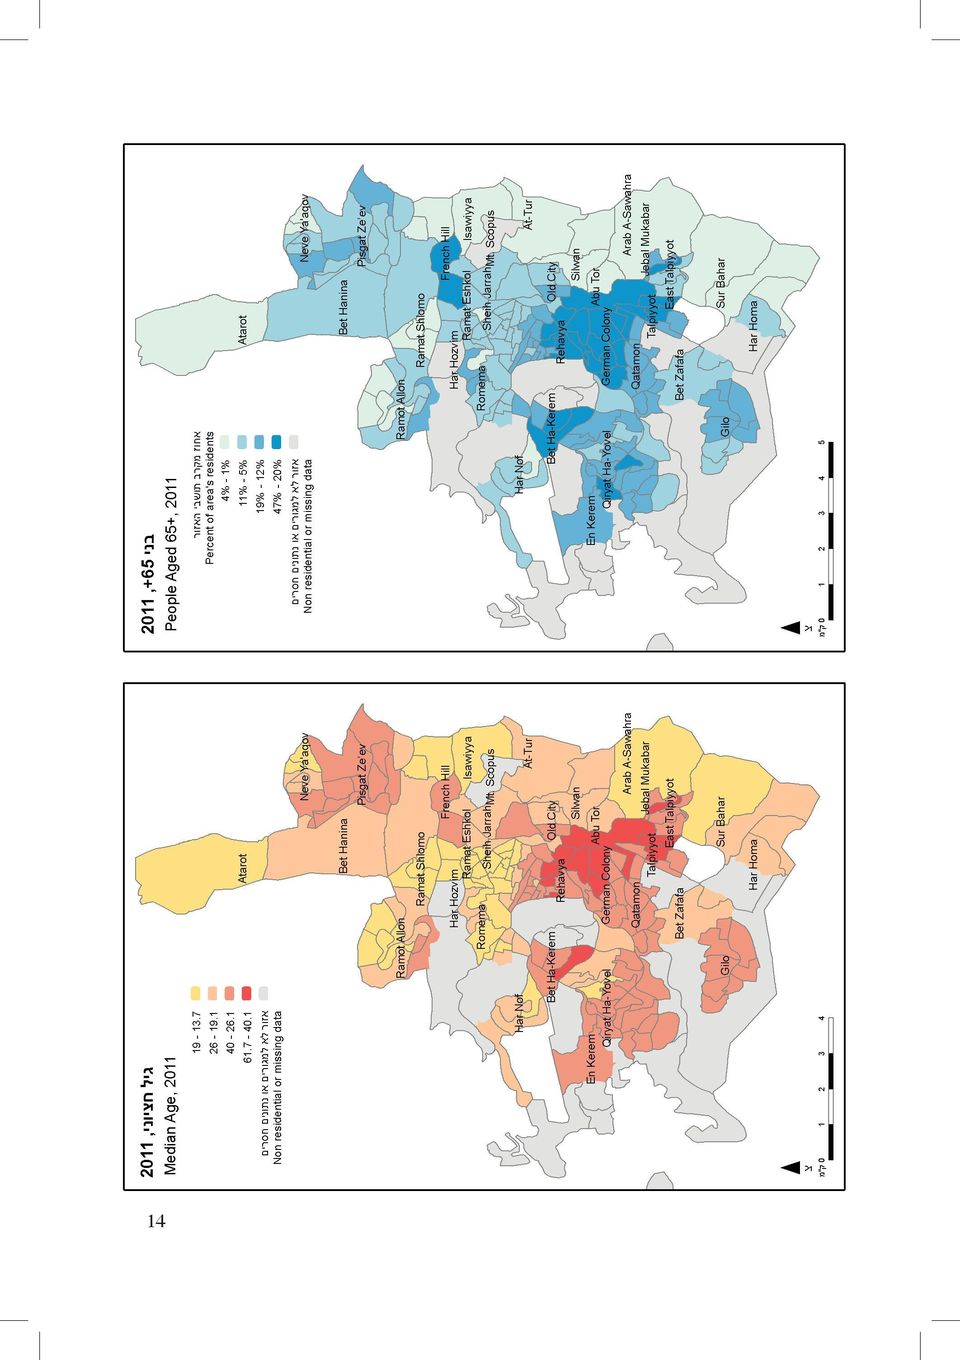
10 Average Annual Population Growth Rate, by Period and Population Group, % Jews & Others Arabs 4% 4% 3% 3% 2% 2% 3% 3% 1% 1% Period Age of the population The population of Jerusalem is characterized by its relative youth. In 2011, the median age of its population was 24 years old (that is, half the population was younger than 24 and half was older than 24). In comparison, the populations of Tel Aviv and Haifa are significantly older than Jerusalem s population, with median ages of 35 and 38, respectively. The median age of Israel s total population was 29 in The Jewish population of Jerusalem is older than the Arab population. In 2011, the median age of the Jewish population was 26, compared to 20 in the Arab population. In the total population of Israel, the median age of Jews was 32 in 2011, compared to a median age of 21 among Arabs. Thus, Jerusalem is characterized by a young age structure, with a relatively high proportion of children (0-14) and a relatively low proportion of elderly people (65 and above). In 2011, children (0-14) accounted for 34% of the city s total population, twice the percentage of children in Tel Aviv (17%) and Haifa (18%), and considerably higher than the percentage in Israel as a whole (28%). Among the Jewish population of Jerusalem, children accounted for 31%, compared to 39% in the Arab population. The proportion of elderly residents (65 and older) in Jerusalem is relatively low. Members of this age group accounted for 9% of Jerusalem s population in 2011, compared to 15% in Tel Aviv, 19% in Haifa, and 10% in Israel as a whole. Seniors comprised 11% of Jerusalem s Jewish population in 2011, compared to only 4% in the Arab population. The Jewish ultra-orthodox 3 population is characterized by its very young age. Within the ultra-orthodox population, the percentage of children (ages 0-14) was 42% in 2011, compared to 26% in the general Jewish population (secular, traditional, and religious 4 ). 3 4 The Jewish population living in neighborhoods where most of the residents are ultra-orthodox. The Jewish population living in neighborhoods where most of the residents are secular, traditional or religious. 10

11 The proportion of senior citizens (ages 65 and older) in the ultra-orthodox population was only 6%, compared to 14% in the general Jewish population. The Muslim-Arab population of Jerusalem is likewise characterized by its relative youth and is significantly younger than the Christian-Arab population. Children (0-14) accounted for 40% of the Muslim-Arab population in 2011, compared to 23% of the Christian-Arab population. Seniors (65 and older) accounted for only 3% of the Muslim- Arab population, compared to 13% of the Christian-Arab population. Population in Jerusalem by Age and Population Group, 2011 Children (0-14) Senior citizens (65+) Median age* Total population in Jerusalem 34% 9% 24 Jewish population 31% 11% 26 General Jewish population 26% 14% 31 (secular, traditional, religious) % 6% Ultra-orthodox Jewish population 3 20 Arab population 39% 4% Muslim-Arab population 40% 3% 20 Christian-Arab population 23% 13% 33 Non-Arab Christian population 15% 20% 42 * The age at which half of the population is older and half the population is younger. Age Structure in Jerusalem, by Population Group, 2011 Age group Arabs Jews and others % of total population 11
 accounted for only 3% of the Muslim- Arab population, compared to 13% of the Christian-Arab population.")
12 In 2011, the population group with the oldest age structure in Jerusalem was the non-arab Christian population, which is also the smallest in size (3,000 residents), with a median age of 42. Next in descending order of groups with older populations are the Christian Arabs, whose median age in 2011 was 33, and the general Jewish population (secular, traditional, and religious), whose median age was 31. The youngest population groups are the Muslim Arabs, whose median age was 20, and the ultra-orthodox Jews, whose median age was 18. Age Structure in Jerusalem and in Israel, 2011 Age group Jerusalem % of total population Israel Age Structure in Tel Aviv and in Haifa, 2011 Age group Haifa % of total population Tel Aviv 12

13 13

14 14
15 - Sources of Population Growth - Three factors contribute to population growth: Natural increase the number of live births minus the number of deaths. Aliyah (Jewish immigration) new immigrants who choose Jerusalem as their first place of residence in Israel. Internal migration balance the number of people moving to Jerusalem from other localities in Israel minus the number of people leaving Jerusalem for other localities in Israel. Birth In 2011, a total of 22,147 infants were born in Jerusalem, 64% of whom were born to Jewish families, and 36% were born to Arab families. These percentages are identical to each group s proportion of the city s population. Jerusalem is characterized by high birthrates in particular, among the Jewish ultraorthodox population and the Arab-Muslim population. In 2011, the birthrate in Jerusalem was 27.8 births per 1,000 persons, and was high compared to Israel (21.4 births per 1,000 persons). The birthrate in the Jewish population of Jerusalem is similar to that of the Arab population. In 2011, the birthrate in the Jewish population of Jerusalem was 27.8 births per 1,000 persons (compared to 20.5 births per 1,000 persons in the overall Jewish population of Israel). In the Arab population of Jerusalem, the birthrate was 27.9 births per 1,000 persons (compared to 25.0 births per 1,000 persons in the overall Arab population of Israel). Since the 1970s, there has been a moderate decline in the birthrates within the Jewish population of Jerusalem. The average birthrate of the Jewish population dropped from Rates per thousand residents Live Births in Israel and in Jerusalem, by Population Group, Arabs - Jerusalem Arabs - Israel Jews & Others - Jerusalem Jews & Others - Israel

16 27.7 births per 1,000 persons during the 1970s ( ) and 1980s ( ) to 25.7 during the 1990s ( ). During the years , the average birthrate remained at a similar level (25.8). The Arab population in Jerusalem has experienced a steep decline in the birthrate. In the 1970s ( ) the average birthrate among the Arab population was 42.5 births per 1,000 persons. This number fell to 32.9 in the 1980s ( ) and rose slightly to 34.1 in the 1990s ( ). During the years , the average birthrate stood at In 2011, the overall fertility rate (the number of expected births during a woman s lifetime) in Jerusalem was 3.9, compared to 3.0 in Israel, 2.1 in Tel Aviv, and 2.2 in Haifa. Thus, a woman in Jerusalem is likely to give birth to nearly twice as many children as a woman in Tel Aviv or Haifa is likely to bear. The overall fertility rate of Jewish women in Jerusalem was 4.2 in 2011, higher than the overall fertility rate of 3.6 among the Arab women of Jerusalem. The high fertility rate among Jewish women is primarily attributable to the high rate among ultra-orthodox women and a relatively high rate among religious women. In 2011, the overall fertility rate among Muslim women in Jerusalem was 3.7 children, slightly higher than the overall fertility rate of 3.5 among Muslim women in Israel. Number of children per woman Total Fertility Rate in Israel and Jerusalem, by Population Group, 2006, Jews & others - Jerusalem Arabs - Jerusalem Arabs - Israel Jews & others - Israel Mortality In 2011, 3,417 people died in Jerusalem 77% were Jews and 23% Arabs. The mortality rate in Jerusalem was 4.3 deaths per 1,000 persons, lower than in Israel (5.3), Tel Aviv (8.1) and Haifa (9.3). The lower mortality rate can be attributed to Jerusalem s relatively young population. 16
. During the years 2000-2011, the average birthrate stood at 31")
17 The mortality rate in the Arab population of Jerusalem is significantly lower than the mortality rate in the Jewish population. In 2011, the mortality rate of the Jewish population in Jerusalem was 5.2 deaths per 1,000 persons (compared to 5.9 deaths per 1,000 persons among the Jewish population of Israel, 8.3 in Tel Aviv, and 9.9 in Haifa), nearly double the rate of the Arab population of Jerusalem, which was 2.7 deaths per 1,000 persons (The mortality rate among Jerusalem s Arab population is similar to the mortality rate among the overall Arab population in Israel). Over the years, the mortality rate of the Jewish population of Jerusalem has moderately declined, while the mortality rate of the Arab population has dropped sharply and quickly. The average mortality rate in the Jewish population fell from an average of 6.4 deaths per 1,000 persons during the 1970s ( ) to 5.9 during the 1980s ( ), to 5.5 during the 1990s ( ), and to 5.2 during In the Arab population, the average mortality rate dropped from 6.4 deaths per 1,000 persons during the 1970s ( ), 5 to 4.5 during the 1980s ( ), to 3.5 in the 1990s ( ) and to 2.8 during the years One of the main factors explaining the sharp decline in the mortality rate of the Arab population is the sharp decline in infant mortality. During the 1970s ( ) the average infant mortality rate in the Arab population of Jerusalem was 45.2 deaths per 1,000 live births. This figure dropped to 17.2 in the 1980s ( ), to 10.7 in the 1990s ( ) and to 6.8 during the years During the years , the average infant mortality rate among the Jewish population of Jerusalem was 3.1 (and 2.7 among the Jewish population of Israel), compared to 6.8 in the Arab population (similar to the 6.7 rate among the overall Arab population of Israel). The relatively high infant mortality rate within the Arab population is partly attributable to birth defects that occur more frequently within the Muslim population because of consanguinity (marriages between cousins). 6 The decreased mortality rates among the Arab population of Jerusalem are the result of improved sanitation, healthcare and preventive medicine during the 1970s and 1980s, and implementation of the National Health Insurance Law beginning in the mid-1990s. Another reason that mortality rates of the Arab population are lower than those of the Jewish population is that the Arab population is younger than the Jewish one. In 2011, the proportion of children (ages 0-14) within the Arab population was 39% (compared to 31% within the Jewish population), while the proportion of seniors (ages 65 and older) was only 4% (compared to 11% among the Jewish population). Seniors aged 75 and above constituted 1% of the Arab population, compared to 6% of the Jewish population. 5 6 It should be noted that during these years the mortality rates among the Arab population of Jerusalem dropped from 7.3 deaths per 1,000 persons in 1973 to 5.3 deaths in Within the Jewish population, mortality rates dropped from 6.8 to 6.0 during these years. 17
.")
18 Natural increase Natural increase (the number of births minus the number of deaths) is the principal factor in the growth of Jerusalem s population. In 2011, natural increase resulted in the addition of 18,700 persons to the population of Jerusalem 61% Jews and 39% Arabs. The natural increase in Jerusalem in 2011 was significantly higher than in Tel Aviv (4,500 persons) and Haifa (1,500 persons). During this year, the rate of natural increase in Jerusalem was 23.5 per 1,000 persons, compared to 16.2 in Israel, 11.1 in Tel Aviv, and 5.6 in Haifa. The rate of natural increase of the Arab population of Jerusalem is higher than that of the Jewish population. In 2011, the rate of natural increase was 25.3 per 1,000 persons among the Arab population and 22.6 per 1,000 among the Jewish population. However, the rate of natural increase of the Jewish population in Jerusalem is higher than the rate of natural increase of the Jewish population in Israel 22.6 and 14.6, respectively. Similarly, the rate of natural increase of the Arab population in Jerusalem is higher than that of the Arab population of Israel 25.3 and 22.2, respectively. Since the 1970s, there has been a decline in the rate of natural increase in Jerusalem among both the Jewish and Arab populations. The decline within the Jewish population was moderate: During the 1970s ( ) and 1980s ( ), the average rate of natural increase among the Jewish population was 21.3 and 21.8 per 1,000 persons, respectively. The rate fell to 20.3 in the 1990s ( ) and remained steady at 20.0 during the following decade ( ). However, during the current decade, the average rate of natural increase began to rise and was 22.8 for the years In the Arab population, the rate of natural increase has dropped sharply over the years. During the 1970s ( ), the average rate of natural increase among the Arab population of Jerusalem was 36.2 per 1,000 persons. The rate fell to 28.5 during the 1980s ( ), rose slightly to 30.3 in the 1990s ( ), and averaged 29.0 during Rates per thousand residents Natural Increase Rate in Jerusalem, by Population Group, Jews & Others Arabs

19 the following decade ( ). The downward trend continued during the years , with an average rate of 26.2 Aliyah (Jewish immigration) 7 In 2011, some 2,300 new immigrants settled in Jerusalem, many more than the number of new immigrants who settled in Tel Aviv (900) or Haifa (1,100). Approximately 14% of all new immigrants to Israel in 2011 settled in Jerusalem, a much higher percentage than that recorded in Tel Aviv (5%) or Haifa (7%). On an annual average, immigrants to Jerusalem comprised 13% of all new immigrants to Israel during the years (compared to 7% during the years ), compared to 5% in Tel Aviv and 5% in Haifa (10% during the years in Tel Aviv as well as in Haifa). The five countries from which the highest percentages of immigrants arrived in the years were the United States (31%), France (20%), Russia (10%), Britain (7%), and the Ukraine (5%). During the 1990s, many new immigrants arrived in Israel, over 80% of whom came from states of the former Soviet Union. The year 2002 marked a turning point, with a significant decline in the number of new immigrants from these countries, who comprised 55% of new immigrants that year. The relative proportion of these immigrants continued to decline in the years that followed, reaching 43% in Concurrently, there was a significant increase in the proportion of immigrants from Western Europe and the United States. During the past decade, there was a substantial drop in the number of new immigrants. In 2002, a total of 33,600 new immigrants arrived in Israel. This figure fell to 21,200 in 2005 and to 16,900 in In Jerusalem, contrary to the general trend in Israel, the number of new immigrants remained relatively consistent throughout the first decade of the 21st century, with an annual average of approximately 2,500 new immigrants during the years , and 2,300 during the years Jerusalem is relatively less attractive than other options for immigrants of limited resources. Therefore, during the years in which a large number of immigrants arrived from the former Soviet Union, the proportion of immigrants who chose to reside in Jerusalem was low approximately 7%. However, due to the changing profile of immigrants to Israel since 2002 in particular the increase in the proportion of immigrants from prosperous countries (mainly the U.S. and Western Europe) there has been a significant increase in the proportion of immigrants who choose Jerusalem as their first place of residence in Israel. In 2011, there were 66,800 residents of Jerusalem who had immigrated to Israel since 1990 and they constituted 8% of the city s total population, and 13% of its Jewish population. 7 Not including immigrant citizens (returning Israelis). 19
, compared to 5% in Tel Aviv and 5%")
20 Among the immigrants, 57% immigrated during the years and 43% during Immigrants who arrived since the year 2000 comprised 6% of the Jewish population of Jerusalem. The proportion of immigrants who arrived since 1990 of Jerusalem s Jewish population (13%) is comparable to the figure for Tel Aviv (12%) but lower than the percentage in Haifa (23%) and in some of the localities near Jerusalem, such as Beit Shemesh (20%) and Ma ale Adumim (15%). The percentage of immigrants in Givat Ze ev (7%), Modi in Illit (5%), and Beitar Illit (5%) is lower than the percentage in Jerusalem. Jerusalem neighborhoods with a relatively high number of immigrants who arrived between the years include Bayit V Gan (1,700), Katamon (1,600), Talpiyot and Arnona (1,600), and East Talpiyot (1,400). The immigrants comprise a particularly high percentage of the neighborhood population in Talbiya (15%), the city center and Rehavia (13% each), and in Baq a, the German Colony, Talpiyot and East Talpiyot (11%). Neighborhoods in Jerusalem with a relatively high number of immigrants include Pisgat Ze ev North (3,800), Pisgat Ze ev East (2,700), Neve Ya akov (2,600), Gilo (East) and Katamon A-I (1,800 each). The immigrants comprise a high percentage of the neighborhood population in Pisgat Ze ev North (23%), Neve Ya akov (14%) and Pisgat Ze ev East, French Hill, East Talpiyot and Kiryat Yovel (South) (13% each). Internal migration (within Israel) Internal migration is one of the salient topics in the public discourse in Israel in general and in Jerusalem in particular. This is especially true in regard to the development, branding and attractiveness of localities and local authorities. Internal migration is often cited as one of the considerations of policy makers and decision makers at the local, regional and national levels. This is because the internal migration balance is the primary element among the sources of population growth that can be affected by implementing policies at the local level and in the relative short term, as opposed to natural increase. During 2011, 17,800 residents of Jerusalem migrated to other localities in Israel, while 10,400 new residents moved into the city from other localities in Israel. The net migration balance was thus negative, at -7,400, and it was relatively high in comparison to the past decade. In 2011, a negative migration balance was recorded between Jerusalem and each of the districts in Israel, with the exception of the Southern District. The largest negative migration balance was between Jerusalem and Jewish localities in Judea and Samaria (-2,600 persons), followed in decreasing order by the Jerusalem District (-2,200 persons), the Tel Aviv District (-1,200 persons), the Central District (-800 persons), the Northern District (-350 persons), and the Haifa District (-150 persons). It should be noted that until 20
, Modi in Illit (5%), and Beitar Illit (5%) is lower than the percentage in Jerusalem.")
21 2009, Jerusalem had a positive migration balance with the Northern and Haifa districts. In 2011, Jerusalem had a positive migration balance only with the Southern District (70 persons). Internal Migration to and from Jerusalem, Migration balance Left Entered Thousands Internal Migration Balance to and from Jerusalem, by District of Residence, Persons ,000-1,500-2,000-2, ,000 Jerusalem Northern and Southern Haifa Districts Central and Tel-Aviv Judea and Samaria The localities that attracted the greatest numbers of residents from Jerusalem in 2011 were Beit Shemesh (1,850), Tel Aviv (1,500), Beitar Illit (890), Givat Ze ev (840), Modi in Illit (750) and Modi in-maccabim-reut (710). The localities from which Jerusalem attracted the greatest numbers of residents were Bnei Brak (660), Tel Aviv (600), Beit Shemesh (550), Ma ale Adumim (470), and Beitar Illit (400). 21
22 During the years , a total of 89,830 residents left Jerusalem for other localities in Israel, and 56,760 new residents arrived in Jerusalem from other localities. In total, the population of the city shrunk by 33,070 residents as a result of a negative migration balance. Among those who left Jerusalem, the percentage who moved to the greater Jerusalem metropolitan area was evident 48% (31% relocated to Judea and Samaria, 17% moved to the Jerusalem District). During these same years, 34% of those who left Jerusalem migrated to Tel Aviv metropolitan area (17% to the Tel Aviv District and 17% to the Central District). Among those migrating to Jerusalem, the proportion of those arriving from Jerusalem metropolitan area was comparable to those arriving from Tel Aviv metropolitan area. During the years , 36% of those migrating to Jerusalem came from Jerusalem metropolitan area (24% from Judea and Samaria, and 12% from the Jerusalem District), and 34% came from Tel Aviv metropolitan area (17% from the Tel Aviv District and 17% from the Central District). As a general rule, migrants are characteristically young. This holds for Jerusalem as well: Both those who leave the city and those who move to it are typically young. During the years , 47% of those who left Jerusalem and 53% of those moving to Jerusalem were aged The median age of those leaving Jerusalem was 25.2, and that of new residents was The age groups whose numbers were most reduced by Jerusalem s negative migration balance during these years were: children aged 0-4 (whose families departed the city) (-7,920), ages (-4,480), and ages (-4,260). Among seniors (ages 65 and older), there was a negative migration balance of -1,370 (1,990 moving to Jerusalem and 3,360 leaving the city). Entering Jerusalem, by Age, Year Total Age and up ,200 1,300 1,640 2,440 2,300 1,260 1, ,430 1,370 1,860 2,670 2,830 1,380 1, ,660 1,370 1,880 2,560 2,260 1,250 1, ,080 1,380 1,700 2,400 2,160 1,210 1, ,390 1,200 1,600 2,150 2,030 1, ,760 6,620 8,680 12,220 11,580 6,220 5,090 4,360 1,990 22
23 Leaving Jerusalem, by Age, Year Total Age and up ,600 2,700 2,800 3,330 2,850 2,040 1,710 1, ,350 2,720 2,600 3,250 2,830 2,120 1,670 1, ,800 2,840 2,740 3,430 3,460 2,350 1,750 1, ,320 3,040 2,790 3,230 3,200 2,140 1,790 1, ,760 3,240 2,630 3,240 3,040 2,050 1,640 1, ,830 14,540 13,560 16,480 15,380 10,700 8,560 7,250 3,360 Jerusalem s Migration Balance, by Age, Year Total Age and up ,400-1,400-1, ,920-1, ,140-1, ,200-1, ,240-1,660-1, , ,370-2,040-1,030-1,090-1, ,070-7,920-4,880-4,260-3,800-4,480-3,470-2,890-1,370 23
24 0 Internal Migration Balance to and from Jerusalem, of Migrants Aged 20-44, by Age Groups, Persons -1,000-1, , Internal migration (within Jerusalem) In 2011, 38,800 people changed their place of residence within Jerusalem. The Jewish neighborhoods recording the highest positive migration balance were Ramat Sharet and Ramat Denya (220 residents), Har Homa (210) Kiryat Moshe and Beit Hakerem (200), Givat Shaul and Mea She arim (140 each). Neighborhoods with a negative migration balance included: Sanhedriya and Tel Arza (-260), Bayit V Gan (-210), Romema (-200), Har Nof (-175), the German Colony and Old Katamon (-140), and East Talpiyot (-130). The Arab neighborhoods recording the highest positive migration balance were: Kafr Aqab and Atarot (1,060), Shu afat refugee camp (690) and New Anata (360). Neighborhoods recording a negative migration balance included: the Muslim Quarter (-1,240), Wadi Joz and Sheikh Jarrah (-430) and Shu afat (-360). 24
25 25
26 Households - Characteristics of the Family Unit - In 2011, Jerusalem had a total of 192,100 8 households: 9 140,400 Jewish households (73%) and 50,400 Arab households (26%). Thus, the proportion of Jewish households (73%) is greater than its share of the city s population (62%). This is because Jewish households typically include a smaller number of persons than Arab households. The average size of a household 10 was 3.4 persons in the Jewish population, compared to an average of 5.7 persons in the Arab population. In 2011, 20% of the Jewish households numbered one person, compared to only 5% of Arab households. Households of six or more persons constituted 16% of the Jewish households, compared to 50% of Arab households. Households in Jerusalem, by Size of Household, and Population Group of Household's Head, 2010/2011 % of households % 5% 25% 14% 9% 9% Jews & others Arabs 18% 16% 13% 12% 11% 6% 10% 31% Persons in household Jerusalem s Jewish population is characterized by large households relative to the Jewish population of Israel s large cities. In 2011, the average size of Jewish households in Jerusalem was 3.4 persons, compared to 3.1 in Israel as a whole, 2.4 in Haifa, and 2.2 in Tel Aviv. The average size of an Arab household in Jerusalem (5.7) was larger than the average size of an Arab household in Israel as a whole (4.8). 8 Includes households whose affiliated population group is unknown, as well as Others (those who are not Jewish or Arab). 9 A household is defined as one person or a group of persons living together in a single home on a permanent basis for most of the week and who share food expenses. A household may include persons who are not family relations. 10 Includes households comprising only one person. 26
27 There is a significant difference between the size of Jewish households in Jerusalem and the size of households in Tel Aviv and Haifa. In 2011, 20% of Jewish households in Jerusalem numbered a single person, compared to 38% in Tel Aviv and 28% in Haifa. In Jerusalem, 16% of Jewish households numbered six or more persons, compared to 2% in Tel Aviv and 3% in Haifa. Religious identification Jerusalem s population is very diverse and includes groups with distinct characteristics. One of the characteristics distinguishing the population groups in Jerusalem is the nature of their religious identification. The Social Survey conducted by the Central Bureau of Statistics (CBS) among those aged 20 and above reveals that (on average) during the years , 30% of the Jews in Jerusalem defined themselves as ultra-orthodox, 21% as observant, 29% as traditional (including traditional-observant and traditional-not very observant), and 20% as secular. The percentage of Jerusalem s population aged 20 and above who defined themselves as ultra-orthodox (30%) is the highest among Israel s large cities and is significantly higher than the proportion of ultra-orthodox Jews in Israel (9%). In comparison, the percentage of ultra-orthodox Jews in Haifa is 3%, and just 2% in Tel Aviv and in Rishon Letzion. Among those 20 and above, the percentage of Jerusalem residents who defined themselves as religious (21%) is also above the average for Israel (10%). The proportion of those who defined themselves as traditional in Jerusalem is 29%, which is lower than the average for Israel (38%) and the lowest among Israel s large cities. The proportion of secular residents of Jerusalem (20%) is lower than the average for Israel (43%) and is the lowest among Israel s large cities. The percentage of secular residents in Tel Aviv is the highest among Israel s large cities at 61%, compared to 55% in Haifa, 47% in Rishon Letzion, and 34% in Ashdod. Religious Identification of the Jewish Population (20+) in Israel, Jerusalem and the Major Cities, (Average) Religious identification Israel Jerusalem Tel Aviv Haifa Rishon Letzion Ashdod Total 100% 100% 100% 100% 100% 100% Ultra-orthodox 9% 30% 2% 3% 2% 10% Observant 10% 21% 4% 5% 6% 6% Traditional observant 14% 11% 9% 9% 13% 21% Traditional loosely observant 24% 18% 24% 28% 32% 29% Non religious, secular 43% 20% 61% 55% 47% 34% 27
28 Jewish Population aged 20 and Over, in Israel, Jerusalem, Tel Aviv and Haifa, by Level of Religious Observance, Nonreligious, secular Traditional-loosely observant Traditional-observant Observant Ultra-Orthodox Israel 43% 24% 14% 10% 9% Jerusalem 20% 18% 11% 21% 30% Tel Aviv 61% 24% 9% 4% 2% Haifa 55% 28% 9% 5% 3% % of population aged 20 and over Within the non-jewish population of Jerusalem, about 15% of the respondents defined themselves as very religious, 60% as religious, 21% as not very religious, and 4% as not religious. In comparison, within the non-jewish population of Israel as a whole, 8% defined themselves as very religious (about half the figure for Jerusalem), 48% as religious, 23% as not very religious, and 21% as not religious. Religious Identification of the Non-Jewish Population (20+) in Israel and in Jerusalem, (Average) Total Not religious Not very religious Religious Very religious Jerusalem 100% 4% 21% 60% 15% Israel 100% 21% 23% 48% 8% A comparison between the extent of religious identification in Jerusalem and that of Israel reveals that in Jerusalem both the Jewish population and the non-jewish population define themselves as more religious than in Israel overall. Marriages and divorces At the end of 2010, 66% of Jerusalem s population aged 20 and above were married, 23% were single, 6% divorced and 5% widowed. The percentage of married residents of Jerusalem (66%) was slightly higher than the national average of 63%, higher than in Haifa (56%) and much higher than in Tel Aviv (46%). The percentage of married residents in Jerusalem s Jewish sector was 62%, lower than the figure in the Arab sector (72%). 28
29 Jerusalemites marry at a relatively young age. Among young persons aged 20-34, 53% were married, compared to 45% in Israel, 35% in Haifa and 28% in Tel Aviv. 8% of all married persons in Jerusalem were in the age range of when they wed. This was higher than the figure for Israel (4%), Haifa (2%) and Tel Aviv (2%). 1% of all married persons in Jerusalem wed before the age of 20. The young age and high percentage of marriage in Jerusalem derives, in part, from the large proportion of ultra-orthodox Jews and Muslim Arabs in the city s population. The percentage of divorce in Jerusalem was relatively low. Among city residents ages 35 and above, 9% were divorced, compared to 16% in Tel Aviv and 15% in Haifa. The divorce rate among those aged 35 and above was higher in the Jewish population than in the Arab population, 11% and 3%, respectively. Single-parent families In 2011, 8,100 single-parent families resided in Jerusalem. 11 These families included approximately 14,000 children below the age of 18, who constituted 5% of the total number of children in the city. This percentage was lower than the figure for Israel, where 9% of children live in single-parent families. In Tel Aviv and Haifa, the percentage of children in single-parent families was especially high, at 17% and 15%, respectively. In Jerusalem 21% of the children in single-parent families belong to households headed by unmarried singles (that is, not including divorced or widowed parents); this is slightly lower than the figure for Israel (23%) and much lower than the figure for Tel Aviv (40%). Among the localities in the environs of Jerusalem, the percentage of children in households headed by unmarried singles was 26% in Mevasseret Zion, 16% in Ma ale Adumim and 13% in Beit Shemesh. 11 A family in which there is one parent raising the child/children, including parents who are divorced, widowed or unmarried. 29
30 - Standard of Living and Welfare - Socio-economic characteristics Jerusalem belongs to Cluster 4 according to the socio-economic index of the CBS. Cluster 1 includes the local authorities whose residents are by average at the lowest socio-economic level, and Cluster 10 includes the localities whose residents are at the highest socio-economic level. The index characterizes the population of the localities by weighing social and economic variables from the following fields: demography, education, employment and retirement, and standard of living. In preparing the index, 252 local authorities (cities, local councils and regional councils) in Israel were classified into ten clusters. Jerusalem, as noted is ranked in Cluster 4, the lowest ranking among the large cities with populations of over 200,000 residents. Ashdod is ranked in Cluster 5, Petah Tikva and Rishon Letzion in Cluster 6, Haifa in Cluster 7 and Tel Aviv in Cluster 8. Jerusalem s relatively low ranking is largely attributable to the high proportion of two population groups that are characterized by a low socio-economic level: the ultra-orthodox population, which comprises about 23% of the city s population, and the Arab population, which accounts for about 36%. As displayed in the following table, Jerusalem also has a low ranking in comparison to neighboring communities, with the exception of the ultra-orthodox localities (or communities in which there is a large concentration of ultra-orthodox Jews) and in Abu Ghosh. Socio-Economic Characteristics of the Population in Localities in the environs of Jerusalem, 2008 Har Adar Mevasseret Zion Modi in-maccabim-reut Efrat Ma ale Adumim Givat Ze ev Jerusalem Kiryat Ye arim (Telz Stone) Beit Shemesh Abu Ghosh Modi in Illit Beitar Illit Mateh Yehuda Regional Council Gush Etzion Regional Council Mateh Binyamin Regional Council
31 In addition to the division into clusters, the 252 local authorities were ranked in descending order from 1 to 252 (1 indicates the lowest socio-economic standing and 252 indicates the highest socio-economic standing). In this ranking, Jerusalem is in 99 th place. Local authorities that were similarly ranked include Sderot (98), Kiryat Gat (97), Tiberias (100) and Mitzpeh Ramon (101). Socio-economic characteristics of statistical areas The socio-economic index was also calculated for neighborhoods/areas. All of the statistical areas 12 in Israel (1,616 areas) are classified into 20 homogeneous clusters, with Cluster 1 indicating the lowest socio-economic level and Cluster 20 relatively indicating the highest level. The grouping of statistical areas in clusters enables, among other things, the classification of the city s population according to socio-economic standing (low, middle, high). The data indicates that about half of Jerusalem s population belongs to the low socioeconomic group, 45% to the middle class (lower-middle and upper-middle) and 4% to the high socio-economic class. Socioeconomic status Total population, 2008 Socio-Economic Characteristics of Statistical Areas in Israel and in the Major Cities, 2008 Socioeconomic cluster Israel Jerusalem Tel Aviv Haifa Rishon Letzion Ashdod Petah Tikva 7,419, , , , , , ,300 Low % 51% 1% 2% 2% 20% 2% Lower-middle % 20% 23% 37% 14% 38% 25% Upper-middle % 25% 38% 33% 84% 42% 63% High % 4% 37% 28% 0% 0% 10% Very low 1-3 8% 24% 0% 0% 0% 11% 0% Very high % 0% 16% 9% 0% 0% 4% 12 The statistical areas are small geographical units that are as homogeneous as possible, reflecting the unique characteristics of areas within the locality. A statistical area is usually designed for residential areas of 3,000-4,000 people. 31
32 About a half (51%) of Jerusalem s population, as noted, belongs to the low socioeconomic group. This constitutes a very high percentage of the population in comparison to Israel as a whole (23%) and to other large Israeli cities (2% in Haifa, Rishon Letzion and Petah Tikva, 1% in Tel Aviv and 20% in Ashdod). About one-quarter (25%) of the city s population belongs to the upper-middle class. This percentage is low in comparison to other large cities and Israel in general. The percentage of the population belonging to the high socio-economic class (4%) in Jerusalem is also low in comparison to Israel (9%) and its major cities: 37% in Tel Aviv, 28% in Haifa and 10% in Petah Tikva. In Ashdod and Rishon Letzion, however there is not even one area that belongs to the high socioeconomic class. The data on the various population groups in Jerusalem shows wide disparities between the Jewish population and the Arab population. All of the neighborhoods in Jerusalem that have a majority of Arab residents are in the low socio-economic echelon (100%). Among the Jewish population, about a quarter (24%) of the population is in the low socio-economic group. About a third (31%) of the Jewish population is classified as belonging to the lower-middle class, 39% to the upper-middle class and 6% to the high socio-economic echelon. As noted, all of the Arab neighborhoods were classified in the low socio-economic group (clusters 1-5), with classifications ranging from 2-5. The neighborhoods with the lowest socio-economic standing (Cluster 2) included the Shu afat refugee camp, New Anata, Isawiya, the Muslim Quarter, Silwan, Ras al-amud and Jabal Muqaber. The neighborhoods receiving the highest socio-economic classification (Cluster 5) included Bab a-zahra, Mas udiya and the Armenian Quarter. Similarly, there are wide socio-economic disparities in the Jewish population between the general population (secular, traditional and religious) and the ultra-orthodox population. Nearly two-thirds (62%) of the ultra-orthodox population belongs to the low socioeconomic group, compared to only 3% of the general Jewish population. The percentage of the population belonging to the lower-middle class is similar in the two groups at 32% and 30%, respectively. In regard to the upper-middle class, only a small number (6%) of ultra-orthodox Jews belong to this group, while over a half of the general population (57%) is classified as belonging to this group. No ultra-orthodox areas were classified as having a high socio-economic profile, while about 10% of the general population was assigned this classification. The neighborhoods populated mainly by ultra-orthodox Jews were classified, as noted, mainly into the low and lower-middle socio-economic groups, ranging from clusters The neighborhoods with the lowest socio-economic standing (Cluster 2) included Geula, Neve Ya akov East, New Beit Yisrael and Mea She arim. Southwest Har Nof received the highest socio-economic standing (12), and Northwest Har Nof, East Bayit V Gan, Knesset and Bati Broide all were classified as belonging to Cluster 11. The neighborhoods populated mainly by the general Jewish population (secular, traditional and religious) were categorized mainly as middle class (including lower-middle and upper-middle). This population was assigned clusters ranging from
33 The general Jewish neighborhoods classified as having the lowest socio-economic status (clusters 4-6) do not have an ultra-orthodox majority, but do have a high percentage of ultra-orthodox residents: Musrara, Neve Ya akov (North, Central and South) and Central Givat Shaul. The Katamon I (9 th ) neighborhood, which does not have an ultraorthodox population, was classified as Cluster 6. None of the areas in Jerusalem received the highest ranking, Cluster Nayot-Neve Shaanan was the neighborhood with the highest classification, Cluster 19. No area in Jerusalem was classified in Cluster 18; South Beit Hakerem, Givat Oranim (the area of Hatayasim Street and Nili Street) and South Ramot Allon (Hahoresh Street) were all classified as Cluster 17. Socioeconomic status Socio-Economic Characteristics of Statistical Areas in Jerusalem, by Population Group, 2008 Socioeconomic cluster Total population Jewish population Arab population Jewish population General population (secular, traditional and religious) Ultra- Orthodox population Low % 24% 100% 2% 62% Lower-middle % 31% 0% 13% 13% Upper-middle % 39% 0% 57% 7% High % 6% 0% 10% 0% Very low % 6% 57% 0% 17% Very high % 0% 0% 0.5% 0% 13 Only 5 statistical areas in Israel were classified as Cluster 20: Savyon, two areas in Haifa (Ramat Golda, Denya and Hod Hacarmel), an area in Tel Aviv (Tel Baruch and North Tel Baruch) and an area in Ramat Hasharon (the Golan and Neve Rom neighborhoods). 33
Jerusalem: Facts and Trends 2011
 Jerusalem Institute for Israel Studies Founded by the Charles H. Revson Foundation Jerusalem: Facts and Trends 2011 Maya Choshen, Michal Korach Graphs: Yair Assaf-Shapira Statistics and Data Analysis:
Coalition for Jerusalem The Master Plan of Jerusalem 2000. Analytic Study. 1. Part One. The Study
 Coalition for Jerusalem The Master Plan of Jerusalem 2 Analytic Study 1. Part One The Study Compiled and researched by: Souad Nasr- Makhoul City and Regional Planner June 26 1 Content Page Introduction
The PRI E. of the Settlements. Or How Israel Favors Settlements and Settlers
 The 00,000 1,000,0 PRI E of the Settlements Or How Israel Favors Settlements and Settlers 2013 So How Much do the Settlements Actually Cost? (Or) Where Is The Money Hiding? It is very hard to estimate
Summary of the 9-Months Talks: Unprecedented Settlement Development
 Summary of the 9-Months Talks: Unprecedented Settlement Development Settlement Watch, Peace Now, 29/4/14 During the 9 months of Secretary Kerry s efforts in the region, the Israeli Government promoted
Prospective immigration to Israel through 2030: methodological issues and challenges
 WP 21 23 April 2010 UNITED NATIONS STATISTICAL COMMISSION and ECONOMIC COMMISSION FOR EUROPE STATISTICAL OFFICE OF THE EUROPEAN UNION (EUROSTAT) CONFERENCE OF EUROPEAN STATISTICIANS Joint Eurostat/UNECE
III. CHANGING BALANCE BETWEEN AGE GROUPS
 Population Ageing 195-25 III. CHANGING BALANCE BETWEEN AGE GROUPS A. BROAD AGE GROUPS The young-old balance is shifting throughout the world The increasing proportions of aged persons have been accompanied,
NATIONAL SURVEY OF HOME EQUITY LOANS
 NATIONAL SURVEY OF HOME EQUITY LOANS Richard T. Curtin Director, Surveys of Consumers Survey Research Center The October 1998 WP51 The 1988, 1994, and 1997 National Surveys of Home Equity Loans were sponsored
10. European Union. (a) Past trends
 Past trends") . European Union (a) Past trends The total fertility rate in the 15 countries that presently constitute the European Union was on a rising curve until 196-65, when it attained 2.69 births per woman. Since
. European Union (a) Past trends The total fertility rate in the 15 countries that presently constitute the European Union was on a rising curve until 196-65, when it attained 2.69 births per woman. Since
The U.S. labor force the number of
 Employment outlook: 14 Labor force projections to 2014: retiring boomers The baby boomers exit from the prime-aged workforce and their movement into older age groups will lower the overall labor force
Meeting Minutes On Borders
 Meeting Minutes On Borders Jerusalem, King David Hotel 4 May 2008 20:45-21:30 Attendees: Palestinians side: Ahmad Qurei (Abu Ala ) - Dr. Saeb Erekat - Dr. Samih al-abed - Khaled Elgindi - Salah Ilayan
I. DEMOGRAPHIC DETERMINANTS OF POPULATION AGEING
 World Population Ageing 9- I. DEMOGRAPHIC DETERMINANTS OF POPULATION AGEING Underlying global population ageing is a process known as the demographic transition in which mortality and then fertility decline
New South Wales State and Regional Population Projections 2001-2051. 2004 Release TRANSPORT AND POPULATION DATA CENTRE
 New South Wales State and Regional Population Projections 21-251 251 24 Release TRANSPORT AND POPULATION DATA CENTRE THE TRANSPORT AND POPULATION DATA CENTRE (TPDC) The TPDC is located in the NSW Department
The trend of Vietnamese household size in recent years
 2011 International Conference on Humanities, Society and Culture IPEDR Vol.20 (2011) (2011) IACSIT Press, Singapore The trend of Vietnamese household size in recent years Nguyen, Thanh Binh 1 Free University
United Nations INTRODUCTION. The World at Six Billion 1
 INTRODUCTION According to the latest United Nations population estimates, world population reaches the six billion mark on 12 October 1999, an historic milestone in the growth of world population. The
Retail Prices in a City: An Empirical Analysis
 Retail Prices in a City: An Empirical Analysis Alon Eizenberg The Hebrew University and CEPR Merav Yiftach Israel Central Bureau of Statistics Saul Lach The Hebrew University and CEPR This draft: June
Selected Data for Universal Children's Day, 2014
 Media Release State of Israel info@cbs.gov.il www.cbs.gov.il Fax: 02-6521340 Jerusalem November 18, 2014 312/2014 Selected Data for Universal Children's Day, 2014 At the end of 2013, 2.682 million children
POPULATION AND MIGRATION ESTIMATES NORTHERN IRELAND (2013) STATISTICAL REPORT
 STATISTICAL REPORT") POPULATION AND MIGRATION ESTIMATES NORTHERN IRELAND (2013) STATISTICAL REPORT 9.30am Thursday 26 June 2014 Key Points Northern Ireland population at 30 June 2013 is estimated to be 1.830 million people.
POPULATION AND MIGRATION ESTIMATES NORTHERN IRELAND (2013) STATISTICAL REPORT 9.30am Thursday 26 June 2014 Key Points Northern Ireland population at 30 June 2013 is estimated to be 1.830 million people.
Migration indicators in Kent 2014
 Business Intelligence Statistical Bulletin September 2015 Migration indicators in Kent 2014 Related information The and Census web page contains more information which you may find useful. change presents
TEL AVIV STARTUP CITY. in numbers 2015 extended edition
 TEL AVIV STARTUP CITY in numbers 2015 extended edition Tel Aviv Startup City WELCOME TO TEL AVIV The Israeli hi-tech industry is renowned both within the country and abroad. The thriving industry serves
 A KOSHER DEGREE Higher Education in a Jewish Religious Environment Only in Israel Where can you find high standards in higher education combined with a religious environment? Where can you apply yourself
2. Incidence, prevalence and duration of breastfeeding
 2. Incidence, prevalence and duration of breastfeeding Key Findings Mothers in the UK are breastfeeding their babies for longer with one in three mothers still breastfeeding at six months in 2010 compared
The Non-English Speaking Population in Hawaii
 Data Report 2011 The Non-English Speaking Population in Hawaii Introduction The report examines social, economic and demographic characteristics of people in Hawaii who speak language other than English
THE DEMOGRAPHY OF POPULATION AGEING
 THE DEMOGRAPHY OF POPULATION AGEING Barry Mirkin and Mary Beth Weinberger* An inevitable consequence of the demographic transition and the shift to lower fertility and mortality has been the evolution
State of Israel. Regulating the Status of Bedouin Settlement in the Negev
 [Emblem] StateofIsrael RegulatingtheStatusofBedouinSettlementintheNegev SummaryoftheProcessofConsultationwiththePublic RegardingtheDraftLawfortheRegulationof BedouinSettlementintheNegevandRecommendationsRelatingtoPolicyand
Planting hope for future generations
 Planting hope for future generations The kibbutz is an original Israeli creation a multi-generational, rural settlement, characterized by its collective, community lifestyle, democratic management, responsibility
Capacity and Turnover in Public Accommodation Establishments in Hungary
 Capacity and Turnover in Public Accommodation Establishments in Hungary According to Act I of 1978 on domestic trade, in Hungary all establishments operated as a business for overnight accommodation and
SalarieS of chemists fall
 ACS news SalarieS of chemists fall Unemployment reaches new heights in 2009 as recession hits profession hard The economic recession has taken its toll on chemists. Despite holding up fairly well in previous
A Geographic Profile of. Chicago Lawn, Gage Park, West Elsdon and West Lawn. Neighborhoods Served by. The Southwest Organizing Project
 A Geographic Profile of Chicago Lawn, Gage Park, West Elsdon and West Lawn Neighborhoods Served by The Southwest Organizing Project The Southwest Organizing Project (SWOP) is a broad based community organization
The Wealth of Households: An Analysis of the 2013 Survey of Consumer Finances
 November 214 The Wealth of Households: An Analysis of the 213 Survey of Consumer Finances By David Rosnick and Dean Baker* Center for Economic and Policy Research 1611 Connecticut Ave. NW Suite 4 Washington,
Chapter II Coverage and Type of Health Insurance
 Chapter II Coverage and Type of Health Insurance The U.S. social security system is based mainly on the private sector; the state s responsibility is restricted to the care of the most vulnerable groups,
PEW RESEARCH CENTER SURVEY OF U.S. JEWS
 1 OVERVIEW American Jews overwhelmingly say they are proud to be Jewish and have a strong sense of belonging to the Jewish people, according to a major new survey by the Pew Research Center. But the survey
REPORT # 8. p' sm. THE GREATER PHOENIX JEWISH POPULATION PATTERNS OF MOBILITY. Bruce A. Phillips, PhD. William S. Aron, PhD
 REPORT # 8 p' sm. THE GREATER PHOENIX JEWISH POPULATION PATTERNS OF MOBILITY Bruce A. Phillips, PhD William S. Aron, PhD April 3, 1984 PATTERNS OF MOBILITY TABLE OF CONTENTS INTRODUCTION... PAGE 3 I. PROFILE
UK immigration policy outside the EU
 European Union: MW 371 Summary 1. This paper outlines a possible immigration system in the event of a British exit from the European Union. Some have claimed that a British exit would not affect net migration,
The recession of 2007 2009, a
 Employment outlook: Labor force projections to : a more slowly growing workforce The projected labor force growth over the next 10 years will be affected by the aging of the baby-boom generation; as a
World Population Growth
 3 World Population Growth Why is world population growing faster than ever before? Population dynamics are one of the key factors to consider when thinking about development. In the past years the world
Wealth and Demographics: Demographics by Wealth and Wealth by Demographics using the Survey of Consumer Finances. *** DRAFT March 11, 2013 ***
 Wealth and Demographics: Demographics by Wealth and Wealth by Demographics using the Survey of Consumer Finances *** DRAFT March 11, 2013 *** Jeff Thompson* Economist Microeconomic Surveys Federal Reserve
Children in Egypt 2014 A STATISTICAL DIGEST
 Children in Egypt 2014 A STATISTICAL DIGEST CHAPTER 1 DEMOGRAPHY Children in Egypt 2014 is a statistical digest produced by UNICEF Egypt to present updated and quality data on major dimensions of child
UNINSURED ADULTS IN MAINE, 2013 AND 2014: RATE STAYS STEADY AND BARRIERS TO HEALTH CARE CONTINUE
 UNINSURED ADULTS IN MAINE, 2013 AND 2014: RATE STAYS STEADY AND BARRIERS TO HEALTH CARE CONTINUE December 2015 Beginning in January 2014, the federal Patient Protection and Affordable Care Act (ACA) has
2. Germany. (a) Past trends
 Past trends") 2. Germany (a) Past trends While the total fertility rate increased steadily from 2.1 to 2.4 children per woman between 15-155 and 1-15, Germany experienced a continuous decline afterwards, to 1. children
2. Germany (a) Past trends While the total fertility rate increased steadily from 2.1 to 2.4 children per woman between 15-155 and 1-15, Germany experienced a continuous decline afterwards, to 1. children
CHAPTER ONE: DEMOGRAPHIC ELEMENT
 CHAPTER ONE: DEMOGRAPHIC ELEMENT INTRODUCTION One of the basic elements of this comprehensive plan is an analysis of the City of Beaufort s (the City) current and projected demographic makeup. The purpose
Profile of Black and Minority ethnic groups in the UK
 Profile of Black and Minority ethnic groups in the UK David Owen, University of Warwick Ethnic composition of the population in 2001 The 2001 Census of Population provides the most up-to-date and comprehensive
Ageing OECD Societies
 ISBN 978-92-64-04661-0 Trends Shaping Education OECD 2008 Chapter 1 Ageing OECD Societies FEWER CHILDREN LIVING LONGER CHANGING AGE STRUCTURES The notion of ageing societies covers a major set of trends
Differentials in Infant and Child Mortality Rates in Nigeria: Evidence from the Six Geopolitical Zones
 Differentials in Infant and Child Mortality Rates in Nigeria: Evidence from the Six Geopolitical Zones Aigbe, Gladys O., PhD Department of Geography and Planning Lagos State University, Ojo Lagos State,
PROFILE OF THE SINGAPORE CHINESE DIALECT GROUPS
 PROFILE OF THE SINGAPORE CHINESE DIALECT GROUPS by Edmond Lee Eu Fah Social Statistics Section Singapore Department of Statistics INTRODUCTION The Singapore society is made up of different ethnic groups
III. World Population Growth
 III. World Population Growth Population dynamics are one of the key factors to consider when thinking about development. In the past 50 years the world has experienced an unprecedented increase in population
Master Your Future MA Degree Studies in Israel
 Master Your Future MA Degree Studies in Israel המינהל לסטודנטים עולים Israel Student Authority Ministry of Immigrant Absorption GRADUATE IN YOUR PROFESSION ENHANCE YOUR ROOTS BROADEN YOUR EDUCATION IN
The Voting Patterns of the Settlers 2013 Knesset Elections
 The Voting Patterns of the Settlers 2013 Knesset Elections Peace Now, Settlement Watch Main Findings: The settler population constitutes 4.14% of the electorates in Israel, equaling 5 Members of Knesset
2011 Census: Key Results on Population, Ethnicity, Identity, Language, Religion, Health, Housing and Accommodation in Scotland - Release 2A
 Statistical Bulletin Coverage: Scotland Date: 26 September 2013 Geographical Area: Scotland, Council Area, Health Board Area Theme: Population and Household estimates 2011 Census: Key Results on Population,
IV. DEMOGRAPHIC PROFILE OF THE OLDER POPULATION
 World Population Ageing 195-25 IV. DEMOGRAPHIC PROFILE OF THE OLDER POPULATION A. AGE COMPOSITION Older populations themselves are ageing A notable aspect of the global ageing process is the progressive
Who are the Other ethnic groups?
 Article Who are the Other ethnic groups? Social and Welfare David Gardener Helen Connolly October 2005 Crown copyright Office for National Statistics 1 Drummond Gate London SW1V 2QQ Tel: 020 7533 9233
JAPAN. Past trends. Scenario I
 JAPAN Past trends The total fertility rate in Japan fell from 2.75 births per women in 195-1955 to 2.8 births in 1955-196. Total fertility remained at the near-replacement level between 196 and 1975, and
Forty years ago when the discovery of North Slope
 The Changing Economic Status of Alaska Natives, -2007 By Stephanie Martin and Alexandra Hill Note No. 5 July 2009 Forty years ago when the discovery of North Slope Figure 1. Economic Indicators, Alaska
The International Migrant Stock: A Global View. United Nations Population Division
 The International Migrant Stock: A Global View United Nations Population Division International migration is increasingly recognized as an important issue in the modern world where economic globalization
Immigrant fertility in West Germany: Socialization effect in transitions to second and third births?
 Immigrant fertility in West Germany: Socialization effect in transitions to second and third births? Nadja Milewski Institut national d études démographiques (INED), Paris Conference on Effects of Migration
Economic and Social Council
 United Nations Economic and Social Council Distr.: General 27 February 2014 ECE/CES/2014/43 Original: English Economic Commission for Europe Conference of European Statisticians Sixty-second plenary session
U.S. Population Projections: 2005 2050
 Report Monday, February 11, 2008 U.S. Population Projections: 2005 2050 Jeffrey S. Passel and D Vera Cohn Pew Research Center 1615 L Street, NW, Suite 700 Washington, DC 20036 5610 Phone: 202 419 3600
I. HEALTH ASSESSMENT B. SOCIOECONOMIC CHARACTERISTICS
 I. B. SOCIOECONOMIC CHARACTERISTICS 1. HOW FINANCIALLY SECURE ARE RESIDENTS OF DELAWARE? Delaware residents median household incomes are lower than comparison communities but higher than national norms.
Emergency Room Visits
 State of Israel Ministry of Health Health Information Division Emergency Room Visits Summary 2014 Ziona Haklai Jill Meron, Dr Yael Applebaum, Miriam Aburbeh, Gali Shlichkov E mergency R o om Visits, 201
Conference on Population and Development, Cairo, 5-13 September 1994 (United Nations publication, Sales No. E.95.XIII.7).
.") EXECUTIVE SUMMARY The General Assembly, in its resolution 54/262 of 25 May 2, decided to convene the Second World Assembly on Ageing in 22, coinciding with the twentieth anniversary of the first World
EXECUTIVE SUMMARY The General Assembly, in its resolution 54/262 of 25 May 2, decided to convene the Second World Assembly on Ageing in 22, coinciding with the twentieth anniversary of the first World
Ohio African Americans
 Ohio African Americans Ohio s African American community is comprised of nearly 1.6 million people, accounting for 13.7 percent of the state s total population. According to the 2013 American Community
The survey found a majority of both Israelis and Palestinians supported the peace plan that was presented to them: don t know/refuse
 245 East 92 nd Street 1 New York, NY 10128 Tel: (212) 534-4000 Fax: (212) 360 7423 Mark Douglas Schoen Michael EXECUTIVE SUMMARY We conducted a survey on behalf of the International Crisis Group and the
Maidstone is the largest district in Kent with a resident population of 155,143. This grew by 11.7% between 2001 and 2011.
 Census 2011 Briefing Ethnicity & National Identity The 1991 Census was the first census to include a question about ethnic background to monitor equal opportunities /anti-discrimination policies. Over
Chapter 3: Education of the Arab gifted child
 Chapter 3: Education of the Arab gifted child I. Introduction Education of the gifted in Israel is not a matter of professionals either in psychology of the gifted or didactics of the gifted in Hebrew
Race and Ethnicity. Racial and Ethnic Characteristics for Bellevue
 The Census contains a great deal of information that outlines the increasing level of diversity in our community. Among the demographic trends outlined in this section of the report will be race, ethnicity,
Demographic Trends in Israel
 Position Paper Demographic Trends in Israel Uzi Rebhun Gilad Malach Editor: Ruth Gavison The Metzilah Center for Zionist, Jewish, Liberal and Humanist Thought Jerusalem, 2009 Demographic Trends in Israel
ECONOMIC FACTORS AFFECTING COMPENSATION
 Unit 4: Total Rewards 41 ECONOMIC FACTORS AFFECTING COMPENSATION Inflation Inflation has a substantial impact on compensation practices. Managing a compensation program is especially difficult during periods
1. TRENDS IN INTERNATIONAL MIGRATION
 1. TRENDS IN INTERNATIONAL MIGRATION This chapter provides a brief overview of global and regional patterns and trends in international migration since 199. It also describes selected characteristics of
Ireland and the EU 1973-2003 Economic and Social Change
 Ireland and the EU 1973-2003 Economic and Social Change Table 1 Population, 1971-2002 viii Table 2 Population of the provinces ix Table 3 Births, deaths and life expectancy ix Table 4 Numbers in education
PEI Population Demographics and Labour Force Statistics
 PEI Population Demographics and Labour Force Statistics PEI Public Service Commission PEI Population Demographics and Labour Force Statistics Diversity Division PEI Public Service Commission November 2010.
Number, Timing, and Duration of Marriages and Divorces: 2009
 Number, Timing, and Duration of Marriages and Divorces: 2009 Household Economic Studies Issued May 2011 P70-125 INTRODUCTION Marriage and divorce are central to the study of living arrangements and family
labour market in the west bank briefing on first-half 2011
 labour market in the west bank briefing on first-half 2011 www.unrwa.org Labour Market in the West Bank A Briefing on First-Half 2011 December 2011 West Bank Labour Market A Briefing on First-Half 2011
Educational Attainment in the United States: 2015
 Educational Attainment in the United States: 215 Population Characteristics Current Population Reports By Camille L. Ryan and Kurt Bauman March 216 P2-578 This report provides a portrait of educational
Full-Time Poor and Low Income Workers: Demographic Characteristics and Trends in Health Insurance Coverage, 1996 97 to 2005 06
 MEPS Chartbook No. 18 Medical Expenditure Panel Survey Full-Time Poor and Low Income Workers: Demographic Characteristics and Trends in Health Insurance Coverage, 1996 97 to 2005 06 Agency for Healthcare
Global Demographic Trends and their Implications for Employment
 Global Demographic Trends and their Implications for Employment BACKGROUND RESEARCH PAPER David Lam and Murray Leibbrandt Submitted to the High Level Panel on the Post-2015 Development Agenda This paper
Population Size. 7.9% from a non-white ethnic group. Population: by ethnic group, April 2001
 Focus on Ethnicity and Identity paints a picture of the ethnic groups in the UK today. It includes information on their characteristics, lifestyles and experiences, placing particular emphasis on comparing
VOLUME 28, ARTICLE 17, PAGES 457-504 PUBLISHED 12 MARCH 2013 http://www.demographic-research.org/volumes/vol28/17/ DOI: 10.4054/DemRes.2013.28.
 DEMOGRAPHIC RESEARCH VOLUME 28, ARTICLE 17, PAGES 457-504 PUBLISHED 12 MARCH 2013 http://www.demographic-research.org/volumes/vol28/17/ DOI: 10.4054/DemRes.2013.28.17 Research Article Fertility and marriage
Immigrant Workers and the Minimum Wage in New York City
 Immigrant Workers and the Minimum Wage in New York City Prepared by the Fiscal Policy Institute for the New York Immigration Coalition Fiscal Policy Institute 275 Seventh Avenue, 6 th floor New York, NY
Projections of the Size and Composition of the U.S. Population: 2014 to 2060 Population Estimates and Projections
 Projections of the Size and Composition of the U.S. Population: to Population Estimates and Projections Current Population Reports By Sandra L. Colby and Jennifer M. Ortman Issued March 15 P25-1143 INTRODUCTION
FOCUS ON. People and Migration. The UK population: past, present and future. Chapter 1. Julie Jefferies
 FOCUS ON People and Migration The UK population: past, present and future Julie Jefferies Chapter 1 Chapter 1: The UK population: past, present and future Focus on People and Migration: 2005 Introduction
What Is the Total Public Spending on Education?
 What Is the Total Public Spending on Education? Indicator On average, OECD countries devote 12.9% of total public expenditure to, but values for individual countries range from less than 10% in the Czech
Higher Education in Israel - Selected Data for the Opening of the 2011/12 Academic Year
 PRESS RELEASE מדינת ישראל STATE OF ISRAEL www.cbs.gov.il info@cbs.gov.il Fax: 02-6521340 Jerusalem November 20, 2011 293/2011 Updated: 01/04/2012 Higher Education in Israel - Selected Data for the Opening
CONTENTS: bul BULGARIAN LABOUR MIGRATION, DESK RESEARCH, 2015
 215 2 CONTENTS: 1. METHODOLOGY... 3 a. Survey characteristics... 3 b. Purpose of the study... 3 c. Methodological notes... 3 2. DESK RESEARCH... 4 A. Bulgarian emigration tendencies and destinations...
A Project of the ASU College of Public Programs Debra Friedman, Dean
 GREATER PHOENIX FORWARD Sustaining and Enhancing the Human-Services Infrastructure This section provided as an excerpt of the larger publication available at copp.asu.edu A Project of the ASU College of
27 February 2014 Population
 Statistical Bulletin Migration Statistics Quarterly Report, February 2014 Coverage: UK Date: 27 February 2014 Geographical Area: UK Theme: Population Office for National Statistics 1 Migration Statistics
palestine refugees in the west bank socio-economic trends and long-term opportunities www.unrwa.org
 palestine refugees in the west bank socio-economic trends and long-term opportunities www.unrwa.org palestine refugees in the west bank socio-economic trends and long-term opportunities April 2011-1 -
Population and Household Census, Kingdom of Saudi Arabia 2010: Facts and Figures
 International Journal of Humanities and Social Science Vol. 3 No. 16 [Special Issue August 213] Population and Household Census, Kingdom of Saudi Arabia 21: Facts and Figures Asharaf Abdul Salam Center
National Insurance Fund - Long-term Financial Estimates
 Social Security Administration Act 1992 National Insurance Fund - Long-term Financial Estimates Report by the Government Actuary on the Quinquennial Review for the period ending 5 April 1995 under Section
Distribution of Population by Religions
 Drop-in-Article on Census - No.4 Distribution of Population by Religions Religious profile of the populace is an important socio-cultural and demographic feature noticeable from the first Census in 1872
Population Aging in Developed Countries: Emerging Trends and Dynamics Wan He, Ph.D. Population Division U.S. Census Bureau
 Population Aging in Developed Countries: Emerging Trends and Dynamics Wan He, Ph.D. Population Division U.S. Census Bureau This presentation is released to inform interested parties of population aging
What if York Region were a village of just
 What if York Region were a village of just 00 PEOPLE? York Region is a diverse global village, made up of many different types of people of various backgrounds and languages. York Region is also fast-growing.
Planning for the Schools of Tomorrow
 Planning for the Schools of Tomorrow School Enrollment Projections Series January 2014 Page Intentionally Left Blank School Enrollment Projection Series: School District ii Table of Contents Introduction...
PRESS RELEASE WORLD POPULATION TO EXCEED 9 BILLION BY 2050:
 PRESS RELEASE Embargoed until 12:00 PM, 11 March, 2009 WORLD POPULATION TO EXCEED 9 BILLION BY 2050: Developing Countries to Add 2.3 Billion Inhabitants with 1.1 Billion Aged Over 60 and 1.2 Billion of
A Sloan Work & Family Research Network Fact Sheet
 Questions and Answers about GENERATION X/GENERATION Y: Y A Sloan Work & Family Research Network Fact Sheet Introduction The Sloan Work and Family Research Network has prepared Fact Sheets that provide
Table of Contents. Florida Population Atlas 1
 Florida Population Atlas 1 Table of Contents About the Florida Population Atlas... 2 Explanation of Florida Population Characteristics and Trends..2-5 Figures & Maps... 6-30 Florida Population Characteristics
An extensive new survey by the Pew Forum on Religion
 An extensive new survey by the Pew Forum on Religion & Public Life details the religious affiliation of the American public and explores the shifts taking place in the U.S. religious landscape. Based on
NUMBERS, FACTS AND TRENDS SHAPING THE WORLD FOR RELEASE APRIL 7, 2015 FOR FURTHER INFORMATION ON THIS REPORT:
 NUMBERS, FACTS AND TRENDS SHAPING THE WORLD FOR RELEASE APRIL 7, 2015 FOR FURTHER INFORMATION ON THIS REPORT: Carroll Doherty, Director of Political Research Rachel Weisel, Communications Associate 202.419.4372
The ageing of the ethnic minority populations of England and Wales: findings from the 2011 census
 The ageing of the ethnic minority populations of England and Wales: findings from the 2011 census A briefing paper from the Centre for Policy on Ageing June 2013 The Centre for Policy on Ageing was set
Young Adults More Likely to Qualify for Special Enrollment
 Young Adults More Likely to Qualify for Special Enrollment HHS has announced that over 7.5 million Americans enrolled in Qualified Health Plans (QHPs) through the new health insurance marketplaces during
New York State Employment Trends
 New York State Employment Trends August 2015 Thomas P. DiNapoli New York State Comptroller Prepared by the Office of Budget and Policy Analysis Additional copies of this report may be obtained from: Office
Ohio Hispanic Americans
 Ohio Hispanic Americans Ohio s Hispanic community is comprised of more than 383,000 people, accounting for 3.3 percent of the state s total population. According to the 2013 American Community Survey by