An Overview of Environmental Conditions and Forecast Implications of the 3 May 1999 Tornado Outbreak
|
|
|
- Aleesha Bennett
- 7 years ago
- Views:
Transcription
1 682 WEATHER AND FORECASTING VOLUME 15 An Overview of Environmental Conditions and Forecast Implications of the 3 May 1999 Tornado Outbreak RICHARD L. THOMPSON AND ROGER EDWARDS Storm Prediction Center, Norman, Oklahoma (Manuscript received 4 January 2000, in final form 11 July 2000) ABSTRACT An overview of conditions associated with the Oklahoma Kansas tornado outbreak of 3 May 1999 is presented, with emphasis on the evolution of environmental and supercellular characteristics most relevant to the prediction of violent tornado episodes. This examination provides a unique perspective of the event by combining analyses of remote observational data and numerical guidance with direct observations of the event in the field by forecasters and other observers. The 3 May 1999 outbreak included two prolific supercells that produced several violent tornadoes, with ambient parameters comparable to those of past tornado outbreaks in the southern and central Great Plains. However, not all aspects leading to the evening of 3 May unambiguously favored a major tornado outbreak. The problems that faced operational forecasters at the Storm Prediction Center are discussed in the context of this outbreak, including environmental shear and instability, subtle processes contributing to convective initiation, the roles of preexisting boundaries, and storm-relative flow. This examination reveals several specific aspects where conceptual models are deficient and/or additional research is warranted. 1. Introduction During the late afternoon and evening hours of 3 May 1999, a violent tornado outbreak affected portions of central and northern Oklahoma, and southern Kansas. A total of 69 tornadoes were documented from the 10 tornadic supercells (Fig. 1a) that developed over the southern plains that afternoon and evening (National Climatic Data Center 1999). (Other tornado-producing thunderstorms occurred well after 0600 UTC 4 May 1999, but those events were not a direct continuation of the afternoon and evening outbreak and are not included here.) Long-lived, violent (F4 F5 damage) tornadoes occurred in the Oklahoma City, Oklahoma, and Wichita, Kansas, metropolitan areas, as well as in the small towns of Mulhall and Dover to the north and northwest of Oklahoma City. The number of strong and violent tornadoes on 3 May 1999 was comparable to that of 26 April 1991, the most recent major tornado outbreak to affect Oklahoma and Kansas. The environmental buoyancy and shear profiles on 3 May resembled those of several violent Oklahoma tornado events in the past two decades. However, the 3 May case presented several difficult forecast problems. Surface plots of observations from the Oklahoma Mesonet (Brock et al. 1995) showed that Corresponding author address: Richard L. Thompson, Storm Prediction Center, 1313 Halley Circle, Norman, OK thompson@spc.noaa.gov the initial supercell developed to the east of two weakly convergent drylines, and west of a subtle confluence axis located across southern and central Oklahoma. A thick cirrus overcast reduced heating and boundary layer mixing near and west of the drylines through much of the afternoon. High clouds are generally viewed as a hindrance to convective initiation during the warm season in the Great Plains. However, the initial supercell developed within a break in the thick cirrus overcast, where observed and model forecast soundings suggested that surface temperatures were sufficiently warm to minimize convective inhibition. Additionally, the evolution of the middle- and upper-tropospheric flow was not forecast well by the 0000 and 1200 UTC 3 May 1999 operational models prior to the outbreak. National Demonstration Profiler Network time series (locations mapped in Fig. 1b) revealed the progression of a welldefined jet streak 4 10 km above ground level from eastern New Mexico and western Texas during the late morning of 3 May to western and central Oklahoma that evening. The upper-tropospheric jet streak contributed to greater deep-layer vertical shear than forecast by the operational models, and may have been accompanied by weak large-scale ascent over western Oklahoma during the afternoon. The intent here is to document the environment and evolution of the 3 May 1999 tornado outbreak from the view of operational forecasters. Field observations by the authors, and other observers, augment the documentation of several tornadic supercells in the outbreak.

2 DECEMBER 2000 THOMPSON AND EDWARDS 683 FIG. 1. (a) Tornado map for the 3 May 1999 outbreak in OK and southern KS. Tornado paths are labeled with the letter of the parent supercell (chronological from A to K, with F not used due to potential confusion with the F scale), and the sequential number of the tornado with each supercell. The upper-left inset traces the radar-derived paths of the parent right-moving supercells in thick solid lines and leftmoving supercells in thin arrows, with life spans of each right-moving supercell noted in the table beneath. The lower-right inset summarizes tornado statistics by F-scale damage rating and lists known satellite and flanking line tornadoes. (Adapted from imagery and data provided by the National Weather Service, Norman, OK.) (b) Locations of profiler, rawinsonde, and WSR-88D sites that are discussed in the text. We believe this unique perspective offers the opportunity to describe the event from the synoptic scale down to the storm scale, and to focus attention on the difficulties faced by operational severe storm forecasters regarding convective initiation and morphology. It is hoped that concerns raised by this study can help focus future severe storm research, with the goal of benefiting operational convective outlooks, watches, and warnings. The evolution of the synoptic-scale environment is presented in section 2, with specific emphasis on the FIG. 2. Observed station model plots and contour analyses of geopotential heights (dam, solid) at 500 mb for (a) 1200 UTC 3 May 1999, and (b) 0000 UTC 4 May Station model plots show temperature ( C, upper left), geopotential height (dam, upper right), and plotted wind barbs (kt). distributions of moisture, instability, and vertical wind shear. Convective initiation and the morphologies of the individual tornadic supercells are addressed in section 3. Section 4 discusses typical and atypical aspects of the 3 May 1999 event, while section 5 summarizes the important aspects of this major regional tornado outbreak and directs attention to the most critical operational forecast concerns in its wake. 2. Synoptic environment evolution a. Moisture and instability A mean large-scale trough was located over the western United States at 1200 UTC 3 May (Fig. 2a), with an embedded short-wave trough over Arizona. The large-scale trough amplified over the Rockies by 0000 UTC 4 May, while the embedded short-wave trough

3 684 WEATHER AND FORECASTING VOLUME 15 FIG. 3. Conventional station model plots and surface analyses for 3 May 1999 at (a) 0000, (b) 1200, and (c) 2000 UTC. Surface boundary symbols follow standard conventions, isobars are drawn every 4 mb, and the region of 64 F dewpoints is shaded. A smaller-scale analysis of isotherms (every 4 F) and the 68 F isodrosotherm is shown in (d). Dryline boundaries are drawn on the warm side of each resolvable progressed from Arizona to western Oklahoma and Kansas (Figs. 2b and 6e). In association with this deepening midlevel trough and southwesterly flow over the southern and central Rockies, a deepening surface low was located over the central high plains, with low-level south-to-southeast flow in the warm sector over Kansas, Oklahoma, and Texas. A sequence of 3 May surface analyses and data plots that preceded the tornado outbreak is shown in Fig. 3. Surface dewpoints in the middle-to-upper 60 s F (18 20 C) spread northward from central Texas at 0000 UTC (Fig. 3a), to central Oklahoma by 1200 UTC (Fig. 3b), and southern Kansas by 2000 UTC (Fig. 3c). Figure 3d provides a mesoscale view of surface conditions at 2000 UTC in proximity to the initiation of storms A and B, roughly 30 min prior to the earliest deep convection that can be traced to storm A. Diffuse drylines were analyzed along the moist side of two moisture gradients resolvable in Oklahoma Mesonet data. The western boundary denoted what has been traditionally considered the dryline (e.g., Schaefer 1974; Doswell 1982). The moisture gradient across the eastern boundary was weaker than typically observed with a dryline [e.g., a dewpoint change of 10 F or more between observing stations, after Schaefer (1974)], though the small range of dewpoints (roughly F) between the two analyzed boundaries was supportive of two transition zones in the surface moisture field. The diffuse boundary structures in Fig. 3 apparently were less important than the fact that dewpoints had increased to the upper 60 s F ( 20 C) and surface temperatures had warmed to the middle 80 s F( 30 C) by 2000 UTC in extreme southwestern Oklahoma, which contributed to very large convective available potential energy (CAPE) values and weak convective inhibition (Fig. 4). The 1200 UTC Norman (OUN) sounding (Fig. 5, background) revealed a moist boundary layer about 1 km deep, beneath an elevated mixed layer located from about 825 to 600 mb. A special 1800 UTC sounding from OUN (not shown) revealed some deepening of the boundary layer from UTC, with 2 3 C warming between 700 and 500 mb. The 0000 UTC 4
.")
4 DECEMBER 2000 THOMPSON AND EDWARDS 685 FIG. 3.(Continued) zonal moisture gradient in the region of middle 50 s F or greater dewpoints. The letters A and B denote the genesis points of supercells A and B (refer to Fig. 1 and the text). May OUN sounding (Fig. 5, foreground) indicated substantial (2 4 C) warming from 600 mb to the surface during the previous 12 h, with the majority of the warming from 1800 to 0000 UTC confined to the mb layer. Boundary layer depth did not increase substantially after 1800 UTC, although the magnitude of boundary layer dewpoints did increase by about 2 C. Soundings from Fort Worth, Texas (FWD, not shown), revealed low-level warming and moistening similar to that observed at Norman. Both the 1800 and 0000 UTC OUN soundings, modified for surface conditions in proximity to the initial stages of storm A (temperature of 29.5 C and dewpoint of 20.5 C), yielded a mean boundary layer based CAPE 1 near 5000 J kg 1, with less than 10 J 1 CAPE values were calculated with the virtual temperature correction described by Doswell and Rasmussen (1994), based on the mean parcel in the lowest 100 mb. Convective inhibition used the nonvirtual lifted parcels, which resulted in larger inhibition values. kg 1 convective inhibition. These CAPE and convective inhibition values were in good agreement with shortterm model soundings for southwestern Oklahoma. The unmodified mean CAPE in the 0000 UTC OUN sounding was about 2200 J kg 1, with a convective inhibition near 100 J kg 1, although the truncated sounding did not allow a complete estimate of CAPE. The moist profile above 500 mb in the 0000 UTC sounding denoted rawinsonde penetration of the anvil of storm A while that storm was producing tornadoes about 25 mi (40km) to the west-southwest of Norman. b. Vertical shear As destabilization continued over the southern plains, an upper-tropospheric jet streak moved east-northeastward over Arizona and New Mexico from the mean trough position over the western United States. Although the magnitude of this jet streak was not well resolved in the 1200 UTC 3 May soundings, a much clearer indication of the strength of the speed maximum

5 686 WEATHER AND FORECASTING VOLUME 15 FIG. 4. Plan view of surface-based CAPE (J kg 1 ), convective inhibition (J kg 1 ), and 8-km profiler wind barbs (kt) at 2000 UTC 3 May The CAPE and convective inhibition fields were derived from an objective analysis of surface observations and a Rapid Update Cycle-2 model first-guess field, with temperature and moisture profiles above the surface provided by the 1-h forecast from 1900 UTC valid at 2000 UTC. was provided by several profilers during the day. Time height series of profiler winds at Tucumcari, New Mexico, from 1100 to 1600 UTC on 3 May (Fig. 6a), and later plots from Jayton, Texas (Fig. 6b), Haviland, Kansas (Fig. 6c), and Purcell, Oklahoma (Fig. 6d), generally showed kt strengthening of the flow in the km layer from midmorning over eastern New Mexico to late afternoon over western and central Oklahoma. Thereafter, the passage of a speed maximum in the km layer over western Oklahoma was shown clearly by decreasing wind speeds in the UTC 4 May profiler time series at Vici (Fig. 6e). The observed strengthening of the lower- and middle-tropospheric flow during the afternoon, generally below 8 km, indicated enhanced supercell potential based on simulations (e.g., Weisman and Klemp 1982; Wilhelmson and Klemp 1978). In conjunction with modest backing and strengthening low-level winds noted at Purcell, increasing middle- and upper-tropospheric winds resulted in sufficient deep-layered vertical shear for supercells by early afternoon in the warm sector [e.g., the shear term from the bulk Richardson number (BRN), after Weisman and Klemp (1982)]. The velocity azimuth display (VAD) wind profile from the Frederick, Oklahoma, Weather Surveillance Radar-1988 Doppler (WSR-88D) (Fig. 7a) revealed sufficient deep-layered vertical shear for supercells (e.g., BRN shear values around 55 m 2 s 2 ) near the time and location of convective initiation. The hodograph was relatively straight through approximately 4 km (Fig. 7a) and supported both left- and right-moving supercells based on observations and numerical simulations (i.e., Klemp and Wilhelmson 1978; Wilhelmson and Klemp 1978). Observed motions of the mature left and right splits associated with storm B (closer to Frederick than storm A) revealed 0 3-km storm-relative helicity (SRH) values of 120 m 2 s 2 for the right-mover, and 46 m 2 s 2 for the left-mover. Farther east at Purcell, the 0 6- km shear magnitude increased from about 25 m s 1 (48 kt) at both 1800 UTC (not shown) and 2300 UTC 3 May (Fig. 6d), to 30 m s 1 (57 kt) by 0200 UTC 4 May (Fig. 7b). BRN shear values also increased from 62, to 123, to 166 m 2 s 2 at Purcell at these same times, respectively. Hodographs derived from the Purcell winds yielded a dramatic increase in 0 3-km SRH values from roughly 80 m 2 s 2 at 1800 UTC to 338 m 2 s 2 by 2300 UTC (Fig. 6d). Calculated SRH values at 2300 UTC were based on the observed motion of storm A from 235 at 12 m s 1 (23 kt) and the surface wind from 140 at 8 m s 1 (15 kt) at Purcell. The SRH values from the Purcell profiler were also in close agreement with those calculated from the 0000 UTC Norman sounding (Fig. 5), and the VAD wind profile from the nearby Twin Lakes WSR-88D (Fig. 15). The hodographs assumed pronounced clockwise curvature, all of which strongly favored right-moving supercells. The large temporal variability in SRH during the late afternoon hours was similar to that noted in previous studies of tornadic supercell environments by Davies-Jones (1993) and Markowski et al. (1998, hereafter M98). After the increase from mid- to late afternoon, SRH values across central Oklahoma remained in the range of m 2 s 2 through the early evening for the observed right-moving supercell motions to the northeast at approximately 13 ms 1 (25 kt; Fig. 7b). 3. Convective initiation and storm-scale observations All supercells were preceded by the development of two short-lived convective towers over northwestern Texas. This convection formed under a relative gap in the cirrus canopy and between the surface drylines. The initial area of cumulus is shown in Fig. 8a, and the more substantial of these towers is noted in Fig. 8b. The cirrus gap shifted northeastward across southwestern Oklahoma, wherein additional towering cumulus formed southwest of Lawton around UTC (Fig. 8c). This convection rapidly evolved into a storm split and the first right-moving supercell, storm A in Fig. 1a. Storm B developed explosively within a small cluster of updrafts west of Altus around UTC (Fig. 8d), just west of the eastern dryline. Figure 8e shows storm A as it moved across the confluence boundary about 20 min prior to the first significant tornado of the outbreak, and as the right split of storm B developed mature supercell characteristics. These two storms were the most prolific tornado producers of the outbreak with a combined total of 35, including the F5
, and later plots from Jayton, Texas (Fig. 6b), Haviland, Kansas (Fig.")
6 DECEMBER 2000 THOMPSON AND EDWARDS 687 FIG. 5. Skew T diagram overlay of the OUN soundings from 1200 UTC 3 May 1999 and 0000 UTC 4 May The 0000 UTC sounding is in bold, while the 1200 UTC sounding is in gray in the background. Calculated parameters are for the 0000 UTC sounding. tornado that moved across the southern Oklahoma City metropolitan area and an F4 tornado that hit Abell and Mulhall. All mention of supercells hereafter refers to the right-moving storms of the 3 May 1999 outbreak. Other damaging tornadic supercells developed south and west of Oklahoma City around 0030 UTC. Storm D tracked from Purcell to Stroud (Fig. 1), resulting in F3 tornado damage in Stroud around 0330 UTC, while storm E produced a tornado with F4 damage in Dover at about 0230 UTC. Storm D appeared to form near the southeast northwest-oriented confluence line to the southwest of Purcell, while storm E formed near the intersection of the confluence line and the eastern dryline. Another supercell (storm K) produced a violent tornado on the south side of Wichita, Kansas, around 0130 UTC (Fig. 1). Supercell character and structure The central Oklahoma thunderstorms displayed the visual characteristics of classic supercells (e.g., Lemon and Doswell 1979): large, striated updrafts well-removed from the main precipitation core, rotating wall clouds with associated clear slots, and thin precipitation curtains wrapping around the west side of the low-level mesocyclones. Pictures of these storms (Fig. 9) clearly

7 688 WEATHER AND FORECASTING VOLUME 15 FIG. 6. National Profiler Demonstration Network time series of vertical wind profiles and resultant hodographs from (a) UTC 3 May at Tucumcari, NM; (b) UTC at Jayton, TX; (c) UTC at Haviland, KS; (d) UTC at Purcell, OK; and (e) UTC 4 May at Vici, OK. Plotted wind barbs are in kt, with time increasing from right to left, and each hodograph is for the latest time in each plot. The heights above ground level of each 3-km-deep layer are labeled along the hodographs. Note that data were unavailable from 2000 to 2100 UTC.

8 DECEMBER 2000 THOMPSON AND EDWARDS 689 FIG. 7. Vertical wind profiles and hodographs from (a) the velocity azimuth display wind profile from the Frederick, OK, WSR-88D at 2042 UTC 3 May, and (b) the profiler time series at Purcell for 0200 UTC 4 May (conventions are the same as in Fig. 6). illustrate the classic supercell storm structures. Storm A and storm B each had laminar cloud structures in the low levels, which indicated forced ascent of parcels through the layer of convective inhibition over central Oklahoma noted in the unmodified 0000 UTC 4 May OUN sounding (northeast of where storms A and B developed). Storms A and B each were tornadic periodically for 4 6 h. Each appeared to reach a state of balance with its environment, during which it was neither detrimentally outflow-dominant nor deficient. Visual observations, video, and photographs of the Oklahoma tornadic supercells by the authors and others, along with radar reflectivity and velocity signatures, indicated they maintained classic (CL) precipitation distributions about the updraft and forward-flank regions once each storm evolved to its tornadic phase. Indeed, storm-relative winds of 21 m s 1 in the 9 11-km layer were supportive of classic supercells (see Fig. 6d), in agreement with the findings of Rasmussen and Straka (1998). During the first h of storms A, E, and G, and the first 2.0 h of storm B, the storms exhibited visually skeletal cloud structures, which observers often associate with low-precipitation supercells, but radar imagery actually revealed CL precipitation patterns. Figure 9 shows visual and radar 0.5 elevation reflectivity aspects of the supercells discussed. Storms A and B each were characterized through the majority of their existence by horizontally enlarging and lowering updraft bases with time, and several episodes of multiple tornadoes within a single mesocyclone. Characteristic of many tornadic supercells (Lemon and Doswell 1979), relatively low cloud bases in the regions of strongest apparent low-level rotation and clear slots wrapping cyclonically around the wall clouds were observed almost constantly in storms A and B between the initial tornadic stages and darkness (about 3 h). Cloud-base heights appeared to lower as each storm passed northeastward over progressively smaller surface dewpoint depressions shown in mesonet data. Similar trends in lifted condensation level (LCL) evolution were found when using surface observations to modify 1800 UTC 3 May and 0000 UTC 4 May observed OUN soundings (Fig. 5), and soundings derived from gridded Rapid Update Cycle-2 model output (not shown). The largest and most damaging tornadoes occurred after the lowering of the LCLs from roughly 1300 m at 2000 UTC where storm A developed in southwestern Oklahoma, to less than 500 m in the Oklahoma City area by 0000 UTC. The region of lower LCLs also coincided with the region of largest SRH east of the subtle confluence boundary in Oklahoma. This conforms to the findings of Rasmussen and Blanchard (1998), whose database of significant tornadic supercells (F2 or greater damage) had lower LCLs in aggregate than either other supercells or nonsupercell thunderstorms. This also conforms to the trend toward increasing tornado threat as SRH increases, as noted by Davies- Jones (1993). Structures of the other supercells were generally consistent with the observations of storms A and B, though darkness limited visibility of storm structures to those illuminated by lightning, and most observers were concentrated in proximity to the initial supercells. 4. Discussion a. Buoyancy and vertical shear profiles Some aspects of the evolution of the troposphere followed a typical sequence of events preceding a severe

9 690 WEATHER AND FORECASTING VOLUME 15 FIG. 8. Series of GOES-8 1-km visible satellite images and associated surface station data plots for (a) 1902, (b) 2002, (c) 2045, (d) 2132, and (e) 2202 UTC. Annotations denote the cloud features discussed in the text, with the surface dryline position(s) marked by the open

10 DECEMBER 2000 THOMPSON AND EDWARDS 691 and 23 May In each event, the sounding site was uncontaminated in the low levels by convective outflow, although thermal lapse rates on the 3 May sounding decreased as the radiosonde entered the anvil of storm A at the 551-mb pressure level. Each sounding showed a deep layer of strong positive buoyancy (not shown), and the hodograph structures were remarkably similar in the lowest 3 km. Interestingly, each of the hodographs displayed a pronounced kink within the km above ground level (AGL) layer, where a combination of weak veering with height and strong speed shear suddenly changed to strong veering with little speed change. This feature enhances storm-relative inflow in the boundary layer, and may be related to low-level mesocyclone intensity and associated tornado potential based on the results of model simulations by Wicker (1996). FIG. 8.(Continued) scalloped lines, and a subtle confluence zone across southern Oklahoma marked by a dashed line. Plotted mesonet observations are within 2 min of each respective satellite image, while standard surface observations are from within the hour before each image. thunderstorm outbreak: steep midlevel lapse rates overspread the area, boundary layer moisture increased, and daytime heating further increased instability. In these regards, 3 May 1999 resembled a synoptically evident severe weather episode as originally defined by Doswell et al. (1993). However, anticipation of a major tornado outbreak was hindered by poor operational model forecasts of wind speeds in the middle and upper troposphere, and associated vertical shear parameters, over portions of the West Coast and southern plains (Fig. 10). Large-scale pattern recognition, based on numerical model forecasts, did not necessarily suggest a major tornado outbreak would ensue the evening of 3 May The perceived problems with the pattern were derived from operational model forecasts of, at best, modest vertical wind shear (Fig. 11a), and surface analyses that did not provide a clear focus for convective initiation. However, the combinations of large buoyancy (in observations and model forecasts), and vertical shear parameters derived from regional profiler data and soundings during the afternoon and evening of 3 May (Fig. 11b), were consistent with other historical tornado outbreaks. To further illustrate this point, 0000 UTC hodographs for OUN and OKC are compared in Fig. 12 for four violent tornado events in central and northern Oklahoma: 4 May 1999, 27 April 1991, 27 April 1984, b. Convective initiation and low-level boundaries Surface analyses revealed a dryline on the mesoalpha to synoptic scales, which appeared to be a diffuse double-dryline structure in finer-scale analyses over northwestern Texas and western Oklahoma by midafternoon on 3 May 1999 (Fig. 3). A deep surface low existed well to the northwest of Oklahoma. However, surface convergence along each 3 May dryline was ill-defined, and the moisture gradient was not particularly large across either dryline. Ziegler and Hane (1993) suggested that boundary layer convergence is critical for maintaining a pronounced moisture gradient across a dryline, as well as for thunderstorm initiation along it. In fact, the initial supercell developed about 50 km east of the easternmost surface dryline position (Figs. 3d and 8c). Also, a large plume of cirrus developed in the lee of the Rockies over eastern New Mexico by midmorning on 3 May. The cirrus overspread much of the Texas Panhandle and western Oklahoma by early afternoon (Fig. 8a), and raised questions about continued heating and mixing in the boundary layer through midafternoon. Small temperature decreases and dewpoint increases across the central and southern Texas Panhandle from 2000 to 2200 UTC (Figs. 8b and 8e), combined with small temperature increases and dewpoint decreases farther north in the Oklahoma Panhandle, indicated shadowing and weaker vertical mixing under the dense high cloud canopy across the Texas Panhandle. The widespread high clouds and lack of convergence in the dryline regions introduced considerable uncertainty regarding the timing and location of convective initiation. However, the gap in the cirrus appeared to be crucial in allowing continued surface heating and mixing to maintain weak enough capping for the initiation of both short-lived cumulonimbi in northwestern Texas and long-lived storms A and B in southwestern Oklahoma. The 0000 UTC OUN sounding, modified for surface mesonet observations in southwestern Oklahoma, showed little convective inhibition and a level of free

11 692 WEATHER AND FORECASTING VOLUME 15
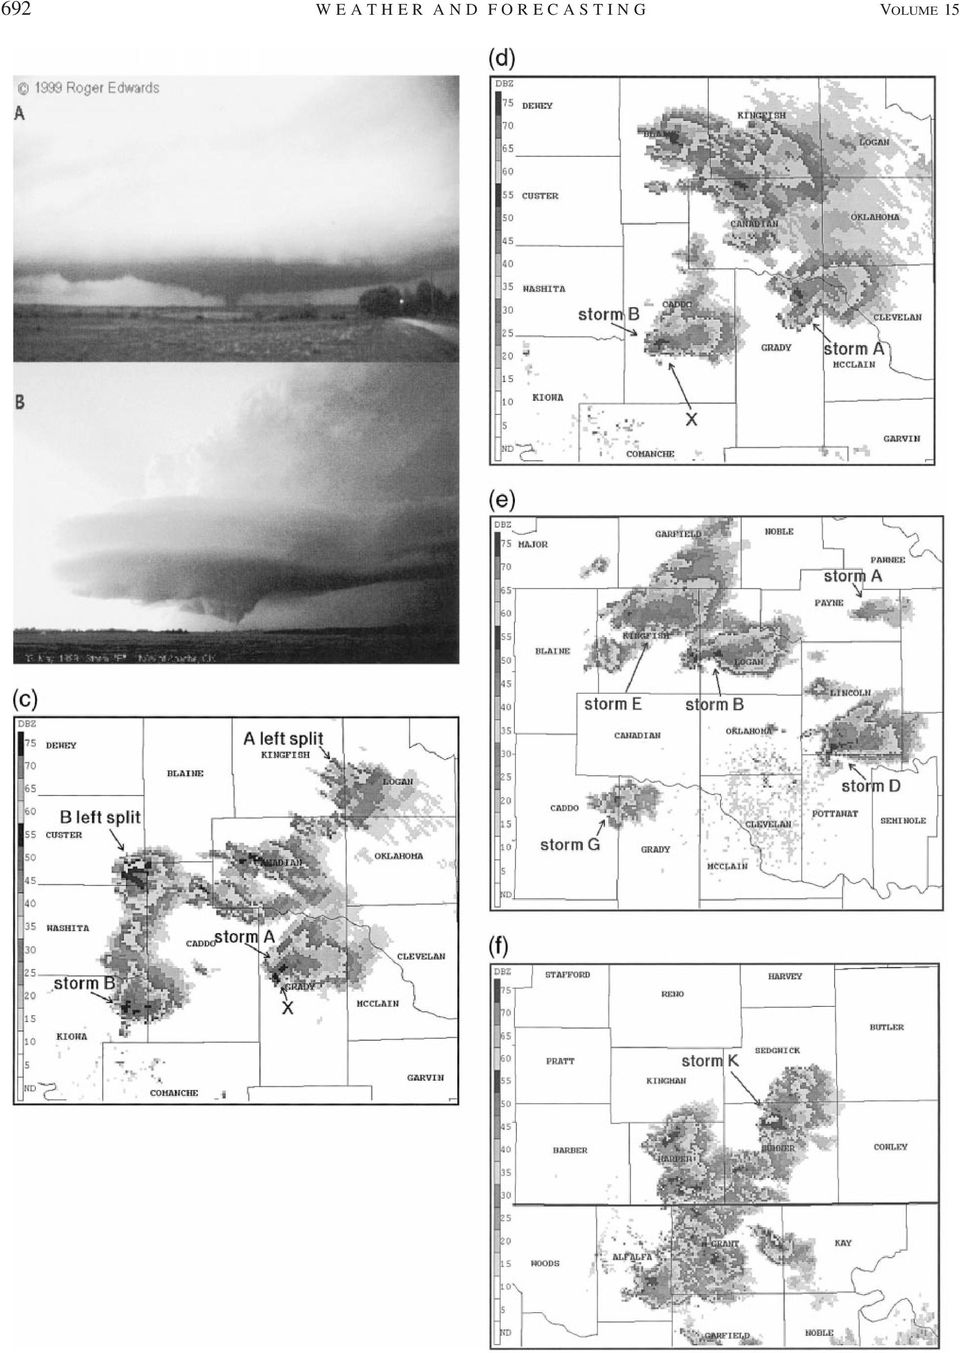
12 DECEMBER 2000 THOMPSON AND EDWARDS 693 convection (LFC) within 2 km of the ground. This thermodynamic profile suggested that relatively weak mesoscale lift may have been sufficient to initiate deep convection. Forecast fields from the operational Eta Model runs at 1200 and 1800 UTC 3 May showed divergence in the mb layer and weak quasigeostrophic forcing for ascent over western Oklahoma from 500 to 300 mb between 1800 UTC 3 May and 0000 UTC 4 May. The model also suggested weak ascent from 850 to 700 mb, although ascent over western and central Oklahoma may have been offset by the warming noted in this layer from UTC at OUN. Upper-tropospheric divergence and possible weak inertial instability in the upper troposphere (Fig. 13) may have also contributed to a favorable environment for strong storm-top divergence and sustained updrafts, perhaps similar to the arguments presented by Blanchard et al. (1998). On a smaller scale, storm A appears to have formed near the updraft portion of a large horizontal convective roll (HCR) in the boundary layer. Though no cloud streets were observed in 1-km visible satellite imagery, the apparent HCR was denoted by a meridional band in 1.5 elevation base reflectivity data from the Frederick radar site; the radar site was located about 25 km west of where storm A began (Fig. 14). The fine line was oriented parallel to the boundary layer flow, and Wilson et al. (1994) have established coincidence between convective boundary layer updrafts and reflectivity fine lines in clear air mode. This feature conformed to radar and shear-based characteristics for HCRs established by Weckwerth et al. (1997), who also found that HCRs are sometimes not apparent as visible cloud streets. The depth of the feature ( m above ground level) appeared to be within a few hundred meters of the LFC height derived from modified soundings (roughly 1700 m above ground level); therefore, an HCR updraft was a potential mechanism for convective initiation. While such a mode of thunderstorm formation may be common, the presence and depth of HCRs are difficult to anticipate and detect in an operational setting. Forecasts for convective initiation will necessarily have large uncertainty when HCRs or other subtle boundary layer processes dominate, given the sensitivity of moist convection to temperature and moisture in the boundary layer (e.g., Crook 1996). Finally, visible satellite imagery revealed a series of billow clouds oriented meridionally over northern Texas and south-central Oklahoma (Fig. 8a), to the east of where storms A and B developed. These clouds were associated with a relatively shallow, capped boundary layer with backed surface winds compared to northwestern Texas and southwestern Oklahoma. As the southwestern Oklahoma storms approached central Oklahoma, they encountered the confluent zone and associated backed surface winds, which yielded 0 3-km SRH values of m 2 s 2 (Figs. 6d and 7b). Both storms A and B produced brief tornadoes near and west of the subtle confluence boundary, but tornadoes became more numerous and progressively more intense as the storms moved through the region of increased SRH and lower LCL heights to its east. The air mass in this region, which coincided with the location of the billows prior to being obscured by high clouds, still contained surface-based CAPE values in excess of 3000 J kg 1. However, the longevity of the storms after 0000 UTC was in question operationally because of the stronger cap well east of the confluence boundary. Indeed, storm A ceased producing tornadoes by 0130 UTC (less than an hour after devastating the southern Oklahoma City area), and dissipated shortly after 0200 UTC (see Fig. 9e). To complicate matters further, storm D reached peak intensity only 30 mi south of where storm A dissipated. These observations underscored the difficulties faced by forecasters in anticipating storm longevity and tornado production in an evolving environment with subtle, but important, variations. The tendency of storms A and B to produce significant tornadoes after crossing the surface boundary appears to be consistent with the observations of M98, although the confluence boundary in this case was subtle, even in the relatively dense Oklahoma Mesonet surface observations. Another storm-boundary interaction occurred farther north, when the Wichita supercell (storm K) crossed a boundary marked by a westwardmoving band in 0.5 elevation reflectivity data, thereafter producing a violent tornado. c. Variations from classic supercell structures At least two possible cases of destructive storm interference were observed during the tornado outbreak, namely with storms D and K. The Wichita supercell (storm K) weakened substantially after being overtaken by a large area of thunderstorms from the southwest, while the Purcell Stroud supercell (storm D) also was structurally altered by convection that formed and merged with the supercell from the southwest. Trends FIG. 9. Visual appearance of the updraft regions of (a) supercell A as viewed from approximately 6 mi to the south-southeast (image copyright 1999 R. Edwards), and (b) supercell B as viewed from approximately 10 mi to the south-southeast (image copyright 1999 C. Eads). The corresponding 0.5 elevation Frederick radar reflectivity images nearest to photo times are shown for (c) supercell A at 2307 UTC 3 May (amidst an outage of the closer Twin Lakes radar), and (d) supercell B at 2337 UTC 3 May. The photographers locations are marked by s in each image, with an arrow denoting direction of view. (e) The 0.5 reflectivity image from the Twin Lakes radar of supercells A, B, D, E, and G at 0217 UTC 4 May, and (f) the 0.5 reflectivity view of supercell K from the Vance Air Force Base radar at 0054 UTC 4 May. Counties are labeled on the background map. Refer to Fig. 1 for storm lettering conventions.

13 694 WEATHER AND FORECASTING VOLUME 15 FIG. 10. Overlays of the Eta Model forecasts of isotachs (kt) and geopotential heights (dam) valid at 0000 UTC 4 May 1999 for (a) 24 h, 300 mb; (b) 12 h, 300 mb; (c) 24 h, 500 mb; and (d) 12 h, 500 mb. The 24-h forecast was from the 0000 UTC 3 May Eta Model run, and the 12-h forecast was from the 1200 UTC 3 May Eta Model run. Shading denotes areas of 30 kt or greater wind speeds, with additional gradations noted at 50, 70, 90, and 110 kt (see scale in lower-left corner and labels within the figure). Each large marks the location of a relative speed maximum. Verifying rawinsonde and profiler wind barbs (kt) from 0000 UTC 4 May are plotted on each image. in radar imagery suggested that storm D evolved in a manner quite similar to the other violent tornadic supercells in central Oklahoma until the disruption of its classic structure by the merging precipitation areas. In addition, not all wind profile parameters were strongly supportive of classic supercells with major tornadoes. A model-forecast weakness in storm-relative winds in the middle troposphere was seen as a potential limiting factor for significant tornadoes at the onset of the outbreak. It has been suggested by Brooks et al. (1994) and Thompson (1998) that weak storm-relative winds in the middle troposphere can lead to excessive cold outflow generation in the rear-flank region of a supercell. This cold outflow can then undercut the mid-
.")
14 DECEMBER 2000 THOMPSON AND EDWARDS 695 increased from 8 to 17 m s 1 (about kt) by 0200 UTC (Fig. 7b). Storm-relative winds derived from the Twin Lakes WSR-88D VAD wind profile, located about 15 mi north-northeast of the Purcell profiler, also were similar to those from Purcell. The severity of the 3 May tornado outbreak tended to increase in conjunction with increasing midtropospheric storm-relative flow at the Purcell profiler site from 2300 to 0200 UTC, and as multiple supercells encountered the region of enhanced SRH to the northeast of the subtle confluence boundary. Interestingly, the wind profiles from the Purcell profiler, the Norman sounding, and the Twin Lakes radar site all conformed to common proximity standards for storm A (e.g., Darkow 1969; Brooks et al. 1994). However, storm A was located 25 mi (40 km) or more to the west of these sites until about 2330 UTC and, therefore, somewhat closer spatially to the intensifying flow fields observed at Tucumcari and Jayton earlier in the day. A dramatic short-term increase in vertical wind shear and storm-relative winds also was indicated by the Twin Lakes WSR-88D VAD wind profile from 2348 UTC 3 May to 0018 UTC 4 May (Fig. 15), as storm A approached and passed only 10 km northwest of the radar site. This observation supports simulations by Weisman et al. (1998), which yielded 0 6-km shear perturbations of8ms 1 (about 15 kt) or more extending nearly 30 km ahead of a supercell for hodographs comparable to those observed in central Oklahoma. The general increase in wind speeds and vertical shear during the period UTC, as well as the potential influence of storm A on the Twin Lakes VAD wind profile, suggest that there may not have been a single wind profile that correctly characterized the environment of storm A. FIG. 11. (a) Eta 24-h forecast hodograph valid at 0000 UTC 4 May for Norman, and (b) the verifying profiler hodograph from nearby Purcell at 0000 UTC 4 May. (Note that the Purcell profiler provided a more complete wind profile than the truncated 0000 UTC Norman sounding.) level mesocyclone prior to the formation of significant tornadoes, if not balanced by sufficiently strong storm inflow. Both the Purcell profiler at 2300 UTC 3 May and the Norman sounding at 0000 UTC 4 May revealed storm-relative winds in the 4 6-km layer that appeared to be marginal for sustained supercells with significant tornadoes (after Thompson 1998). However, actual wind speeds in the 3 6-km layer increased from 17 to 25 m s 1 (about kt) between UTC at Purcell, and corresponding 4 6-km storm-relative winds 5. Summary and implications The 3 May 1999 event in Oklahoma showed some general large-scale characteristics of historical severe thunderstorm outbreaks in the southern and central plains. A mean trough was located over the Four Corners area with a deep high plains surface low and an unstable warm sector. An embedded mid- to upper-tropospheric jet streak moved east-northeastward from the mean trough during the afternoon of the outbreak. However, the embedded jet streak was not resolved well by the operational models prior to the outbreak, and surface convergence in proximity to the drylines was ill-defined through the afternoon. Additionally, a large area of high clouds overspread the drylines and warm sector during the afternoon, which complicated forecasts of convective initiation. There are several important points to be learned from the 3 May outbreak. First, this event illustrates that outbreaks of strong and violent tornadoes are not necessarily associated with what many operational forecasters would consider to be the most evident large-scale patterns in numerical model output. While the potential for a severe weather episode was anticipated by Storm Pre-

15 696 WEATHER AND FORECASTING VOLUME 15 FIG. 12. Hodographs during four central or northern Oklahoma tornado outbreaks that contained at least one violent (F4 or F5 damage) tornado, derived from these 0000 UTC soundings: (a) Norman, 4 May 1999; (b) Norman, 27 Apr 1991; (c) Oklahoma City, 23 May 1981; and (d) Oklahoma City, 27 Apr The local standard time date of each outbreak is in parentheses, and labeling conventions are the same as in Fig. 6. diction Center forecasters a day in advance, a major tornado outbreak was not forecast initially for 3 May Much of the difficulty in anticipating the magnitude of the tornado threat h in advance was the result of poor numerical model forecasts of mid- and upper-tropospheric flow, and associated deep-layered vertical shear. However, observational data suggested a substantially greater and increasing threat of supercells with significant tornadoes, based on parameters derived from surface analyses and profiler data from midmorning to early evening on 3 May Previous May June events in the plains with strong and violent tornadoes have been characterized by large CAPE values ( J kg 1 ) and sufficient vertical shear for supercells (e.g., 0 6-km shear magnitudes in excess of 20 ms 1, BRN shear greater than 40 m 2 s 2, and 0 3-km SRH values of m 2 s 2 ), based on standard observations. The truncated 0000 UTC 4 May OUN sounding yielded 0 2-km SRH and lowest 100-mb mean CAPE values that fell well within the distributions presented by Johns et al. (1993) for other strong and violent tornadoes. So did the same parameters derived from soundings modified to represent (to the best of observational ability) near-storm conditions less than an hour prior to the formation of the initial supercell in the 3 May outbreak (Fig. 16). Between its development and violent tornado production, storm A appeared to shift markedly from the high-cape and low-shear extreme of the Johns et al. (1993) diagram toward the midrange of the parameter space (Fig. 16). Also, the kinematic observations in central Oklahoma from UTC suggested that storm characteristics may not always be predictable, especially when the mesoscale storm environment is changing with time. This problem is compounded when a storm simultaneously affects nearby observations as evident in the Twin Lakes VAD wind profile data just after 0000 UTC (Fig. 15), that is, when the storm s influence may be superimposed on changes in the background wind profile. This illustrates the need for operational forecasters and researchers alike to consider the CAPE shear parameter space for any given thunderstorm as fluid with respect to time, not static. The concept of significant, deep tropospheric environmental evolution throughout an individual storm s lifetime should become a fundamental inclusion in storm-scale numerical modeling studies of supercells. When forecasting a threat of tornadoes, the mode of convective initiation and the number and spacing of supercells that form are critical to the number of tornadoes expected. In the same mesoscale region, several supercells may develop in association with different forms of boundaries. These boundaries vary in detectability when using conventional data sources, and storms may form where there are no apparent boundaries. The initial storms in the 3 May 1999 outbreak evolved into tornadic supercells that each lasted several hours, with no early transition to a squall line or other convective mode. Storm spacing and motions were such that the supercells remained in an environment of favorable vertical shear and instability for several hours without numerous storm collisions, thus allowing the supercells to produce a large number of tornadoes. The predominance of a supercell convective mode and lack of a squall line on 3 May 1999 may have been attributable to the lack of strong low-level convergence

16 DECEMBER 2000 THOMPSON AND EDWARDS 697 FIG. 14. Filtered clear air mode radar reflectivity data (dbz) at the 1.5 elevation angle from Frederick at 2012 UTC 3 May The annotation identifies the reflectivity signature of a possible HCR immediately east of the radar site. Reflectivity values less than 0 dbz have been removed for clarity. FIG. 13. Eta Model initial analyses of 300-mb geopotential height (dam), divergence (solid lines s 1, dashed lines represent convergence), and negative absolute geostrophic vorticity (shaded area, with gradations at 0, s 1, s 1, and s 1 ) at (a) 1800 UTC 3 May 1999, and (b) 0000 UTC 4 May The shaded areas of negative absolute geostrophic vorticity represent areas of inertial instability. (Courtesy of D. Schultz, National Severe Storms Laboratory.) near the dryline(s). It is conceivable that the outbreak would not have materialized in such intense or prolific form had the convergence been stronger along a consolidated dryline, and had numerous storms formed simultaneously and merged into a larger-scale convective system in the weakly capped environment over northwestern Texas and western Oklahoma during the afternoon. However, on forecast times greater than mesoscale, that same lack of convergence in the area of drylines suggested that supercells might not develop at all, consistent with the ideas of Ziegler and Hane (1993). This presented a major forecasting challenge in two ways: 1) narrowing the spatial threat for supercell concentration on the synoptic timescale (roughly 12 h or more), and 2) diagnosing and nowcasting subtle mesoscale features not associated with distinct thermodynamic discontinuities (such as fronts, singular drylines, outflow boundaries, etc.). In this case, subtle clues/precursors to storm initiation were present primarily in high-resolution visible satellite imagery (e.g., the cumulus towers beneath the cirrus hole) and nearby WSR-88D data (e.g., the possible HCR). The complex dryline, confluence zone, and HCR structures identified during this event each demonstrate the importance of high-resolution, lower-tropospheric observational data to the real-time diagnosis of subtle boundaries and their subsequent effects on storm initiation and organization. As illustrated in our analyses FIG. 15. Time series from the Twin Lakes WSR-88D VAD wind profile from the period 2348 UTC 3 May to 0018 UTC 4 May showing the increase in midlevel wind speeds as storm A moved approximately 10 km northwest of the radar site.
 at (a) 1800 UTC 3 May 1999, and (b) 0000 UTC 4 May 1999.")
17 698 WEATHER AND FORECASTING VOLUME 15 FIG. 16. Scatterplot of lowest 100-mb mean-parcel CAPE (abscissa) vs 0 2-km SRH (ordinate) for the dataset of 242 significant (F2 damage or greater) tornadic supercells collected by Johns et al. (1993). Locations of various estimates of CAPE and 0 2-km SRH from 3 to 4 May 1999 are overlain for comparison, using (a) unmodified (truncated, with incomplete CAPE) 0000 UTC OUN sounding, (b) 0000 UTC OUN sounding with 1800 UTC thermal profile attached above truncation, and (c) 1800 UTC OUN sounding modified using these input conditions as an idealized estimate of proximity conditions to the genesis point of storm A: 2100 UTC Tillman County mesonet wind, temperature, and dewpoint; and Frederick velocity azimuth display winds between surface and 2 km AGL. and in another complex dryline case (Brooks et al. 1995), output from observing systems of coarser spacing, including the conventional network of surface reporting stations, may be insufficient to resolve such features. Even in the presence of mesoscale surface observations, forecasters also may need to rely on careful interpretation of available satellite and radar imagery to recognize small areas where convective initiation is possible. A majority of significant tornadoes during the 1995 version of the Verification of the Origins of Rotation in Tornadoes Experiment occurred in association with surface boundaries (M98). Furthermore, recent numerical simulations indicated strong relationships between mesocyclone intensity and longevity, and the baroclinic strength and orientation of low-level boundaries (Atkins et al. 1999). However, low-level baroclinic boundaries were either ill-defined or not present during the 3 May outbreak. This illustrates that the apparent weakness or absence of such boundaries in the warm sector does not preclude significant tornadoes, given the initiation of supercells in an otherwise highly favorable environment characterized by large CAPE, strong deep-layered vertical shear (e.g., 0 6-km shear or BRN shear), and strong low-level shear (e.g., 0 3-km SRH). Still, the roles of a wide variety of preexisting boundaries in convective initiation and tornadogenesis, including weakly convergent drylines, HCRs, confluence axes, and various reflectivity patterns not evident in surface and satellite data, warrant much additional attention. Observations suggested that subtle boundaries were important to the initiation and evolution of several tornadic supercells in the 3 May outbreak, and it remains crucial for forecasters to monitor high-resolution data (namely WSR- 88D, satellite, and profiler) to anticipate local areas of enhanced or diminished tornado threat. Operational forecasts of supercell types and tornado potential will continue to be difficult for the foreseeable future, especially when the processes responsible for creating favorable supercell tornado environments occur on the mesoscale, or even storm scale. Profiler and radar-derived wind data each greatly aid the shortterm forecast process by providing time sampling between synoptic rawinsonde launches. However, many supercell-type and tornado forecast parameters are sensitive to small changes (2 5 m s 1 ) in wind vectors and storm motion, which lends these parameters to misinterpretation. Still, the more general combinations of CAPE and vertical shear clearly supported tornadic supercells by the late afternoon and evening of 3 May This suggests that the background environment, as opposed to just storm-scale variations, can be a dominant controlling factor in regional tornado outbreaks. Acknowledgments. The authors are grateful to many colleagues at SPC for insights offered during discussions of this tornado outbreak, and for their internal reviews of this work. The careful and thought-provoking comments from two anonymous reviewers resulted in valuable additions to the manuscript. This work also benefited from discussions with Chuck Doswell, Erik Rasmussen, and Dave Schultz (NSSL); Jim LaDue (OSF); and Dan Miller (NWS Norman). Mike Vescio (SPC) assisted with Fig. 9, Dave Schultz created Fig. 13, and Bob Johns provided most of Fig. 16. We appreciate the photographic documentation of many storm observers whose imagery greatly aided our assessment of supercell character and morphology. Finally, we commend the Science Support Branch of the SPC for providing easy access to the 3 May data archive. REFERENCES Atkins, N. T., M. L. Weisman, and L. J. Wicker, 1999: The influence of preexisting boundaries on supercell evolution. Mon. Wea. Rev., 127, Blanchard, D. O., W. R. Cotton, and J. M. Brown, 1998: Mesoscale circulation growth under conditions of weak inertial instability. Mon. Wea. Rev., 126, Brock, F. V., K. C. Crawford, R. L. Elliott, G. W. Cuperus, S. J. Stadler, H. L. Johnson, and M. D. Eilts, 1995: The Oklahoma Mesonet: A technical overview. J. Atmos. Oceanic Technol., 12, Brooks, H. E., C. A. Doswell III, and J. Cooper, 1994: On the en-
 1800 UTC OUN sounding modified using these input conditions as an idealized estimate of proximity conditions to the genesis")
18 DECEMBER 2000 THOMPSON AND EDWARDS 699 vironments of tornadic and nontornadic mesocyclones. Wea. Forecasting, 9, ,, E. N. Rasmussen, and S. Lasher-Trapp, 1995: Detailed observations of complex dryline structure in Oklahoma on 14 April Preprints, 14th Conf. on Weather Analysis and Forecasting, Dallas, TX, Amer. Meteor. Soc., Crook, N. A., 1996: Sensitivity of moist convection forced by boundary layer processes to low-level thermodynamic fields. Mon. Wea. Rev., 124, Darkow, G. L., 1969: An analysis of over sixty tornado proximity soundings. Preprints, Sixth Conf. on Severe Local Storms, Chicago, IL, Amer. Meteor. Soc., Davies-Jones, R. P., 1993: Helicity trends in tornado outbreaks. Preprints, 17th Conf. on Severe Local Storms, St. Louis, MO, Amer. Meteor. Soc., Doswell, C. A., III, 1982: The operational meteorology of convective weather. Vol. I: Operational mesoanalysis. NOAA Tech. Memo. NWS NSSFC-5, 158 pp. [NTIS PB ], and E. N. Rasmussen, 1994: The effect of neglecting the virtual temperature correction on CAPE calculations. Wea. Forecasting, 9, , S. J. Weiss, and R. H. Johns, 1993: Tornado forecasting A review. The Tornado: Its Structure, Dynamics, Prediction, and Hazards, Geophys. Monogr., No. 79, Amer. Geophys. Union, Johns, R. H., J. M. Davies, and P. W. Leftwich, 1993: Some wind and instability parameters associated with strong and violent tornadoes. Part II: Variations in the combinations of wind and instability parameters. The Tornado: Its Structure, Dynamics, Prediction, and Hazards, Geophys. Monogr., No. 79, Amer. Geophys. Union, Klemp, J. B., and R. B. Wilhelmson, 1978: Simulations of right- and left-moving storms produced through storm splitting. J. Atmos. Sci., 35, Lemon, L. R., and C. A. Doswell III, 1979: Severe thunderstorm evolution and mesocyclone structure as related to tornadogenesis. Mon. Wea. Rev., 107, Markowski, P. M., E. N. Rasmussen, and J. M. Straka, 1998: The occurrence of tornadoes in supercells interacting with boundaries during VORTEX-95. Wea. Forecasting, 13, National Climatic Data Center, 1999: Storm Data. Vol. 41, No. 5, 371 pp. [Available from National Climatic Data Center, Asheville, NC ] Rasmussen, E. N., and D. O. Blanchard, 1998: A baseline climatology of sounding-derived supercell and tornado forecast parameters. Wea. Forecasting, 13, , and J. M. Straka, 1998: Variations in supercell morphology. Part I: Observations of the role of upper-level storm-relative flow. Mon. Wea. Rev., 126, Schaefer, J. T., 1974: The life cycle of the dryline. J. Appl. Meteor., 13, Thompson, R. L., 1998: Eta Model storm-relative winds associated with tornadic and nontornadic supercells. Wea. Forecasting, 13, Weckwerth, T. M., J. W. Wilson, R. M. Wakimoto, and N. A. Cook, 1997: Horizontal convective rolls: Determining the environmental conditions supporting their existence and characteristics. Mon. Wea. Rev., 125, Weisman, M. L., and J. B. Klemp, 1982: The dependence of numerically simulated convective storms on vertical wind shear and buoyancy. Mon. Wea. Rev., 110, , M. S. Gilmore, and L. J. Wicker, 1998: The impact of convective storms on their local environment: What is an appropriate ambient sounding? Preprints, 19th Conf. on Severe Local Storms, Minneapolis, MN, Amer. Meteor. Soc., Wicker, L. J., 1996: The role of near surface wind shear on low-level mesocyclone generation and tornadoes. Preprints, 18th Conf. on Severe Local Storms, San Francisco, CA, Amer. Meteor. Soc., Wilhelmson, R. B., and J. B. Klemp, 1978: A numerical study of storm splitting that leads to long-lived storms. J. Atmos. Sci., 35, Wilson, J. W., T. M. Weckwerth, J. Vivekanandan, R. M. Wakimoto, and R. W. Russell, 1994: Boundary layer clear-air radar echoes: Origin of echoes and accuracy of derived winds. J. Atmos. Oceanic Technol., 11, Ziegler, C. L., and C. E. Hane, 1993: An observational study of the dryline. Mon. Wea. Rev., 121,

J4.1 CENTRAL NORTH CAROLINA TORNADOES FROM THE 16 APRIL 2011 OUTBREAK. Matthew Parker* North Carolina State University, Raleigh, North Carolina
 J4.1 CENTRAL NORTH CAROLINA TORNADOES FROM THE 16 APRIL 2011 OUTBREAK Matthew Parker* North Carolina State University, Raleigh, North Carolina Jonathan Blaes NOAA/National Weather Service, Raleigh, North
Left moving thunderstorms in a high Plains, weakly-sheared environment
 Left moving thunderstorms in a high Plains, weakly-sheared environment by John F. Weaver 1 and John F. Dostalek Cooperative Institute for Research in the Atmosphere, CIRA Colorado State University Fort
Chapter 3: Weather Map. Weather Maps. The Station Model. Weather Map on 7/7/2005 4/29/2011
 Chapter 3: Weather Map Weather Maps Many variables are needed to described weather conditions. Local weathers are affected by weather pattern. We need to see all the numbers describing weathers at many
Chapter 3: Weather Map. Station Model and Weather Maps Pressure as a Vertical Coordinate Constant Pressure Maps Cross Sections
 Chapter 3: Weather Map Station Model and Weather Maps Pressure as a Vertical Coordinate Constant Pressure Maps Cross Sections Weather Maps Many variables are needed to described dweather conditions. Local
NOTES AND CORRESPONDENCE. Observations of a Severe Left Moving Thunderstorm
 500 WEATHER AND FORECASTING VOLUME 16 NOTES AND CORRESPONDENCE Observations of a Severe Left Moving Thunderstorm LEWIS D. GRASSO AND ERIC R. HILGENDORF Cooperative Institute for Research in the Atmosphere,
Convective Clouds. Convective clouds 1
 Convective clouds 1 Convective Clouds Introduction Convective clouds are formed in vertical motions that result from the instability of the atmosphere. This instability can be caused by: a. heating at
MICROPHYSICS COMPLEXITY EFFECTS ON STORM EVOLUTION AND ELECTRIFICATION
 MICROPHYSICS COMPLEXITY EFFECTS ON STORM EVOLUTION AND ELECTRIFICATION Blake J. Allen National Weather Center Research Experience For Undergraduates, Norman, Oklahoma and Pittsburg State University, Pittsburg,
INTRODUCTION STORM CHRONOLOGY AND OBSERVATIONS
 THE MESOCYCLONE EVOLUTION OF THE WARREN, OKLAHOMA TORNADOES By Timothy P. Marshall and Erik N. Rasmussen (Reprinted from the 12th Conference on Severe Local Storms, American Meteorological Society, San
8B.6 A DETAILED ANALYSIS OF SPC HIGH RISK OUTLOOKS, 2003-2009
 8B.6 A DETAILED ANALYSIS OF SPC HIGH RISK OUTLOOKS, 2003-2009 Jason M. Davis*, Andrew R. Dean 2, and Jared L. Guyer 2 Valparaiso University, Valparaiso, IN 2 NOAA/NWS Storm Prediction Center, Norman, OK.
How do Scientists Forecast Thunderstorms?
 How do Scientists Forecast Thunderstorms? Objective In the summer, over the Great Plains, weather predictions often call for afternoon thunderstorms. While most of us use weather forecasts to help pick
Regional Forecast Center Timişoara 15. Gh. Adam St., Timişoara, Romania, e-mail: cristi_nichita2004@yahoo.com
 Analele UniversităŃii din Oradea Seria Geografie Tom XX, no. 2/2010 (December), pp 197-203 ISSN 1221-1273, E-ISSN 2065-3409 Article no. 202106-492 SOME DOPPLER RADAR FEATURES OF SEVERE WEATHER IN SUPERCELLS
P10.145 POTENTIAL APPLICATIONS OF A CONUS SOUNDING CLIMATOLOGY DEVELOPED AT THE STORM PREDICTION CENTER
 P10.145 POTENTIAL APPLICATIONS OF A CONUS SOUNDING CLIMATOLOGY DEVELOPED AT THE STORM PREDICTION CENTER Jaret W. Rogers*, Richard L. Thompson, and Patrick T. Marsh NOAA/NWS Storm Prediction Center Norman,
Supercell Thunderstorm Structure and Evolution
 Supercell Thunderstorm Structure and Evolution Supercellular Convection Most uncommon, but most dangerous storm type Produces almost all instances of very large hail and violent (EF4-EF5) tornadoes Highly
P1.2 ASSESSMENT OF ANTICYCLONIC SUPERCELL ENVIRONMENTS USING CLOSE PROXIMITY SOUNDINGS FROM THE RUC MODEL
 P1.2 ASSESSMENT OF ANTICYCLONIC SUPERCELL ENVIRONMENTS USING CLOSE PROXIMITY SOUNDINGS FROM THE RUC MODEL 1. INTRODUCTION Roger Edwards 1, Richard L. Thompson and Corey M. Mead Storm Prediction Center,
Mid latitude Cyclonic Storm System. 08 _15 ab. jpg
 Mid latitude Cyclonic Storm System 08 _15 ab. jpg Mid Latitude Cyclone Storm System (MLCSS) It has several names. Cyclone, Cyclonic Storm, Cyclonic System, Depression. Cyclonic Storms are the weather maker
A Romanian Forecast and Training Experience, August 2002
 A Romanian Forecast and Training Experience, August 2002 Introduction Leslie R. Lemon and Aurora Stan-Sion During 2002 Romania has gone through a modernization program for its weather services similar
Goal: Understand the conditions and causes of tropical cyclogenesis and cyclolysis
 Necessary conditions for tropical cyclone formation Leading theories of tropical cyclogenesis Sources of incipient disturbances Extratropical transition Goal: Understand the conditions and causes of tropical
WEATHER RADAR VELOCITY FIELD CONFIGURATIONS ASSOCIATED WITH SEVERE WEATHER SITUATIONS THAT OCCUR IN SOUTH-EASTERN ROMANIA
 Romanian Reports in Physics, Vol. 65, No. 4, P. 1454 1468, 2013 ATMOSPHERE PHYSICS WEATHER RADAR VELOCITY FIELD CONFIGURATIONS ASSOCIATED WITH SEVERE WEATHER SITUATIONS THAT OCCUR IN SOUTH-EASTERN ROMANIA
ATMS 310 Jet Streams
 ATMS 310 Jet Streams Jet Streams A jet stream is an intense (30+ m/s in upper troposphere, 15+ m/s lower troposphere), narrow (width at least ½ order magnitude less than the length) horizontal current
MINI-SUPERCELL EVENT OF 23 OCTOBER 2004 IN THE MEMPHIS COUNTY WARNING AREA
 MINI-SUPERCELL EVENT OF 23 OCTOBER 2004 IN THE MEMPHIS COUNTY WARNING AREA Jonathan L. Howell* and Jason F. Beaman National Weather Service Forecast Office Memphis, Tennessee August 15, 2006 1. INTRODUCTION
Vertical Wind Shear Associated with Left-Moving Supercells
 845 Vertical Wind Shear Associated with Left-Moving Supercells MATTHEW J. BUNKERS NOAA/NWS Weather Forecast Office, Rapid City, South Dakota (Manuscript received 6 September 2001, in final form 21 February
Severe Weather Information
 Severe Weather Information TORNADO FACTS Canada gets more tornadoes than any other country with the exception of the United States. Tornadoes are rotating columns of high winds. Sometimes they move quickly
Comparison between Observed Convective Cloud-Base Heights and Lifting Condensation Level for Two Different Lifted Parcels
 AUGUST 2002 NOTES AND CORRESPONDENCE 885 Comparison between Observed Convective Cloud-Base Heights and Lifting Condensation Level for Two Different Lifted Parcels JEFFREY P. CRAVEN AND RYAN E. JEWELL NOAA/NWS/Storm
Basics of weather interpretation
 Basics of weather interpretation Safety at Sea Seminar, April 2 nd 2016 Dr. Gina Henderson Oceanography Dept., USNA ghenders@usna.edu Image source: http://earthobservatory.nasa.gov/naturalhazards/view.php?id=80399,
An Observational Examination of Long-Lived Supercells. Part I: Characteristics, Evolution, and Demise
 VOLUME 21 W E A T H E R A N D F O R E C A S T I N G OCTOBER 2006 An Observational Examination of Long-Lived Supercells. Part I: Characteristics, Evolution, and Demise MATTHEW J. BUNKERS NOAA/National Weather
How to analyze synoptic-scale weather patterns Table of Contents
 How to analyze synoptic-scale weather patterns Table of Contents Before You Begin... 2 1. Identify H and L pressure systems... 3 2. Locate fronts and determine frontal activity... 5 3. Determine surface
How To Understand The Weather Patterns In Tallahassee, Florida
 PATTERN RECOGNITION OF SIGNIFICANT SNOWFALL EVENTS IN TALLAHASSEE, FLORIDA Jeffery D. Fournier and Andrew I. Watson NOAA/National Weather Service Weather Forecast Office Tallahassee, Florida Abstract Skew-T
Convective Weather Maps
 Guide to using Convective Weather Maps Oscar van der Velde www.lightningwizard.com last modified: August 27th, 2007 Reproduction of this document or parts of it is allowed with permission. This document
Diurnal Cycle of Convection at the ARM SGP Site: Role of Large-Scale Forcing, Surface Fluxes, and Convective Inhibition
 Thirteenth ARM Science Team Meeting Proceedings, Broomfield, Colorado, March 31-April 4, 23 Diurnal Cycle of Convection at the ARM SGP Site: Role of Large-Scale Forcing, Surface Fluxes, and Convective
In May 2003 there was a very destructive extended
 THE MAY 2003 EXTENDED TORNADO OUTBREAK BY THOMAS M. HAMILL, RUSSELL S. SCHNEIDER, HAROLD E. BROOKS, GREGORY S. FORBES, HOWARD B. BLUESTEIN, MICHAEL STEINBERG, DANIEL MELÉNDEZ, AND RANDALL M. DOLE An extended
WEATHER THEORY Temperature, Pressure And Moisture
 WEATHER THEORY Temperature, Pressure And Moisture Air Masses And Fronts Weather Theory- Page 77 Every physical process of weather is a result of a heat exchange. The standard sea level temperature is 59
A SEVERE WEATHER CLIMATOLOGY FOR THE WILMINGTON, NC WFO COUNTY WARNING AREA
 A SEVERE WEATHER CLIMATOLOGY FOR THE WILMINGTON, NC WFO COUNTY WARNING AREA Carl R. Morgan National Weather Service Wilmington, NC 1. INTRODUCTION The National Weather Service (NWS) Warning Forecast Office
Hurricanes. Characteristics of a Hurricane
 Hurricanes Readings: A&B Ch. 12 Topics 1. Characteristics 2. Location 3. Structure 4. Development a. Tropical Disturbance b. Tropical Depression c. Tropical Storm d. Hurricane e. Influences f. Path g.
Storms Short Study Guide
 Name: Class: Date: Storms Short Study Guide Multiple Choice Identify the letter of the choice that best completes the statement or answers the question. 1. A(n) thunderstorm forms because of unequal heating
In a majority of ice-crystal icing engine events, convective weather occurs in a very warm, moist, tropical-like environment. aero quarterly qtr_01 10
 In a majority of ice-crystal icing engine events, convective weather occurs in a very warm, moist, tropical-like environment. 22 avoiding convective Weather linked to Ice-crystal Icing engine events understanding
A Real Case Study of Using Cloud Analysis in Grid-point Statistical Interpolation Analysis and Advanced Research WRF Forecast System
 A Real Case Study of Using Cloud Analysis in Grid-point Statistical Interpolation Analysis and Advanced Research WRF Forecast System Ming Hu 1 and Ming Xue 1, 1 Center for Analysis and Prediction of Storms,
Early Season Northwest Flow Snowfall Event 28 October 2008
 Early Season Northwest Flow Snowfall Event 28 October 2008 Scott Krentz NOAA/National Weather Service Greer, SC 1. Introduction A post frontal northwest flow snowfall event affected the mountains of North
Tropical Cloud Population
 Tropical Cloud Population Before Satellites Visual Observation View from and aircraft flying over the South China Sea Radiosonde Data Hot tower hypothesis Riehl & Malkus 1958 Satellite Observations Post
Relationship between a Weakening Cold Front, Misocyclones, and Cloud Development on 10 June 2002 during IHOP
 JANUARY 2006 A R N O T T E T A L. 311 Relationship between a Weakening Cold Front, Misocyclones, and Cloud Development on 10 June 2002 during IHOP NETTIE R. ARNOTT AND YVETTE P. RICHARDSON The Pennsylvania
OBSERVATIONS FROM THE APRIL 13 2004 WAKE LOW DAMAGING WIND EVENT IN SOUTH FLORIDA. Robert R. Handel and Pablo Santos NOAA/NWS, Miami, Florida ABSTRACT
 OBSERVATIONS FROM THE APRIL 13 2004 WAKE LOW DAMAGING WIND EVENT IN SOUTH FLORIDA Robert R. Handel and Pablo Santos NOAA/NWS, Miami, Florida ABSTRACT On Tuesday, April 13, 2004, a high wind event swept
Frank and Charles Cohen Department of Meteorology The Pennsylvania State University University Park, PA, 16801 -U.S.A.
 376 THE SIMULATION OF TROPICAL CONVECTIVE SYSTEMS William M. Frank and Charles Cohen Department of Meteorology The Pennsylvania State University University Park, PA, 16801 -U.S.A. ABSTRACT IN NUMERICAL
IMPACT OF SAINT LOUIS UNIVERSITY-AMERENUE QUANTUM WEATHER PROJECT MESONET DATA ON WRF-ARW FORECASTS
 IMPACT OF SAINT LOUIS UNIVERSITY-AMERENUE QUANTUM WEATHER PROJECT MESONET DATA ON WRF-ARW FORECASTS M. J. Mueller, R. W. Pasken, W. Dannevik, T. P. Eichler Saint Louis University Department of Earth and
The Value That Wind Profilers Bring To Weather Forecasting. George Frederick March 2005
 The Value That Wind Profilers Bring To Weather Forecasting George Frederick March 2005 What Value Do Wind Profilers Bring to Weather Forecasting? Wind profilers are an important source of meteorological
2. The map below shows high-pressure and low-pressure weather systems in the United States.
 1. Which weather instrument has most improved the accuracy of weather forecasts over the past 40 years? 1) thermometer 3) weather satellite 2) sling psychrometer 4) weather balloon 6. Wind velocity is
Authors and Affiliations Kristopher Bedka 1, Cecilia Wang 1, Ryan Rogers 2, Larry Carey 2, Wayne Feltz 3, and Jan Kanak 4
 1. Title Slide Title: Analysis of the Co-Evolution of Total Lightning, Ground-Based Radar-Derived Fields, and GOES-14 1-Minute Super Rapid Scan Satellite Observations of Deep Convective Cloud Tops Authors
Air Masses and Fronts
 Air Masses and Fronts Air Masses The weather of the United States east of the Rocky Mountains is dominated by large masses of air that travel south from the wide expanses of land in Canada, and north from
WV IMAGES. Christo Georgiev. NIMH, Bulgaria. Satellite Image Interpretation and Applications EUMeTrain Online Course, 10 30 June 2011
 WV IMAGES Satellite Image Interpretation and Applications EUMeTrain Online Course, 10 30 June 2011 Christo Georgiev NIMH, Bulgaria INTRODICTION The radiometer SEVIRI of Meteosat Second Generation (MSG)
Weather Help - NEXRAD Radar Maps. Base Reflectivity
 Weather Help - NEXRAD Radar Maps Base Reflectivity Base Reflectivity Severe Thunderstorm/Torna do Watch Areas 16 levels depicted with colors from dark green (very light) to red (extreme) that indicate
Climate Extremes Research: Recent Findings and New Direc8ons
 Climate Extremes Research: Recent Findings and New Direc8ons Kenneth Kunkel NOAA Cooperative Institute for Climate and Satellites North Carolina State University and National Climatic Data Center h#p://assessment.globalchange.gov
Thunderstorm Basics. Updraft Characteristics (Rising Air) Downdraft Characteristics (Air Descends to the Ground)
 Downdraft Characteristics (Air Descends to the Ground)") Thunderstorm Basics Updraft Characteristics (Rising Air) Cumulus Tower Upward Cloud Motion Updraft Dominant Downdraft/Updraft Downdraft Dominant Rain-Free Base Downdraft Characteristics (Air Descends to
Thunderstorm Basics Updraft Characteristics (Rising Air) Cumulus Tower Upward Cloud Motion Updraft Dominant Downdraft/Updraft Downdraft Dominant Rain-Free Base Downdraft Characteristics (Air Descends to
This chapter discusses: 1. Definitions and causes of stable and unstable atmospheric air. 2. Processes that cause instability and cloud development
 Stability & Cloud Development This chapter discusses: 1. Definitions and causes of stable and unstable atmospheric air 2. Processes that cause instability and cloud development Stability & Movement A rock,
Chapter 7 Stability and Cloud Development. Atmospheric Stability
 Chapter 7 Stability and Cloud Development Atmospheric Stability 1 Cloud Development - stable environment Stable air (parcel) - vertical motion is inhibited if clouds form, they will be shallow, layered
WESTERN REGION TECHNICAL ATTACHMENT NO. 99-26 November 9, 1999 THE LAS VEGAS FLASH FLOODS OF 8 JULY 1999: A POST-EVENT SUMMARY
 http://www.wrh.noaa.gov/wrh/99tas/9926/index.html WESTERN REGION TECHNICAL ATTACHMENT NO. 99-26 November 9, 1999 THE LAS VEGAS FLASH FLOODS OF 8 JULY 1999: A POST-EVENT SUMMARY Jesus A. Haro, Harold R.
Lecture 4: Pressure and Wind
 Lecture 4: Pressure and Wind Pressure, Measurement, Distribution Forces Affect Wind Geostrophic Balance Winds in Upper Atmosphere Near-Surface Winds Hydrostatic Balance (why the sky isn t falling!) Thermal
SIXTH GRADE WEATHER 1 WEEK LESSON PLANS AND ACTIVITIES
 SIXTH GRADE WEATHER 1 WEEK LESSON PLANS AND ACTIVITIES WATER CYCLE OVERVIEW OF SIXTH GRADE WATER WEEK 1. PRE: Evaluating components of the water cycle. LAB: Experimenting with porosity and permeability.
HIGH RESOLUTION SATELLITE IMAGERY OF THE NEW ZEALAND AREA: A VIEW OF LEE WAVES*
 Weather and Climate (1982) 2: 23-29 23 HIGH RESOLUTION SATELLITE IMAGERY OF THE NEW ZEALAND AREA: A VIEW OF LEE WAVES* C. G. Revell New Zealand Meteorological Service, Wellington ABSTRACT Examples of cloud
Center for Analysis and Prediction of Storms, and School of Meteorology, University of Oklahoma, Norman, Oklahoma KEITH BREWSTER
 FEBRUARY 2006 H U E T A L. 675 3DVAR and Cloud Analysis with WSR-88D Level-II Data for the Prediction of the Fort Worth, Texas, Tornadic Thunderstorms. Part I: Cloud Analysis and Its Impact MING HU AND
DETAILED STORM SIMULATIONS BY A NUMERICAL CLOUD MODEL WITH ELECTRIFICATION AND LIGHTNING PARAMETERIZATIONS
 DETAILED STORM SIMULATIONS BY A NUMERICAL CLOUD MODEL WITH ELECTRIFICATION AND LIGHTNING PARAMETERIZATIONS Don MacGorman 1, Ted Mansell 1,2, Conrad Ziegler 1, Jerry Straka 3, and Eric C. Bruning 1,3 1
Technical Attachment. The National Weather Service Estimated Actual Velocity Radar Tool. Ken Falk WFO Shreveport, Louisiana
 SRH STSD 2007-03 October 2007 Technical Attachment The National Weather Service Estimated Actual Velocity Radar Tool 1. Introduction Ken Falk WFO Shreveport, Louisiana A radar analysis tool has been introduced
Environmental Sensitivity of Tropical Cyclone Outflow
 DISTRIBUTION STATEMENT A. Approved for public release; distribution is unlimited. Environmental Sensitivity of Tropical Cyclone Outflow Principal Investigator: Sharanya J. Majumdar Department of Atmospheric
Uncertainties in using the hodograph method to retrieve gravity wave characteristics from individual soundings
 GEOPHYSICAL RESEARCH LETTERS, VOL. 31, L11110, doi:10.1029/2004gl019841, 2004 Uncertainties in using the hodograph method to retrieve gravity wave characteristics from individual soundings Fuqing Zhang
P1.4 THE DOWNTOWN ATLANTA, GEORGIA, EF-2 TORNADO OF 14 MARCH 2008
 P1.4 THE DOWNTOWN ATLANTA, GEORGIA, EF-2 TORNADO OF 14 MARCH 2008 Steven E. Nelson*, Lans P. Rothfusz NOAA/National Weather Service Weather Forecast Office, Atlanta/Peachtree City, Georgia 1. INTRODUCTION
Stability and Cloud Development. Stability in the atmosphere AT350. Why did this cloud form, whereas the sky was clear 4 hours ago?
 Stability and Cloud Development AT350 Why did this cloud form, whereas the sky was clear 4 hours ago? Stability in the atmosphere An Initial Perturbation Stable Unstable Neutral If an air parcel is displaced
IBM Big Green Innovations Environmental R&D and Services
 IBM Big Green Innovations Environmental R&D and Services Smart Weather Modelling Local Area Precision Forecasting for Weather-Sensitive Business Operations (e.g. Smart Grids) Lloyd A. Treinish Project
Meteorology: Weather and Climate
 Meteorology: Weather and Climate Large Scale Weather Systems Lecture 1 Tropical Cyclones: Location and Structure Prof. Roy Thompson Crew building Large-scale Weather Systems Tropical cyclones (1-2) Location,
SKEW-T, LOG-P DIAGRAM ANALYSIS PROCEDURES
 SKEW-T, LOG-P DIAGRAM ANALYSIS PROCEDURES I. THE SKEW-T, LOG-P DIAGRAM The primary source for information contained in this appendix was taken from the Air Weather Service Technical Report TR-79/006. 1
Tropical Cyclone Report Hurricane Fausto (EP072008) 16-22 July 2008. John L. Beven II National Hurricane Center 19 November 2008
 16-22 July 2008. John L. Beven II National Hurricane Center 19 November 2008") Tropical Cyclone Report Hurricane Fausto (EP072008) 16-22 July 2008 John L. Beven II National Hurricane Center 19 November 2008 Fausto was a category 1 hurricane on the Saffir-Simpson Hurricane Scale that
Tropical Cyclone Report Hurricane Fausto (EP072008) 16-22 July 2008 John L. Beven II National Hurricane Center 19 November 2008 Fausto was a category 1 hurricane on the Saffir-Simpson Hurricane Scale that
Chapter Overview. Seasons. Earth s Seasons. Distribution of Solar Energy. Solar Energy on Earth. CHAPTER 6 Air-Sea Interaction
 Chapter Overview CHAPTER 6 Air-Sea Interaction The atmosphere and the ocean are one independent system. Earth has seasons because of the tilt on its axis. There are three major wind belts in each hemisphere.
Name: OBJECTIVES Correctly define: WEATHER BASICS: STATION MODELS: MOISTURE: PRESSURE AND WIND: Weather
 Name: OBJECTIVES Correctly define: air mass, air pressure, anemometer, barometer, cyclone, dew point, front, isobar, isotherm, meteorology, precipitation, psychrometer, relative humidity, saturated, transpiration
Texas Department of Public Safety Texas Division of Emergency Management. Texas State Operations Center
 Texas Department of Public Safety Texas Division of Emergency Management Texas State Operations Center Situation Awareness Brief Saturday, July 20 th 2013 As of 0900 CDT Tropical Weather Outlook For the
Urban heat islands and summertime convective thunderstorms in Atlanta: three case studies
 Atmospheric Environment 34 (2000) 507}516 Urban heat islands and summertime convective thunderstorms in Atlanta: three case studies Robert Bornstein*, Qinglu Lin Department of Meteorology, San Jose State
Preliminary summary of the 2015 NEWS- e realtime forecast experiment
 Preliminary summary of the 2015 NEWS- e realtime forecast experiment December 15, 2015 1. Introduction The NOAA Warn- on- Forecast (WoF) research project is tasked with developing a regional 1- km storm-
Comment on "Observational and model evidence for positive low-level cloud feedback"
 LLNL-JRNL-422752 Comment on "Observational and model evidence for positive low-level cloud feedback" A. J. Broccoli, S. A. Klein January 22, 2010 Science Disclaimer This document was prepared as an account
P8.27 TWO RECORD BREAKING AUSTRALIAN HAILSTORMS: STORM ENVIRONMENTS, DAMAGE CHARACTERISTICS AND RARITY
 P8.27 TWO RECORD BREAKING AUSTRALIAN HAILSTORMS: STORM ENVIRONMENTS, DAMAGE CHARACTERISTICS AND RARITY B.W. Buckley *, W. Sullivan, P. Chan, M. Leplastrier Insurance Australia Group, Sydney, Australia
Trimodal cloudiness and tropical stable layers in simulations of radiative convective equilibrium
 GEOPHYSICAL RESEARCH LETTERS, VOL. 35, L08802, doi:10.1029/2007gl033029, 2008 Trimodal cloudiness and tropical stable layers in simulations of radiative convective equilibrium D. J. Posselt, 1 S. C. van
Developing Continuous SCM/CRM Forcing Using NWP Products Constrained by ARM Observations
 Developing Continuous SCM/CRM Forcing Using NWP Products Constrained by ARM Observations S. C. Xie, R. T. Cederwall, and J. J. Yio Lawrence Livermore National Laboratory Livermore, California M. H. Zhang
Exploring Florida: Teaching Resources for Science 1 of 6
 Exploring Florida: Teaching Resources for Science 1 of 6 Tropical Cyclones This document describes tropical cyclones and the dangers they pose to coastal populations. It is intended to help teachers improve
Quadrant 1 Sea Breeze: Routing Considerations Table of Contents
 Quadrant 1 Sea Breeze: Routing Considerations Table of Contents Introduction Quadrant 1 Sea Breeze Description 2 3 Introduction Four Sea Breeze Quadrants (Figure 1) When considering a sea breeze and its
To my uncle Ruggero Marcello
 1 2 To my uncle Ruggero Marcello We wait, we wait, And the saints and martyrs wait, for those who shall be martyrs and saints. Destiny waits in the hand of God, shaping the still unshapen: I have seen
Can latent heat release have a negative effect on polar low intensity?
 Can latent heat release have a negative effect on polar low intensity? Ivan Føre, Jon Egill Kristjansson, Erik W. Kolstad, Thomas J. Bracegirdle and Øyvind Sætra Polar lows: are intense mesoscale cyclones
Atmospheric Stability & Cloud Development
 Atmospheric Stability & Cloud Development Stable situations a small change is resisted and the system returns to its previous state Neutral situations a small change is neither resisted nor enlarged Unstable
6.4 THE SIERRA ROTORS PROJECT, OBSERVATIONS OF MOUNTAIN WAVES. William O. J. Brown 1 *, Stephen A. Cohn 1, Vanda Grubiši 2, and Brian Billings 2
 6.4 THE SIERRA ROTORS PROJECT, OBSERVATIONS OF MOUNTAIN WAVES William O. J. Brown 1 *, Stephen A. Cohn 1, Vanda Grubiši 2, and Brian Billings 2 1 National Center for Atmospheric Research, Boulder, Colorado.
Nowcasting Thunderstorm Potential from Satellite
 Nowcasting Thunderstorm Potential from Satellite Robert M Rabin NOAA/National Severe Storms Laboratory Norman, OK USA Cooperative Institute for Meteorological Satellite Studies University of Wisconsin
Tropical Cyclone Climatology
 Tropical Cyclone Climatology Introduction In this section, we open our study of tropical cyclones, one of the most recognizable (and impactful) weather features of the tropics. We begin with an overview
P3.8 INTEGRATING A DOPPLER SODAR WITH NUCLEAR POWER PLANT METEOROLOGICAL DATA. Thomas E. Bellinger
 P3.8 INTEGRATING A DOPPLER SODAR WITH NUCLEAR POWER PLANT METEOROLOGICAL DATA Thomas E. Bellinger Illinois Emergency Management Agency Springfield, Illinois 1. INTRODUCTION A Doppler sodar owned by the
Activity 8 Drawing Isobars Level 2 http://www.uni.edu/storm/activities/level2/index.shtml
 Activity 8 Drawing Isobars Level 2 http://www.uni.edu/storm/activities/level2/index.shtml Objectives: 1. Students will be able to define and draw isobars to analyze air pressure variations. 2. Students
Not all clouds are easily classified! Cloud Classification schemes. Clouds by level 9/23/15
 Cloud Classification schemes 1) classified by where they occur (for example: high, middle, low) 2) classified by amount of water content and vertical extent (thick, thin, shallow, deep) 3) classified by
Description of zero-buoyancy entraining plume model
 Influence of entrainment on the thermal stratification in simulations of radiative-convective equilibrium Supplementary information Martin S. Singh & Paul A. O Gorman S1 CRM simulations Here we give more
ATM 316: Dynamic Meteorology I Final Review, December 2014
 ATM 316: Dynamic Meteorology I Final Review, December 2014 Scalars and Vectors Scalar: magnitude, without reference to coordinate system Vector: magnitude + direction, with reference to coordinate system
1. a. Surface Forecast Charts (USA and Ontario and Quebec) http://www.rap.ucar.edu/weather/
 http://www.rap.ucar.edu/weather/") COMPUTER ASSISTED METEOROLOGY Frank Pennauer This contribution gives the available computer data sources, how to access them and use this data for predicting Soaring weather conditions will be discussed
COMPUTER ASSISTED METEOROLOGY Frank Pennauer This contribution gives the available computer data sources, how to access them and use this data for predicting Soaring weather conditions will be discussed
VOCALS-CUpEx: The Chilean Upwelling Experiment
 VOCALS-CUpEx: The Chilean Upwelling Experiment René D. Garreaud 1, José Rutllant 1,2, Ricardo Muñoz 1, David Rahn 1, Marcel Ramos 2 and Dante Figueroa 3 (1) Department of Geophysics, Universidad de Chile;
USING THE GOES 3.9 µm SHORTWAVE INFRARED CHANNEL TO TRACK LOW-LEVEL CLOUD-DRIFT WINDS ABSTRACT
 USING THE GOES 3.9 µm SHORTWAVE INFRARED CHANNEL TO TRACK LOW-LEVEL CLOUD-DRIFT WINDS Jason P. Dunion 1 and Christopher S. Velden 2 1 NOAA/AOML/Hurricane Research Division, 2 UW/CIMSS ABSTRACT Low-level
A Review on the Uses of Cloud-(System-)Resolving Models
Resolving Models") A Review on the Uses of Cloud-(System-)Resolving Models Jeffrey D. Duda Since their advent into the meteorological modeling world, cloud-(system)-resolving models (CRMs or CSRMs) have become very important
A Review on the Uses of Cloud-(System-)Resolving Models Jeffrey D. Duda Since their advent into the meteorological modeling world, cloud-(system)-resolving models (CRMs or CSRMs) have become very important
6A.2 The testing of NSSL multi-sensor applications and data from prototype platforms in NWS forecast operations
 6A.2 The testing of NSSL multi-sensor applications and data from prototype platforms in NWS forecast operations Kevin A. Scharfenberg* and Travis M. Smith Cooperative Institute for Mesoscale Meteorology
Analyze Weather in Cold Regions and Mountainous Terrain
 Analyze Weather in Cold Regions and Mountainous Terrain Terminal Learning Objective Action: Analyze weather of cold regions and mountainous terrain Condition: Given a training mission that involves a specified
c 2015 Nathan Allen Wendt. All rights reserved.
 c 2015 Nathan Allen Wendt. All rights reserved. EFFECTS OF ENVIRONMENTAL SHEAR AND BUOYANCY ON SIMULATED SUPERCELL INTERACTIONS BY NATHAN ALLEN WENDT THESIS Submitted in partial fulfillment of the requirements
Heavy Rainfall from Hurricane Connie August 1955 By Michael Kozar and Richard Grumm National Weather Service, State College, PA 16803
 Heavy Rainfall from Hurricane Connie August 1955 By Michael Kozar and Richard Grumm National Weather Service, State College, PA 16803 1. Introduction Hurricane Connie became the first hurricane of the
7B.2 MODELING THE EFFECT OF VERTICAL WIND SHEAR ON TROPICAL CYCLONE SIZE AND STRUCTURE
 7B.2 MODELING THE EFFECT OF VERTICAL WIND SHEAR ON TROPICAL CYCLONE SIZE AND STRUCTURE Diana R. Stovern* and Elizabeth A. Ritchie University of Arizona, Tucson, Arizona 1. Introduction An ongoing problem
FOURTH GRADE WEATHER
 FOURTH GRADE WEATHER 1 WEEK LESSON PLANS AND ACTIVITIES WATER CYCLE OVERVIEW OF FOURTH GRADE WATER WEEK 1. PRE: Comparing different reservoirs of water. LAB: Experimenting with surface tension and capillary
7613-1 - Page 1. Weather Unit Exam Pre-Test Questions
 Weather Unit Exam Pre-Test Questions 7613-1 - Page 1 Name: 1) Equal quantities of water are placed in four uncovered containers with different shapes and left on a table at room temperature. From which