WESTERN REGION TECHNICAL ATTACHMENT NO November 9, 1999 THE LAS VEGAS FLASH FLOODS OF 8 JULY 1999: A POST-EVENT SUMMARY
|
|
|
- Rudolf Robertson
- 8 years ago
- Views:
Transcription
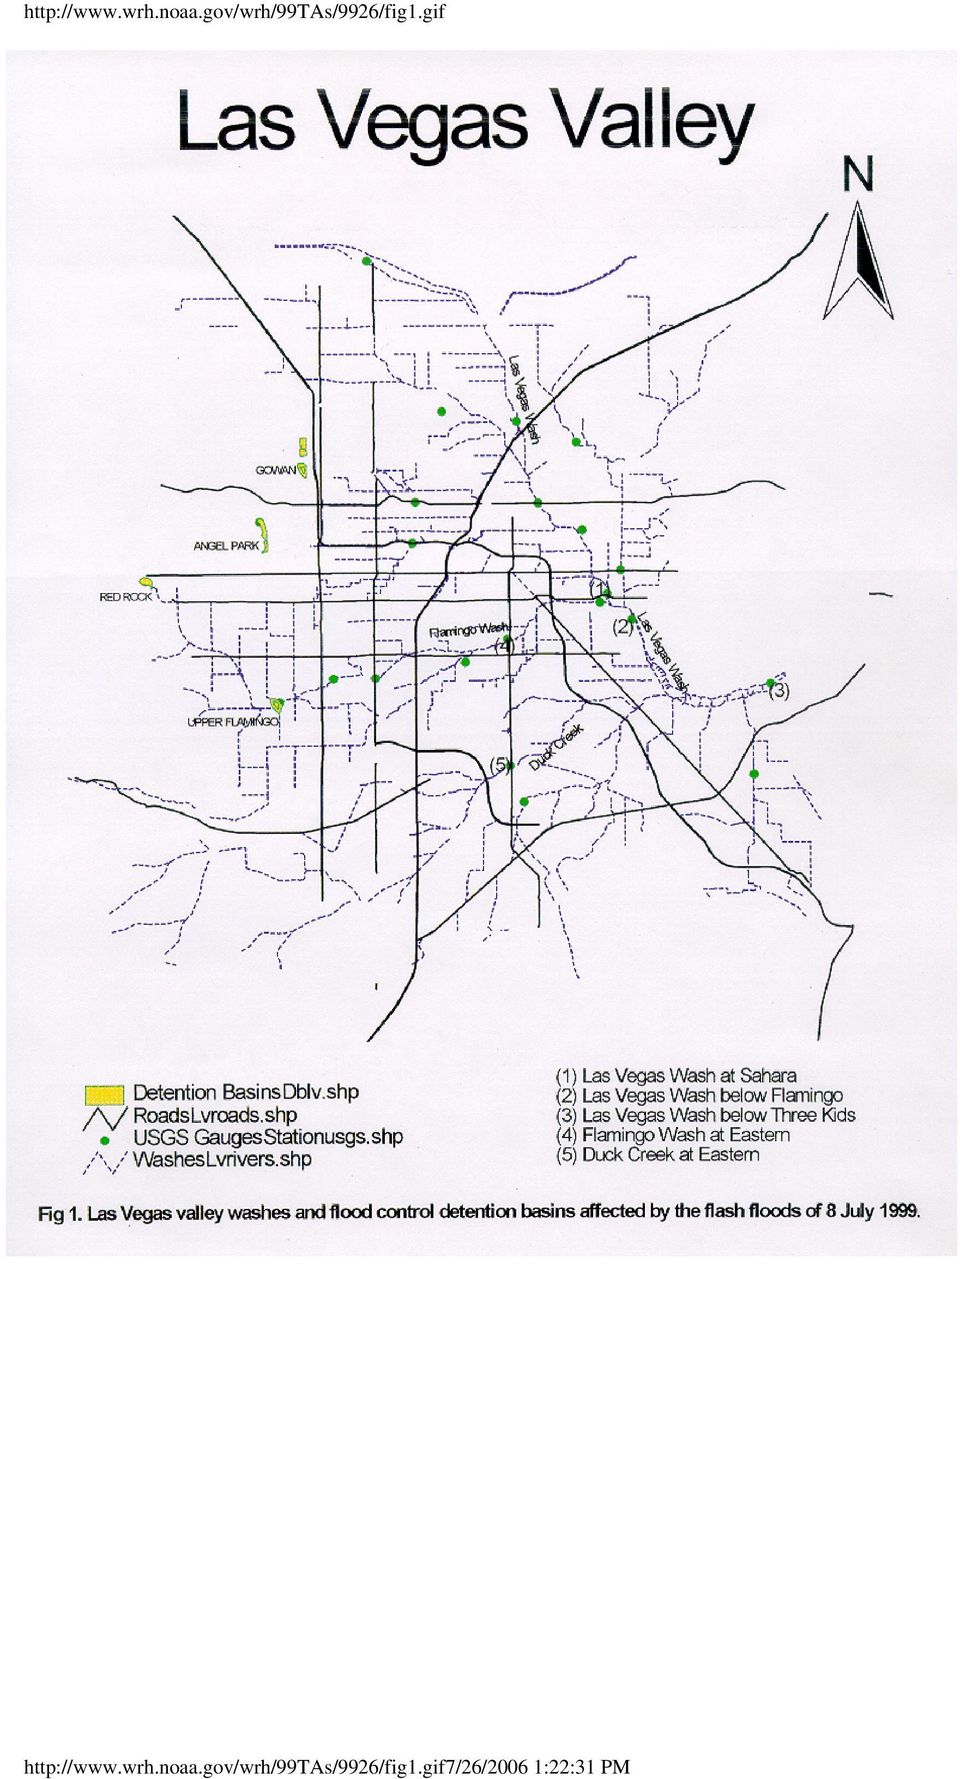
1 WESTERN REGION TECHNICAL ATTACHMENT NO November 9, 1999 THE LAS VEGAS FLASH FLOODS OF 8 JULY 1999: A POST-EVENT SUMMARY Jesus A. Haro, Harold R. Daley, Kim J. Runk - NWSO Las Vegas, Nevada Introduction Torrential rains produced severe, and in some cases, unprecedented flash-flooding across the Las Vegas valley on 8 July Much of the Las Vegas valley experienced from 35%-70% (1.5 to 3.0 inches) of its annual rainfall (4.13 inches) over the course of minutes ( LDT). The resulting runoff from these rains caused widespread street flooding and record flows in normally dry washes and flood control detention basins (Sutko, 1999). The floods caused over $20,000,000 in property damage and took two lives. Streets and washes were overwhelmed by the tremendous amount of rain over such a short period of time. Motorists and pedestrians were also unprepared for the magnitude of these floods, as over 200 swift-water rescues were performed by the Las Vegas and Clark County Fire Departments. The floods also caused severe erosion of unlined sections of certain washes and damaged numerous roadways. The Office of the Governor issued a Declaration of Emergency for the area and requested assistance from the Federal Emergency Management Agency on 15 July. President Clinton declared the city a disaster area on 19 July. Flash floods are not unusual in the Las Vegas valley (Runk and Kosier, 1998), however, this event was extreme in its scope and intensity. The purpose of this Technical Attachment (TA) is to review the meteorological conditions that preceded this event and discuss how the unique orography and urbanization of the Las Vegas valley contributed to the flash-flood threat. (1 of 5)7/26/2006 1:18:55 PM
.")
2 The Influence of Orography, Geology, Urbanization, and Flood Control Measures During the 8 July 1999 Flood Event The Las Vegas valley is located in the Basin and Range Physiographic Province (Purkey, 1994). This region is characterized by a series of generally north-south trending mountain ranges and intervening valleys filled with eroded sediments. The eroded sediments disperse from the mountains that surround the Las Vegas valley in the form of alluvial fans. These fans, and the washes they contain, funneled water from the valley eastward into the Las Vegas Wash (Fig. 1). This wash then flows into Lake Mead which is part of the Colorado River system. The Las Vegas valley is very prone to flash flooding due to its geologic and orographic composition. The Spring Mountains are located on the west side of the valley, while the Sheep Range borders the valley on the north. Smaller mountain ranges are located on the east and southeast sides of the valley. The Spring Mountains are composed primarily of limestone rock. The alluvial fans around the valley are coated with calcium carbonate which is part of the geologic composition of limestone. Calcium carbonate is better known as Caliche. Caliche is almost impervious, so when there is rainfall in the valley, almost 100% of it is runoff. These factors, along with the amount of urban development in this area, can often increase the severity and impact of flash flooding in the Las Vegas Valley. Oftentimes, roadways placed on the surface of the alluvial fans can act as rivers, channeling away runoff and exacerbating urban flooding. Furthermore, many city streets are not equipped with storm drains or have storm drains that are incapable of handling runoff associated with moderate to heavy rainfall. For the past two decades, the Clark County Regional Flood Control District has spearheaded the construction of flood control detention basins at strategic locations around the outskirts of the Las Vegas valley. This program has had a profound impact toward decreasing the severity of flooding in recent years. However, much of the rainfall on 8 July 1999 occurred downstream from these basins. Subsequently, much of the valley was vulnerable to flooding, though it is likely the flood damage would have been much more severe without the presence of the detention basins. For all of these reasons, the amount of rainfall needed to produce flash flooding across the Las Vegas valley is quite small. Generally, only 0.50 to 1.0 inch of rainfall is needed in a short amount of time. During the floods of 8 July 1999, much of the Las Vegas valley received in excess of 1.5 inches of rainfall over a minute period. Two automated rain gauges (one in the south and another in the west part of the valley) reported over 3.0 inches of rain (Fig. 2). Some of the flows in the washes exceeded the peak discharge of record (Fig. 1, Table 1). Additionally, many of the flood control detention basins stored impressive amounts of water (Table 2). Synoptic Overview The atmosphere over much of southern Nevada, northwest Arizona, and southeast California had experienced a tremendous increase in moisture levels prior to the flooding. This was the first major surge of moisture over the area in 1999 associated with the Mexican monsoonal flow pattern. ETA model graphics for the 1200 UTC model run of 8 July 1999 are used in this TA since the model had (2 of 5)7/26/2006 1:18:55 PM

3 the best initial analyses of the features in question. The ETA model initial analysis of precipitable water at 1200 UTC showed values well in excess of 1 inch across much of southern Nevada (Fig. 3). The axis of highest moisture values extended from southeast California, through the Las Vegas valley, and up into southwest Utah. Similarly, Convectively Available Potential Energy (CAPE) values were in excess of 1000 J Kg-1 over much of extreme southern Nevada (Fig. 4). The moisture and instability were readily apparent on the 1200 UTC 8 July 1999 Desert Rock (DRA) sounding (Fig. 5), which is located about 60 miles northwest of Las Vegas. What is notable about the sounding is that the deep, well-stratified moisture that is present suggests that the environmental relative humidity is high enough such that convective cold pools would not be strong enough to undercut the impinging storm-relative inflow to new updrafts. Thus, the mesoscale system could be maintained for an extended period of time. Also, extremely light winds throughout the depth of the troposphere, in concert with a rich moisture supply and deep layer of convective instability, provided the ingredients for very efficient rain rates. A catalyst in bringing the abundant moisture into the region was a westward-moving inverted trough in the middle levels of the atmosphere. Meteorological studies done in the desert southwest have shown that although significant moisture is often necessary for large-scale severe weather or heavy monsoonal rainfall to occur (Wallace, 1998; Haro and Bruce, 1997), such events are much more apt to occur when a mesoscale or synoptic-scale feature is present to support such an episode (Haro, 1998). The mid- and upper-level support provided by the inverted trough was strong enough to produce persistent nocturnal showers and thunderstorms over portions of northwest Arizona the night of 7 July 1999 and into the early morning hours of 8 July This persistent development immediately signaled that abundant daytime heating would not be necessary for showers and thunderstorms to develop over extreme southern Nevada. The ETA 1200 UTC 8 July 1999 initial analysis of 500 hpa geopotential heights and winds (Fig. 6) shows the inverted trough over the Arizona/California border, with a well-defined deformation zone over southern Nevada. The influence of the trough was evident in the ETA 6 hour forecast of absolute vorticity at 600 hpa and omega in the hpa layer (Fig. 7). In response to this deep-layered forcing, a well-defined surface convergence zone developed along the I-15 corridor from Mesquite, Nevada, through Las Vegas, to Barstow, California. This feature provided a focusing mechanism for initial convective development. Satellite and WSR-88D Products Summary Showers and thunderstorms began developing over northern portions of the Las Vegas valley by UTC ( LDT). The precipitation became more widespread after 1730 UTC and was oriented along the axis of greatest moisture and lift. Between UTC, heavy rainfall was affecting much of the western part of the valley. The Composite Reflectivity product from the Las Vegas (KESX) WSR-88D at 1832 UTC (Fig. 8) showed (3 of 5)7/26/2006 1:18:55 PM
 values were in excess of 1000 J Kg-1 over much of extreme southern Nevada (Fig. 4).")
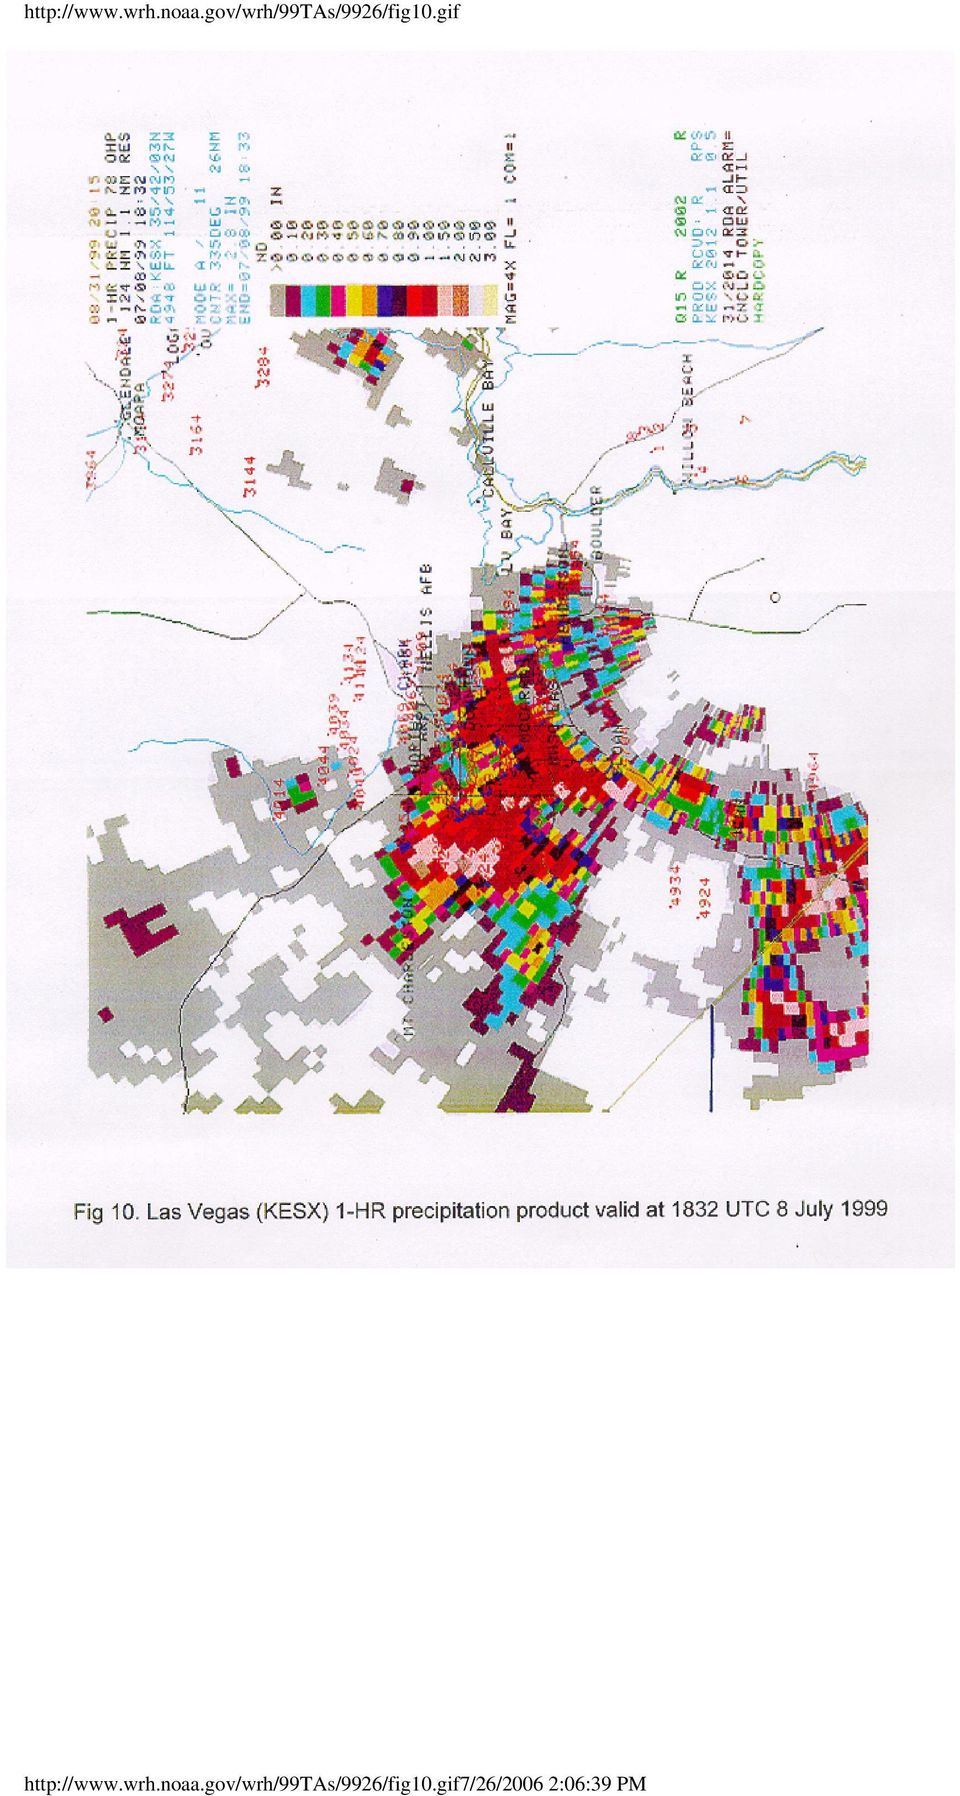
4 values well in excess of 50 dbz across much of the area. Infrared satellite imagery of the storms at 1900 UTC (at 4 km resolution) showed that the coldest cloud top temperatures with these storms were near -70 C (Fig. 9). One-hour precipitation estimates from the KESX radar were well in excess of 1.5 inches in many locales (Fig. 10). These estimates corresponded well to what was occurring in realtime and proved reliable to the radar operators on shift. Showers and thunderstorms gradually developed southwestward toward Barstow-Daggett, California along the axis of maximum moisture convergence. Storms eventually weakened and dissipated during the afternoon hours as the support provided by the inverted trough began to wane, and cold pool processes produced divergence in the boundary layer. It should be noted that although the most severe flooding occurred in the Las Vegas valley, flash-flooding also occurred over rural portions of northern Clark, southern Lincoln, and southern Nye Counties in Nevada, with minor flooding over southeast California. Conclusions Flooding of this magnitude across such a large swath of the Las Vegas valley was unprecedented in the eyes of many observers. This event fell between the 50 and 100-year flood criteria along portions of the Las Vegas Wash according to the U.S. Geological Survey (personal communication). Also, the extreme nature of this flood proved to be a stiff test for local emergency management officials, as well as to the flood control measures implemented by the Clark County Regional Flood Control District to deal with such events. This event also illustrated the significant influence that kinematic features can have on the development of organized storms over the desert southwest during the summer monsoon. While much is made of the moisture that often accompanies this seasonal wind pattern, experience has clearly shown that when this moisture combines with well-defined kinematic features, devastating results can occur. The response of the NWSO in Las Vegas during this event gave clear warning to local residents, media, and emergency management officials of the gravity of the weather situation. Most notably, an outlook statement was issued by the NWSO on 7 July 1999, specifically highlighting the possibility of flash floods the next day. A Flash Flood Watch was also issued at 0357 LDT that morning, warning of possible flash floods that day, a full 7 hours before the most severe flooding occurred. Short-term warnings were also issued efficiently and effectively. Given the unique geology and orography of the Las Vegas valley, it will remain vulnerable to flash floods through the foreseeable future. More and more people will become susceptible to these devastating floods as the Las Vegas valley continues to grow at a rate of 5,000-6,000 people per month. Although no amount of prevention can spare everyone from the effects of such floods, these effects can be mitigated through the continued work and intervention of the Clark County Regional Flood Control District and the National Weather Service. Acknowledgments (4 of 5)7/26/2006 1:18:55 PM

5 The authors thank the Clark County Regional Flood Control District and the U.S. Geological Survey for providing rainfall and streamflow data used in this TA. References Haro, J.A., 1998: Development of a Thunderstorm Risk Assessment Checklist for the Phoenix Metropolitan Area. National Weather Service Western Region Technical Attachment: No Haro, J.A. and M.A. Bruce, 1997: A brief climatology of the relationship between afternoon dew points and monsoonal rainfall at Phoenix Sky Harbor International Airport. National Weather Service Western Region Technical Attachment: No Purkey, B.W., E.M. Duebendorfer, E.I. Smith, J.G. Price, and S. B. Castor, 1994: Geologic tours in the Las Vegas area. Nevada Bureau of Mines and Geology special publication 16. Runk, K.J. and D.P. Kosier, 1998: Post-Analysis of the 10 August 1997 Southern Nevada Flash Flood Event. Natl. Wea. Dig., 22, Sutko, T.E., 1999: Rainfall Event Report, July 8, Clark County Regional Flood Control District. Wallace, C. E Convective storm environments in central Arizona during the summer monsoon. M.S. Thesis, School of Meteorology, University of Oklahoma. (5 of 5)7/26/2006 1:18:55 PM

6 1:22:31 PM
7 2:00:11 PM

8 2:01:30 PM

9 2:01:58 PM

10 2:05:03 PM

11 2:05:25 PM

12 2:05:43 PM

13 2:06:00 PM

14 2:06:25 PM

15 2:06:39 PM
16 2:00:31 PM

17 2:01:02 PM

Antecedent Conditions:
 Antecedent Conditions: Record to Near Record Heat occurred across Northeast & North Central Colorado September 2-8. A cold front moved across Northeast Colorado the morning of the 9 th, and deeper subtropical
Heavy Rainfall from Hurricane Connie August 1955 By Michael Kozar and Richard Grumm National Weather Service, State College, PA 16803
 Heavy Rainfall from Hurricane Connie August 1955 By Michael Kozar and Richard Grumm National Weather Service, State College, PA 16803 1. Introduction Hurricane Connie became the first hurricane of the
FLOOD FORECASTING PRACTICE IN NORTHERN CALIFORNIA
 FLOOD FORECASTING PRACTICE IN NORTHERN CALIFORNIA California Department of Water Resources Post Office Box 219000, Sacramento, California 95821 9000 USA By Maurice Roos, Chief Hydrologist ABSTRACT Although
Flash Flood Science. Chapter 2. What Is in This Chapter? Flash Flood Processes
 Chapter 2 Flash Flood Science A flash flood is generally defined as a rapid onset flood of short duration with a relatively high peak discharge (World Meteorological Organization). The American Meteorological
Arizona Climate Summary February 2015 Summary of conditions for January 2015
 Arizona Climate Summary February 2015 Summary of conditions for January 2015 January 2015 Temperature and Precipitation Summary January 1 st 14 th : January started off with a very strong low pressure
Multi-Jurisdictional Hazard Mitigation Plan
 Flooding General Flooding is the leading cause of death among all types of natural disasters throughout the United States, with its ability to roll boulders the size of cars, tear out trees, and destroy
Texas Department of Public Safety Texas Division of Emergency Management. Texas State Operations Center
 Texas Department of Public Safety Texas Division of Emergency Management Texas State Operations Center Situation Awareness Brief Saturday, July 20 th 2013 As of 0900 CDT Tropical Weather Outlook For the
Early Season Northwest Flow Snowfall Event 28 October 2008
 Early Season Northwest Flow Snowfall Event 28 October 2008 Scott Krentz NOAA/National Weather Service Greer, SC 1. Introduction A post frontal northwest flow snowfall event affected the mountains of North
P8.27 TWO RECORD BREAKING AUSTRALIAN HAILSTORMS: STORM ENVIRONMENTS, DAMAGE CHARACTERISTICS AND RARITY
 P8.27 TWO RECORD BREAKING AUSTRALIAN HAILSTORMS: STORM ENVIRONMENTS, DAMAGE CHARACTERISTICS AND RARITY B.W. Buckley *, W. Sullivan, P. Chan, M. Leplastrier Insurance Australia Group, Sydney, Australia
Project Title: Quantifying Uncertainties of High-Resolution WRF Modeling on Downslope Wind Forecasts in the Las Vegas Valley
 University: Florida Institute of Technology Name of University Researcher Preparing Report: Sen Chiao NWS Office: Las Vegas Name of NWS Researcher Preparing Report: Stanley Czyzyk Type of Project (Partners
How do Scientists Forecast Thunderstorms?
 How do Scientists Forecast Thunderstorms? Objective In the summer, over the Great Plains, weather predictions often call for afternoon thunderstorms. While most of us use weather forecasts to help pick
SITE SPECIFIC WEATHER ANALYSIS REPORT
 SAMPLE FLOOD ANALYSIS REPORT SITE SPECIFIC WEATHER ANALYSIS REPORT PREPARED FOR: Law Offices of Oliver Wendell Douglas Oliver Wendell Douglas PREPARED BY: November 29, 2007 CASE REFERENCE: Arnold Ziffel
Flood After Fire Fact Sheet
 FACT SHEET Flood After Fire Fact Sheet Risks and Protection Floods are the most common and costly natural hazard in the nation. Whether caused by heavy rain, thunderstorms, or the tropical storms, the
Convective Clouds. Convective clouds 1
 Convective clouds 1 Convective Clouds Introduction Convective clouds are formed in vertical motions that result from the instability of the atmosphere. This instability can be caused by: a. heating at
2013 State of Arizona Hazard Mitigation Plan State and County Descriptions
 Mohave County History / Geography Mohave County is located in northwest corner of Arizona and shares a border with California and Nevada along the Colorado River to the west, and Utah to the north. Its
WILLOCHRA BASIN GROUNDWATER STATUS REPORT 2009-10
 WILLOCHRA BASIN GROUNDWATER STATUS REPORT 2009-10 SUMMARY 2009-10 The Willochra Basin is situated in the southern Flinders Ranges in the Mid-North of South Australia, approximately 50 km east of Port Augusta
A. Flood Management in Nevada
 Nevada Division of Water Planning A. Flood Management in Nevada Introduction Flooding has been a concern for Nevada communities since the first settlers moved to the territory in the mid-1800 s. Fourteen
Climate of Illinois Narrative Jim Angel, state climatologist. Introduction. Climatic controls
 Climate of Illinois Narrative Jim Angel, state climatologist Introduction Illinois lies midway between the Continental Divide and the Atlantic Ocean, and the state's southern tip is 500 miles north of
The Pennsylvania Observer
 The Pennsylvania Observer August 3, 2009 July 2009 - Pennsylvania Weather Recap Written by: Dan DePodwin After a cool month of June, some hoped July would bring usual summertime warmth to the state of
Standard Operating Procedures for Flood Preparation and Response
 Standard Operating Procedures for Flood Preparation and Response General Discussion Hurricanes, tropical storms and intense thunderstorms support a conclusion that more severe flooding conditions than
Climatology and Monitoring of Dust and Sand Storms in the Arabian Peninsula
 Climatology and Monitoring of Dust and Sand Storms in the Arabian Peninsula Mansour Almazroui Center of Excellence for Climate Change Research (CECCR) King Abdulaziz University, Jeddah, Saudi Arabia E-mail:
Weather Briefing for Southeast Texas October 24 th, 2015
 Weather Briefing for Southeast Texas October 24 th, 2015 Dangerous Flash Flood Event Saturday through Sunday 8:16 AM Overview Ongoing: record deep moisture in place, elevated seas, rip currents, high surf,
The IPCC Special Report on Managing the Risks of Extreme Events and Disasters to Advance Climate Change Adaptation
 The IPCC Special Report on Managing the Risks of Extreme Events and Disasters to Advance Climate Change Adaptation A changing climate leads to changes in extreme weather and climate events 2 How do changes
The Development of an Evaporative Cooler Warning System for Phoenix
 The Development of an Evaporative Cooler Warning System for Phoenix, Arizona Adam J Kalkstein Laurence S. Kalkstein Presented to the NOAA/NWS Office, Phoenix, Arizona May, 2004 INTRODUCTION Previous research
Improved Warnings for Natural Hazards: A Prototype System for Southern California
 Improved Warnings for Natural Hazards: A Prototype System for Southern California Yehuda Bock Research Geodesist Scripps Institution of Oceanography University of California San Diego, La Jolla, Calif.
A SEVERE WEATHER CLIMATOLOGY FOR THE WILMINGTON, NC WFO COUNTY WARNING AREA
 A SEVERE WEATHER CLIMATOLOGY FOR THE WILMINGTON, NC WFO COUNTY WARNING AREA Carl R. Morgan National Weather Service Wilmington, NC 1. INTRODUCTION The National Weather Service (NWS) Warning Forecast Office
Hurricanes. Characteristics of a Hurricane
 Hurricanes Readings: A&B Ch. 12 Topics 1. Characteristics 2. Location 3. Structure 4. Development a. Tropical Disturbance b. Tropical Depression c. Tropical Storm d. Hurricane e. Influences f. Path g.
Storms Short Study Guide
 Name: Class: Date: Storms Short Study Guide Multiple Choice Identify the letter of the choice that best completes the statement or answers the question. 1. A(n) thunderstorm forms because of unequal heating
INTRODUCTION STORM CHRONOLOGY AND OBSERVATIONS
 THE MESOCYCLONE EVOLUTION OF THE WARREN, OKLAHOMA TORNADOES By Timothy P. Marshall and Erik N. Rasmussen (Reprinted from the 12th Conference on Severe Local Storms, American Meteorological Society, San
Flash Flood Guidance Systems
 Flash Flood Guidance Systems Introduction The Flash Flood Guidance System (FFGS) was designed and developed by the Hydrologic Research Center a non-profit public benefit corporation located in of San Diego,
Anyone Else Notice That Its Been Windy Lately?
 National Weather Service Aberdeen, South Dakota January 2014 Inside this issue: Has it Been Windy Lately or What? 2013 Year in Review 2013 Year in Review (cont.) 1 2 3 Has it Been Windy Lately or What?
FORENSIC WEATHER CONSULTANTS, LLC
 SAMPLE, CONDENSED REPORT DATES AND LOCATIONS HAVE BEEN CHANGED FORENSIC WEATHER CONSULTANTS, LLC Howard Altschule Certified Consulting Meteorologist 1971 Western Avenue, #200 Albany, New York 12203 518-862-1800
Note taker: Katherine Willingham (NSSL)
") SMART-R Event Log IOP 3 Project: Debris Flow Project Lat: 34.200610 Lon: -118.350563 Alt: 712 ft. Truck HD: 193 deg Date/Time SR1 ready for operation: 12 December 2240 UTC Site: BUR Airport, Burbank CA
SMART-R Event Log IOP 3 Project: Debris Flow Project Lat: 34.200610 Lon: -118.350563 Alt: 712 ft. Truck HD: 193 deg Date/Time SR1 ready for operation: 12 December 2240 UTC Site: BUR Airport, Burbank CA
Burnt River Black River and Gull River Flood Contingency Plan
 Burnt River Black River and Gull River Flood Contingency Plan Objective: The objective of this plan is to preplan and prepare for flooding events in the Burnt River, Black River and Gull River area of
Urban heat islands and summertime convective thunderstorms in Atlanta: three case studies
 Atmospheric Environment 34 (2000) 507}516 Urban heat islands and summertime convective thunderstorms in Atlanta: three case studies Robert Bornstein*, Qinglu Lin Department of Meteorology, San Jose State
OBSERVATIONS FROM THE APRIL 13 2004 WAKE LOW DAMAGING WIND EVENT IN SOUTH FLORIDA. Robert R. Handel and Pablo Santos NOAA/NWS, Miami, Florida ABSTRACT
 OBSERVATIONS FROM THE APRIL 13 2004 WAKE LOW DAMAGING WIND EVENT IN SOUTH FLORIDA Robert R. Handel and Pablo Santos NOAA/NWS, Miami, Florida ABSTRACT On Tuesday, April 13, 2004, a high wind event swept
The Boscastle Flood 2004
 The Boscastle Flood 2004 by Phil Bull Causes of the Flood Physical Causes The flood took Boscastle entirely by surprise - it was a flash flood event & the village is not prone to regular annual flooding
Pay Later: The Cost of Inaction
 FACTS NEVADA A M E R I C A N S E C U R I T Y P R O J E C T Pay Now, Pay Later: Nevada Two million people in Nevada depend on Lake Mead for daily water consumption. There is a 50% chance that it will be
HIGH RESOLUTION SATELLITE IMAGERY OF THE NEW ZEALAND AREA: A VIEW OF LEE WAVES*
 Weather and Climate (1982) 2: 23-29 23 HIGH RESOLUTION SATELLITE IMAGERY OF THE NEW ZEALAND AREA: A VIEW OF LEE WAVES* C. G. Revell New Zealand Meteorological Service, Wellington ABSTRACT Examples of cloud
Chapter 7 Stability and Cloud Development. Atmospheric Stability
 Chapter 7 Stability and Cloud Development Atmospheric Stability 1 Cloud Development - stable environment Stable air (parcel) - vertical motion is inhibited if clouds form, they will be shallow, layered
Satellite Weather And Climate (SWAC) Satellite and cloud interpretation
 Satellite and cloud interpretation") Satellite Weather And Climate (SWAC) Satellite and cloud interpretation Vermont State Climatologist s Office University of Vermont Dr. Lesley-Ann Dupigny-Giroux Vermont State Climatologist ldupigny@uvm.edu
Satellite Weather And Climate (SWAC) Satellite and cloud interpretation Vermont State Climatologist s Office University of Vermont Dr. Lesley-Ann Dupigny-Giroux Vermont State Climatologist ldupigny@uvm.edu
ANALYSIS OF THUNDERSTORM CLIMATOLOGY AND CONVECTIVE SYSTEMS, PERIODS WITH LARGE PRECIPITATION IN HUNGARY. Theses of the PhD dissertation
 ANALYSIS OF THUNDERSTORM CLIMATOLOGY AND CONVECTIVE SYSTEMS, PERIODS WITH LARGE PRECIPITATION IN HUNGARY Theses of the PhD dissertation ANDRÁS TAMÁS SERES EÖTVÖS LORÁND UNIVERSITY FACULTY OF SCIENCE PhD
THIRD GRADE WEATHER 1 WEEK LESSON PLANS AND ACTIVITIES
 THIRD GRADE WEATHER 1 WEEK LESSON PLANS AND ACTIVITIES WATER CYCLE OVERVIEW OF THIRD GRADE WATER WEEK 1. PRE: Comparing the different components of the water cycle. LAB: Contrasting water with hydrogen
Types of flood risk. What is flash flooding? 3/16/2010. GG22A: GEOSPHERE & HYDROSPHERE Hydrology. Main types of climatically influenced flooding:
 GG22A: GEOSPHERE & HYDROSPHERE Hydrology Types of flood risk Main types of climatically influenced flooding: 1. Flash (rapid-onset) 2. Lowland (slow-rise) 3. Coastal (not covered here) But! Causal factors
WeatherBug Vocabulary Bingo
 Type of Activity: Game: Interactive activity that is competitive, and allows students to learn at the same time. Activity Overview: WeatherBug Bingo is a fun and engaging game for you to play with students!
8B.6 A DETAILED ANALYSIS OF SPC HIGH RISK OUTLOOKS, 2003-2009
 8B.6 A DETAILED ANALYSIS OF SPC HIGH RISK OUTLOOKS, 2003-2009 Jason M. Davis*, Andrew R. Dean 2, and Jared L. Guyer 2 Valparaiso University, Valparaiso, IN 2 NOAA/NWS Storm Prediction Center, Norman, OK.
WV IMAGES. Christo Georgiev. NIMH, Bulgaria. Satellite Image Interpretation and Applications EUMeTrain Online Course, 10 30 June 2011
 WV IMAGES Satellite Image Interpretation and Applications EUMeTrain Online Course, 10 30 June 2011 Christo Georgiev NIMH, Bulgaria INTRODICTION The radiometer SEVIRI of Meteosat Second Generation (MSG)
Climate Extremes Research: Recent Findings and New Direc8ons
 Climate Extremes Research: Recent Findings and New Direc8ons Kenneth Kunkel NOAA Cooperative Institute for Climate and Satellites North Carolina State University and National Climatic Data Center h#p://assessment.globalchange.gov
INSTALLATION OF AN AUTOMATED EARLY WARNING SYSTEM FOR ANNOTTO BAY
 TERMS OF REFERENCE INSTALLATION OF AN AUTOMATED EARLY WARNING SYSTEM FOR ANNOTTO BAY A Community Disaster Risk Reduction Project funded through the Building Disaster Resilient Communities Project (ODPEM)
How to analyze synoptic-scale weather patterns Table of Contents
 How to analyze synoptic-scale weather patterns Table of Contents Before You Begin... 2 1. Identify H and L pressure systems... 3 2. Locate fronts and determine frontal activity... 5 3. Determine surface
Name Period 4 th Six Weeks Notes 2015 Weather
 Name Period 4 th Six Weeks Notes 2015 Weather Radiation Convection Currents Winds Jet Streams Energy from the Sun reaches Earth as electromagnetic waves This energy fuels all life on Earth including the
This chapter discusses: 1. Definitions and causes of stable and unstable atmospheric air. 2. Processes that cause instability and cloud development
 Stability & Cloud Development This chapter discusses: 1. Definitions and causes of stable and unstable atmospheric air 2. Processes that cause instability and cloud development Stability & Movement A rock,
South Dakota Severe Weather Awareness Week April 22nd through 26th
 National Weather Service Aberdeen, South Dakota April 2013 Inside this issue: Severe Weather Awareness Impact Based Warnings Impact Based Warnings (cont) Record Cold March Record Cold March (cont) Seasonal
Drought in the Czech Republic in 2015 A preliminary summary
 Drought in the Czech Republic in 2015 A preliminary summary October 2015, Prague DISCLAIMER All data used in this preliminary report are operational and might be a subject of change during quality control.
MIAMI-SOUTH FLORIDA National Weather Service Forecast Office http://www.weather.gov/miami
 MIAMI-SOUTH FLORIDA National Weather Service Forecast Office http://www.weather.gov/miami November 2014 Weather Summary Cooler and Drier than Normal December 1, 2014: Cooler than normal temperatures was
Basic Climatological Station Metadata Current status. Metadata compiled: 30 JAN 2008. Synoptic Network, Reference Climate Stations
 Station: CAPE OTWAY LIGHTHOUSE Bureau of Meteorology station number: Bureau of Meteorology district name: West Coast State: VIC World Meteorological Organization number: Identification: YCTY Basic Climatological
Basics of weather interpretation
 Basics of weather interpretation Safety at Sea Seminar, April 2 nd 2016 Dr. Gina Henderson Oceanography Dept., USNA ghenders@usna.edu Image source: http://earthobservatory.nasa.gov/naturalhazards/view.php?id=80399,
How To Assess Natural Hazards In Houston County, Minn.
 Natural Hazards Assessment Houston County, MN Prepared by: NOAA / National Weather Service La Crosse, WI Natural Hazards Assessment for Houston County, MN Prepared by NOAA / National Weather Service La
J4.1 CENTRAL NORTH CAROLINA TORNADOES FROM THE 16 APRIL 2011 OUTBREAK. Matthew Parker* North Carolina State University, Raleigh, North Carolina
 J4.1 CENTRAL NORTH CAROLINA TORNADOES FROM THE 16 APRIL 2011 OUTBREAK Matthew Parker* North Carolina State University, Raleigh, North Carolina Jonathan Blaes NOAA/National Weather Service, Raleigh, North
6.4 THE SIERRA ROTORS PROJECT, OBSERVATIONS OF MOUNTAIN WAVES. William O. J. Brown 1 *, Stephen A. Cohn 1, Vanda Grubiši 2, and Brian Billings 2
 6.4 THE SIERRA ROTORS PROJECT, OBSERVATIONS OF MOUNTAIN WAVES William O. J. Brown 1 *, Stephen A. Cohn 1, Vanda Grubiši 2, and Brian Billings 2 1 National Center for Atmospheric Research, Boulder, Colorado.
Model Output Statistics Provide Essential Data for Small Airports
 June 2006 NOAA s National Weather Service Volume 6, Number 2 Model Output Statistics Provide Essential Data for Small Airports By Scott C. Dennstaedt, Nationwide FAA Certified Flight Instructor scott@chesavtraining.com
NWS Melbourne Flood Briefing for Event Ending Today
 NWS Melbourne Flood Briefing for Event Ending Today Saturday March 6, 2010 900 AM Scott Spratt; Warning Coordination Meteorologist TRAINING SCENARIO FOR DISASTER RESISTANT COMMUNITIES GROUP TRAINING SCENARIO
EMERGENCY MANAGEMENT DECISION-MAKING DURING SEVERE WEATHER
 EMERGENCY MANAGEMENT DECISION-MAKING DURING SEVERE WEATHER Leigh A. Baumgart Ellen J. Bass Brenda Philips Kevin Kloesel University of Virginia University of Virginia University of Massachusetts University
CITY OF HIGHLAND PARK, ILLINOIS Stormwater Management Fact Sheet
 CITY OF HIGHLAND PARK, ILLINOIS Stormwater Management Fact Sheet WHAT IS STORMWATER MANAGEMENT? Stormwater management is the method for channeling rainfall through pipes and sewers away from property to
City of Salinas Flood Response Preparations
 City of Salinas Flood Response Preparations Winter Preparations Goals for 2015/2016 Community Preparedness in the event of flooding Media cooperation on safety and preparedness, public information sharing
Evalua&ng Downdra/ Parameteriza&ons with High Resolu&on CRM Data
 Evalua&ng Downdra/ Parameteriza&ons with High Resolu&on CRM Data Kate Thayer-Calder and Dave Randall Colorado State University October 24, 2012 NOAA's 37th Climate Diagnostics and Prediction Workshop Convective
How To Understand The Weather Patterns In Tallahassee, Florida
 PATTERN RECOGNITION OF SIGNIFICANT SNOWFALL EVENTS IN TALLAHASSEE, FLORIDA Jeffery D. Fournier and Andrew I. Watson NOAA/National Weather Service Weather Forecast Office Tallahassee, Florida Abstract Skew-T
Flood Facts 2F.1. Flood Facts
 Flood Facts 2F.1 Engage Flood Facts To introduce students to the causes and effects of flooding in Western Australia. Flooding occurs in the Australian environment as part of the natural water or hydrologic
Lower Raritan Watershed Management Area Stormwater & Flooding Subcommittee Strategy Worksheet LRSW-S3C1
 Strategy Name: Reduce Existing Potential for Flood Damages LRSW-S3C1. Develop and implement a program to: Minimize flood damages through the use of structural measures. Minimize flood damages through the
TOPIC: CLOUD CLASSIFICATION
 INDIAN INSTITUTE OF TECHNOLOGY, DELHI DEPARTMENT OF ATMOSPHERIC SCIENCE ASL720: Satellite Meteorology and Remote Sensing TERM PAPER TOPIC: CLOUD CLASSIFICATION Group Members: Anil Kumar (2010ME10649) Mayank
Weather Radar Basics
 Weather Radar Basics RADAR: Radio Detection And Ranging Developed during World War II as a method to detect the presence of ships and aircraft (the military considered weather targets as noise) Since WW
In a majority of ice-crystal icing engine events, convective weather occurs in a very warm, moist, tropical-like environment. aero quarterly qtr_01 10
 In a majority of ice-crystal icing engine events, convective weather occurs in a very warm, moist, tropical-like environment. 22 avoiding convective Weather linked to Ice-crystal Icing engine events understanding
6.9 A NEW APPROACH TO FIRE WEATHER FORECASTING AT THE TULSA WFO. Sarah J. Taylor* and Eric D. Howieson NOAA/National Weather Service Tulsa, Oklahoma
 6.9 A NEW APPROACH TO FIRE WEATHER FORECASTING AT THE TULSA WFO Sarah J. Taylor* and Eric D. Howieson NOAA/National Weather Service Tulsa, Oklahoma 1. INTRODUCTION The modernization of the National Weather
Mixing Heights & Smoke Dispersion. Casey Sullivan Meteorologist/Forecaster National Weather Service Chicago
 Mixing Heights & Smoke Dispersion Casey Sullivan Meteorologist/Forecaster National Weather Service Chicago Brief Introduction Fire Weather Program Manager Liaison between the NWS Chicago office and local
Real Time Flood Alert System (RTFAS) for Puerto Rico
 for Puerto Rico") Prepared in cooperation with the Puerto Rico Emergency Management Agency (PREMA) Real Time Flood Alert System (RTFAS) for Puerto Rico Overview The Real Time Flood Alert System is a web-based computer program,
Prepared in cooperation with the Puerto Rico Emergency Management Agency (PREMA) Real Time Flood Alert System (RTFAS) for Puerto Rico Overview The Real Time Flood Alert System is a web-based computer program,
A Review of Power Outages and Restoration Following the June 2012 Derecho
 A Review of Power Outages and Restoration Following the June 2012 Derecho Infrastructure Security and Energy Restoration Office of Electricity Delivery and Energy Reliability U.S. Department of Energy
EMERGENCY HOME PROTECTION. Homeowner's Guide for Emergency Flood Control. Contents INTRODUCTION
 EMERGENCY HOME PROTECTION Homeowner's Guide for Emergency Flood Control Contents Discussion or Section Page Number Introduction 3 Potential Flooding Periods 4 General Rules and Control Aids 5,6 Sandbags
2013 Annual Climate Summary for the Southeast United States
 Months of heavy rain forced the U.S. Army Corp of Engineers to open the spillways at Lake Hartwell, located at the headwaters of the Savannah River along the South Carolina-Georgia border, on July 9,.
Jessica Blunden, Ph.D., Scientist, ERT Inc., Climate Monitoring Branch, NOAA s National Climatic Data Center
 Kathryn Sullivan, Ph.D, Acting Under Secretary of Commerce for Oceans and Atmosphere and NOAA Administrator Thomas R. Karl, L.H.D., Director,, and Chair of the Subcommittee on Global Change Research Jessica
Preliminary advances in Climate Risk Management in China Meteorological Administration
 Preliminary advances in Climate Risk Management in China Meteorological Administration Gao Ge Guayaquil,Ecuador, Oct.2011 Contents China Framework of Climate Service Experience in Climate/disaster risk
United States Flood Loss Report Water Year 2014
 United States Flood Loss Report Water Year 2014 Executive Summary Direct flood damages during Water Year 2014 (October 1, 2013 September 30, 2014) totaled $2.86 billion, 36% of the thirty-year average
Emergency Management is responsible for coordinating the City of Houston s preparation for and response to emergency situations.
 CITY OF HOUSTON Office of Emergency Management October 2004 Emergency Management is responsible for coordinating the City of Houston s preparation for and response to emergency situations. Houston is exposed
Analyze Weather in Cold Regions and Mountainous Terrain
 Analyze Weather in Cold Regions and Mountainous Terrain Terminal Learning Objective Action: Analyze weather of cold regions and mountainous terrain Condition: Given a training mission that involves a specified
Texas Department of Public Safety Texas Division of Emergency Management. Texas State Operations Center
 Texas Department of Public Safety Texas Division of Emergency Management Texas State Operations Center Situation Awareness Brief Saturday, October 26 th 2013 As of 0900 CDT Tropical Weather Outlook Incidents
Air Masses and Fronts
 Air Masses and Fronts Air Masses The weather of the United States east of the Rocky Mountains is dominated by large masses of air that travel south from the wide expanses of land in Canada, and north from
FOR SUBSCRIBERS ONLY! - TRIAL PASSWORD USERS MAY NOT REPRODUCE AND DISTRIBUTE PRINTABLE MATERIALS OFF THE SOLPASS WEBSITE!
 FOR SUBSCRIBERS ONLY! - TRIAL PASSWORD USERS MAY NOT REPRODUCE AND DISTRIBUTE PRINTABLE MATERIALS OFF THE SOLPASS WEBSITE! 1 NAME DATE GRADE 5 SCIENCE SOL REVIEW WEATHER LABEL the 3 stages of the water
Evaluation of clouds in GCMs using ARM-data: A time-step approach
 Evaluation of clouds in GCMs using ARM-data: A time-step approach K. Van Weverberg 1, C. Morcrette 1, H.-Y. Ma 2, S. Klein 2, M. Ahlgrimm 3, R. Forbes 3 and J. Petch 1 MACCBET Symposium, Royal Meteorological
Daily Operations Briefing Sunday, May 24, 2015 8:30 a.m. EDT
 Daily Operations Briefing Sunday, May 24, 2015 8:30 a.m. EDT Significant Activity May 23-24 Significant Events: Flooding Southern Plains Tropical Activity: Atlantic Tropical cyclone activity not expected
Monsoon Variability and Extreme Weather Events
 Monsoon Variability and Extreme Weather Events M Rajeevan National Climate Centre India Meteorological Department Pune 411 005 rajeevan@imdpune.gov.in Outline of the presentation Monsoon rainfall Variability
Climate Trends In New England and Its Impact on Storm Behavior; Riverine and Coastal Flood Impacts
 2 ND ANNUAL CAPE COASTAL CONFERENCE JUNE 6 Linking Science with Local Solutions and Decision-Making Climate Trends In New England and Its Impact on Storm Behavior; Riverine and Coastal Flood Impacts David
FFY 2016 PROPOSAL. Contact Information. Surprise Police Department ADDRESS 14250 W. Statler Plaza, #103
 FFY 2016 PROPOSAL Contact Information AGENCY NAME Surprise Police Department ADDRESS 14250 W. Statler Plaza, #103 CITY Surprise COUNTY Maricopa PHONE (623) 222-4000 FAX (623) 222-4009 WEBSITE www.surpriseaz.gov
Comparative Evaluation of High Resolution Numerical Weather Prediction Models COSMO-WRF
 3 Working Group on Verification and Case Studies 56 Comparative Evaluation of High Resolution Numerical Weather Prediction Models COSMO-WRF Bogdan Alexandru MACO, Mihaela BOGDAN, Amalia IRIZA, Cosmin Dănuţ
IMPACT OF SAINT LOUIS UNIVERSITY-AMERENUE QUANTUM WEATHER PROJECT MESONET DATA ON WRF-ARW FORECASTS
 IMPACT OF SAINT LOUIS UNIVERSITY-AMERENUE QUANTUM WEATHER PROJECT MESONET DATA ON WRF-ARW FORECASTS M. J. Mueller, R. W. Pasken, W. Dannevik, T. P. Eichler Saint Louis University Department of Earth and
Risk and vulnerability assessment of the build environment in a dynamic changing society
 Risk and vulnerability assessment of the build environment in a dynamic changing society Limnei Nie SINTEF Building and infrastructure, P.O.Box 124 Blindern, NO-0314 Oslo, Norway. linmei.nie@sintef.no
Cloud seeding. Frequently Asked Questions. What are clouds and how are they formed? How do we know cloud seeding works in Tasmania?
 What are clouds and how are they formed? Clouds are composed of water droplets and sometimes ice crystals. Clouds form when air that is rich in moisture near the Earth s surface rises higher into the atmosphere,
CRS 610 Ventura County Flood Warning System Website
 CRS 610 Ventura County Flood Warning System Website Purpose This document gives instructions and a description of the information available via the Ventura County Watershed Protection District s (VCWPD)
Cumulifor m clouds develop as air slowly rises over Lake Powell in Utah.
 Cumulifor m clouds develop as air slowly rises over Lake Powell in Utah. Figure 6.1 Dew forms on clear nightswhen objects on the surface cool to a temperature below the dew point. If these beads of water
Chapter Overview. Seasons. Earth s Seasons. Distribution of Solar Energy. Solar Energy on Earth. CHAPTER 6 Air-Sea Interaction
 Chapter Overview CHAPTER 6 Air-Sea Interaction The atmosphere and the ocean are one independent system. Earth has seasons because of the tilt on its axis. There are three major wind belts in each hemisphere.
United States Flood Loss Report - Water Year 2012
 United States Flood Loss Report - Water Year 2012 Executive Summary Direct flood damages during Water Year 2012 (October 1 st 2011-September 30 th 2012) totaled $0.50 billion. This damage total is only
Disaster Risk Reduction through people centered National Multi-hazard Early Warning System in the context of Maldives
 Disaster Risk Reduction through people centered National Multi-hazard Early Warning System in the context of Maldives Abdul Muhusin, Deputy Director Department of Meteorology, Maldives Fourth Technical