PINAR SÜT MAMULLERİ SAN. A.Ş Earnings Presentation
|
|
|
- Owen Lewis
- 8 years ago
- Views:
Transcription

1 PINAR SÜT MAMULLERİ SAN. A.Ş 2012 Earnings Presentation

2 Pınar Süt Highlights Innovator and pioneer More than 200 SKUs R&D expertise #1 brand that comes to mind* Best brand in dairy ** Most sincere milk brand *** Among top 4 brands Turkish consumers feel closest to**** Best fruit juice brand ***** One of the top ten most reputable brands ****** Superbrands #10 ******* Hygienic and EU standard production Technical Expertise and sectoral know-how Product Portfolio Brand Production Healthy, pure and standardized products ISO ISO ISO HACCP FSSC YBP Turkey s biggest nationwide cold and frozen distribution chain More than sales points Technical know-how and expertise Synergy in the distribution of dairy and meat products Supply from more than producers Continuous quality control in each step Strong relations with farmers More than 200 contracted farms producing in EU standards Farms which are free of illness and approved Training and consultancy services Quality Distribution Network Supply * GFK 2011 ** Kalder (TMME Endeksi) 2012 ***Mediacat&IPSOS 2012 ****Nielsen 2010 ***** Kalder (2012 TMME Endeksi) ****** 1 GFK&Repman 2012 *******Superbrands 2012

3 Market Dynamics - I Annual raw milk production is 714 million tons in the world; about 15 million tons in Turkey (Tetra Pak, Turk Stat) Turkey is 15 th in world s league, Growth is expected in the milk production/import of developing and growing countries. World total milk and milk products market reached 300 bn liters in It constitutes 18% of all beverages. Per capita consumption of dairy products is 44 liters in the world. 47 liters is expected to come out in World Milk Consumption (billion Lt) ,5 Per Capita Liquid Milk Consumption (lt) (t) Source: Tetra Pak, Dairy Index Mayıs 2012 Per Capita Milk Consumption in Turkey (lt) Source: Tetra Pak Source: Tetra Pak 2
 90 80 72,5 Per Capita Liquid Milk Consumption (lt) 120 80 40 0 47 49 42 52 99 66 57 37 30 33 6 13 24 50 2011 2014 (t) Source: Tetra Pak, Dairy Index")
4 Market Dynamics - II Processed Food Products Prices Raw Milk Base Price in Turkey (TL/lt) ,95 TL 0,80 TL 0,65 TL Source: TUİK, TCMB 0,50 TL Jan Apr Jul Oct Raw MilBase k Prices for Producers Packaged Milk and Cheese Penetrations 91,5 92,1 90,3 90,0 87,8 83,9 Rising raw milk prices Increasing feed prices Processed Meat and Dairy Products retail prices had an upward movement in Source: HTP Ambalajlı Packaged Sütler Milk Ambalajlı Packaged Peynir Cheese 3


5 Market Shares - I 3,5 3,0 2,5 2,0 1,5 1,0 0,5 0,0 Süt Ürünleri Pazarı (milyar TL) 16,3% 17,0% 17,9% Pınar Ciro Payı 2,52 2,70 2,81 2, ,5% Source: Nielsen Total dairy products are included milk, yoghurt, spreadable cheese, butter and ayran. Measurable dairy market has grown by 4,4% in terms of value but has narrowed by %8,3 in terms of volume in (Nielsen) Food category has decreased its share within FMCG from %48,4 to %47,1 in (Nielsen) Plain milk comprises 65% of the total mik market and Pınar Süt has a share of 32% market share in this, which is more 2,5 times more than the nearest competitor. (Nielsen) Our marketing activities continued to increase the market share in Significant market share gains were obtained in our value-added products. 4 20% 15% 10% 5% 0% 100% 80% 60% 40% 20% 0% Products Pınar UHT Light Milk En Nearest Yakın Rakip Competitor Total UHT Milk Source: Nielsen, Value Share Spreadable Cheese Market Share Position UHT Light Milk 65% Leader Total UHT Milk 32% Leader Organic Milk 100% Leader Enriched Milk (Kids) 54% Leader Butter 17% Second Homogenized Yoghurt 10% Third Spreadable Cheese 42% Leader Fresh Cheese 82% Leader Labaneh 56% Leader Cream Cheese 24% Leader Source: Nielsen, Value Share Fresh Cheese Labaneh
 Plain milk comprises 65% of the total mik market and Pınar Süt has a share of 32% market share in this, which is more 2,5 times more than the nearest competitor.")
6 Market Shares - II 64,2% 64,5% 60,3% 58,9% UHT Light Süt (Lider) 40,9% 39,0% 39,2% 41,8% Toplam UHT Süt (Lider) 26,7% 27,1% 30,1% 31,8% Sürülebilir Peynir (Lider) 16,9% 18,4% 17,0% 17,2% Tereyağı (İkinci) 9,8% 10,9% 11,0% 10,1% Homojenize Yoğurt (Üçüncü) Source: Nielsen, - Value Share 5
 2009 2010 2011 2012 Source: Nielsen, -")
7 New Launches & Product Differentiations New tastes that respond to market tastes, reinforcing our expertise. New launches for different consumer segments. Multipackages and promotions providing convenience for consumers.

8 Pınar Beyaz Çikolatalı Campaings TV Outdoor Activities

9 Pınar Beyaz Campaigns

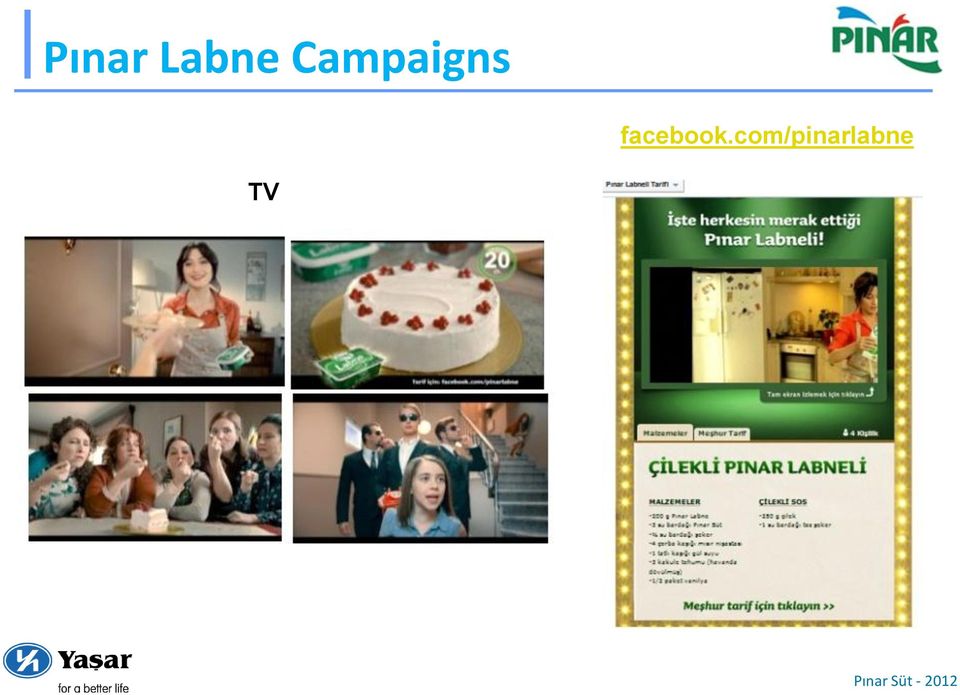
10 Pınar Labne Campaigns facebook.com/pinarlabne TV
11 Pınar Cream Cheese Campaigns TV Flashmob


12 Pınar Kido Campaigns Advertisements Magazine Book Newspaper

13 Pınar Sade Süt Campaigns TV Classic Package

 Export 10% Direct 3% 13")
14 Breakdown of Net Sales by Product Groups & Sales Channels Products Groups (2012) Fruit Juice; 6% Sauce; 5% Others; 7% Milk; 36% Butter; 7% Yoghurt & Ayran; 12% Cheese; 28% Sales Channels (2012) Export 10% Direct 3% 13 YBP 87%
 Export 10% Direct 3%")
15 Million TL Growth in Sales Growth Rates of Product Groups 7% % % 12% 18% 18% 50 0 Sauce Sos Fruit Meyve Juice Suyu Butter Tereyağ Others Yoğurt Yoghurt&Ayran ve Peynir Cheese Süt Milk Ayran Net Sales have grown by 11,7% in


16 Export Pınar realizes 22% of Turkey s Dairy Products Exports itself Export income was increased by %20 in terms of USD and %33 in terms of TL. Exports to 29 different countries which are Middle East, Europe, USA and Asia. In 2012 in Switzerland, Hong Kong and Afghanistan joined into Pinar Süt exporting countries. Pınar Labane Cheese have high market shares In Saudi Arabia, Kuwait and UAE which are respectively %35, %50 ve %35. Foreign Sales by Countries (2012) Azerbaijan; 5% Iraq; 17% Egypt; 3% Others; 11% UAE; 9% Bahrain; 3% Qatar; 4% Kuwait; 13% Moreover, long-life milk, white cheese, Pınar Beyaz, whole cream, fruit juice, yoghurt and ayran is exported to Gulf countries. Export sales have tripled from 2002 to As one of the most valuable Turkish brands, part of the project supported by the Turkish government.. Pinar Süt is among the first companies included in Turquality Project. The first 5 years of project completed succesfully; taking part in second 5 year was obtained. The vision of Turquality is Create 10 world brands in 10 years. Foreign Sales by years (Million USD) 8% 14,5 Cyprus; 6% S.Arabia; 28% İhracatın Share of Net Export Satışlar İçindeki Total Payı Sales 7% 11% 7% 9% 28,0 24,6 24,4 21,1 10% 9% 8% 8% 39,9 33,3 29,7 29,
 Azerbaijan; 5% Iraq; 17% Egypt; 3% Others; 11% UAE; 9% Bahrain; 3% Qatar; 4% Kuwait; 13% Moreover, long-life milk, white cheese, Pınar Beyaz, whole cream, fruit")
17 FİNANCİAL RESULTS
18 Sales and Profitability Net Sales (Mn TL) Net Profit (Mn TL) 482,8 480,7 577,1 651,1 727,1 57,8 60,1 72,9 54,8 34, In 2012 sales have grown by %11,7, in both value and volume terms. Growth in volume terms is by %2. In accordance with our strategies, we have focused on market investments and achieved growth in sales and market shares. EBITDA* (Mn TL) 70,9 63,4 84,6 67,8 Base raw milk price system is in place, as a result of National 51,9 Milk Council s practices. The higher average milk prices, which is above by %18 YoY, narrowing market and increasing competition in the market have had a negative impact on our profitability. * Earnings (ex. other income and expenditures) before tax, dep. and amortization

19 Income Statement (Million TL) Difference % Change Net Sales 727,1 651,1 76,0 11,7 Cost of goods Sold (582,2) (517,3) (64,8) 12,5 Gross Profit 145,0 133,8 11,2 8,4 R&D Expenses (7,2) (5,6) (1,7) 29,9 Sales, Distribution and MarketingExpenses (54,9) (35,3) (19,6) 55,5 General Administration Expenses (33,1) (24,5) (8,6) 35,0 EBIT 49,8 68,4 (18,6) (27,3) Share of Results of Investments in Associates 3,1 7,4 (4,2) (57,3) Other Income 7,5 8,6 (1,2) (13,5) Other Expenses (2,0) (2,8) 0,8 (29,3) Financial Income (Net) 3,4 1,7 1,7 103,0 Profit Before tax 61,8 83,3 (21,5) (25,8) Tax (7,0) (10,4) 3,4 (32,5) Net Profit for the Period 54,8 72,9 (18,1) (24,8) EBITDA 67,8 84,6 (16,8) (19,9) Total Assets 616,9 625,6 (8,7) (1,4) Equity 435,7 439,0 (3,2) (0,7) 18
 (57,3) Other Income 7,5 8,6 (1,2) (13,5) Other Expenses (2,0) (2,8) 0,8 (29,3) Financial Income (Net) 3,4 1,7 1,7 103,0 Profit Before tax 61,8 83,3 (21,5) (25,8) Tax (7,0) (10,4)")

20 Growth Analysis %7,0 %0,7 %4,0 %11,7 727,1 Mn TL 651,1 Mn TL 2011 Miktar Fiyat ve Ürün Miksi 19 Kur 2012

21 Profit Margins Gross Profit Margins(%) Operating Margins* (%) 18,0% 20,5% 19,9% 21,6% 25,1% 17,2% 8,4% 10,5% 6,8% 10,7% 8,3% 6,3% Q11 4Q12 3Q Q11 4Q12 3Q12 EBITDA Margins ** (%) Net Profit Margins (%) 13,0% 13,0% 11,9% 10,4% 11,2% 10,3% 11,0% 9,3% 8,3% 8,4% 7,5% 6,9% Q11 4Q12 3Q Q11 4Q12 3Q12 * Ex. Other income and expenditures ** Earnings before Interest, Tax, Depreciation, and Amortization 20
22 Quarterly Results Net Sales (Mn TL) Product price increases, depending on the positive developements in the market, have improved our gross margin in Q compared to Q. Similarly, a significant improvement was achieved in the profit margins in Q, compared to the third quarter of 2012 EBITDA* (Mn TL) Q11 4Q12 3Q12 16 Price competition is continuing in the market. In accordance with our strategy of growing beyond market, we have focused on market investments. 4Q11 4Q12 3Q12 * Earnings before Interest, Tax, Depreciation, and Amortization 21

23 Mn TL Basic Ratios, Net Financial Debt & Net Working Capital Dec 31, 2012 Dec 31, 2011 (Milyon TL) Dec 31, 2012 Dec 31, 2011 Current ratio 1,64 1,81 Cash & Cash Equivalents 4,51 4,99 Leverage ratio 0,29 0,30 S/T Bank Borrowings 15,52 20,45 S/T Fin Debt/T. Fin Debt 0,99 0,58 L/T Bank Borrowings 0,13 15,07 Net Financial Debt/EBITDA 0,16 0,36 Net Financal Debt 11,15 30,54 Total Fin Debt/Equity 0,04 0, Trade Recevables Trade Payables Inventories A 49% rise in net cash generated from operating activities ,9 Mn TL 49,0 Mn TL Continuous focus on risk management and productivity Effective working capital management Strong balance sheet and liquidity management 22
24 Dividends 89,4% 79,7% 69,2% 78,2% 88,2% 84,6% 70,9% 1,22 TL 0,96 TL 0,96 TL 0,59 TL 5,1% 0,08 TL 0,32 TL 7,7% 0,37 TL 5,9% 8,7% 19,6% 0,13 TL 3,3% 10,7% 5,8% 7,1% Hisse Dividends Başı Net Per Temettü Share Temettü Payout Ödeme Ratio Oranı Temettü Dividend Verimi Yield (Net)
25 Overview of 2012 Volatiliy in the raw milk prices was decreased as a result of National Milk Council s base price system. However, the average row milk prices were %18 above 2011 in The costs have increased in 2012, particularly a %19 increase in the energy costs. Following our strategy of increasing our market shares we have focused on marketing investments and increased our market shares in New products and new variations in packaging have been launched. Cost savings, measures to decrease expenses and projects improving efficiency in production have continued. (OMI-Lean Six Sigma Projects) 24
26 Strategies and Targets Growing above market growth rates in the segments we operate in, with ; Effective price management Widespread distribution network Efficient utilization of social media Developments in Away From Home channel Increasing export sales also in countries falling outside Gulf region Continued marketing investment TARGETS Growth in Net Sales: %13-15 EBITDA Margin: %10-11 Capex: 100 Mn TL 25


27 Şanlıurfa Investment Pınar Süt Şanlıurfa plant, which will be established on a land of 100 thousand m², will have a capacity of 180 million litres/year with raw milk collected from Şanlıurfa and cities around it. The milk and dairy products will be produced in the factory. The product range will be expanded depending on the needs. The benefits from the region's proximity to the export markets will be provided. Investment incentives of Region-6 The plant is projected to cost 100 million TL and to commence its operations by the end of

28 Ownership & Participation Structure Share Performance Ownership Share Performance Free Float Relative and Absolute Performance of Pınar Süt Et Shares = ,00 16,80 15,00 105,85 10,00 5,00 0,00 Relative İMKB-TÜM'e to ISE-TUM göre (sol eksen) (left axis) PNSUT (Sağ (Right eksen) Axis) CORPORATE GOVERNANCE RATİNG: 8,87 %31,8 %44,9 %30,5 %12,6 %5,5 %8,8 27
29 Disclaimer and Contact Information This presentation does not constitute an offer or invitation to purchase or subscription for any securities and no part of it shall form the basis of or be relied upon in connection with any contract or commitment whatsoever. This presentation contains forward-looking statements that reflect the company management s current views with respect to certain future events. Although it is believed that the expectations reflected in these statements are reasonable, they may be affected by a variety of variables and changes in underlying assumptions that could cause actual results to differ materially. Neither Pınar Süt Mamulleri San. A.Ş. nor any of its affiliates, advisors, representatives, directors, managers or employees nor any other person shall have any liability whatsoever for any loss arising from any use of this presentation or its contents or otherwise arising in connection with it. Company s financial statements are available on and websites. Investor Relations Department Tel: Fax: investorrelations@pinarsut.com.tr 28

30 Thank You
31 APPENDIX
32 Company History Pioneer and Leader of Modern Turkish Dairy The first UHT milk and packaged dairy products plant in Turkey was founded (biggest milk production facility in the Middle East): PINAR SÜT 1997 Pınar SÜT new plant 1982 founded in Eskişehir Milk, cheese, butter, yoghurt amd milk with tarwberry began to be exported the Central European and Middle East countries and the TRNCyprus Agreement with Sodima SAS for the production of fruit yoghurt under Yoplait brand was introduced to Turkish customer 2005 First organic milk in Türkiye, Pınar Organic Milk, probiotic products, were introduced Pınar Kido with Biscuit, Pınar Çocuk with Honey and Kahvaltı Keyfi white cheese are introduced Pınar Süt, Lean Six Sigma has been started to applied for the first time in the F&B sector in Turkey 2011 Cream Cheese with cheddar and thymeolive Organic Yognurt Pınar Sliced Kaşar Cheese and Cream Cheese were introduced Kraft-Pınar Cooperation was established Pınar Fodder was established Labne was introduced in the domestic market Production of Labne, milk, ayran, butter, yoghurt, cheese, mayonnaise, cream. Export of many products to Kuwait, Cyprus and Germany began Functional milk was introduced Light mayonnaise was introduced UHT plastic bottled milk introduced YOPİ is introduced Pınar Kafela, Karamela and Çikola were introduced was established 2008 Milk for children, Pınar Çocuk is introduced 2009 Pınar Lemonade
33 Supply - Raw Milk Collection Process Keen focus on milk collection processes: FARMS LOCAL PROUCERS Route optimization; increase in truck fill rate and L/km rate (TL 1m cost savings) Successful Raw milk supply constitutes an important entry barrier to potential competitors VILLAGES COOPS TRADERS COOLING CENTERS PRODUCTION TRANSPORTATION ORGANIC MILK Competitive advantage due to strong long term relationship with milk suppliers since 1975 Agreements with suppliers to ensure a steady raw milk supply Continuous quality and control in each step of milk collection (fully complied with EU requirements, tests in raw milk laboratories on daily basis ) Raw milk from 380 cooling centers through advanced collecting systems twice a day More than 200 contracted farms producing in EU standards 32


34 Sales & Distribution Yaşar Birleşik Pazarlama; Turkey s biggest nationwide cold & frozen distribution chain The distribution of food & beverage products are realized in -18 C vehicles for frozen products, +4 C vehicles for fresh products and classic vehicles for the rest The know-how and strong track record in the cold chain applications with a cold and frozen distribution chain and storage conditions is a considerable asset for the Group Strategically located distribution network throughout Turkey, by latest technology and flexible organization; over 150,000 sales points with a dedicated sales personnel Group sales reflects homogeneous regional dispersal all around the Turkey YBP Ownership Structure PINAR SÜT; 32% PINAR ET; 38% Directorate HQ District Offices Dealers Others DİĞER; 8% YAŞAR HOLDİNG ; 22% 33
PINAR SÜT MAMULLERİ SAN. A.Ş. 2013 H1 Earnings Presentation
 PINAR SÜT MAMULLERİ SAN. A.Ş 2013 H1 Earnings Presentation Pınar Süt Highlights Innovator and pioneer More than 200 SKUs R&D expertise Product Portfolio #1 brand that comes to mind* Best brand in dairy
Company History. Pioneer and Leader of Modern Turkish Dairy 1975... Pınar Süt. Page 1
 PINAR SÜT MAMULLERİ SAN. A.Ş Company History Pioneer and Leader of Modern Turkish Dairy 1975... The first UHT milk and packaged dairy products plant in Turkey was founded (biggest milk production facility
2011 Q3 Investor Presentation
 PINAR ENTEGRE ET VE UN SAN. A.Ş. 2011 Q3 Investor Presentation Pınar Et Highlights Innovative and pioneer More than 300 SKUs R&D expertise #1 processed meat brand that comes to mind* Most admired brand
PINAR SU SANAYİ VE TİCARET A.Ş.
 PINAR SU SANAYİ VE TİCARET A.Ş. Pınar Su Highlights 2nd brandthatcomesto mindin PET andpc categories(nielsen 2009) 363PC, 168PET dealers Call Center application HACCP Food Security Management System NSF
History 1985-86 2007-2008. Pınar Madran water packed in demijohns was introduced 2003
 PINAR SU SANAYİ VE TİCARET A.Ş History 1984 Potable water (for the first time) in nonrecycled package... Pınar Şaşal 1985 1985-86 Pınar Şaşal was exported to Germany for the first time Pınar Şaşal in PVC
2011 Earnings Presentation
 PINAR ENTEGRE ET VE UN SAN. A.Ş. 2011 Earnings Presentation Highlights Innovative and pioneer More than 300 SKUs R&D expertise Product Portfolio #1 processed meat brand that comes to mind* Most admired
the best milk and dairy products brand.
 18- Pınar Süt Annual Report 2010 Assessment of 2010 Activities The best milk and dairy products brand* As a result of its effective management, production, marketing, and sales activities in 2010, Pınar
PINAR SU SANAYİ VE TİCARET A.Ş. INVESTOR PRESENTATION
 PINAR SU SANAYİ VE TİCARET A.Ş. INVESTOR PRESENTATION 2009, August 1 PRESENTATION OVERVIEW Yaşar Group at a Galance Bottled Water Market EU Conformity Period Company Overview Financial Performance 2 Disclaimer
PINAR SU SANAYİ VE TİCARET A.Ş. INVESTOR PRESENTATION
 PINAR SU SANAYİ VE TİCARET A.Ş. INVESTOR PRESENTATION April 2008 1 Disclaimer This presentation does not constitute an offer or invitation to purchase or subscription for any securities and no part of
Klöckner & Co SE. Q3 2014 Results
 Klöckner & Co SE A Leading Multi Metal Distributor Gisbert Rühl CEO Q3 2014 Results Press Telephone Conference November 6, 2014 Disclaimer This presentation contains forward-looking statements which reflect
2Q FY2015 Results. 15 December 2014. Del Monte Pacific Limited
 2Q FY2015 Results 15 December 2014 Del Monte Pacific Limited Disclaimer This presentation may contain statements regarding the business of Del Monte Pacific Limited and its subsidiaries (the Group ) that
How To Know More About The Company
 BİSKÜVİ SANAYİ A.Ş. This presentation contains information and analysis on financial statements and is prepared for the sole purpose of providing information relating to Ülker Bisküvi Sanayi A.ġ.(Ülker
Mouwasat Medical Services Company - Mouwasat
 Recommendation Overweight Fair Value (SR) 92.00 Price as of 2 nd of March 2014 (SR) 81.75 Expected return 12.5% Company data Tadawul symbol 4002.SE 52- week high (SR) 94.00 52-week low(sr) 52.25 YTD change
Yara International ASA Third Quarter results 2012
 Yara International ASA Third Quarter results 212 19 October 212 1 Summary third quarter Strong results and cash flow Yara-produced NPK deliveries up 1% Strong production increase Cautious start to European
WSE IV International Companies Conference 4-5 June 2013
 Company Presentation WSE IV International Companies Conference 4-5 June 2013 Contents Business update 3 Segment update 6 Financial update 12 2 Investment program update 17 Appendices 19 1 Business update
IFGL REFRACTORIES LTD. RESULT UPDATE PRESENTATION, February 2016
 IFGL REFRACTORIES LTD RESULT UPDATE PRESENTATION, February 2016 Safe Harbor This presentation and the accompanying slides (the Presentation ), has been prepared by IFGL Refractories Limited (the Company
2013 Half Year Results
 2013 Half Year Results Erwin Stoller, Executive Chairman Joris Gröflin, Chief Financial Officer Agenda 1. Introduction and summary of first half year 2013 2. Financial results first half year 2013 3. Outlook
Yara International ASA Second quarter results 2014
 Yara International ASA Second quarter results 214 18 July 214 1 Summary second quarter Strong result Lower nitrate deliveries amid early end to season in Europe Continued strong NPK deliveries and value-added
Business Review & 4Q10 Results
 Business Review & 4Q10 Results Apr 4, 2011 www.dyh.com.tr Notice The financial statements are reclassed for presentation purposes, the CMB format is also available through ISE and DYH websites.the figures
Full Year Results 2014
 Full Year Results 2014 18 March 2015 Conference call on FY Results 2014 Corporate Finance & Investor Relations AGENDA FY 2014 results presentation Highlights 2014 Financials 2014 Outlook 2015 Appendix
2013 Third Quarter Review October 25, 2013 1
 October 25, 213 1 Panalpina Group October 25, 213 213 Third Quarter Review October 25, 213 2 Highlights and key figures Operating and financial review Outlook Growth in profitability and margins in the
Management Presentation Q2/2012 Results. 8 August 2012
 Management Presentation Q2/2012 Results 8 August 2012 Cautionary statement This presentation contains forward-looking statements which involve risks and uncertainties. The actual performance, results and
2013 Second Quarter Review July 26, 2013 1
 213 Second Quarter Review July 26, 213 1 Panalpina Group Basel, July 26, 213 213 Second Quarter Review 213 Second Quarter Review July 26, 213 2 Highlights and key figures Operating and financial review
Consolidated Interim Report
 Consolidated Interim Report as of 31 March 2015 UNIWHEELS AG CONTENTS 1. Key performance data 2. Condensed group management report as of 31 March 2015 3. Condensed consolidated financial statements as
Consolidated Results for the year ended March 31, 2010. April 27, 2010 Zenji Miura Corporate Executive Vice President, CFO Ricoh Company, Ltd.
 Consolidated Results for the year ended March 31, 2010 Zenji Miura Corporate Executive Vice President, CFO Ricoh Company, Ltd. 2010/03 Results Overview +326% y-o-y growth for net income and +85% for income
Supplementary Material on Consolidated Financial Results for the First Six Months of the Fiscal Year Ending December 31, 2015
 Supplementary Material on Consolidated Financial Results for the First Six Months of the Fiscal Year Ending December 31, 2015
Focus on fleet customers SAF-HOLLAND Annual Financial Statements 2013
 Focus on fleet customers SAF-HOLLAND Annual Financial Statements 213 Detlef Borghardt, CEO Wilfried Trepels, CFO March 13, 214 Agenda 1 Financials 3 2 Appendix 21 2 Executive Summary 1 2 3 Group sales
PEGAS NONWOVENS SA. First quarter 2010 unaudited consolidated financial results
 PEGAS NONWOVENS SA First quarter 2010 unaudited consolidated financial results May 20, 2010 PEGAS NONWOVENS SA announces its unaudited consolidated financial results for the first quarter of 2010 to March
Net sales increased with 16% to SEK 76.1 m (65.6). Net sales for the last four quarters totalled SEK 255.0 m (306.6)
. Net sales for the last four quarters totalled SEK 255.0 m (306.6)") HMS Networks AB (publ) Interim report January-March 2010 First quarter 2010 Net sales increased with 16% to SEK 76.1 m (65.6). Net sales for the last four quarters totalled SEK 255.0 m (306.6) Operating
HMS Networks AB (publ) Interim report January-March 2010 First quarter 2010 Net sales increased with 16% to SEK 76.1 m (65.6). Net sales for the last four quarters totalled SEK 255.0 m (306.6) Operating
1Q16 Earnings Release. April 28 th 2016 LG Electronics
 1Q16 Earnings Release April 28 th 2016 LG Electronics All information regarding management performance and financial results of LG Electronics (the Company ) during the 1 st quarter of 2016 as contained
Full Year Results 2012. Conference Call Presentation, 21 st March 2013
 Full Year Results 2012 Conference Call Presentation, 21 st March 2013 0 Disclaimer This presentation may contain forward-looking statements based on current assumptionsandforecastsmadebybrenntag AG and
Klöckner & Co SE. Q3 2014 Results
 Klöckner & Co SE A Leading Multi Metal Distributor Gisbert Rühl CEO Marcus A. Ketter CFO Results Analysts and Investors Conference November 6, Disclaimer This presentation contains forward-looking statements
April 1, 2010. Rudi Ludwig, CEO Wilfried Trepels, CFO
 Annual Financial i Statements t t 2009 April 1, 2010 Rudi Ludwig, CEO Wilfried Trepels, CFO 1 Agenda 1. Executive Summary 2. Background Market Performance 3. Business Performance 4. Financials 5. Next
Advanced Info Service SET EU & UK Road Show 2013. SET EU & UK Road Show June 17 21, 2013
 Advanced Info Service SET EU & UK Road Show 2013 SET EU & UK Road Show June 17 21, 2013 AIS at glance 53% revenue market share 44% subscriber market share No.1 mobile operator in Thailand 37m users Breakdown
Full-year results 2014. December 02, 2014
 Full-year results 2014 December 02, 2014 Disclaimer Stabilus S.A. (the Company, later Stabilus ) has prepared this presentation solely for your information. It should not be treated as giving investment
Go Further 1Q 2015 FIXED INCOME REVIEW APRIL 28, 2015
 Go Further 1Q 2015 FIXED INCOME REVIEW APRIL 28, 2015 FORD CREDIT 1Q 2015 OPERATING HIGHLIGHTS* Another strong performance with pre-tax profit of $483 million and net income of $306 million Managed receivables
Disclaimer. This document has been prepared by Tele Columbus AG (the "Company") solely for informational purposes.
 solely for informational purposes.") Disclaimer This document has been prepared by Tele Columbus AG (the "Company") solely for informational purposes. This presentation may contain forward-looking statements. These statements are based on
Disclaimer This document has been prepared by Tele Columbus AG (the "Company") solely for informational purposes. This presentation may contain forward-looking statements. These statements are based on
FOR IMMEDIATE RELEASE
 FOR IMMEDIATE RELEASE O-I REPORTS FULL YEAR AND FOURTH QUARTER 2014 RESULTS O-I generates second highest free cash flow in the Company s history PERRYSBURG, Ohio (February 2, 2015) Owens-Illinois, Inc.
Zain Group Financial Results Q1-2015
 Zain Group Financial Results Q1-2015 2 Disclaimer Mobile Telecommunications Company KSCP Zain Group has prepared this presentation to the best of its abilities, however, no warranty or representation,
Pınar Entegre Et ve Un Sanayii A.Ş. WELCOME TO PINAR MEAT
 Pınar Entegre Et ve Un Sanayii A.Ş. WELCOME TO PINAR MEAT Yaşar Group Having a 60 years of history, Yasar Group is one of the pioneers of Turkish industry. With over 25 companies and 2 foundations employ
RAJESH EXPORTS LIMITED GLOBAL PRESENCE IN GOLD AND GOLD PRODUCTS. Earnings Presentation Q2 FY16
 RAJESH EXPORTS LIMITED GLOBAL PRESENCE IN GOLD AND GOLD PRODUCTS Earnings Presentation Q2 FY16 Company Overview COMPANY OVERVIEW Rajesh Exports Ltd. (REL) was incorporated in 1989. Currently REL is a leader
Ströer Out-of-Home Media AG: On Track for Growth. Cheuvreux German Corporate Conference Frankfurt January 17-19, 2011
 Ströer Out-of-Home Media AG: On Track for Growth Cheuvreux German Corporate Conference Frankfurt January 17-19, 2011 # 1 operator in underpenetrated and very attractive growth markets #1 in GERMANY Europe
TO OUR SHAREHOLDERS DYNAMIC FIRST HALF YEAR
 HALF YEAR REPORT AS OF JUNE 30, 2015 TO OUR SHAREHOLDERS Patrik Heider, Spokesman of the Executive Board and CFOO The Nemetschek Group maintained its dynamic development from the first quarter of 2015
Consolidated results for the 9 months ended December 31, 2010
 Consolidated results for the 9 months ended December 31, 2010 Zenji Miura, Corporate Executive Vice President, CFO Ricoh Company, Ltd. Forward-looking statements The plans, prospects, strategies and other
XING Q2 2012 results presentation. August 14, 2012
 XING Q2 2012 results presentation August 14, 2012 Disclaimer This presentation was produced in August 2012 by XING AG (the "Company") solely for use as an information source for potential business partners
Results Presentation Jan-Sep 2014. November 25 th, 2014
 Results Presentation Jan-Sep 2014 November 25 th, 2014 Disclaimer This document has been prepared by Grupo Isolux Corsán, S.A.; therefore no part of it may be published, disclosed or distributed in any
Dallah Healthcare Holding Company Dallah Health
 Recommendation Fair Value (SR) Price as of 23 rd of April 2014 (SR) Expected return Company data Tadawul symbol 52- week high (SR) 52-week low(sr) YTD change Average trading volume (thousand shares) Market
Review of FY07 Results
 Review of FY07 Results Doğan Gazetecilik A.Ş. March 28,, 2008 Notice Inflation accounting (IAS 29) is not applied in 2005&2006&2007 financials on the back of CMB s requirements. The financial statements
Financial Results. siemens.com
 s Financial Results Fourth Quarter and Fiscal 2015 siemens.com Key figures (in millions of, except where otherwise stated) Volume Q4 % Change Fiscal Year % Change FY 2015 FY 2014 Actual Comp. 1 2015 2014
2013FIRSTHALFRESULTS. JERÓNIMO MARTINS Strategic Overview
 2013FIRSTHALFRESULTS JERÓNIMO MARTINS Strategic Overview Disclaimer Statements in this presentation that are forward-looking statements are based on current expectations of future events and are subject
Software AG Results 1 st Quarter 2015 (IFRS, unaudited)
") Software AG Results 1 st Quarter (IFRS, unaudited) April 29, 1 Safe Harbor This presentation includes forward-looking statements based on the beliefs of Software AG management. Such statements reflect
Software AG Results 1 st Quarter (IFRS, unaudited) April 29, 1 Safe Harbor This presentation includes forward-looking statements based on the beliefs of Software AG management. Such statements reflect
Nordex SE Conference Call Q1 2015
 Nordex SE Conference Call Q1 2015 Hamburg 13 May 2015 AGENDA 1. Highlights Dr. Jürgen Zeschky 2. Operational progress and order intake Dr. Jürgen Zeschky 3. Financials Q1 2015 Bernard Schäferbarthold 4.
COMPANY PROFILE. Net Sales TL 291.6 Mn. EBITDA TL 39,2 Mn. Net Income TL 29.5 Mn. Net Sales TL 445.1 Mn. EBITDA TL 79,5 Mn. Net Income TL 62.
 2 COMPANY PROFILE TUMOSAN manufactures diesel engine and tractors in a closed area of 93.000 m 2 on its own property of 1.6 million m 2. It has the biggest manufacturing capacity in Turkey. Engine manufacturing
of Fiscal 2006 (Consolidated)
") Outline of Financial Results for the 3rd Quarter of Fiscal 2006 (Consolidated) Feb.3, 2006 For Immediate Release Company Name (URL http://www.fhi.co./jp/fina/index.html ) : Fuji Heavy Industries Ltd. (Code
Outline of Financial Results for the 3rd Quarter of Fiscal 2006 (Consolidated) Feb.3, 2006 For Immediate Release Company Name (URL http://www.fhi.co./jp/fina/index.html ) : Fuji Heavy Industries Ltd. (Code
FY2016 Annual Results Announcement For The Year Ended 31 March 2016
 FY2016 Annual Results Announcement For The Year Ended 31 March 2016 Highlights For the year ended 31 March (million ) 2015 2016 Change Net sales 1,177.9 1,282.7 +8.9% Gross profit 963.2 1,061.5 +10.2%
XING Q1 2012 results presentation. May 14, 2012
 XING Q1 2012 results presentation May 14, 2012 Disclaimer This presentation was produced in April 2012 by XING AG (the "Company") solely for use as an information source for potential business partners
JBS reports R$3.6 billion in EBITDA and net revenue of R$38.9 billion in 2Q15
 JBS S.A. (BVM&FBOVESPA: JBSS3; OTCQX: JBSAY) São Paulo, August 13 th, 2015 JBS reports R$3.6 billion in EBITDA and net revenue of R$38.9 billion in JBS S.A. announces results for its second quarter 2015
Full Year Results 2010 (preliminary)
") Full Year Results 2010 (preliminary) Dr. Stefan Groß-Selbeck (CEO) & Ingo Chu (CFO) March 1, 2011 01 2010 Highlights Strong financial performance Re-accelerated member growth in DACH Strong growth of vertical
Full Year Results 2010 (preliminary) Dr. Stefan Groß-Selbeck (CEO) & Ingo Chu (CFO) March 1, 2011 01 2010 Highlights Strong financial performance Re-accelerated member growth in DACH Strong growth of vertical
Tupras OUTPERFORM (M) 15 February 2010. Strong 2009 results on refining side...
 15 February 2010. Strong 2009 results on refining side...") Equity / Large Cap. / Petroleum and Energy 15 February 2010 Bloomberg: TUPRS TI Strong 2009 results on refining side... Reuters: TUPRS IS released its 2009 year end tax purpose financials. The main differences
Equity / Large Cap. / Petroleum and Energy 15 February 2010 Bloomberg: TUPRS TI Strong 2009 results on refining side... Reuters: TUPRS IS released its 2009 year end tax purpose financials. The main differences
Highlights of 1H FY2015 Results. November 18, 2015
 Highlights of 1H FY2015 Results November 18, 2015 Table of Contents 1. Trend of business results 3. Domestic life insurance Summary of 1H FY2015 results 3 Overview of 1H FY2015 results Himawari Life 27
LOGO BUSINESS SOLUTIONS
 LOGO BUSINESS SOLUTIONS Analyst Presentation for FY 2014 Gülnur Anlaş Chief Financial Officer February 16, 2015 12 1 Disclaimer This presentation contains information and analysis on financial statements
Europe: Growth of +7.8% in Recurring Operating Income France: New half of improved profitability
 2014 FIRST HALF RESULTS: CONTINUED GROWTH Organic sales growth of 4.3% Increase in Recurring Operating Income of +13.8% Strong increase in adjusted net income, Group share of +16.7% Strong profit growth
Makita Corporation. Consolidated Financial Results for the nine months ended December 31, 2007 (U.S. GAAP Financial Information)
") Makita Corporation Consolidated Financial Results for the nine months ended (U.S. GAAP Financial Information) (English translation of "ZAIMU/GYOSEKI NO GAIKYO" originally issued in Japanese language) CONSOLIDATED
Makita Corporation Consolidated Financial Results for the nine months ended (U.S. GAAP Financial Information) (English translation of "ZAIMU/GYOSEKI NO GAIKYO" originally issued in Japanese language) CONSOLIDATED
Revenue increase of 21% in the first half of 2015
 Press release: 2015 First Half Results Igny, August 7, 2015 First half results of 2015 Consolidated Profit & Loss (in M) Revenue increase of 21% in the first half of 2015 From January 1, 2015 to June 30,
Ford Credit Earns Full-Year 2014 Pre-Tax Profit of $1.9 Billion; Net Income of $1.7 Billion*
 Ford Credit Earns Full-Year Pre-Tax Profit of $1.9 Billion; Net Income of $1.7 Billion* DEARBORN, Mich., Jan. 29, 2015 Ford Motor Credit Company reported a pre-tax profit of $1.9 billion in, its highest
ARCA CONTINENTAL REPORTS REVENUE GROWTH OF 26% WITH EBITDA UP 25.8% IN 3Q15
 ARCA CONTINENTAL REPORTS REVENUE GROWTH OF 26% WITH EBITDA UP 25.8% IN 3Q15 Monterrey, Mexico, October 23, 2015 Arca Continental, S.A.B. de C.V. (BMV: AC*) ( Arca Continental or AC ), the second-largest
FURTHER PROFIT GROWTH IN FIRST-HALF 2015
 FURTHER PROFIT GROWTH IN FIRST-HALF 2015 Net sales of 37.7bn, up +5.2% (+2.9% on an organic basis) Growth in Recurring Operating Income: 726m, +2.6% at constant rates Strong growth in adjusted net income,
Conference call on 2014 half year results 13 August 2014
 Conference call on 2014 half year results 13 August 2014 IMCD IMCD Group N.V. Disclaimer Forward looking statements This half year report contains forward looking statements. These statements are based
Third quarter results FY2015. August 17, 2015
 Third quarter results FY2015 August 17, 2015 Disclaimer Stabilus S.A. (the Company, later Stabilus ) has prepared this presentation solely for your information. It should not be treated as giving investment
Ahlers AG, Herford. ISIN DE0005009708 and DE0005009732 INTERIM REPORT
 Ahlers AG, Herford ISIN DE0005009708 and DE0005009732 I N T E R I M R E P O R T for the first six months of the 2006/07 financial year (December 1, 2006 to May 31, 2007) BUSINESS DEVELOPMENT IN THE FIRST
Teknosa İç ve Dış Ticaret A.Ş. 1Q14 Results
 Investor Presentation Teknosa İç ve Dış Ticaret A.Ş. 1Q14 Results «Leader of A Growing Market» Korhan Bilek, CFO Erman Tütüncüoğlu, Head of IR May 5, 2014 Investment Theme 1 Strong Leadership Having the
GrandVision reports 2.8 billion Revenue and 449 million EBITDA for 2014
 GrandVision reports 2.8 billion Revenue and 449 million EBITDA for 2014 Schiphol, the Netherlands 18 March 2015. GrandVision N.V. publishes Full Year and Quarter 2014 results. 2014 Highlights Revenue grew
DATA GROUP LTD. ANNOUNCES FIRST QUARTER RESULTS FOR 2014
 For Immediate Release DATA GROUP LTD. ANNOUNCES FIRST QUARTER RESULTS FOR 2014 HIGHLIGHTS Q1 2014 First quarter 2014 ( Q1 ) Revenues of 77.9 million, Q1 Gross Profit of 18.8 million and Q1 Net Income of
HEINEKEN has once again demonstrated its ability to deliver a positive financial performance despite the challenging economic environment.
 Overview The Quick Read Performance highlights 17,123 million Revenue +6.1% 2,697 million EBIT (beia) +2.8% 1,584 million Net profit (beia) +8.8% 164.6 million hectolitres Consolidated beer volume +12.8%
Third Quarter 2014 Earnings Conference Call. 13 August 2014
 Third Quarter 2014 Earnings Conference Call 13 August 2014 Safe Harbor Statement & Disclosures The earnings call and accompanying material include forward-looking comments and information concerning the
Herzogenaurach, Germany, July 27, 2004 PUMA AG announces its consolidated nd
 P Quarter P Half-Year For immediate release MEDIA CONTACT: INVESTOR CONTACT: U.S.A.: Lisa Beachy, Tel. +1 617 488 2945 Europe: Ulf Santjer, Tel. +49 9132 81 2489 Dieter Bock, Tel. +49 9132 81 2261 Herzogenaurach,
COTT ANNOUNCES FIRST QUARTER 2012 RESULTS AND SHARE REPURCHASE PROGRAM FOR UP TO $35 MILLION IN COMMON SHARES
 CONTACT: Michael C. Massi Investor Relations Tel: (813) 313-1786 Investor.relations@cott.com COTT ANNOUNCES FIRST QUARTER 2012 RESULTS AND SHARE REPURCHASE PROGRAM FOR UP TO $35 MILLION IN COMMON SHARES
Analyst Presentation. for the year ended 28 February 2014
 Analyst Presentation for the year ended 2014 Agenda 1. General commentary on the period Kevin Hodgson 2. Financial commentary Cobus Loubser 3. Questions Page 2 General Commentary Review of the period Group
GrandVision reports Revenue growth of 13.8% and EPS growth of 31.7%
 GrandVision reports Revenue of 13.8% and EPS of 31.7% Schiphol, the Netherlands 16 March 2015. GrandVision NV (EURONEXT: GVNV) publishes Full Year and Fourth Quarter 2015 results. 2015 Highlights Revenue
S&T - Company Presentation. August 2015
 S&T - Company Presentation August 2015 About S&T AG S&T engineers Appliances for vertical markets Appliances comprise of dedicated hardware + combined software solutions Vertical niche solutions for Automation
Al-Gharasi International Trading Company Company Profile
 6/10/2008 Al-Gharasi International Trading Company Company Profile Al-Gharasi Group Profile Al-Gharasi International Trading Company Company Profile ALGHARASI INTERNATIONAL TRADING COMPANY was established
Kuehne + Nagel International AG Analyst Conference Call Q1 results 2015. April 14, 2015 (CET 14.00) Schindellegi, Switzerland
 Schindellegi, Switzerland") Kuehne + Nagel International AG Analyst Conference Call Q1 results 2015 (CET 14.00) Schindellegi, Switzerland Forward-looking statements This presentation contains forward-looking statements. Such statements
Kuehne + Nagel International AG Analyst Conference Call Q1 results 2015 (CET 14.00) Schindellegi, Switzerland Forward-looking statements This presentation contains forward-looking statements. Such statements
Commerzbank German Investment Seminar. 9 January 2012
 Commerzbank German Investment Seminar 9 January 2012 Disclaimer This presentation may contain forward-looking statements based on current assumptions and forecasts made by Brenntag AG and other information
STAR CONFERENCE 2015 Milan
 STAR CONFERENCE 2015 Milan Elica Corporation Today N#1 Player Worldwide in Hoods 2014 Turnover 391.9 M > 3500 Employees 2 19 Mln Hoods + Motors Cooking Net Sales: Own Brand 41% Client Brand 59 % 2 & 3
COMPANY PRESENTATION STAR CONFERENCE 2011. MILAN 2011, 22 nd March
 COMPANY PRESENTATION MILAN 2011, 22 nd March AGENDA 1. The group at a glance 2. Market overview 3. Financials 4. Share price Pag. 2 SPEAKERS LUIGI LUZZATI Chairman of Centrale del Latte di Torino & C.
TO OUR SHAREHOLDERS PROFITABLE GROWTH COURSE INTERNATIONALIZATION FURTHER EXTENDED US MARKET IN FOCUS
 QUARTERLY STATEMENT AS OF MARCH 31, 2015 TO OUR SHAREHOLDERS Patrik Heider, Spokesman of the Executive Board and CFOO The Nemetschek Group has made a dynamic start in the 2015 financial year and continues
Agenda. Overview and market conditions. Current activities. Financials overview. Post-merger objectives
 0 Agenda Overview and market conditions Current activities Financials overview Post-merger objectives 1 Agrowill overview: areas of activity One of the largest agricultural holding in the Baltic States
Dr. Reddy s Q3 and 9M FY16 Financial Results
 Press Release DR. REDDY'S LABORATORIES LTD. 8-2-337, Road No. 3, Banjara Hills, Hyderabad - 500034. Telangana, India. INVESTOR RELATIONS KEDAR UPADHYE kedaru@drreddys.com (Ph: +91-40-66834297) CONTACT
Dairy Market, Romania, 2009-2016
 Brochure More information from http://www.researchandmarkets.com/reports/3043644/ Dairy Market, Romania, 2009-2016 Description: In 2013 the milk and dairy market in Romania rose 8% in volume and 12% in
Interim Nine Months 2015 Results
 1 February 2015 to 31 October 2015 Inditex continues to expand its global, fully integrated store and online sales platform. Strong operating performance: Store & Online sales in local currencies increased
EUROPE S LEADING ONLINE FASHION DESTINATION Q4 / Full-Year 2014 Earnings Call 5 March 2015
 EUROPE S LEADING ONLINE FASHION DESTINATION Q4 / Full-Year 2014 Earnings Call 5 March 2015 Results highlights and business update 1 CONTINUED CLEAR FOCUS ON EXECUTION Strong revenue growth outperforms
2Q07 Conference Call Presentation
 2Q07 Conference Call Presentation This release contains forward-looking statements relating to the prospects of the business, estimates for operating and financial results, and those related to growth
Centrale del Latte di Torino & C. S.p.A. - CLT Group Via Filadelfia 220 10137 Turin - Italy Tel. +39 011 3240200 - Fax +39 011 3240300 e-mail: posta
 Centrale del Latte di Torino & C. S.p.A. - CLT Group Via Filadelfia 220 10137 Turin - Italy Tel. +39 011 3240200 - Fax +39 011 3240300 e-mail: posta @centralelatte.torino.it www.centralelatte.torino.it
Marti Otel. Martı REIT OUTPERFORM MARKETPERFORM. 01 November 2010. Equity / Small Cap. / Tourism. Upside Potential* 38%
 Equity / Small Cap. / Tourism 01 November 2010 Marti Otel Bloomberg: MARTI TI Reuters: MARTI IS Equity / Small Cap. / Real Estate Investment Trust Martı REIT Bloomberg: MRGYO TI REIT IPO unlocks the value
Be ONE: Our strategy in the current environment. Guidance 2010
 Results February January-December 25th, 2009 2010 1 Disclaimer This document contains additional non-compulsory forward-looking statements on intentions or expectations of the Company as of the date of
Ya Y ş a a ş r a rg r G o r u o p u Ov O e v r e v r ivew e
 Yaşar ar Holding Yaşar Group Overview Yaşar Group at a Glance Incorporated in 1945 and wholly controlled by the Selçuk Yaşar Family One of Turkey s leading and most respected consumer products group in
Kellogg Company November 3, 2011
 Third Quarter 2011 Financial Results November 3, 2011 1 Forward Looking Statements This presentation contains, or incorporates by reference, forward looking statements with projections concerning, among
1Q15 Earnings Release. April 29 th 2015 LG Electronics
 1Q15 Earnings Release April 29 th 2015 LG Electronics All information regarding management performance and financial results of LG Electronics (the Company ) during the 1 st quarter of 2015 as contained
Orascom Construction Reports Net Income of USD 64 Million in 9M 2015 and Announces Dividend Distribution of USD 0.36 per Share
 Dubai, UAE / 23 November 2015 9:00 AM Orascom Construction Reports Net Income of USD 64 Million in 9M 2015 and Announces Dividend Distribution of USD 0.36 per Share Highlights Healthy backlog level maintained
Nordex SE Conference Call Q1 2013. Frankfurt/Main May 15, 2013
 Nordex SE Conference Call Q1 2013 Frankfurt/Main May 15, 2013 AGENDA 1. Highlights Dr. J. Zeschky 2. Market Update and business performance Dr. J. Zeschky 3. Financials B. Schäferbarthold 4. Summary and