PINAR SÜT MAMULLERİ SAN. A.Ş H1 Earnings Presentation
|
|
|
- Bertina Porter
- 8 years ago
- Views:
Transcription
1 PINAR SÜT MAMULLERİ SAN. A.Ş 2013 H1 Earnings Presentation

2 Pınar Süt Highlights Innovator and pioneer More than 200 SKUs R&D expertise Product Portfolio #1 brand that comes to mind* Best brand in dairy ** Most sincere milk brand *** Among top 4 brands Turkish consumers feel closest to**** Best fruit juice brand ***** One of the top ten most reputable brands ****** Among 10 Superbrands Brand Hygienic and EU standard production Technical Expertise and sectoral know-how Award for Contributions to the Food Market Production Healthy, pure and standardized products ISO ISO ISO HACCP İSO İSO Quality YBP Turkey s biggest nationwide cold and frozen distribution chain More than sales points Technical know-how and expertise Synergy in the distribution of dairy and meat products Distribution Network Supply from more than producers Continuous quality control in each step Strong relations with farmers More than 200 contracted farms producing in EU standards Farms which are free of illness and approved Training and consultancy services Supply * GFK 2011 ** Kalder (TMME Endeksi) 2012 ***Mediacat&IPSOS 2012 ****Nielsen 2010 ***** Kalder (2012 TMME Endeksi) ****** 1 GFK&Repman 2012 *******FAO, 2012 *******Superbrands 2012


3 Market Dynamics - I Annual raw milk production is 750 mn tons in the World (2012 increase %2,7), and around 16,9 mn tons in Turkey (2012 increase %12 (Source:FAO, TUİK), The amount of milk produced in our country is increasing in parallel to the amount of animals and productivity in milk production. Cow milk comprises 91,4 % of the total produciton. Turkey, with its production of 13,8 mn tons of cow milk, is 8th within IDF countries. Per capita milk equivalent consumption in the world is 107,3 kg per capita on average; per capita drinking milk consumption ise more than 100 kg in North Europe countries. Per capita milk consumpton in Turkey, calculated as milk equivalent, has reached 223 kg in 2013, compared to 2012, showing an increase of 10%.. Per capita drinking milk consumption in Turkey is estimated to be 33,1 kg. Percentage of Packaged Milk 32% 34% 39% 44% 48% 52% 55% 58% 60% 61% 61% 68% 66% 61% 56% 52% 48% 45% 42% 40% 39% 39% Unpackaged Milk Processed and Packaged Milk Source: Tetrapak Milk Production in Turkey (million tons) Source: TUİK, GTHB * 2012 temporary 16,8 15,1 10,6 10,7 11,1 12,0 12,2 12,2 12,5 13,6 8,4 (TÜİK) 2


4 Market Dynamics - II Processed Food Products Prices Base Raw Milk Prices in Turkey (TL/lt) ,10 TL As opposed to the downward trend whch has started in 2013 for processed milk and meat products, upon the enforcement of the Turkish Food Codex Notification, prices of processed meat products soared. Source: TUİK, TCMB Milk and Cheese Penetrations Packaged Milk AMBALAJLI SÜT ,3 86,3 80,4 0,80 TL 0,65 TL 0,50 TL Ocak Jan Nisan Apr Temmuz Jul OctEkim Produced Raw Milk Base Prices Increasing raw milk prices Packaged Cheese AMBALAJLI PEYNİR 86,5 84,9 0,95 TL Increasing feed prices The penetration of packaged milk production has remained stable in the first half of the year, while packaged cheese penetration has increased. 81, Source: HTP 5M 5M 5M 2011 Oc-May 2012 Oc-May 2013 Oc-May 3

5 Market Shares - I 3,0 2,0 1,0 0,0 Total Dairy Products (bn TL) 17,0% 17,9% 17,5% 2,7 2,8 2,9 Pınar Market Share (value) 16,4% 1, H1 Source: Nielsen Total dairy products are included milk, yoghurt, spreadable cheese, butter and ayran. Measurable dairy market, has grown by 1,5% in terms of value and shrank by 0,9% in volume terms in 1H Food category has decreased its share within FMCG from %48,4 to %47,1 in Plain milk comprises 65% of the total mik market and Pınar Süt has a share of 30% market share in this, which is 2 times more than the nearest competitor. (Nielsen) 4 20% 15% 10% 5% 0% 100% Products 80% 60% 40% 20% 0% UHT Light Milk Pınar Total UHT Milk Nearest Competitor Spreadable Cheese Market SharePosition UHT Light Milk 62% Leader Total UHT Milk 30% Leader Organic Milk * 90% Leader Enriched Milk (Kids) 54% Leader Butter 17% Second Homogenized Yoghurt 10% Third Spreadable Cheese 38% Leader Fresh Cheese 84% Leader Labaneh 42% Leader Cream Cheese 23% Leader Source: Nielsen, 2013 H1 - Value Share * Estimated Fresh Labaneh Cheese Source: Nielsen, 2013 H1 Value Share

6 5 Market Shares - II 64,2% 64,5% 60,3% 58,9% 61,8% UHT Light Milk 40,9% 39,0% 39,2% 41,8% Total UHT Milk 26,7% 27,1% 30,1% 31,8% 38,0% 30,0% Spreadabl e Cheese 16,9% 18,4% 17,0% 17,2% 16,7% 9,8% 10,9% 11,0% 10,1% 10,0% H1 Butter Homogeni zed Yoghurt Source: Nielsen Value Share

7 6 New Launches & Product Differentiations Çikola Latte New tastes that respond to market tastes, reinforcing our expertise. New launches for different consumer segments. Multipackages and promotions providing convenience for consumers.

8 Pınar Beyaz Çikolatalı Campaign Tv Ads

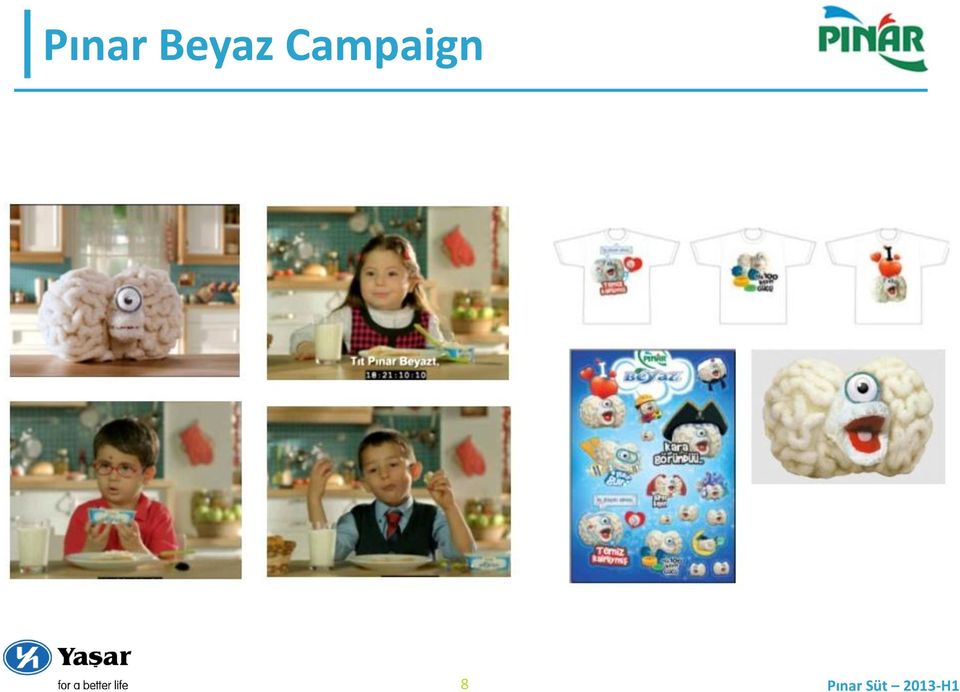
9 8 Pınar Beyaz Campaign

10 9 Pınar Labne Campaign facebook.com/pinarlabne TV


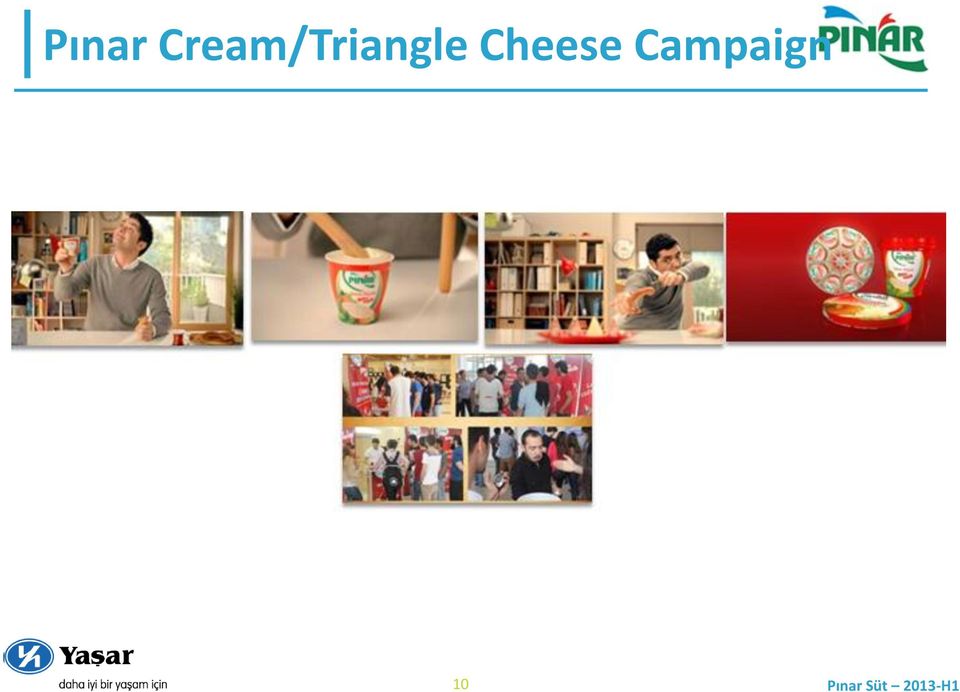
11 10 Pınar Cream/Triangle Cheese Campaign
12 Pınar Kido Campaign Ads


13 Pınar UHT Milk Campaign Tv Ads Classic Package

14 Product Groups & Sales Channels Net Sales by Product Groups (2013 H1) Sauce 4% Fruit Juice 7% Butter 7% Others 7% Milk 37% Yoghurt & Ayran 11% Cheese 27% Net Sales by Sales Channels (2013 H1) Export 10% Direct 7% 13 YBP 83%
 Export 10% Direct 7%")
15 14 Growth in Sales Growth Rates of Product Groups 2012 H H1 5% 7% 1% 10% 10% 11% 3% Sauce Butter Fruit Juice Others Yoghurt & Ayran Cheese Net Sales have grown by 8,6% in 2013 H1. Milk

16 Export Pınar realizes 22% of Turkey s Dairy Products Exports itself Export income was increased by %12 in terms of USD. Exports to 29 different countries which are Middle East, Europe, USA and Asia. In 2012 in Switzerland, Hong Kong and Afghanistan joined into Pinar Süt exporting countries. Pınar Labane Cheese have high market shares In Saudi Arabia, Kuwait and UAE which are respectively %35, %50 ve %35. Moreover, long-life milk, white cheese, Pınar Beyaz, whole cream, fruit juice, yoghurt and ayran is exported to Gulf countries. Export sales have tripled from 2002 to As one of the most valuable Turkish brands, part of the Foreign Sales by Countries (2013 H1) Qatar 4% Azerbaijan 5% Cyprus 6% Bahrein 3% Libya 4% UAE 10% Others 11% Kuwait 14% Iraq 16% Foreign Sales by Years (Million USD) S.Arabia 27% project supported by the Turkish government.. Pinar Süt is among the first companies included in Turquality Project. The first 5 years of project completed succesfully; taking part in second 5 year was obtained. The vision of Turquality is Create 10 world brands in 10 years. İhracatın Share of Net Export Satışlar İçindeki Total Payı Sales 8% 9% 11% 7% 9% 7% 29,7 28,0 29,0 24,6 24,4 21,1 8% 33,3 10% 39,9 10% 19,9 10% 22, Pınar Süt 1YH H1 1Y

17 Şanlıurfa Investment Pınar Süt Şanlıurfa plant, which will be established on a land of 100 thousand m², will have a capacity of 180 million litres/year with raw milk collected from Şanlıurfa and cities around it. The milk and dairy products will be produced in the factory. The product range will be expanded depending on the needs. The benefits from the region's proximity to the export markets will be provided. Investment incentives of Region-6 Foundation of the facility laid on May 12, The plant is projected to cost 100 million TL and to commence its operations by the end of


18 FINANCIAL RESULTS
19 Sales and Profitability Net Sales (Mn TL) Net Profit (Mn TL) 651,1 577,1 482,8 480,7 CAGR %11 727,1 361,4 %8,6 392,4 34,2 57,8 60,1 72,9 54,8 %7,8 %7,8 28,2 30, H1 13H H1 13H1 In H sales have grown by %8,6, in both value and volume terms. Growth in volume terms is by %1. In accordance with our strategies, we have focused on market investments. Even though the average raw milk prices of H, were above those of H, reflection of these increase to our end prices and our focus to the value added products enabled us to increase profitability. EBITDA* (Mn TL) 70,9 63,4 51,9 84,6 67,8 %8,6 31,0 %9,8 38,3 * Earnings before Interest, Tax, Depreciation, and Amortization H1 13H1

20 19 Income Statement (Million TL) Difference % Change Net Sales 392,4 361,4 30,9 8,6 Cost of goods Sold (310,7) (293,2) (17,4) 5,9 Gross Profit 81,7 68,2 13,5 19,8 R&D Expenses (3,9) (3,4) (0,4) 12,7 Sales, Distribution and MarketingExpenses (33,8) (27,0) (6,8) 25,1 General Administration Expenses (14,1) (12,9) (1,2) 9,1 EBIT 29,9 24,8 5,1 20,5 Share of Results of Investments in Associates 2,1 0,6 1,5 246,2 Other Income 6,0 5,7 0,3 5,0 Other Expenses (3,4) (1,5) (1,9) 124,1 Financial Income (Net) (0,5) 3,4 (3,9) (115,1) Profit Before tax 34,0 33,0 1,1 3,3 Tax (3,6) (4,8) 1,2 (25,7) Net Profit for the Period 30,5 28,2 2,3 8,2 EBITDA 38,3 31,0 7,3 23,4 Total Assets 616,5 624,1 (7,6) (1,2) Equity 419,1 398,7 20,4 5,1
 (27,0) (6,8) 25,1 General Administration Expenses (14,1) (12,9) (1,2) 9,1 EBIT 29,9 24,8 5,1 20,5 Share of Results of Investments in Associates")
21 Growth Analysis %6,9 %0,2 %1,5 392,4 Mn TL %8,6 361,4 Mn TL Y H1 Miktar Fiyat ve Ürün Miksi Kur Y H1
22 Profit Margins Gross Profit Margins(%) Operating Margins* (%) 18,0% 20,5% 19,9% 17,0% 19,6% 22,0% 8,4% 10,5% 9,2% 6,8% 5,4% 6,1% Q12 2Q13 1Q13 EBITDA Margins ** (%) 13,0% 11,0% 11,4% 9,3% 8,2% 6,8% Q12 2Q13 1Q13 Net Profit Margins (%) 10,4% 11,2% 8,1% 7,5% 7,4% 6,5% Q12 2Q13 1Q Q12 2Q13 1Q13 * Ex. Other income and expenditures ** Earnings before Interest, Tax, Depreciation, and Amortization 21
23 Quarterly Results Net Sales (Mn TL) In 2Q 2013, sales rose either compared to 1Q2013 (4%) or to 2Q 2012 (8,2%). The increase in gross margin in In 2Q2013, is attributable to sales price increases and value added products focus. EBITDA* (Mn TL) 22 2Q12 2Q13 1Q Price competition is continuing in the market. In accordance with our strategy of growing beyond market, we have focused on market investments. 2Q12 2Q13 1Q13 * Earnings before Interest, Tax, Depreciation, and Amortization 22
24 Mn TL 23 Basic Ratios, Net Financial Debt & Net Working Capital June 30, 2013 June 30, 2012 (Million TL) June 30, 2013 June 30, 2012 Current ratio 1,45 1,41 Cash & Cash Equivalents 2,51 1,30 Leverage ratio 0,32 0,36 S/T Bank Borrowings 18,96 19,36 S/T Fin Debt/T. Fin Debt 1,00 0,58 L/T Bank Borrowings 0,00 13,90 Net Financial Debt/EBITDA 0,22 0,44 Net Financal Debt 16,45 31,95 Total Fin Debt/Equity 0,05 0, A 41% rise in net cash generated from operating activities 2012 H H1 31,6 Mn TL 44,5 Mn TL Continuous focus on risk management and productivity Effective working capital management -140 Trade Recevables Trade Payables Inventories Strong balance sheet and liquidity management
25 Dividends 89,4% 89,90% 79,7% 70,9% 69,2% 78,2% 88,2% 84,6% 1,22 TL 0,96 TL 0,96 TL 0,88 TL 5,1% 0,08 TL 0,59 TL 0,37 TL 0,32 TL 7,7% 5,9% 8,7% 0,13 TL 19,6% 3,3% 10,7% 7,1% 5,8% 4,7% Hisse Dividends Başı Net Per Temettü Share Temettü Payout Ödeme Ratio Oranı Temettü Dividend Verimi Yield (Net)
26 25 Overview of H Volatiliy in the raw milk prices was decreased as a result of National Milk Council s base price system. However, raw milk prices were 12% above those of H, in H. Following our strategy of increasing our market shares we have focused on marketing investments in New products and new variations in packaging have been launched. Cost savings, measures to decrease expenses and projects improving efficiency in production have continued. (OMI-Lean Six Sigma Projects)
27 Strategies and Targets Growing above market growth rates in the segments we operate in, with ; Effective price management Widespread distribution network Efficient utilization of social media Developments in Away From Home channel Increasing export sales also in countries falling outside Gulf region Continued marketing investment TARGETS Growth in Net Sales: %13-15 EBITDA Margin: %10-11 Capex: 100 Mn TL 26

28 27 Ownership & Participation Structure Share Performance Ownership Share Performance Free Float Relative and Absolute Performance of Pınar Süt Et Shares = ,00 16,80 15,00 105,85 10,00 5,00 0,00 Relative İMKB-TÜM'e to ISE-TUM göre (sol eksen) (left axis) PNSUT (Sağ (Right eksen) Axis) CORPORATE GOVERNANCE RATİNG: 8,87 %31,8 %44,9 %30,5 %12,6 %5,5 %8,8
29 Disclaimer and Contact Information This presentation does not constitute an offer or invitation to purchase or subscription for any securities and no part of it shall form the basis of or be relied upon in connection with any contract or commitment whatsoever. This presentation contains forward-looking statements that reflect the company management s current views with respect to certain future events. Although it is believed that the expectations reflected in these statements are reasonable, they may be affected by a variety of variables and changes in underlying assumptions that could cause actual results to differ materially. Neither Pınar Süt Mamulleri San. A.Ş. nor any of its affiliates, advisors, representatives, directors, managers or employees nor any other person shall have any liability whatsoever for any loss arising from any use of this presentation or its contents or otherwise arising in connection with it. Company s financial statements are available on and websites. Investor Relations Department Tel: Fax: investorrelations@pinarsut.com.tr 28

30 Thank You
PINAR SÜT MAMULLERİ SAN. A.Ş. 2012 Earnings Presentation
 PINAR SÜT MAMULLERİ SAN. A.Ş 2012 Earnings Presentation Pınar Süt Highlights Innovator and pioneer More than 200 SKUs R&D expertise #1 brand that comes to mind* Best brand in dairy ** Most sincere milk
Company History. Pioneer and Leader of Modern Turkish Dairy 1975... Pınar Süt. Page 1
 PINAR SÜT MAMULLERİ SAN. A.Ş Company History Pioneer and Leader of Modern Turkish Dairy 1975... The first UHT milk and packaged dairy products plant in Turkey was founded (biggest milk production facility
2011 Q3 Investor Presentation
 PINAR ENTEGRE ET VE UN SAN. A.Ş. 2011 Q3 Investor Presentation Pınar Et Highlights Innovative and pioneer More than 300 SKUs R&D expertise #1 processed meat brand that comes to mind* Most admired brand
PINAR SU SANAYİ VE TİCARET A.Ş.
 PINAR SU SANAYİ VE TİCARET A.Ş. Pınar Su Highlights 2nd brandthatcomesto mindin PET andpc categories(nielsen 2009) 363PC, 168PET dealers Call Center application HACCP Food Security Management System NSF
2011 Earnings Presentation
 PINAR ENTEGRE ET VE UN SAN. A.Ş. 2011 Earnings Presentation Highlights Innovative and pioneer More than 300 SKUs R&D expertise Product Portfolio #1 processed meat brand that comes to mind* Most admired
History 1985-86 2007-2008. Pınar Madran water packed in demijohns was introduced 2003
 PINAR SU SANAYİ VE TİCARET A.Ş History 1984 Potable water (for the first time) in nonrecycled package... Pınar Şaşal 1985 1985-86 Pınar Şaşal was exported to Germany for the first time Pınar Şaşal in PVC
the best milk and dairy products brand.
 18- Pınar Süt Annual Report 2010 Assessment of 2010 Activities The best milk and dairy products brand* As a result of its effective management, production, marketing, and sales activities in 2010, Pınar
PINAR SU SANAYİ VE TİCARET A.Ş. INVESTOR PRESENTATION
 PINAR SU SANAYİ VE TİCARET A.Ş. INVESTOR PRESENTATION 2009, August 1 PRESENTATION OVERVIEW Yaşar Group at a Galance Bottled Water Market EU Conformity Period Company Overview Financial Performance 2 Disclaimer
PINAR SU SANAYİ VE TİCARET A.Ş. INVESTOR PRESENTATION
 PINAR SU SANAYİ VE TİCARET A.Ş. INVESTOR PRESENTATION April 2008 1 Disclaimer This presentation does not constitute an offer or invitation to purchase or subscription for any securities and no part of
TO OUR SHAREHOLDERS DYNAMIC FIRST HALF YEAR
 HALF YEAR REPORT AS OF JUNE 30, 2015 TO OUR SHAREHOLDERS Patrik Heider, Spokesman of the Executive Board and CFOO The Nemetschek Group maintained its dynamic development from the first quarter of 2015
IFGL REFRACTORIES LTD. RESULT UPDATE PRESENTATION, February 2016
 IFGL REFRACTORIES LTD RESULT UPDATE PRESENTATION, February 2016 Safe Harbor This presentation and the accompanying slides (the Presentation ), has been prepared by IFGL Refractories Limited (the Company
Yara International ASA Third Quarter results 2012
 Yara International ASA Third Quarter results 212 19 October 212 1 Summary third quarter Strong results and cash flow Yara-produced NPK deliveries up 1% Strong production increase Cautious start to European
2013 Half Year Results
 2013 Half Year Results Erwin Stoller, Executive Chairman Joris Gröflin, Chief Financial Officer Agenda 1. Introduction and summary of first half year 2013 2. Financial results first half year 2013 3. Outlook
How To Know More About The Company
 BİSKÜVİ SANAYİ A.Ş. This presentation contains information and analysis on financial statements and is prepared for the sole purpose of providing information relating to Ülker Bisküvi Sanayi A.ġ.(Ülker
Tupras OUTPERFORM (M) 15 February 2010. Strong 2009 results on refining side...
 15 February 2010. Strong 2009 results on refining side...") Equity / Large Cap. / Petroleum and Energy 15 February 2010 Bloomberg: TUPRS TI Strong 2009 results on refining side... Reuters: TUPRS IS released its 2009 year end tax purpose financials. The main differences
Equity / Large Cap. / Petroleum and Energy 15 February 2010 Bloomberg: TUPRS TI Strong 2009 results on refining side... Reuters: TUPRS IS released its 2009 year end tax purpose financials. The main differences
Yara International ASA Second quarter results 2014
 Yara International ASA Second quarter results 214 18 July 214 1 Summary second quarter Strong result Lower nitrate deliveries amid early end to season in Europe Continued strong NPK deliveries and value-added
Centrale del Latte di Torino & C. S.p.A. - CLT Group Via Filadelfia 220 10137 Turin - Italy Tel. +39 011 3240200 - Fax +39 011 3240300 e-mail: posta
 Centrale del Latte di Torino & C. S.p.A. - CLT Group Via Filadelfia 220 10137 Turin - Italy Tel. +39 011 3240200 - Fax +39 011 3240300 e-mail: posta @centralelatte.torino.it www.centralelatte.torino.it
WSE IV International Companies Conference 4-5 June 2013
 Company Presentation WSE IV International Companies Conference 4-5 June 2013 Contents Business update 3 Segment update 6 Financial update 12 2 Investment program update 17 Appendices 19 1 Business update
TO OUR SHAREHOLDERS PROFITABLE GROWTH COURSE INTERNATIONALIZATION FURTHER EXTENDED US MARKET IN FOCUS
 QUARTERLY STATEMENT AS OF MARCH 31, 2015 TO OUR SHAREHOLDERS Patrik Heider, Spokesman of the Executive Board and CFOO The Nemetschek Group has made a dynamic start in the 2015 financial year and continues
Management Presentation Q2/2012 Results. 8 August 2012
 Management Presentation Q2/2012 Results 8 August 2012 Cautionary statement This presentation contains forward-looking statements which involve risks and uncertainties. The actual performance, results and
2Q FY2015 Results. 15 December 2014. Del Monte Pacific Limited
 2Q FY2015 Results 15 December 2014 Del Monte Pacific Limited Disclaimer This presentation may contain statements regarding the business of Del Monte Pacific Limited and its subsidiaries (the Group ) that
FURTHER PROFIT GROWTH IN FIRST-HALF 2015
 FURTHER PROFIT GROWTH IN FIRST-HALF 2015 Net sales of 37.7bn, up +5.2% (+2.9% on an organic basis) Growth in Recurring Operating Income: 726m, +2.6% at constant rates Strong growth in adjusted net income,
Mouwasat Medical Services Company - Mouwasat
 Recommendation Overweight Fair Value (SR) 92.00 Price as of 2 nd of March 2014 (SR) 81.75 Expected return 12.5% Company data Tadawul symbol 4002.SE 52- week high (SR) 94.00 52-week low(sr) 52.25 YTD change
LOGO BUSINESS SOLUTIONS
 LOGO BUSINESS SOLUTIONS Analyst Presentation for FY 2014 Gülnur Anlaş Chief Financial Officer February 16, 2015 12 1 Disclaimer This presentation contains information and analysis on financial statements
Europe: Growth of +7.8% in Recurring Operating Income France: New half of improved profitability
 2014 FIRST HALF RESULTS: CONTINUED GROWTH Organic sales growth of 4.3% Increase in Recurring Operating Income of +13.8% Strong increase in adjusted net income, Group share of +16.7% Strong profit growth
Full Year Results 2014
 Full Year Results 2014 18 March 2015 Conference call on FY Results 2014 Corporate Finance & Investor Relations AGENDA FY 2014 results presentation Highlights 2014 Financials 2014 Outlook 2015 Appendix
Zain Group Financial Results Q1-2015
 Zain Group Financial Results Q1-2015 2 Disclaimer Mobile Telecommunications Company KSCP Zain Group has prepared this presentation to the best of its abilities, however, no warranty or representation,
Net sales increased with 16% to SEK 76.1 m (65.6). Net sales for the last four quarters totalled SEK 255.0 m (306.6)
. Net sales for the last four quarters totalled SEK 255.0 m (306.6)") HMS Networks AB (publ) Interim report January-March 2010 First quarter 2010 Net sales increased with 16% to SEK 76.1 m (65.6). Net sales for the last four quarters totalled SEK 255.0 m (306.6) Operating
HMS Networks AB (publ) Interim report January-March 2010 First quarter 2010 Net sales increased with 16% to SEK 76.1 m (65.6). Net sales for the last four quarters totalled SEK 255.0 m (306.6) Operating
2013FIRSTHALFRESULTS. JERÓNIMO MARTINS Strategic Overview
 2013FIRSTHALFRESULTS JERÓNIMO MARTINS Strategic Overview Disclaimer Statements in this presentation that are forward-looking statements are based on current expectations of future events and are subject
GrandVision reports Revenue growth of 13.8% and EPS growth of 31.7%
 GrandVision reports Revenue of 13.8% and EPS of 31.7% Schiphol, the Netherlands 16 March 2015. GrandVision NV (EURONEXT: GVNV) publishes Full Year and Fourth Quarter 2015 results. 2015 Highlights Revenue
Agenda. Overview and market conditions. Current activities. Financials overview. Post-merger objectives
 0 Agenda Overview and market conditions Current activities Financials overview Post-merger objectives 1 Agrowill overview: areas of activity One of the largest agricultural holding in the Baltic States
COTT ANNOUNCES FIRST QUARTER 2012 RESULTS AND SHARE REPURCHASE PROGRAM FOR UP TO $35 MILLION IN COMMON SHARES
 CONTACT: Michael C. Massi Investor Relations Tel: (813) 313-1786 Investor.relations@cott.com COTT ANNOUNCES FIRST QUARTER 2012 RESULTS AND SHARE REPURCHASE PROGRAM FOR UP TO $35 MILLION IN COMMON SHARES
Zain Investors Presentation Q4 2015
 Zain Investors Presentation Q4 2015 2 Disclaimer Mobile Telecommunications Company KSCP Zain Group has prepared this presentation to the best of its abilities, however, no warranty or representation, express
Kuehne + Nagel International AG Analyst Conference Call Q1 Results 2014
 Kuehne + Nagel International AG Analyst Conference Call Q1 Results 2014 April 14, 2014 Schindellegi, Switzerland Forward-Looking Statements This presentation contains forward-looking statements. Such statements
Dallah Healthcare Holding Company Dallah Health
 Recommendation Fair Value (SR) Price as of 23 rd of April 2014 (SR) Expected return Company data Tadawul symbol 52- week high (SR) 52-week low(sr) YTD change Average trading volume (thousand shares) Market
Kuehne + Nagel International AG Analyst Conference Call Q1 results 2015. April 14, 2015 (CET 14.00) Schindellegi, Switzerland
 Schindellegi, Switzerland") Kuehne + Nagel International AG Analyst Conference Call Q1 results 2015 (CET 14.00) Schindellegi, Switzerland Forward-looking statements This presentation contains forward-looking statements. Such statements
Kuehne + Nagel International AG Analyst Conference Call Q1 results 2015 (CET 14.00) Schindellegi, Switzerland Forward-looking statements This presentation contains forward-looking statements. Such statements
JBS reports R$3.6 billion in EBITDA and net revenue of R$38.9 billion in 2Q15
 JBS S.A. (BVM&FBOVESPA: JBSS3; OTCQX: JBSAY) São Paulo, August 13 th, 2015 JBS reports R$3.6 billion in EBITDA and net revenue of R$38.9 billion in JBS S.A. announces results for its second quarter 2015
Total shares at the end of ten years is 100*(1+5%) 10 =162.9.
 10 =162.9.") FCS5510 Sample Homework Problems Unit04 CHAPTER 8 STOCK PROBLEMS 1. An investor buys 100 shares if a $40 stock that pays a annual cash dividend of $2 a share (a 5% dividend yield) and signs up for the
FCS5510 Sample Homework Problems Unit04 CHAPTER 8 STOCK PROBLEMS 1. An investor buys 100 shares if a $40 stock that pays a annual cash dividend of $2 a share (a 5% dividend yield) and signs up for the
Financial Results. siemens.com
 s Financial Results Fourth Quarter and Fiscal 2015 siemens.com Key figures (in millions of, except where otherwise stated) Volume Q4 % Change Fiscal Year % Change FY 2015 FY 2014 Actual Comp. 1 2015 2014
Supplementary Material on Consolidated Financial Results for the First Six Months of the Fiscal Year Ending December 31, 2015
 Supplementary Material on Consolidated Financial Results for the First Six Months of the Fiscal Year Ending December 31, 2015
Investor and analyst factsheet
 Investor and analyst factsheet 2015 2014 1 Variation 4Q 15 4Q 14 1 Variation in m in m in m in m Sales 7,683 5,952 +29.1% 1,760 1,431 +23.0% Prices (4.7)% (8.5)% Volumes +0.2% +2.1% FX +7.8% +5.1% Portfolio
Aksa Enerji OUTPERFORM. 07 September 2011. Massive cut in 2011 production target more than priced in... Upside Potential* 80%
 Equity / Mid Cap. / Utilities 07 September 2011 Bloomberg: AKSEN TI Massive cut in 2011 production target more than priced in... We have revised our valuation for reflecting the changes in the company
Financial Information
 Financial Information Solid results with in all key financial metrics of 23.6 bn, up 0.4% like-for like Adjusted EBITA margin up 0.3 pt on organic basis Net profit up +4% to 1.9 bn Record Free Cash Flow
Closing Announcement of First Quarter of the Fiscal Year Ending March 31, 2009
 Member of Financial Accounting Standards Foundation Closing Announcement of First Quarter of the Fiscal Year Ending March 31, 2009 Name of Listed Company: Arisawa Mfg. Co., Ltd. Listed on the 1st Section
Full Year Results 2012. Conference Call Presentation, 21 st March 2013
 Full Year Results 2012 Conference Call Presentation, 21 st March 2013 0 Disclaimer This presentation may contain forward-looking statements based on current assumptionsandforecastsmadebybrenntag AG and
INTERIM REPORT 2012 FOURTH QUARTER (Q4)
") INTERIM REPORT 2012 FOURTH QUARTER (Q4) Summary - In January 2013 Norway Seafoods entered into an agreement to sell most of the company s Farming operations in France - Revenue in the fourth quarter came
INTERIM REPORT 2012 FOURTH QUARTER (Q4) Summary - In January 2013 Norway Seafoods entered into an agreement to sell most of the company s Farming operations in France - Revenue in the fourth quarter came
Annual Press Conference 2015. 18 March 2015
 Annual Press Conference 2015 18 March 2015 AGENDA Annual Press Conference 2015 Topic Speaker Time 1. Welcome Hubertus Spethmann 10.00 am 2. 2014 at a glance 2.1. Highlights Steven Holland 2.2. Financial
Business Review & 4Q10 Results
 Business Review & 4Q10 Results Apr 4, 2011 www.dyh.com.tr Notice The financial statements are reclassed for presentation purposes, the CMB format is also available through ISE and DYH websites.the figures
Conference Call Q3-2015/2016 GEROLD LINZBACH, CEO I DIRK KALIEBE, CFO. February 10, 2016 ON THE RIGHT TRACK
 Conference Call Q3-2015/2016 GEROLD LINZBACH, CEO I DIRK KALIEBE, CFO February 10, 2016 ON THE RIGHT TRACK On the right track Heidelberg is on track - the improvement in results due to the strategic realignment
2013 Third Quarter Review October 25, 2013 1
 October 25, 213 1 Panalpina Group October 25, 213 213 Third Quarter Review October 25, 213 2 Highlights and key figures Operating and financial review Outlook Growth in profitability and margins in the
DATA GROUP LTD. ANNOUNCES FIRST QUARTER RESULTS FOR 2014
 For Immediate Release DATA GROUP LTD. ANNOUNCES FIRST QUARTER RESULTS FOR 2014 HIGHLIGHTS Q1 2014 First quarter 2014 ( Q1 ) Revenues of 77.9 million, Q1 Gross Profit of 18.8 million and Q1 Net Income of
Advanced Info Service SET EU & UK Road Show 2013. SET EU & UK Road Show June 17 21, 2013
 Advanced Info Service SET EU & UK Road Show 2013 SET EU & UK Road Show June 17 21, 2013 AIS at glance 53% revenue market share 44% subscriber market share No.1 mobile operator in Thailand 37m users Breakdown
Financial Formulas. 5/2000 Chapter 3 Financial Formulas i
 Financial Formulas 3 Financial Formulas i In this chapter 1 Formulas Used in Financial Calculations 1 Statements of Changes in Financial Position (Total $) 1 Cash Flow ($ millions) 1 Statements of Changes
Ya Y ş a a ş r a rg r G o r u o p u Ov O e v r e v r ivew e
 Yaşar ar Holding Yaşar Group Overview Yaşar Group at a Glance Incorporated in 1945 and wholly controlled by the Selçuk Yaşar Family One of Turkey s leading and most respected consumer products group in
Revenue increase of 21% in the first half of 2015
 Press release: 2015 First Half Results Igny, August 7, 2015 First half results of 2015 Consolidated Profit & Loss (in M) Revenue increase of 21% in the first half of 2015 From January 1, 2015 to June 30,
Disclaimer. This document has been prepared by Tele Columbus AG (the "Company") solely for informational purposes.
 solely for informational purposes.") Disclaimer This document has been prepared by Tele Columbus AG (the "Company") solely for informational purposes. This presentation may contain forward-looking statements. These statements are based on
Disclaimer This document has been prepared by Tele Columbus AG (the "Company") solely for informational purposes. This presentation may contain forward-looking statements. These statements are based on
Consolidated Interim Report
 Consolidated Interim Report as of 31 March 2015 UNIWHEELS AG CONTENTS 1. Key performance data 2. Condensed group management report as of 31 March 2015 3. Condensed consolidated financial statements as
Ahlers AG, Herford. ISIN DE0005009708 and DE0005009732 INTERIM REPORT
 Ahlers AG, Herford ISIN DE0005009708 and DE0005009732 I N T E R I M R E P O R T for the first six months of the 2006/07 financial year (December 1, 2006 to May 31, 2007) BUSINESS DEVELOPMENT IN THE FIRST
Conference call on 2014 half year results 13 August 2014
 Conference call on 2014 half year results 13 August 2014 IMCD IMCD Group N.V. Disclaimer Forward looking statements This half year report contains forward looking statements. These statements are based
First Half 2015 Results (January-June) Madrid, July 24 th 2015
 Madrid, July 24 th 2015") First Half 2015 Results (January-June) Madrid, July 24 th 2015 Table of Contents 1. 1H 2015 Highlights 2. Backlog Execution 3. Update on Tulpar Transaction 4. Commercial Activity 5. Profit & Loss 6. Cash
First Half 2015 Results (January-June) Madrid, July 24 th 2015 Table of Contents 1. 1H 2015 Highlights 2. Backlog Execution 3. Update on Tulpar Transaction 4. Commercial Activity 5. Profit & Loss 6. Cash
Kuehne + Nagel International AG Analyst Conference Call Half-Year 2015 Results. July 14, 2015 (CET 14.00) Schindellegi, Switzerland
 Schindellegi, Switzerland") Kuehne + Nagel International AG Analyst Conference Call Half-Year 2015 Results (CET 14.00) Schindellegi, Switzerland Forward-looking statements This presentation contains forward-looking statements. Such
Kuehne + Nagel International AG Analyst Conference Call Half-Year 2015 Results (CET 14.00) Schindellegi, Switzerland Forward-looking statements This presentation contains forward-looking statements. Such
2013 Second Quarter Review July 26, 2013 1
 213 Second Quarter Review July 26, 213 1 Panalpina Group Basel, July 26, 213 213 Second Quarter Review 213 Second Quarter Review July 26, 213 2 Highlights and key figures Operating and financial review
GrandVision reports 2.8 billion Revenue and 449 million EBITDA for 2014
 GrandVision reports 2.8 billion Revenue and 449 million EBITDA for 2014 Schiphol, the Netherlands 18 March 2015. GrandVision N.V. publishes Full Year and Quarter 2014 results. 2014 Highlights Revenue grew
EUROPE S LEADING ONLINE FASHION DESTINATION Q4 / Full-Year 2014 Earnings Call 5 March 2015
 EUROPE S LEADING ONLINE FASHION DESTINATION Q4 / Full-Year 2014 Earnings Call 5 March 2015 Results highlights and business update 1 CONTINUED CLEAR FOCUS ON EXECUTION Strong revenue growth outperforms
COMPANY PRESENTATION STAR CONFERENCE 2011. MILAN 2011, 22 nd March
 COMPANY PRESENTATION MILAN 2011, 22 nd March AGENDA 1. The group at a glance 2. Market overview 3. Financials 4. Share price Pag. 2 SPEAKERS LUIGI LUZZATI Chairman of Centrale del Latte di Torino & C.
Focus on fleet customers SAF-HOLLAND Annual Financial Statements 2013
 Focus on fleet customers SAF-HOLLAND Annual Financial Statements 213 Detlef Borghardt, CEO Wilfried Trepels, CFO March 13, 214 Agenda 1 Financials 3 2 Appendix 21 2 Executive Summary 1 2 3 Group sales
RAJESH EXPORTS LIMITED GLOBAL PRESENCE IN GOLD AND GOLD PRODUCTS. Earnings Presentation Q2 FY16
 RAJESH EXPORTS LIMITED GLOBAL PRESENCE IN GOLD AND GOLD PRODUCTS Earnings Presentation Q2 FY16 Company Overview COMPANY OVERVIEW Rajesh Exports Ltd. (REL) was incorporated in 1989. Currently REL is a leader
ARCA CONTINENTAL REPORTS REVENUE GROWTH OF 26% WITH EBITDA UP 25.8% IN 3Q15
 ARCA CONTINENTAL REPORTS REVENUE GROWTH OF 26% WITH EBITDA UP 25.8% IN 3Q15 Monterrey, Mexico, October 23, 2015 Arca Continental, S.A.B. de C.V. (BMV: AC*) ( Arca Continental or AC ), the second-largest
Nordex SE Conference Call Q1 2013. Frankfurt/Main May 15, 2013
 Nordex SE Conference Call Q1 2013 Frankfurt/Main May 15, 2013 AGENDA 1. Highlights Dr. J. Zeschky 2. Market Update and business performance Dr. J. Zeschky 3. Financials B. Schäferbarthold 4. Summary and
Dairy Market, Romania, 2009-2016
 Brochure More information from http://www.researchandmarkets.com/reports/3043644/ Dairy Market, Romania, 2009-2016 Description: In 2013 the milk and dairy market in Romania rose 8% in volume and 12% in
ZAIN GROUP IR PRESENTATION. December 31 st 2012
 ZAIN GROUP IR PRESENTATION December 31 st 2012 1 Disclaimer Certain expectations and projections regarding future performance of the Group referenced in this presentation may be forward-looking statements
1Q16 Earnings Release. April 28 th 2016 LG Electronics
 1Q16 Earnings Release April 28 th 2016 LG Electronics All information regarding management performance and financial results of LG Electronics (the Company ) during the 1 st quarter of 2016 as contained
Makita Corporation. Consolidated Financial Results for the nine months ended December 31, 2007 (U.S. GAAP Financial Information)
") Makita Corporation Consolidated Financial Results for the nine months ended (U.S. GAAP Financial Information) (English translation of "ZAIMU/GYOSEKI NO GAIKYO" originally issued in Japanese language) CONSOLIDATED
Makita Corporation Consolidated Financial Results for the nine months ended (U.S. GAAP Financial Information) (English translation of "ZAIMU/GYOSEKI NO GAIKYO" originally issued in Japanese language) CONSOLIDATED
THE WAY TO MAKE IT. Results 2013 and Outlook 2014. Agenda. 26 March 2014. Results 2013. Focus and outlook 2014 Discussion
 Results 2013 and Outlook 2014 26 March 2014 26 March 2014 / Results 2013 and Outlook 2014 / 1 Agenda Results 2013 Operational performance Financial performance Focus and outlook 2014 Discussion 26 March
PEGAS NONWOVENS SA. First quarter 2010 unaudited consolidated financial results
 PEGAS NONWOVENS SA First quarter 2010 unaudited consolidated financial results May 20, 2010 PEGAS NONWOVENS SA announces its unaudited consolidated financial results for the first quarter of 2010 to March
Kuehne + Nagel International AG Analyst Conference Call First quarter 2016 results. April 19, 2016 (CET 14.00) Schindellegi, Switzerland
 Schindellegi, Switzerland") Kuehne + Nagel International AG Analyst Conference Call First quarter 2016 results April 19, 2016 (CET 14.00) Schindellegi, Switzerland Forward-looking statements This presentation contains forward-looking
Kuehne + Nagel International AG Analyst Conference Call First quarter 2016 results April 19, 2016 (CET 14.00) Schindellegi, Switzerland Forward-looking statements This presentation contains forward-looking
Klöckner & Co SE. Q3 2014 Results
 Klöckner & Co SE A Leading Multi Metal Distributor Gisbert Rühl CEO Q3 2014 Results Press Telephone Conference November 6, 2014 Disclaimer This presentation contains forward-looking statements which reflect
Results Presentation Jan-Sep 2014. November 25 th, 2014
 Results Presentation Jan-Sep 2014 November 25 th, 2014 Disclaimer This document has been prepared by Grupo Isolux Corsán, S.A.; therefore no part of it may be published, disclosed or distributed in any
Marti Otel. Martı REIT OUTPERFORM MARKETPERFORM. 01 November 2010. Equity / Small Cap. / Tourism. Upside Potential* 38%
 Equity / Small Cap. / Tourism 01 November 2010 Marti Otel Bloomberg: MARTI TI Reuters: MARTI IS Equity / Small Cap. / Real Estate Investment Trust Martı REIT Bloomberg: MRGYO TI REIT IPO unlocks the value
IFRS results for the year ended December 31, 2006 April 2, 2007 Michael A. O Neill CEO
 IFRS results for the year ended December 31, 2006 April 2, 2007 Michael A. O Neill CEO 1 Forward-Looking Statements This presentation includes forward-looking statements including, but not limited to,
SAF-HOLLAND Annual Financial Statements 2012. Detlef Borghardt, CEO Wilfried Trepels, CFO. March 14, 2013
 SAF-HOLLAND Annual Financial Statements 212 Detlef Borghardt, CEO Wilfried Trepels, CFO March 14, 213 Executive Summary business volume successfully expanded in 212 1 Group sales increased yoy by 3.4%
Nemetschek Group Company Presentation. July 2014
 Nemetschek Group Company Presentation July 2014 Agenda Nemetschek Group: In brief Strategy Internationalization Industry mega trends Innovations Financial data Q1 2014 Nemetschek share Why invest? 2 A
S&T - Company Presentation. August 2015
 S&T - Company Presentation August 2015 About S&T AG S&T engineers Appliances for vertical markets Appliances comprise of dedicated hardware + combined software solutions Vertical niche solutions for Automation
Nordex SE Conference Call Q1 2015
 Nordex SE Conference Call Q1 2015 Hamburg 13 May 2015 AGENDA 1. Highlights Dr. Jürgen Zeschky 2. Operational progress and order intake Dr. Jürgen Zeschky 3. Financials Q1 2015 Bernard Schäferbarthold 4.
Kuehne + Nagel International AG Analyst Conference Call Nine-months 2015 results. October 13, 2015 (CET 14.00) Schindellegi, Switzerland
 Schindellegi, Switzerland") Kuehne + Nagel International AG Analyst Conference Call Nine-months results October 13, (CET 14.00) Schindellegi, Switzerland Forward-looking statements This presentation contains forward-looking statements.
Kuehne + Nagel International AG Analyst Conference Call Nine-months results October 13, (CET 14.00) Schindellegi, Switzerland Forward-looking statements This presentation contains forward-looking statements.
Company Presentation VTG AG Connecting worlds. Analyst Conference April 14, 2015
 Company Presentation VTG AG Connecting worlds Analyst Conference April 14, 2015 Table of content 1 Highlights 2014 2 Performance & Financials 2014 3 Update on Strategy 4 Outlook 2015 5 Appendix 1 Executive
Kuehne + Nagel International AG Analyst Conference Call Full-year 2015 results. March 2, 2016 (CET 14.00) Schindellegi, Switzerland
 Schindellegi, Switzerland") Kuehne + Nagel International AG Analyst Conference Call Full-year results March 2, 2016 (CET 14.00) Schindellegi, Switzerland Forward-looking statements This presentation contains forward-looking statements.
Kuehne + Nagel International AG Analyst Conference Call Full-year results March 2, 2016 (CET 14.00) Schindellegi, Switzerland Forward-looking statements This presentation contains forward-looking statements.
Ströer Out-of-Home Media AG: On Track for Growth. Cheuvreux German Corporate Conference Frankfurt January 17-19, 2011
 Ströer Out-of-Home Media AG: On Track for Growth Cheuvreux German Corporate Conference Frankfurt January 17-19, 2011 # 1 operator in underpenetrated and very attractive growth markets #1 in GERMANY Europe
HEINEKEN has once again demonstrated its ability to deliver a positive financial performance despite the challenging economic environment.
 Overview The Quick Read Performance highlights 17,123 million Revenue +6.1% 2,697 million EBIT (beia) +2.8% 1,584 million Net profit (beia) +8.8% 164.6 million hectolitres Consolidated beer volume +12.8%
Chapter 17: Financial Statement Analysis
 FIN 301 Class Notes Chapter 17: Financial Statement Analysis INTRODUCTION Financial ratio: is a relationship between different accounting items that tells something about the firm s activities. Purpose
MYOB Finance Australia Limited ACN 161 013 654 Registered office: Level 3, 235 Springvale Road, Glen Waverley, VIC 3150
 MYOB Finance Australia Limited ACN 161 013 654 Registered office: Level 3, 235 Springvale Road, Glen Waverley, VIC 3150 16 September 2013 Market Announcements Office ASX Limited MYOB 2013 interim results
Presentation annual results 2013
 Presentation annual results 2013 Amsterdam, 21 February 2014 René J. Takens, CEO Hielke H. Sybesma, CFO Jeroen M. Snijders Blok, COO Agenda 1. Accell Group in 2013 2. The Accell Group share 3. Financials
Orascom Construction Reports Net Income of USD 64 Million in 9M 2015 and Announces Dividend Distribution of USD 0.36 per Share
 Dubai, UAE / 23 November 2015 9:00 AM Orascom Construction Reports Net Income of USD 64 Million in 9M 2015 and Announces Dividend Distribution of USD 0.36 per Share Highlights Healthy backlog level maintained
FRANKLIN ELECTRIC REPORTS RECORD SECOND QUARTER 2013 SALES AND EARNINGS
 For Immediate Release For Further Information Refer to: John J. Haines 260-824-2900 FRANKLIN ELECTRIC REPORTS RECORD SECOND QUARTER 2013 SALES AND EARNINGS Bluffton, Indiana July 30, 2013 - Franklin Electric
Metsä Board Metsä Board
 Metsä Board Financial 215 Financial statements statements review review 215 Highlights in 215 Paperboard delivery volumes increased by 12% compared to 214 Operating profit improved 32% Strong operating
Yara International ASA Fourth quarter results 2011. 7 February 2012
 Yara International ASA Fourth quarter results 211 7 February 212 1 Summary fourth quarter Strong quarter and best full-year results so far Good farm profitability drove improved margins, more than offsetting
FY2016 Annual Results Announcement For The Year Ended 31 March 2016
 FY2016 Annual Results Announcement For The Year Ended 31 March 2016 Highlights For the year ended 31 March (million ) 2015 2016 Change Net sales 1,177.9 1,282.7 +8.9% Gross profit 963.2 1,061.5 +10.2%
Conference Call Q1-2015/2016
 Conference Call Q1-2015/2016 DIRK KALIEBE August 12, 2015 Highlights Q1-2015/2016 Strategic reorientation is taking effect Good order situation, improved backlog Strong revenue growth due to solid order
PEER GROUPS CMP MARKET CAP EPS P/E (X) P/BV(X) DIVIDEND Company Name (Rs.) Rs. in mn. (Rs.) Ratio Ratio (%)
 P/BV(X) DIVIDEND Company Name (Rs.) Rs. in mn. (Rs.) Ratio Ratio (%)") BUY CMP 196.40 Target Price 225.00 STYLAM INDUSTRIES LIMITED Result Update (PARENT BASIS): Q2 FY16 DECEMBER 16 th. 2015 ISIN: INE239C01012 12 th h, 2013 Index Details Stock Data Sector Plastic Products
BUY CMP 196.40 Target Price 225.00 STYLAM INDUSTRIES LIMITED Result Update (PARENT BASIS): Q2 FY16 DECEMBER 16 th. 2015 ISIN: INE239C01012 12 th h, 2013 Index Details Stock Data Sector Plastic Products
Herzogenaurach, Germany, July 27, 2004 PUMA AG announces its consolidated nd
 P Quarter P Half-Year For immediate release MEDIA CONTACT: INVESTOR CONTACT: U.S.A.: Lisa Beachy, Tel. +1 617 488 2945 Europe: Ulf Santjer, Tel. +49 9132 81 2489 Dieter Bock, Tel. +49 9132 81 2261 Herzogenaurach,