Week 1 Lecture: (1) Course Introduction (2) Data Analysis and Processing
|
|
|
- Leslie Bryan
- 8 years ago
- Views:
Transcription
1 Week 1 Lecture: (1) Course Introduction (2) Data Analysis and Processing January 11, 2016

2 Welcome, Class! Instructor: C. Thomas Chiou, Teaching assistant: Jared Taylor, Website: Please sound off all electronic devices and no eating in lecture No eating and drinking in lab Prefi subject line of all your s with AerE322-2

3 Aircraft Structures Conventional manufacturing: beam, bar, column, truss, plate, etc. connected by screws, rivets, wield, etc. subjected to bending, torsion, etc. Source: pnveme/emem671/ima ges/skybolt_cutaway_w hite_truss.jpg Source: CNDE.iastate.edu Modern advances: plastic+metal+ceramic composites, honeycomb sandwich, etc. via bonding, etc. Additive manufacturing 3

4 Course Renovation 4

5 A New Home! Moved in 0257 Howe Fall 2014 renovation continues! 5

6 Renovation: a Working Progress Throughput increased % by the addition of new Instron load stations and other equipment Lab topics largely revised/re-designed (near half are new) Fully computerized and multi-media driven Instruction videos made for all lab topics 6

7 Lab Topics Practice eperiment and data analysis: lab 1, HW 1 Stress concentration-photoelasticity: lab 2 Column buckling testing and analysis: lab 3 Composite laminate design: lab 4 Strain gage applications: lab 5 Beam deflection and analysis: lab 6, HW 2 Thin-walled section and shear center: lab 7 Riveted joint design, fabrication and testing: lab 8 2D frame testing and analysis: lab 9, HW 3 Structural vibration analysis: lab 10 3D structure model building: lab 10 7


8 Class Web Site Full download of all lecture notes, lab assignments and related documents Online submission of lab reports and homework Online composite calculator Peer evaluations 8

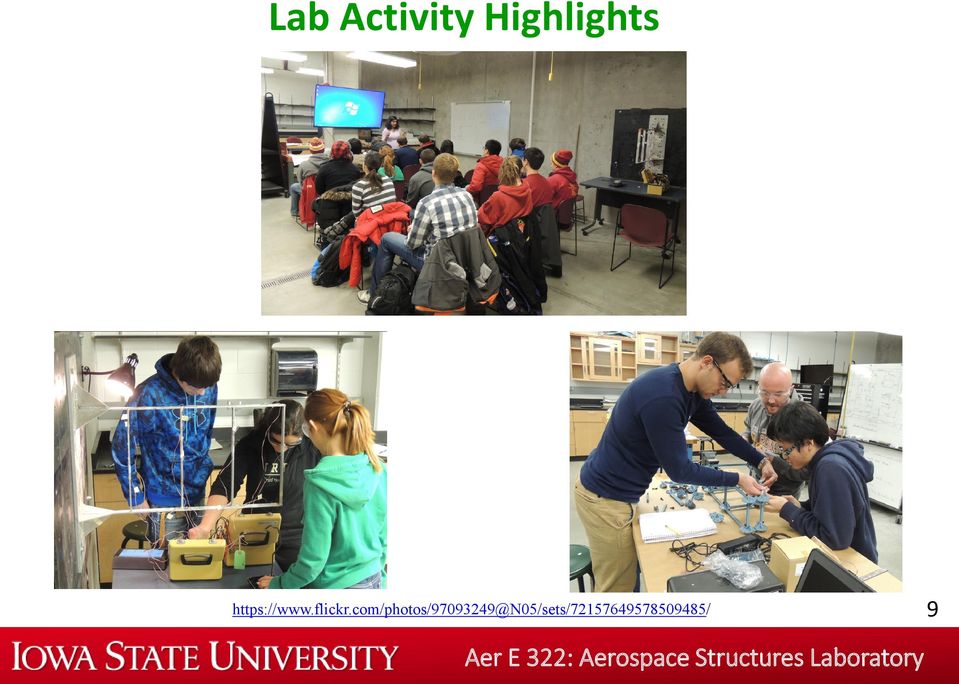
9 Lab Activity Highlights 9
10 Rapid Structure Design, Prototyping and Learning PASCO tool kits: Lego -like building blocks specially designed for structure model construction Various load cells, motion sensors, vibration generator, etc. plug-andplay with centralized interface Fully monitored and controlled by PC via user-friendly software Fast turnaround Cost effective 10

11 Rapid Structure Design and Prototyping: S14 Student Term Project Eamples Wing structure vibration Unbalanced propeller Underwing fuel tank Truss force distribution Impact loading of landing gear 11

12 Rapid Structure Design and Prototyping: F14 Student Term Project Eamples Wing structure vibration (flutter) Vibration of quad-copter FEM (ANSYS) Stress analysis Force analysis of landing gear Missile payload under wing 12

13 Rapid Structure Design and Prototyping: S15 Student Term Project Eamples Stress analysis of wing structure with payload more quantitative! Vibration (resonance) analysis of cantilever beam 13
 analysis of cantilever")
14 Improving Computational Skills: A Gradual Approach Structural analysis via matri method emphasized Concept introduced gently from early 4-DOF beam to later 6-DOF frame Smooth learning curve toward finite element method (covered in AerE 421, etc.) 14

15 More Coverage of Vibration Analysis 15

16 Vibration Analysis: Fun Stuff 16

17 Lab 1 and homework 1: Data Analysis and Processing 17

18 Data Analysis: Basic Concepts Suppose you and your classmates are tasked to measure something Some measurement True value (often unknown) operator Data (Measurements) = true value + error 18
 operator Data")
19 Data Analysis: Basic Concepts (cont d) Random error Random error, often called noise and fluctuation, is almost always incurred in measurement, causing the data to spread around a central average value (hopefully the true value) in a unpredictable way There are a variety of random error types and sources: thermal noise, electronic noise, human interpretation error, quantization/truncation/rounding error, etc. histogram measurement True value operator occurrence measurement 19

20 Data Analysis: Basic Concepts (cont d) Systematic error (bias) Caused by imperfect measurement methods and/or calibrations, environmental interferences, etc. in a predictable way Say you and your classmates use the same ruler which is inaccurate with a constant offset or bias Some measurement True value operator 20

21 Data Analysis: Basic Concepts (cont d) Level of Accuracy, Precision, Resolution The accuracy of measurement is often dictated by measuring device s resolution. E.g. your ruler s smallest marking is only 1/8 inch (so don t bother to take data in 1/64 inch). Sometimes the environment (e.g. vibration) limits the data accuracy, even your measuring device has high precision Sampling, Population, Sampling Rate Sampling describes the process of data collection from a sample group, organization or population. Sampling rate determines how the data are collected in time (frequency) or in space (spacing) 21
22 Data Analysis: Basic Concepts (cont d) Reproducibility Is your Nobel-prize-winning discovery a one-time deal? Can you repeat the same measurement with the same accuracy? Identification of Outlier Some measurement operator 22
23 Statistics 101: Quantifications of Data measurement True value operator occurrence histogram occurrence distribution measurement measurement Mean (central tendency) Arithmetic mean μμ = nn Standard Deviation (variability) nn = 1 nn ii=1 ii σσ = nn 1 nn ii=1 ii μμ 2 Variance = σ 2 23
24 Data Processing: Smoothing Smoothing operations are commonly applied to the data for suppressing interference or noise while preserving important features. Popular algorithms include running average and Savitzky-Golay filter Running average (or moving average) works by continuously taking average of neighboring data on the run yn ( 2) + yn ( 1) + yn ( ) + yn ( + 1) + yn ( + 2) y' ( n) =, 5 y(n-1) y(n-2) y(n) y(n+2) y(n+1) here average span = 5 (,y) data equal spaced in y(n+3) yn ( 1) + yn ( ) + yn ( + 1) + yn ( + 2) + yn ( + 3) y '( n + 1) =, etc. 5 24
25 Data Processing: Smoothing (cont d) A priori information is important! Your prior knowledge about the data dictate how you will process the data. span = 5 Raw data Short span to preserve feature span = 51 edge effect! long span to maimize smoothing 25
26 Data Processing: Smoothing (cont d) Often the running average is applied iteratively using multiple passes with different average spans - output of previous run become the new data for net run Raw data span combinations of 11,31,51,71,31,21,11,5 26
27 Data Processing: Outlier Removal Brute force approach: remove them by hand if you can guess where the data suppose to be located Some measurement operator Or you can continue using running average in multiple passes to smooth out the outliers. But don t overdo it otherwise you may ruin the underlying trend you wish to preserve 27
28 Data Processing: Outlier Removal (cont d) For more elaborate data, the following simple formula allows you to remove a hump from a slope by using good neighboring data 1 ( 1) y y = y + y ( 1,y 1 ) ( 2,y 2 ) Raw data 5,11 smoothing Hump removed 28
29 Data Processing: Curve Fitting Once you have done enough data smoothing, you may want to continue fitting the smoothed data to a model for gaining more insight to the underlying trend of the data and even backing out key parameters of the trend As mentioned, A priori information is important. Your knowledge about the data will help you to decide how you will fit the data: the choice of the fitting functions and the parameters within, e.g. straight line vs. polynomials, first order vs. second order, etc. 29
30 Data Processing: Curve Fitting (cont d) Least squares fit A popular and robust method for general functional fit: linear or non-linear. Suppose you wish to fit your (,y) data to a model function f with parameters a: y = f( a ; ) e.g. y= a+ a+ a You can use a minimization software to obtain the best-fit parameters a by minimizing the least squares sum Min. N i= 1 [ yˆ f( a ; )] 2 i i best-fit parameters a y ˆi : measured data 30
31 Data Processing: Curve Fitting (cont d) Data after 5,11 smoothing and hump removed (page 24) Fitted with linear line Original underlying baseline: Best-fit baseline: y = 2+ 5 y =
32 Data Processing: Outlier Removal Revisited Warning! Once again, your prior knowledge about the data dictate how you should process the data. Suppose your data actually came from a communication channel in which some non-zero signals were transmitted. Then those non-zero outliers are the features you need to keep and the random noise and the baseline are the ones you should remove! Raw data 5,11 smoothing baseline removed The hump you actually want to keep! 32
33 Homework 1: Data Processing Homework assignment and practice data file received from (also available from class web site) θ Height-distance trajectory of a projectile fired at an angle Smoothed data & Best-fit curve? Noisy corrupted raw data Due 11:59pm, Wednesday, January 27 33
34 Data Processing: Useful Matlab Functions Running Average: Matlab function: smooth yy = smooth(y,span) y = original data span = running average span yy = output of smoothed data The default span is 5. Polynomial Curve Fitting: Matlab function: polyfit p = polyfit(,y,n) = original -array y = original y-array n = degree of polynomial p = array of the polynomial s coefficients Polynomial Curve Evaluation: y = polyval(p,) p = array of polynomial s coefficients = array of -data y = array of polynomial s y-data General Curve Fitting: Matlab function: lsqcurvefit = lsqcurvefit(fun,0,data,ydata) fun = function format 0 = original guess of the coefficients data = -array of data ydata = y-array of data = coefficients of the curve eample of fun and 0: fun (1)+(2)*t+(3)*t.*t 0 = [1,5,10] 34
35 Lab 1: Practice Eperiment (starting this Thursday) 35
36 !!! Remember to apply what you learned today in data analysis and processing to all other labs in this course (and your future measurement work as well)!!! 36
INTRODUCTION TO ERRORS AND ERROR ANALYSIS
 INTRODUCTION TO ERRORS AND ERROR ANALYSIS To many students and to the public in general, an error is something they have done wrong. However, in science, the word error means the uncertainty which accompanies
Back to Elements - Tetrahedra vs. Hexahedra
 Back to Elements - Tetrahedra vs. Hexahedra Erke Wang, Thomas Nelson, Rainer Rauch CAD-FEM GmbH, Munich, Germany Abstract This paper presents some analytical results and some test results for different
Characterizing Digital Cameras with the Photon Transfer Curve
 Characterizing Digital Cameras with the Photon Transfer Curve By: David Gardner Summit Imaging (All rights reserved) Introduction Purchasing a camera for high performance imaging applications is frequently
Course in. Nonlinear FEM
 Course in Introduction Outline Lecture 1 Introduction Lecture 2 Geometric nonlinearity Lecture 3 Material nonlinearity Lecture 4 Material nonlinearity continued Lecture 5 Geometric nonlinearity revisited
Bildverarbeitung und Mustererkennung Image Processing and Pattern Recognition
 Bildverarbeitung und Mustererkennung Image Processing and Pattern Recognition 1. Image Pre-Processing - Pixel Brightness Transformation - Geometric Transformation - Image Denoising 1 1. Image Pre-Processing
Exercise 1.12 (Pg. 22-23)
") Individuals: The objects that are described by a set of data. They may be people, animals, things, etc. (Also referred to as Cases or Records) Variables: The characteristics recorded about each individual.
Individuals: The objects that are described by a set of data. They may be people, animals, things, etc. (Also referred to as Cases or Records) Variables: The characteristics recorded about each individual.
Signal to Noise Instrumental Excel Assignment
 Signal to Noise Instrumental Excel Assignment Instrumental methods, as all techniques involved in physical measurements, are limited by both the precision and accuracy. The precision and accuracy of a
Objectives. Experimentally determine the yield strength, tensile strength, and modules of elasticity and ductility of given materials.
 Lab 3 Tension Test Objectives Concepts Background Experimental Procedure Report Requirements Discussion Objectives Experimentally determine the yield strength, tensile strength, and modules of elasticity
Engineering Problem Solving and Excel. EGN 1006 Introduction to Engineering
 Engineering Problem Solving and Excel EGN 1006 Introduction to Engineering Mathematical Solution Procedures Commonly Used in Engineering Analysis Data Analysis Techniques (Statistics) Curve Fitting techniques
CALIBRATION OF A ROBUST 2 DOF PATH MONITORING TOOL FOR INDUSTRIAL ROBOTS AND MACHINE TOOLS BASED ON PARALLEL KINEMATICS
 CALIBRATION OF A ROBUST 2 DOF PATH MONITORING TOOL FOR INDUSTRIAL ROBOTS AND MACHINE TOOLS BASED ON PARALLEL KINEMATICS E. Batzies 1, M. Kreutzer 1, D. Leucht 2, V. Welker 2, O. Zirn 1 1 Mechatronics Research
Introduction to Engineering System Dynamics
 CHAPTER 0 Introduction to Engineering System Dynamics 0.1 INTRODUCTION The objective of an engineering analysis of a dynamic system is prediction of its behaviour or performance. Real dynamic systems are
Determining Measurement Uncertainty for Dimensional Measurements
 Determining Measurement Uncertainty for Dimensional Measurements The purpose of any measurement activity is to determine or quantify the size, location or amount of an object, substance or physical parameter
Data Analysis on the ABI PRISM 7700 Sequence Detection System: Setting Baselines and Thresholds. Overview. Data Analysis Tutorial
 Data Analysis on the ABI PRISM 7700 Sequence Detection System: Setting Baselines and Thresholds Overview In order for accuracy and precision to be optimal, the assay must be properly evaluated and a few
Activity 3.7 Statistical Analysis with Excel
 Activity 3.7 Statistical Analysis with Excel Introduction Engineers use various tools to make their jobs easier. Spreadsheets can greatly improve the accuracy and efficiency of repetitive and common calculations;
(Seattle is home of Boeing Jets)
") Dr. Faeq M. Shaikh Seattle, Washington, USA (Seattle is home of Boeing Jets) 1 Pre Requisites for Today s Seminar Basic understanding of Finite Element Analysis Working Knowledge of Laminate Plate Theory
Dr. Faeq M. Shaikh Seattle, Washington, USA (Seattle is home of Boeing Jets) 1 Pre Requisites for Today s Seminar Basic understanding of Finite Element Analysis Working Knowledge of Laminate Plate Theory
GOM Optical Measuring Techniques. Deformation Systems and Applications
 GOM Optical Measuring Techniques Deformation Systems and Applications ARGUS Forming Analysis ARGUS Deformation analysis in sheet metal and forming industry Forming Characteristics of Sheet Metals Material
CAE -Finite Element Method
 16.810 Engineering Design and Rapid Prototyping CAE -Finite Element Method Instructor(s) Prof. Olivier de Weck January 11, 2005 Plan for Today Hand Calculations Aero Æ Structures FEM Lecture (ca. 45 min)
Weight Measurement Technology
 Kistler-Morse (KM) introduced bolt-on weight measuring systems three decades ago. These devices featured Walter Kistler s invention, the Microcell. Over the years, many improvements were made to the Microcell
LCWM Glossary. Mettler Toledo LCWM Glossary
 Mettler Toledo LCWM Glossary LCWM Glossary Accuracy A measure of a Scale s ability to provide a weight reading equal to the actual weight placed on the Scale. A Scale s accuracy is usually measured against
Section Format Day Begin End Building Rm# Instructor. 001 Lecture Tue 6:45 PM 8:40 PM Silver 401 Ballerini
 NEW YORK UNIVERSITY ROBERT F. WAGNER GRADUATE SCHOOL OF PUBLIC SERVICE Course Syllabus Spring 2016 Statistical Methods for Public, Nonprofit, and Health Management Section Format Day Begin End Building
Java Modules for Time Series Analysis
 Java Modules for Time Series Analysis Agenda Clustering Non-normal distributions Multifactor modeling Implied ratings Time series prediction 1. Clustering + Cluster 1 Synthetic Clustering + Time series
Procon Engineering. Technical Document PELR 1002. TERMS and DEFINITIONS
 Procon Engineering Technical Document PELR 1002 TERMS and DEFINITIONS The following terms are widely used in the weighing industry. Informal comment on terms is in italics and is not part of the formal
22.302 Experiment 5. Strain Gage Measurements
 22.302 Experiment 5 Strain Gage Measurements Introduction The design of components for many engineering systems is based on the application of theoretical models. The accuracy of these models can be verified
Synthetic Sensing: Proximity / Distance Sensors
 Synthetic Sensing: Proximity / Distance Sensors MediaRobotics Lab, February 2010 Proximity detection is dependent on the object of interest. One size does not fit all For non-contact distance measurement,
Finite Element Formulation for Beams - Handout 2 -
 Finite Element Formulation for Beams - Handout 2 - Dr Fehmi Cirak (fc286@) Completed Version Review of Euler-Bernoulli Beam Physical beam model midline Beam domain in three-dimensions Midline, also called
Regularized Logistic Regression for Mind Reading with Parallel Validation
 Regularized Logistic Regression for Mind Reading with Parallel Validation Heikki Huttunen, Jukka-Pekka Kauppi, Jussi Tohka Tampere University of Technology Department of Signal Processing Tampere, Finland
Shaft Alignment. Powertrain Vibration
 Shaft Alignment and Powertrain Vibration Chris Leontopoulos C1 Shaft Alignment Definition Most shipboard configurations of shafts and bearings are likely to be aligned when some or all of the centrelines
APPENDIX A Using Microsoft Excel for Error Analysis
 89 APPENDIX A Using Microsoft Excel for Error Analysis This appendix refers to the sample0.xls file available for download from the class web page. This file illustrates how to use various features of
NCSS Statistical Software Principal Components Regression. In ordinary least squares, the regression coefficients are estimated using the formula ( )
") Chapter 340 Principal Components Regression Introduction is a technique for analyzing multiple regression data that suffer from multicollinearity. When multicollinearity occurs, least squares estimates
Chapter 340 Principal Components Regression Introduction is a technique for analyzing multiple regression data that suffer from multicollinearity. When multicollinearity occurs, least squares estimates
1 Lecture Notes 1 Interference Limited System, Cellular. Systems Introduction, Power and Path Loss
 ECE 5325/6325: Wireless Communication Systems Lecture Notes, Spring 2015 1 Lecture Notes 1 Interference Limited System, Cellular Systems Introduction, Power and Path Loss Reading: Mol 1, 2, 3.3, Patwari
Lecture 1: Review and Exploratory Data Analysis (EDA)
") Lecture 1: Review and Exploratory Data Analysis (EDA) Sandy Eckel seckel@jhsph.edu Department of Biostatistics, The Johns Hopkins University, Baltimore USA 21 April 2008 1 / 40 Course Information I Course
Lecture 1: Review and Exploratory Data Analysis (EDA) Sandy Eckel seckel@jhsph.edu Department of Biostatistics, The Johns Hopkins University, Baltimore USA 21 April 2008 1 / 40 Course Information I Course
Measurement Systems Correlation MSC for Suppliers
 Measurement Systems Correlation MSC for Suppliers Copyright 2003-2007 Raytheon Company. All rights reserved. R6σ is a Raytheon trademark registered in the United States and Europe. Raytheon Six Sigma is
Certification of Discontinuous Composite Material Forms for Aircraft Structures
 Certification of Discontinuous Composite Material Forms for Aircraft Structures Paolo Feraboli (UWAA), Mark Tuttle (UW), Larry Ilcewicz (FAA), Bill Avery (Boeing), Bruno Boursier, Dave Barr (Hexcel) JAMS
Precision Miniature Load Cell. Models 8431, 8432 with Overload Protection
 w Technical Product Information Precision Miniature Load Cell with Overload Protection 1. Introduction The load cells in the model 8431 and 8432 series are primarily designed for the measurement of force
2. Filling Data Gaps, Data validation & Descriptive Statistics
 2. Filling Data Gaps, Data validation & Descriptive Statistics Dr. Prasad Modak Background Data collected from field may suffer from these problems Data may contain gaps ( = no readings during this period)
LAGUARDIA COMMUNITY COLLEGE CITY UNIVERSITY OF NEW YORK DEPARTMENT OF MATHEMATICS, ENGINEERING, AND COMPUTER SCIENCE
 LAGUARDIA COMMUNITY COLLEGE CITY UNIVERSITY OF NEW YORK DEPARTMENT OF MATHEMATICS, ENGINEERING, AND COMPUTER SCIENCE MAT 119 STATISTICS AND ELEMENTARY ALGEBRA 5 Lecture Hours, 2 Lab Hours, 3 Credits Pre-
Introduction to time series analysis
 Introduction to time series analysis Margherita Gerolimetto November 3, 2010 1 What is a time series? A time series is a collection of observations ordered following a parameter that for us is time. Examples
Experiment #1, Analyze Data using Excel, Calculator and Graphs.
 Physics 182 - Fall 2014 - Experiment #1 1 Experiment #1, Analyze Data using Excel, Calculator and Graphs. 1 Purpose (5 Points, Including Title. Points apply to your lab report.) Before we start measuring
CAE -Finite Element Method
 16.810 Engineering Design and Rapid Prototyping Lecture 3b CAE -Finite Element Method Instructor(s) Prof. Olivier de Weck January 16, 2007 Numerical Methods Finite Element Method Boundary Element Method
Enhancing the SNR of the Fiber Optic Rotation Sensor using the LMS Algorithm
 1 Enhancing the SNR of the Fiber Optic Rotation Sensor using the LMS Algorithm Hani Mehrpouyan, Student Member, IEEE, Department of Electrical and Computer Engineering Queen s University, Kingston, Ontario,
DISTANCE DEGREE PROGRAM CURRICULUM NOTE:
 Bachelor of Science in Electrical Engineering DISTANCE DEGREE PROGRAM CURRICULUM NOTE: Some Courses May Not Be Offered At A Distance Every Semester. Chem 121C General Chemistry I 3 Credits Online Fall
The Physics of Sound and Music
 The Physics of Sound and Music PHYS 102 has no prerequisites and is in Clusters CL13 and CL14 (CL4). With PHYS 122 it is a lab science but cannot serve as both cluster and lab. In either case, PHYS 102
MSc in Autonomous Robotics Engineering University of York
 MSc in Autonomous Robotics Engineering University of York Practical Robotics Module 2015 A Mobile Robot Navigation System: Labs 1a, 1b, 2a, 2b. Associated lectures: Lecture 1 and lecture 2, given by Nick
Shear Center in Thin-Walled Beams Lab
 Shear Center in Thin-Walled Beams Lab Shear flow is developed in beams with thin-walled cross sections shear flow (q sx ): shear force per unit length along cross section q sx =τ sx t behaves much like
Tutorial for Assignment #2 Gantry Crane Analysis By ANSYS (Mechanical APDL) V.13.0
 V.13.0") Tutorial for Assignment #2 Gantry Crane Analysis By ANSYS (Mechanical APDL) V.13.0 1 Problem Description Design a gantry crane meeting the geometry presented in Figure 1 on page #325 of the course textbook
Tutorial for Assignment #2 Gantry Crane Analysis By ANSYS (Mechanical APDL) V.13.0 1 Problem Description Design a gantry crane meeting the geometry presented in Figure 1 on page #325 of the course textbook
New approaches in Eurocode 3 efficient global structural design
 New approaches in Eurocode 3 efficient global structural design Part 1: 3D model based analysis using general beam-column FEM Ferenc Papp* and József Szalai ** * Associate Professor, Department of Structural
Forecasting in supply chains
 1 Forecasting in supply chains Role of demand forecasting Effective transportation system or supply chain design is predicated on the availability of accurate inputs to the modeling process. One of the
CSE373: Data Structures and Algorithms Lecture 3: Math Review; Algorithm Analysis. Linda Shapiro Winter 2015
 CSE373: Data Structures and Algorithms Lecture 3: Math Review; Algorithm Analysis Linda Shapiro Today Registration should be done. Homework 1 due 11:59 pm next Wednesday, January 14 Review math essential
Data Mining Cluster Analysis: Basic Concepts and Algorithms. Clustering Algorithms. Lecture Notes for Chapter 8. Introduction to Data Mining
 Data Mining Cluster Analsis: Basic Concepts and Algorithms Lecture Notes for Chapter 8 Introduction to Data Mining b Tan, Steinbach, Kumar Clustering Algorithms K-means and its variants Hierarchical clustering
AP Physics 1 and 2 Lab Investigations
 AP Physics 1 and 2 Lab Investigations Student Guide to Data Analysis New York, NY. College Board, Advanced Placement, Advanced Placement Program, AP, AP Central, and the acorn logo are registered trademarks
METU DEPARTMENT OF METALLURGICAL AND MATERIALS ENGINEERING
 METU DEPARTMENT OF METALLURGICAL AND MATERIALS ENGINEERING Met E 206 MATERIALS LABORATORY EXPERIMENT 1 Prof. Dr. Rıza GÜRBÜZ Res. Assist. Gül ÇEVİK (Room: B-306) INTRODUCTION TENSION TEST Mechanical testing
PRACTICAL GUIDE TO DATA SMOOTHING AND FILTERING
 PRACTICAL GUIDE TO DATA SMOOTHING AND FILTERING Ton van den Bogert October 3, 996 Summary: This guide presents an overview of filtering methods and the software which is available in the HPL.. What is
BASIC STATISTICAL METHODS FOR GENOMIC DATA ANALYSIS
 BASIC STATISTICAL METHODS FOR GENOMIC DATA ANALYSIS SEEMA JAGGI Indian Agricultural Statistics Research Institute Library Avenue, New Delhi-110 012 seema@iasri.res.in Genomics A genome is an organism s
CHAP 4 FINITE ELEMENT ANALYSIS OF BEAMS AND FRAMES INTRODUCTION
 CHAP FINITE EEMENT ANAYSIS OF BEAMS AND FRAMES INTRODUCTION We learned Direct Stiffness Method in Chapter imited to simple elements such as D bars we will learn Energ Method to build beam finite element
Finite Element Analysis
 Finite Element Analysis (MCEN 4173/5173) Instructor: Dr. H. Jerry Qi Fall, 2006 What is Finite Element Analysis (FEA)? -- A numerical method. -- Traditionally, a branch of Solid Mechanics. -- Nowadays,
Applying Statistics Recommended by Regulatory Documents
 Applying Statistics Recommended by Regulatory Documents Steven Walfish President, Statistical Outsourcing Services steven@statisticaloutsourcingservices.com 301-325 325-31293129 About the Speaker Mr. Steven
QbD Approach to Assay Development and Method Validation
 QbD Approach to Assay Development and Method Validation Thomas A. Little Ph.D. 11/105/2014 President Thomas A. Little Consulting 12401 N Wildflower Lane Highland, UT 84003 1-925-285-1847 drlittle@dr-tom.com
Multiple Linear Regression in Data Mining
 Multiple Linear Regression in Data Mining Contents 2.1. A Review of Multiple Linear Regression 2.2. Illustration of the Regression Process 2.3. Subset Selection in Linear Regression 1 2 Chap. 2 Multiple
Data Mining. Nonlinear Classification
 Data Mining Unit # 6 Sajjad Haider Fall 2014 1 Nonlinear Classification Classes may not be separable by a linear boundary Suppose we randomly generate a data set as follows: X has range between 0 to 15
Time Domain and Frequency Domain Techniques For Multi Shaker Time Waveform Replication
 Time Domain and Frequency Domain Techniques For Multi Shaker Time Waveform Replication Thomas Reilly Data Physics Corporation 1741 Technology Drive, Suite 260 San Jose, CA 95110 (408) 216-8440 This paper
Finite Element Method (ENGC 6321) Syllabus. Second Semester 2013-2014
 Syllabus. Second Semester 2013-2014") Finite Element Method Finite Element Method (ENGC 6321) Syllabus Second Semester 2013-2014 Objectives Understand the basic theory of the FEM Know the behaviour and usage of each type of elements covered
Finite Element Method Finite Element Method (ENGC 6321) Syllabus Second Semester 2013-2014 Objectives Understand the basic theory of the FEM Know the behaviour and usage of each type of elements covered
Light Aircraft Design
 New: Sport Pilot (LSA) The Light Aircraft Design Computer Program Package - based on MS-Excelapplication was now extented with the new Sport Pilots (LSA) loads module, which includes compliance for the
Data Preprocessing. Week 2
 Data Preprocessing Week 2 Topics Data Types Data Repositories Data Preprocessing Present homework assignment #1 Team Homework Assignment #2 Read pp. 227 240, pp. 250 250, and pp. 259 263 the text book.
MBA 611 STATISTICS AND QUANTITATIVE METHODS
 MBA 611 STATISTICS AND QUANTITATIVE METHODS Part I. Review of Basic Statistics (Chapters 1-11) A. Introduction (Chapter 1) Uncertainty: Decisions are often based on incomplete information from uncertain
Guidance for Industry
 Guidance for Industry Q2B Validation of Analytical Procedures: Methodology November 1996 ICH Guidance for Industry Q2B Validation of Analytical Procedures: Methodology Additional copies are available from:
INTRODUCTION TO BEAMS
 CHAPTER Structural Steel Design LRFD Method INTRODUCTION TO BEAMS Third Edition A. J. Clark School of Engineering Department of Civil and Environmental Engineering Part II Structural Steel Design and Analysis
17. SIMPLE LINEAR REGRESSION II
 17. SIMPLE LINEAR REGRESSION II The Model In linear regression analysis, we assume that the relationship between X and Y is linear. This does not mean, however, that Y can be perfectly predicted from X.
Data Acquisition And Analysis
 Data Acquisition And Analysis Objective: To gain familiarity with some of the measurement tools you will use in lab this semester. To learn how to measure distance with a motion sensor and force with a
Structural Integrity Analysis
 Structural Integrity Analysis 1. STRESS CONCENTRATION Igor Kokcharov 1.1 STRESSES AND CONCENTRATORS 1.1.1 Stress An applied external force F causes inner forces in the carrying structure. Inner forces
GETTING STARTED WITH LABVIEW POINT-BY-POINT VIS
 USER GUIDE GETTING STARTED WITH LABVIEW POINT-BY-POINT VIS Contents Using the LabVIEW Point-By-Point VI Libraries... 2 Initializing Point-By-Point VIs... 3 Frequently Asked Questions... 5 What Are the
Simple linear regression
 Simple linear regression Introduction Simple linear regression is a statistical method for obtaining a formula to predict values of one variable from another where there is a causal relationship between
Using Excel (Microsoft Office 2007 Version) for Graphical Analysis of Data
 for Graphical Analysis of Data") Using Excel (Microsoft Office 2007 Version) for Graphical Analysis of Data Introduction In several upcoming labs, a primary goal will be to determine the mathematical relationship between two variable
Using Excel (Microsoft Office 2007 Version) for Graphical Analysis of Data Introduction In several upcoming labs, a primary goal will be to determine the mathematical relationship between two variable
Similar benefits are also derived through modal testing of other space structures.
 PAGE 1 OF 5 PREFERRED RELIABILITY PRACTICES MODAL TESTING: MEASURING DYNAMIC STRUCTURAL CHARACTERISTICS Practice: Modal testing is a structural testing practice that provides low levels of mechanical excitation
Data exploration with Microsoft Excel: univariate analysis
 Data exploration with Microsoft Excel: univariate analysis Contents 1 Introduction... 1 2 Exploring a variable s frequency distribution... 2 3 Calculating measures of central tendency... 16 4 Calculating
CALIBRATION PRINCIPLES
 1 CALIBRATION PRINCIPLES After completing this chapter, you should be able to: Define key terms relating to calibration and interpret the meaning of each. Understand traceability requirements and how they
Introduction To Real Time Quantitative PCR (qpcr)
") Introduction To Real Time Quantitative PCR (qpcr) SABiosciences, A QIAGEN Company www.sabiosciences.com The Seminar Topics The advantages of qpcr versus conventional PCR Work flow & applications Factors
Introduction To Real Time Quantitative PCR (qpcr) SABiosciences, A QIAGEN Company www.sabiosciences.com The Seminar Topics The advantages of qpcr versus conventional PCR Work flow & applications Factors
X X X a) perfect linear correlation b) no correlation c) positive correlation (r = 1) (r = 0) (0 < r < 1)
 perfect linear correlation b) no correlation c) positive correlation (r = 1) (r = 0) (0 < r < 1)") CORRELATION AND REGRESSION / 47 CHAPTER EIGHT CORRELATION AND REGRESSION Correlation and regression are statistical methods that are commonly used in the medical literature to compare two or more variables.
CORRELATION AND REGRESSION / 47 CHAPTER EIGHT CORRELATION AND REGRESSION Correlation and regression are statistical methods that are commonly used in the medical literature to compare two or more variables.
Demand Forecasting When a product is produced for a market, the demand occurs in the future. The production planning cannot be accomplished unless
 Demand Forecasting When a product is produced for a market, the demand occurs in the future. The production planning cannot be accomplished unless the volume of the demand known. The success of the business
The Sonometer The Resonant String and Timbre Change after plucking
 The Sonometer The Resonant String and Timbre Change after plucking EQUIPMENT Pasco sonometers (pick up 5 from teaching lab) and 5 kits to go with them BK Precision function generators and Tenma oscilloscopes
 DSP First Laboratory Exercise #9 Sampling and Zooming of Images In this lab we study the application of FIR ltering to the image zooming problem, where lowpass lters are used to do the interpolation needed
MCE380: Measurements and Instrumentation Lab. Chapter 9: Force, Torque and Strain Measurements
 MCE380: Measurements and Instrumentation Lab Chapter 9: Force, Torque and Strain Measurements Topics: Elastic Elements for Force Measurement Dynamometers and Brakes Resistance Strain Gages Holman, Ch.
Measuring Line Edge Roughness: Fluctuations in Uncertainty
 Tutor6.doc: Version 5/6/08 T h e L i t h o g r a p h y E x p e r t (August 008) Measuring Line Edge Roughness: Fluctuations in Uncertainty Line edge roughness () is the deviation of a feature edge (as
Simple Regression Theory II 2010 Samuel L. Baker
 SIMPLE REGRESSION THEORY II 1 Simple Regression Theory II 2010 Samuel L. Baker Assessing how good the regression equation is likely to be Assignment 1A gets into drawing inferences about how close the
Design Aspects of Robot Manipulators
 Design Aspects of Robot Manipulators Dr. Rohan Munasinghe Dept of Electronic and Telecommunication Engineering University of Moratuwa System elements Manipulator (+ proprioceptive sensors) End-effector
Lab for Deflection and Moment of Inertia
 Deflection and Moment of Inertia Subject Area(s) Associated Unit Lesson Title Physics Wind Effects on Model Building Lab for Deflection and Moment of Inertia Grade Level (11-12) Part # 2 of 3 Lesson #
An Introduction to Applied Mathematics: An Iterative Process
 An Introduction to Applied Mathematics: An Iterative Process Applied mathematics seeks to make predictions about some topic such as weather prediction, future value of an investment, the speed of a falling
STAT355 - Probability & Statistics
 STAT355 - Probability & Statistics Instructor: Kofi Placid Adragni Fall 2011 Chap 1 - Overview and Descriptive Statistics 1.1 Populations, Samples, and Processes 1.2 Pictorial and Tabular Methods in Descriptive
The Big Picture. Correlation. Scatter Plots. Data
 The Big Picture Correlation Bret Hanlon and Bret Larget Department of Statistics Universit of Wisconsin Madison December 6, We have just completed a length series of lectures on ANOVA where we considered
Introduction to Basic Reliability Statistics. James Wheeler, CMRP
 James Wheeler, CMRP Objectives Introduction to Basic Reliability Statistics Arithmetic Mean Standard Deviation Correlation Coefficient Estimating MTBF Type I Censoring Type II Censoring Eponential Distribution
Shell Elements in ABAQUS/Explicit
 ABAQUS/Explicit: Advanced Topics Appendix 2 Shell Elements in ABAQUS/Explicit ABAQUS/Explicit: Advanced Topics A2.2 Overview ABAQUS/Explicit: Advanced Topics ABAQUS/Explicit: Advanced Topics A2.4 Triangular
Experiment 2: Conservation of Momentum
 Experiment 2: Conservation of Momentum Learning Goals After you finish this lab, you will be able to: 1. Use Logger Pro to analyze video and calculate position, velocity, and acceleration. 2. Use the equations
Descriptive Statistics
 Y520 Robert S Michael Goal: Learn to calculate indicators and construct graphs that summarize and describe a large quantity of values. Using the textbook readings and other resources listed on the web
Machine Learning. CUNY Graduate Center, Spring 2013. Professor Liang Huang. huang@cs.qc.cuny.edu
 Machine Learning CUNY Graduate Center, Spring 2013 Professor Liang Huang huang@cs.qc.cuny.edu http://acl.cs.qc.edu/~lhuang/teaching/machine-learning Logistics Lectures M 9:30-11:30 am Room 4419 Personnel
APPENDIX N. Data Validation Using Data Descriptors
 APPENDIX N Data Validation Using Data Descriptors Data validation is often defined by six data descriptors: 1) reports to decision maker 2) documentation 3) data sources 4) analytical method and detection
 T O P I C 1 2 Techniques and tools for data analysis Preview Introduction In chapter 3 of Statistics In A Day different combinations of numbers and types of variables are presented. We go through these
American Association for Laboratory Accreditation
 Page 1 of 12 The examples provided are intended to demonstrate ways to implement the A2LA policies for the estimation of measurement uncertainty for methods that use counting for determining the number
Finite Element Method
 16.810 (16.682) Engineering Design and Rapid Prototyping Finite Element Method Instructor(s) Prof. Olivier de Weck deweck@mit.edu Dr. Il Yong Kim kiy@mit.edu January 12, 2004 Plan for Today FEM Lecture
Statistics I for QBIC. Contents and Objectives. Chapters 1 7. Revised: August 2013
 Statistics I for QBIC Text Book: Biostatistics, 10 th edition, by Daniel & Cross Contents and Objectives Chapters 1 7 Revised: August 2013 Chapter 1: Nature of Statistics (sections 1.1-1.6) Objectives
Roots of equation fx are the values of x which satisfy the above expression. Also referred to as the zeros of an equation
 LECTURE 20 SOLVING FOR ROOTS OF NONLINEAR EQUATIONS Consider the equation f = 0 Roots of equation f are the values of which satisfy the above epression. Also referred to as the zeros of an equation f()
INTERNATIONAL ASSOCIATION OF CLASSIFICATION SOCIETIES. Interpretations of the FTP
 INTERNATIONAL ASSOCIATION OF CLASSIFICATION SOCIETIES Interpretations of the FTP CONTENTS FTP1 Adhesives used in A or B class divisions (FTP Code 3.1, Res A.754 para. 3.2.3) June 2000 FTP2 Pipe and duct