Analysis of Questionnaires and Qualitative Data Non-parametric Tests
|
|
|
- Thomas Horton
- 10 years ago
- Views:
Transcription
1 Analysis of Questionnaires and Qualitative Data Non-parametric Tests JERZY STEFANOWSKI Instytut Informatyki Politechnika Poznańska Lecture SE 2013, Poznań

2 Recalling Basics

3 Measurment Scales Four scales of measurements commonly used in statistical analysis: nominal, ordinal, interval, and ratio scales A nominal scale -> there is no relative ordering of the categories, e.g. sex of a person, colour, trademark, Ordinal -> place object in a relative ordering, Many rating scales (e.g. never, rarely, sometimes, often, always) Interval -> Places objects in order and equal differences in value denote equal differences in what we are measuring Ratio -> similar interval measurement but also has a true zero point and you can divide values.

4 Coding values with numbers Numbers are used to code nominal or ordered values but they are not true numbers! Only for interval or ratio measurements they are proper number e.g. you are allowed to perform algebraic operations (+, -, *, /) Most of our considerations as to statistical data analysis or prediction methods concern numerical (interval, ratio) data.
")
5 In many domains we collect nominal or oridinal data Use of Questionnaires or Survey Studies in SE! Also collected in Web applications

6 Types of Variables in Questionnaires Yes/No Questions Any question that has yes or no as a possible response is nominal Two or multi-values (options) Gender (Femal vs. Male) Activity nominal data type of 6 choices of activity in the park: sport, picnic, reading, walk (including with the dog), meditation, jog.
 Activity nominal data type of 6 choices of activity in the park: sport,")
7 Likert Scales A special kind of survey question uses a set of responses that are ordered so that one response is greater (or preferred) than another. Generally, this term is used for any question that has about 5 or more possible options. An example: "How would you rate your department admin?" 1=very incompetent, 2=somewhat incompetent, 3=neither competent, 4=somewhat competent, or 5=very competent.

8 Simple Tools to Analyze Survey Results Frequency or cross tables

9 Other forms of summaries for question responses Think about graphic visualizations Activity frequency Relative frequency (1) sport % (2) picnic % (3) reading % (4) walk (including with the dog) % (5) meditation 1 4.5% (6) jog % Sum %
 walk (including with the dog) 5 22.7% (5) meditation 1 4.")
10 From basic descriptive statistics to statistical tests Dependencies of nominal variables We want to know whether variable Playground has relationship with variable Satisfaction, or not -> use chi2 test

11 Recall Hypothesis Testing State the a priori hypotheses The null hypothesis H0 The alternative hypothesis H1 (one vs. two tailed tests) Make decisions as to significance level α Decide on the suitable statistics and calculate its values from the random sample Compare it against the value expected according to H0 (temporary assumed to be true) Decide basing on a critical region

12 Testing mean values (parametric test) Assume: X normally distributed N ( µ 0, σ X ) cardinality n of the sample, known variance/standard distributions X Krok 1: Hypotheses: H 0 : µ = µ 0 1 : µ µ 0 Krok 2: Significance level α. Krok 3: Test statistics (random variable) Z = X µ 0 σ Krok 4: Critical values z(α) and rejection regions. Krok 5: Make a final decision X σ = σ n Z-normal distribution vs. t-student test? X or H H 1 : µ < µ 0 H 1 : µ > µ 0

13 Critical regions and values (t-student version) One tailed test H1 : µ < µ0 H0 reject, is p α (T tα) α tα Two tailed test H1 : µ µ0 α/2 α/2 -tα/2 tα/2

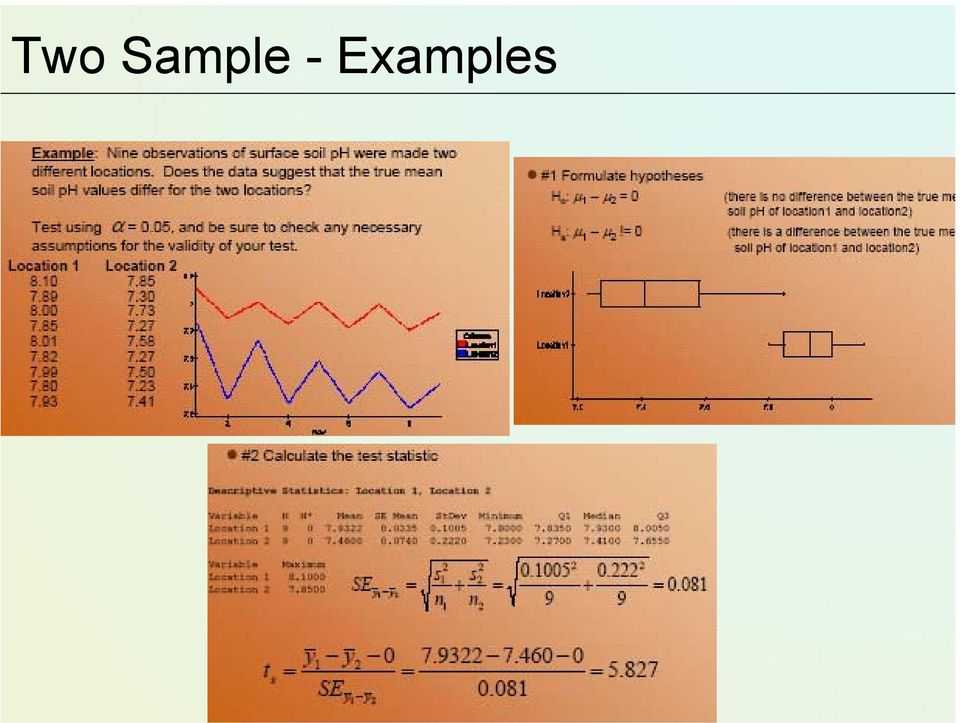
14 Comparing Means among Two (or More) Independent Populations Recall, general recipe for hypothesis testing... H 0 : µ 1 = µ 2 1. Start by assuming Ho true 2. Measure values on the sample 3. Compare test statistic (distance) to appropriate distribution to get p-value t = SE ˆ ( v x1 x 2 v x x 1 2 ) = v x s n 1 + x 2 s 2 2 n 2
 to appropriate distribution to get p-value t =")
15 Two Sample - Examples
16 Parametric and non-parametric tests Parametric statistical tests assume that the data belong to some type of probability distribution. The normal distribution is probably the most common. Moreover homogenuous variances and no outliers Non-parametric statistical tests are often called distribution free tests since don't make any assumptions about the distribution of data., they are more approriate for questionaries or qualitative data!

17 Nonparametric Tests Make no assumptions about the data's characteristics. Use if any of the three properties below are true: (a) the data are not normally distributed (e.g. skewed); (b) the data show inhomogeneity of variance; (c) the data are measured on an ordinal scale (ranks).

18 Assumption 1 - normality This can be checked by inspecting a histogram with small samples the histogram is unlikely to ever be exactly bell shaped This assumption is only broken if there are large and obvious departures from normality

19 Assumption 1 - normality

20 Assumption 1 - normality In severe skew the most extreme histogram interval usually has the highest frequency

21 Assumption 1 - normality
22 Testing normality more formally the Kolmogorov Smirnov test (K S test) is a nonparametric test for the equality of continuous, one-dimensional probability distributions that can be used to compare a sample with a reference probability distribution In the special case of testing for normality of the distribution, samples are standardized and compared with a standard normal distribution More powerfull is the Shapiro Wilk test
23 Assumption 3 no extreme scores It is sometimes legitimate to exclude extreme scores from the sample or alter them to make them less extreme. See section of the textbook. You may then use parametric.
24 Assumption 4 (independent samples t only) equal variance Variance 25.2 Variance 4.1
25 Examples of parametric tests and their non-parametric equivalents: Parametric test: Pearson correlation (No equivalent test) Independent-means t-test Dependent-means t-test Non-parametric counterpart: Spearman's correlation Chi-Square test U-Mann-Whitney test Wilcoxon test One-way Independent Measures Analysis of Variance (ANOVA) One-way Repeated-Measures ANOVA Kruskal-Wallis test Friedman's test
26 WHICH TEST SHOULD I USE? The type of data that you collect will be important in your final choice of test: Nominal Consider a chi-squared test if you are interested in differences in frequency counts using nominal data, for example comparing whether month of birth affects the sport that someone participates in.
27 Ordinal If you are interested in the relationship between groups, then use Spearman s correlation. If you are looking for differences between independent groups, then a Mann-Whitney test may be appropriate. If the groups are paired, however, then a Wilcoxon Signed rank test is appropriate. If there are three or more groups then consider a Kruskal- Wallis test.
28 Used for Wilcoxon s rank sum test for two samples -- the Mann Whitney U test independent samples when data is not normally distributed; it is not sure whether the variable follows a normal distribution Ordinal scores Named for Frank Wilcoxon in 1945: equal sample sizes Henry Berthold Mann ( ), Austrian-born US mathematician and statistician; Donald Ransom Whitney in 1947: arbitrary sample sizes Also called the Mann Whitney U test or Mann Whitney Wilcoxon (MWW) test. 28
29 THE U MANN-WHITNEY TEST An alternative to the independent t-test. Used when data is ordinal and non-parametric. This test works on ranking the data rather than testing the actual scores (values), and scoring each rank (so the lowest score would be ranked 1, the next lowest 2 and so on) ignoring the group to which each participant belonged. The principle of the test is that if the groups were equal (coming from the same population), then the sum of the ranks should also be the same.
30 Mann and Whitney assumptions and formulation All the observations from both groups are independent of each other, The responses are ordinal (i.e. one can at least say, of any two observations, which is the greater), The distributions of both groups are equal under the null hypothesis, so that the probability of an observation from one population (X) exceeding (greater) an observation from the second population (Y) equals the probability of an observation from Y exceeding an observation from X. That is, there is a symmetry between populations with respect to probability of random drawing of a larger observation. Under the alternative hypothesis, the probability of an observation from one population (X) exceeding an observation from the second population (Y) (after exclusion of ties) is not equal to 0.5. The alternative may also be stated in terms of a one-sided test, for example: P(X > Y) P(X = Y) > 0.5.
31 Median Test for Two Independent Samples The Median test investigates if the medians of two independent samples are the same. The hypothesis under test, H0, is that the medians are the same, and this is to be tested against the alternative hypothesis H1 that they are different.
32 Revision of how to Rank scores (raw values): (a) Lowest score gets rank of 1 ; next lowest gets 2 ; and so on. (b) Two or more scores with the same value are tied. (i) Give each tied score the rank it would have had, had it been different from the other scores. (ii) Add the ranks for the tied scores, and divide by the number of tied scores. Each of the ties gets this average rank. (iii) The next score after the set of ties gets the rank it would have obtained, had there been no tied scores. e.g. raw score: original rank: raw score: original rank: actual rank:
33 Rationale of Mann-Whitney U Imagine two samples of scores drawn at random from the same population The two samples are combined into one larger group and then ranked from lowest to highest In this case there should be a similar number of high and low ranked scores in each original group if you sum the ranks in each group, the totals should be about the same (approximately) this is the null hypothesis If however, the two samples are from different populations with different medians then most of the scores from one sample will be lower in the ranked list than most of the scores from the other sample the sum of ranks in each group will differ
34 Calculation procedure The test involves the calculation of a statistic, usually called U, whose distribution under the null hypothesis is known. In the case of small samples, the distribution is tabulated, but for sample sizes above ~20 approximation using the normal distribution is fairly good. First, arrange all the observations into a single ranked series. That is, rank all the observations without regard to which sample they are in.
35 Calculation schema method one For very small samples a direct method is recommended. It is very quick, and gives an insight into the meaning of the U statistic Choose the sample for which the ranks seem to be smaller (The only reason to do this is to make computation easier). Call this "sample 1," and call the other sample "sample 2." For each observation in sample 1, count the number of observations in sample 2 that have a smaller rank (count a half for any that are equal to it). The sum of these counts is U.
36 Calculation schema typical method Add up the ranks for the observations which came from sample 1. The sum of ranks in sample 2 is now determinate, since the sum of all the ranks equals N(N + 1)/2 where N is the total number of observations Calculate two statistics U1 and U2 U n ( n 2 + 1) ( n 2 + 1) = n1 n2 + R U 1 2 = n1 n2 + R2 n Choose the smaller U and compare with tabular statistics (for N1 and N2 degrees of freedom)
37 Mann-Whitney test, step-by-step: Does it make any difference to students' comprehension of statistics whether the lectures are in English or in Polish? Group 1: statistics lectures in English. Group 2: statistics lectures in Polish. DV: lecturer intelligibility ratings by students (0 = "unintelligible", 100 = "highly intelligible"). Ratings - so Mann-Whitney is appropriate.
38 English group (raw scores) English group (ranks) Polish group (raw scores) Polish group (ranks) Median: 15.5 Median: 13 Step 1: Rank all the scores together, regardless of group.
39 Step 2: Add up the ranks for group 1, to get T1. Here, T1 = 83. Add up the ranks for group 2, to get T2. Here, T2 = 70. Step 3: N1 is the number of subjects in group 1; N2 is the number of subjects in group 2. Here, N1 = 8 and N2 = 9. Step 4: Call the larger of these two rank totals Tx. Here, Tx = 83. Nx is the number of subjects in this group. Here, Nx = 8.
40 Step 5: Find U: Nx (Nx + 1) U = N1 * N Tx 2 In our example, 8 * (8 + 1) U = 8 * U = = 25
41 If there are unequal numbers of subjects - as in the present case - calculate U for both rank totals and then use the smaller U. In the present example, for T1, U = 25, and for T2, U = 47. Therefore, use 25 as U. Step 6: Look up the critical value of U, (e.g. with the table on my website), taking into account N1 and N2. If our obtained U is equal to or smaller than the critical value of U, we reject the null hypothesis and conclude that our two groups do differ significantly.
42 N N Here, the critical value of U for N1 = 8 and N2 = 9 is 15. Our obtained U of 25 is larger than this, and so we conclude that there is no significant difference between our two groups. Conclusion: ratings of lecturer intelligibility are unaffected by whether the lectures are given in English or in Polish.
43 Mann-Whitney U: Another example Step 1: Rank all the data from both groups in one series, then total each School A School B Student Grade Rank Student Grade Rank J. S. L. D. H. L. M. J. T. M. T. S. P. H. B- B- A+ D- B+ A- F T. J. M. M. K. S. P. S. R. M. P. W. A. F. D C+ C+ B- E C- A- Median = ; R A = Median = ; R B =
44 Mann-Whitney U: Calculation Step 2: Calculate two versions of the U statistic using: AND U 1 = (n A x n B ) + (n A + 1) x n A - R A 2 U 2 = (n A x n B ) + (n B + 1) x n B - R B 2
45 Mann-Whitney U: Calculation Step 3 finished: Select the smaller of the two U statistics (U 1 = ; U 2 =..) now consult a table of critical values for the Mann-Whitney test n alculated U must be critical U to conclude a significant difference Conclusion Median A Median B
46 The Wilcoxon signed test A non-parametric statistical hypothesis test used when comparing two related samples (paired) The test is named for Frank Wilcoxon ( ) who, in a single paper, proposed both it and the rank-sum test for two independent samples (Wilcoxon, 1945). Assumptions Data are paired and come from the same population. Each pair is chosen randomly and independent. The data are measured at least on an ordinal scale H0: median difference between the pairs is zero H1: median difference is not zero.
47 The Wilcoxon test calculation schema N pairs of scores (values) x 1i and x 2i (i=1,,n) Calculate differences sgn(x 1i -x 2i ) Exclude pairs with x 1i -x 2i =0 ; N r their reduced number Order the remaining pairs from smallest absolute difference to largest absolute difference and rank them Calculate total sums of ranks for positive and negative differences T+ and T- T statistics is the smaller of these rank sums For Nr<10 compare it againts tabular values (Nr degrees of freedom) If it is smaller than critical tabular value, reject H0 For larger Nr approximation with normal distribution
48 Rationale of Wilcoxon test Some difference scores will be large, others will be small Some difference scores will be positive, others negative If there is no difference between the two experimental conditions then there will be similar numbers of positive and negative difference scores If there is no difference between the two experimental conditions then the numbers and sizes of positive and negative differences will be equal this is the null hypothesis If there is a differences between the two experimental conditions then there will either be more positive ranks than negative ones, or the other way around Also, the larger ranks will tend to lie in one direction
49 Wilcoxon test, step-by-step: Does background music affect the mood of factory workers? Eight workers: each tested twice. Condition A: background music. Condition B: silence. DV: workers mood rating (0 = "extremely miserable", 100 = "euphoric"). Ratings, so use Wilcoxon test.
50 Worker: Silence Music Difference Rank Step 2: Rank the differences, ignoring their sign. Lowest = 1. Tied scores dealt with as before. Ignore zero difference-scores Ignore Median: 12.5 Median: 10.5 Step 1: Find the difference between each pair of scores, keeping track of the sign of the difference.
51 Step 3: Add together the positive-signed ranks. T+= 22. Add together the negative-signed ranks. T-= 6. Step 4: T" is the smaller sum of ranks; T = 6. Nr is the number of differences, omitting zero differences; Nr = 8-1 = 7. Step 5: Use table to find the critical value of T, for your Nr. Your obtained T has to be equal to or smaller than this critical value, for it to be statistically significant.
52 One Tailed Significance levels: Two Tailed significance levels: N The critical value of Tcrit (for an N of 7) is 2. Our obtained T of 6 is bigger than this. Our two conditions are not significantly different. Conclusion: workers' mood appears to be unaffected by presence or absence of background music.
53 T Wilocoxona critical values See the book F. Cleg Simple Statiscs.
54 Wilcoxon Signed Ranks: Calculation Step 1: Rank all the diffs from in one series (ignoring signs), then total each Athlete J. S. L. D. H. L. M. J. T. M. T. S. P. H. Medians = Pre-training OBLA (kph) Post-training OBLA (kph) Diff Rank Signed Ranks = Signed Ranks
55 Wilcoxon Signed Ranks: Calculation Step 2: The smaller of the T values is our test statistic (T+ =...; T- = now consult a table of critical values for the Wilcoxon test n Calculated T must be critical T to conclude a significant difference Conclusion Median A Median B
56 Nonparametric tests for comparing three or more groups (a) Kruskal-Wallis test: Similar to the Mann-Whitney test, except it enables you to compare three or more groups rather than just two. Different objects /subjects are used for each group. (b) Friedman's Test: Similar to the Wilcoxon test, except you can use it with three or more conditions. Each object (subject) does all of the experimental conditions.
57 Friedman Test The Friedman test is a non-parametric statistical test developed by the U.S. economist Milton Friedman. Similar to the parametric repeated measures ANOVA, it is used to detect differences in treatments across multiple groups. 1. H0: k groups are coming from the same population (or have the same medians) 2. H1: not all groups are identical (or not mediacs are equal) The procedure involves ranking each row (or block) together, then considering the values of ranks by columns.
58 Calculation schema Given data X - a matrix with n rows (the blocks), k columns (the treatments) and a single observation (score/values) at the intersection of each block and treatment, calculate the ranks within each block. If there are tied values, assign to each tied value the average of the ranks that would have been assigned without ties. Calculate the total sum of ranks for each i-th group Ri (i=1,,k)
59 Friedman Test - Statistics Assumptions: Considered statistics 2 χ = 12 n = n =... = 1 k 2 n1k ( k + 1) i= 1 R 2 i 3n n k 1 ( k Is assymptotically distributed as with (k-1) degrees of freedom + 1) 2 χ 2 If χ critical χ, then reject H0 2
60 Friedman s test, step-by-step: Effects on worker mood of different types of music: Five workers. Each is tested three times, once under each of the following conditions (groups): condition 1: silence. condition 2: "easy-listening music. condition 3: marching-band music. DV: mood rating ("0" = unhappy, "100" = euphoric). Ratings - so use a nonparametric test. NB: to avoid practice and fatigue effects, order of presentation of conditions is varied across subjects.
61 Silence (raw score) Silence (ranked score) Easy (raw score) Easy (ranked score) Band (raw score) Wkr 1: Wkr 2: Wkr 3: Wkr 4: Wkr 5: Band (ranked score) Step 1: Rank each subject's scores individually. Worker 1's scores are 4, 5, 6: these get ranks of 1, 2, 3. Worker 4's scores are 3, 7, 5: these get ranks of 1, 3, 2.
62 χr 2 = 12 3 ( 1) 2 + Tc N N C C C ( + 1) To get ΣTc 2 : (a) square each rank total: = = = (b) Add together these squared totals =
63 In our example, χr = ( 1) + Tc N N C C C 2 + ( ) 1 χr 2 = = 6.7 χr 2 = 6.7 Step 4: Degrees of freedom = number of conditions minus one. df = 3-1 = 2.
64 Step 5: Assessing the statistical significance of χr 2 depends on the number of participants and the number of groups. (a) Less than 9 participants: Should use a special table of critical values. (b) 9 or more participants: Use a Chi-Square table (Typical). Compare your obtained χr 2 value to the critical value of χ 2 for your d.f. If your obtained χr 2 is bigger than the critical χ 2 value, your conditions are significantly different. The test only tells you that some kind of difference exists; look at the median or mean score for each condition (group) to see where the difference comes from.
65 Our obtained χr 2 is 6.7. For 2 d.f., a χ 2 value of 5.99 would occur by chance with a probability of.05. Our obtained value is bigger than Therefore our obtained χr 2 is even less likely to occur by chance: p <.05. Conclusion: the conditions (groups) are significantly different. Music does affect worker mood.
66 Dependencies and Correlations Dependence refers to any statistical relationship between two random variables or two sets of data Correlation refers to any of a broad class of statistical relationships involving dependence Examples the correlation between the demand for a product and its price; The correlation between electricity demand and weather, etc However, statistical dependence or correlation is not sufficient to demonstrate the presence of a causal relationship!
67 Nominal Ordinal Int/Ratio Nominal Clustered bargraph Chi-squared Phi (φ) or Cramer's V Clustered bargraph Chi-squared Phi (φ) or Cramer's V Scatterplot, bar chart or errorbar chart Point bi-serial correlation (r pb ) Ordinal Scatterplot or clustered bar chart Spearman's Rho or Kendall's Tau ß Recode Scatterplot Point bi-serial or Spearman/Kend all Int/Ratio Scatterplot Productmoment correlation (r)
68 Correlation A measure of the relationship (correlation) between interval/ratio variables taken from the same set of subjects A ratio which indicates the amount of concomitant variation between two sets of scores This ratio is expressed as a correlation coefficient (r Perfect egative lationship Strong Moderate Weak Weak Moderate Strong _ No Relationship + Perfect Positive Relationsh
69 Correlation Coefficient & Scatterplots Direction Variable Y (e.g. 10 km run time) Variable Y (e.g. Exercise Capacity). Variable X (e.g. VO 2 max). Variable X (e.g. VO 2 max)
70 Pearson correlation Recall older definition and its assumptions interval or ratio level; inearly related; bivariate normally distributed.
71 Spearman rank correlation Use if Pearson assumptions do not hold Non-linear monotonic functions Ordinal data Rank correlation coefficients, such as Spearman's rank correlation coefficient and Kendall's rank correlation coefficient (τ) measure the extent to which, as one variable increases, the other variable tends to increase, without requiring that increase to be represented by a linear relationship. If, as the one variable increases, the other decreases, the rank correlation coefficients will be negative.
72 Simple illustrations The nature of rank correlation, and its difference from linear correlation, consider the following four pairs of numbers (x, y): (0, 1), (10, 100), (101, 500), (102, 2000). an increase in x is always accompanied by an increase in y. The perfect rank correlation, and both Spearman's and Kendall's correlation coefficients are 1, whereas in this example Pearson product-moment correlation coefficient is ,
73 Monotonic relationships We refer to monotonic functions Spearman s correlation coefficient is a statistical measure of the strength of a monotonic relationship between paired data [-1;+1].
74 Differences for Spearman and Pearson correlations Non-linear monotonic relationships X and Y A perfect monotone increasing relationship implies that for any two pairs of data values Xi, Yi and Xj, Yj, that Xi Xj and Yi Yj always have the same sign.
75 Spearman correlation calculation schema For a sample of size n, the n raw scores (x,y) are converted to ranks (i.e. rank values of variable x, and then variable y) Differences between the ranks of each observation on the two variables are calculated as d i Spearman correlation r s is defined as r S = 1 6 n i = 1 2 n( n d 2 i 1)
76 Toy examples Study evaluations (scores) of 10 students according to 2 experts/teachers. Student A B C D E F G H I J 1 exp exp
77 Calculations Rankings Student A B C D E F G H I J 1 exp ranks Student A B C D E F G H I J 2 exp ranks
78 Calculations 2 Rank differences Student A B C D E F G H I J 1 exp exp di d di = i r s = (10 1) 63 = = 0.936
79 pearman s Rank-Order Correlation X = Alcohol Units Y = Skill Score Rank X Rank Y D D Total=
80 More references Complete Business Statistics. Amir D.Aczel, 2008/ Simple Statistics, Clegg F., and other WWW resources on non-parametrics tests
81 Any questions? Read and Learn!
Additional sources Compilation of sources: http://lrs.ed.uiuc.edu/tseportal/datacollectionmethodologies/jin-tselink/tselink.htm
 Mgt 540 Research Methods Data Analysis 1 Additional sources Compilation of sources: http://lrs.ed.uiuc.edu/tseportal/datacollectionmethodologies/jin-tselink/tselink.htm http://web.utk.edu/~dap/random/order/start.htm
UNIVERSITY OF NAIROBI
 UNIVERSITY OF NAIROBI MASTERS IN PROJECT PLANNING AND MANAGEMENT NAME: SARU CAROLYNN ELIZABETH REGISTRATION NO: L50/61646/2013 COURSE CODE: LDP 603 COURSE TITLE: RESEARCH METHODS LECTURER: GAKUU CHRISTOPHER
Analysing Questionnaires using Minitab (for SPSS queries contact -) [email protected]
 Graham.Currell@uwe.ac.uk") Analysing Questionnaires using Minitab (for SPSS queries contact -) [email protected] Structure As a starting point it is useful to consider a basic questionnaire as containing three main sections:
Analysing Questionnaires using Minitab (for SPSS queries contact -) [email protected] Structure As a starting point it is useful to consider a basic questionnaire as containing three main sections:
II. DISTRIBUTIONS distribution normal distribution. standard scores
 Appendix D Basic Measurement And Statistics The following information was developed by Steven Rothke, PhD, Department of Psychology, Rehabilitation Institute of Chicago (RIC) and expanded by Mary F. Schmidt,
Rank-Based Non-Parametric Tests
 Rank-Based Non-Parametric Tests Reminder: Student Instructional Rating Surveys You have until May 8 th to fill out the student instructional rating surveys at https://sakai.rutgers.edu/portal/site/sirs
Projects Involving Statistics (& SPSS)
") Projects Involving Statistics (& SPSS) Academic Skills Advice Starting a project which involves using statistics can feel confusing as there seems to be many different things you can do (charts, graphs,
Projects Involving Statistics (& SPSS) Academic Skills Advice Starting a project which involves using statistics can feel confusing as there seems to be many different things you can do (charts, graphs,
The Statistics Tutor s Quick Guide to
 statstutor community project encouraging academics to share statistics support resources All stcp resources are released under a Creative Commons licence The Statistics Tutor s Quick Guide to Stcp-marshallowen-7
Introduction to Quantitative Methods
 Introduction to Quantitative Methods October 15, 2009 Contents 1 Definition of Key Terms 2 2 Descriptive Statistics 3 2.1 Frequency Tables......................... 4 2.2 Measures of Central Tendencies.................
1 Nonparametric Statistics
 1 Nonparametric Statistics When finding confidence intervals or conducting tests so far, we always described the population with a model, which includes a set of parameters. Then we could make decisions
Nonparametric Statistics
 Nonparametric Statistics J. Lozano University of Goettingen Department of Genetic Epidemiology Interdisciplinary PhD Program in Applied Statistics & Empirical Methods Graduate Seminar in Applied Statistics
Introduction to Statistics and Quantitative Research Methods
 Introduction to Statistics and Quantitative Research Methods Purpose of Presentation To aid in the understanding of basic statistics, including terminology, common terms, and common statistical methods.
The Dummy s Guide to Data Analysis Using SPSS
 The Dummy s Guide to Data Analysis Using SPSS Mathematics 57 Scripps College Amy Gamble April, 2001 Amy Gamble 4/30/01 All Rights Rerserved TABLE OF CONTENTS PAGE Helpful Hints for All Tests...1 Tests
" Y. Notation and Equations for Regression Lecture 11/4. Notation:
 Notation: Notation and Equations for Regression Lecture 11/4 m: The number of predictor variables in a regression Xi: One of multiple predictor variables. The subscript i represents any number from 1 through
Data analysis process
 Data analysis process Data collection and preparation Collect data Prepare codebook Set up structure of data Enter data Screen data for errors Exploration of data Descriptive Statistics Graphs Analysis
Statistics for Sports Medicine
 Statistics for Sports Medicine Suzanne Hecht, MD University of Minnesota ([email protected]) Fellow s Research Conference July 2012: Philadelphia GOALS Try not to bore you to death!! Try to teach
Descriptive Statistics
 Descriptive Statistics Primer Descriptive statistics Central tendency Variation Relative position Relationships Calculating descriptive statistics Descriptive Statistics Purpose to describe or summarize
ANALYSING LIKERT SCALE/TYPE DATA, ORDINAL LOGISTIC REGRESSION EXAMPLE IN R.
 ANALYSING LIKERT SCALE/TYPE DATA, ORDINAL LOGISTIC REGRESSION EXAMPLE IN R. 1. Motivation. Likert items are used to measure respondents attitudes to a particular question or statement. One must recall
Bivariate Statistics Session 2: Measuring Associations Chi-Square Test
 Bivariate Statistics Session 2: Measuring Associations Chi-Square Test Features Of The Chi-Square Statistic The chi-square test is non-parametric. That is, it makes no assumptions about the distribution
Levels of measurement in psychological research:
 Research Skills: Levels of Measurement. Graham Hole, February 2011 Page 1 Levels of measurement in psychological research: Psychology is a science. As such it generally involves objective measurement of
business statistics using Excel OXFORD UNIVERSITY PRESS Glyn Davis & Branko Pecar
 business statistics using Excel Glyn Davis & Branko Pecar OXFORD UNIVERSITY PRESS Detailed contents Introduction to Microsoft Excel 2003 Overview Learning Objectives 1.1 Introduction to Microsoft Excel
MEASURES OF LOCATION AND SPREAD
 Paper TU04 An Overview of Non-parametric Tests in SAS : When, Why, and How Paul A. Pappas and Venita DePuy Durham, North Carolina, USA ABSTRACT Most commonly used statistical procedures are based on the
Testing Group Differences using T-tests, ANOVA, and Nonparametric Measures
 Testing Group Differences using T-tests, ANOVA, and Nonparametric Measures Jamie DeCoster Department of Psychology University of Alabama 348 Gordon Palmer Hall Box 870348 Tuscaloosa, AL 35487-0348 Phone:
Statistics Review PSY379
 Statistics Review PSY379 Basic concepts Measurement scales Populations vs. samples Continuous vs. discrete variable Independent vs. dependent variable Descriptive vs. inferential stats Common analyses
THE KRUSKAL WALLLIS TEST
 THE KRUSKAL WALLLIS TEST TEODORA H. MEHOTCHEVA Wednesday, 23 rd April 08 THE KRUSKAL-WALLIS TEST: The non-parametric alternative to ANOVA: testing for difference between several independent groups 2 NON
UNDERSTANDING THE INDEPENDENT-SAMPLES t TEST
 UNDERSTANDING The independent-samples t test evaluates the difference between the means of two independent or unrelated groups. That is, we evaluate whether the means for two independent groups are significantly
CHAPTER 14 NONPARAMETRIC TESTS
 CHAPTER 14 NONPARAMETRIC TESTS Everything that we have done up until now in statistics has relied heavily on one major fact: that our data is normally distributed. We have been able to make inferences
Basic Statistics and Data Analysis for Health Researchers from Foreign Countries
 Basic Statistics and Data Analysis for Health Researchers from Foreign Countries Volkert Siersma [email protected] The Research Unit for General Practice in Copenhagen Dias 1 Content Quantifying association
Statistics. One-two sided test, Parametric and non-parametric test statistics: one group, two groups, and more than two groups samples
 Statistics One-two sided test, Parametric and non-parametric test statistics: one group, two groups, and more than two groups samples February 3, 00 Jobayer Hossain, Ph.D. & Tim Bunnell, Ph.D. Nemours
Non-Parametric Tests (I)
") Lecture 5: Non-Parametric Tests (I) KimHuat LIM [email protected] http://www.stats.ox.ac.uk/~lim/teaching.html Slide 1 5.1 Outline (i) Overview of Distribution-Free Tests (ii) Median Test for Two Independent
Lecture 5: Non-Parametric Tests (I) KimHuat LIM [email protected] http://www.stats.ox.ac.uk/~lim/teaching.html Slide 1 5.1 Outline (i) Overview of Distribution-Free Tests (ii) Median Test for Two Independent
Analysis of Data. Organizing Data Files in SPSS. Descriptive Statistics
 Analysis of Data Claudia J. Stanny PSY 67 Research Design Organizing Data Files in SPSS All data for one subject entered on the same line Identification data Between-subjects manipulations: variable to
DESCRIPTIVE STATISTICS. The purpose of statistics is to condense raw data to make it easier to answer specific questions; test hypotheses.
 DESCRIPTIVE STATISTICS The purpose of statistics is to condense raw data to make it easier to answer specific questions; test hypotheses. DESCRIPTIVE VS. INFERENTIAL STATISTICS Descriptive To organize,
SPSS Explore procedure
 SPSS Explore procedure One useful function in SPSS is the Explore procedure, which will produce histograms, boxplots, stem-and-leaf plots and extensive descriptive statistics. To run the Explore procedure,
Research Methods & Experimental Design
 Research Methods & Experimental Design 16.422 Human Supervisory Control April 2004 Research Methods Qualitative vs. quantitative Understanding the relationship between objectives (research question) and
QUANTITATIVE METHODS BIOLOGY FINAL HONOUR SCHOOL NON-PARAMETRIC TESTS
 QUANTITATIVE METHODS BIOLOGY FINAL HONOUR SCHOOL NON-PARAMETRIC TESTS This booklet contains lecture notes for the nonparametric work in the QM course. This booklet may be online at http://users.ox.ac.uk/~grafen/qmnotes/index.html.
DATA INTERPRETATION AND STATISTICS
 PholC60 September 001 DATA INTERPRETATION AND STATISTICS Books A easy and systematic introductory text is Essentials of Medical Statistics by Betty Kirkwood, published by Blackwell at about 14. DESCRIPTIVE
Comparing Means in Two Populations
 Comparing Means in Two Populations Overview The previous section discussed hypothesis testing when sampling from a single population (either a single mean or two means from the same population). Now we
SCHOOL OF HEALTH AND HUMAN SCIENCES DON T FORGET TO RECODE YOUR MISSING VALUES
 SCHOOL OF HEALTH AND HUMAN SCIENCES Using SPSS Topics addressed today: 1. Differences between groups 2. Graphing Use the s4data.sav file for the first part of this session. DON T FORGET TO RECODE YOUR
An introduction to IBM SPSS Statistics
 An introduction to IBM SPSS Statistics Contents 1 Introduction... 1 2 Entering your data... 2 3 Preparing your data for analysis... 10 4 Exploring your data: univariate analysis... 14 5 Generating descriptive
Statistics. Measurement. Scales of Measurement 7/18/2012
 Statistics Measurement Measurement is defined as a set of rules for assigning numbers to represent objects, traits, attributes, or behaviors A variableis something that varies (eye color), a constant does
Statistical tests for SPSS
 Statistical tests for SPSS Paolo Coletti A.Y. 2010/11 Free University of Bolzano Bozen Premise This book is a very quick, rough and fast description of statistical tests and their usage. It is explicitly
Chapter 7 Section 7.1: Inference for the Mean of a Population
 Chapter 7 Section 7.1: Inference for the Mean of a Population Now let s look at a similar situation Take an SRS of size n Normal Population : N(, ). Both and are unknown parameters. Unlike what we used
Analyzing Research Data Using Excel
 Analyzing Research Data Using Excel Fraser Health Authority, 2012 The Fraser Health Authority ( FH ) authorizes the use, reproduction and/or modification of this publication for purposes other than commercial
Nonparametric Two-Sample Tests. Nonparametric Tests. Sign Test
 Nonparametric Two-Sample Tests Sign test Mann-Whitney U-test (a.k.a. Wilcoxon two-sample test) Kolmogorov-Smirnov Test Wilcoxon Signed-Rank Test Tukey-Duckworth Test 1 Nonparametric Tests Recall, nonparametric
The Chi-Square Test. STAT E-50 Introduction to Statistics
 STAT -50 Introduction to Statistics The Chi-Square Test The Chi-square test is a nonparametric test that is used to compare experimental results with theoretical models. That is, we will be comparing observed
Introduction to Statistics with GraphPad Prism (5.01) Version 1.1
 Version 1.1") Babraham Bioinformatics Introduction to Statistics with GraphPad Prism (5.01) Version 1.1 Introduction to Statistics with GraphPad Prism 2 Licence This manual is 2010-11, Anne Segonds-Pichon. This manual
Babraham Bioinformatics Introduction to Statistics with GraphPad Prism (5.01) Version 1.1 Introduction to Statistics with GraphPad Prism 2 Licence This manual is 2010-11, Anne Segonds-Pichon. This manual
January 26, 2009 The Faculty Center for Teaching and Learning
 THE BASICS OF DATA MANAGEMENT AND ANALYSIS A USER GUIDE January 26, 2009 The Faculty Center for Teaching and Learning THE BASICS OF DATA MANAGEMENT AND ANALYSIS Table of Contents Table of Contents... i
Research Methodology: Tools
 MSc Business Administration Research Methodology: Tools Applied Data Analysis (with SPSS) Lecture 11: Nonparametric Methods May 2014 Prof. Dr. Jürg Schwarz Lic. phil. Heidi Bruderer Enzler Contents Slide
Study Guide for the Final Exam
 Study Guide for the Final Exam When studying, remember that the computational portion of the exam will only involve new material (covered after the second midterm), that material from Exam 1 will make
Bowerman, O'Connell, Aitken Schermer, & Adcock, Business Statistics in Practice, Canadian edition
 Bowerman, O'Connell, Aitken Schermer, & Adcock, Business Statistics in Practice, Canadian edition Online Learning Centre Technology Step-by-Step - Excel Microsoft Excel is a spreadsheet software application
Biostatistics: Types of Data Analysis
 Biostatistics: Types of Data Analysis Theresa A Scott, MS Vanderbilt University Department of Biostatistics [email protected] http://biostat.mc.vanderbilt.edu/theresascott Theresa A Scott, MS
Parametric and non-parametric statistical methods for the life sciences - Session I
 Why nonparametric methods What test to use? Rank Tests Parametric and non-parametric statistical methods for the life sciences - Session I Liesbeth Bruckers Geert Molenberghs Interuniversity Institute
Simple Linear Regression Inference
 Simple Linear Regression Inference 1 Inference requirements The Normality assumption of the stochastic term e is needed for inference even if it is not a OLS requirement. Therefore we have: Interpretation
Using Excel for inferential statistics
 FACT SHEET Using Excel for inferential statistics Introduction When you collect data, you expect a certain amount of variation, just caused by chance. A wide variety of statistical tests can be applied
The Kruskal-Wallis test:
 Graham Hole Research Skills Kruskal-Wallis handout, version 1.0, page 1 The Kruskal-Wallis test: This test is appropriate for use under the following circumstances: (a) you have three or more conditions
UNDERSTANDING THE TWO-WAY ANOVA
 UNDERSTANDING THE e have seen how the one-way ANOVA can be used to compare two or more sample means in studies involving a single independent variable. This can be extended to two independent variables
Section 3 Part 1. Relationships between two numerical variables
 Section 3 Part 1 Relationships between two numerical variables 1 Relationship between two variables The summary statistics covered in the previous lessons are appropriate for describing a single variable.
NONPARAMETRIC STATISTICS 1. depend on assumptions about the underlying distribution of the data (or on the Central Limit Theorem)
") NONPARAMETRIC STATISTICS 1 PREVIOUSLY parametric statistics in estimation and hypothesis testing... construction of confidence intervals computing of p-values classical significance testing depend on assumptions
NONPARAMETRIC STATISTICS 1 PREVIOUSLY parametric statistics in estimation and hypothesis testing... construction of confidence intervals computing of p-values classical significance testing depend on assumptions
Normality Testing in Excel
 Normality Testing in Excel By Mark Harmon Copyright 2011 Mark Harmon No part of this publication may be reproduced or distributed without the express permission of the author. [email protected]
Mathematics within the Psychology Curriculum
 Mathematics within the Psychology Curriculum Statistical Theory and Data Handling Statistical theory and data handling as studied on the GCSE Mathematics syllabus You may have learnt about statistics and
Nonparametric tests these test hypotheses that are not statements about population parameters (e.g.,
 CHAPTER 13 Nonparametric and Distribution-Free Statistics Nonparametric tests these test hypotheses that are not statements about population parameters (e.g., 2 tests for goodness of fit and independence).
3.4 Statistical inference for 2 populations based on two samples
 3.4 Statistical inference for 2 populations based on two samples Tests for a difference between two population means The first sample will be denoted as X 1, X 2,..., X m. The second sample will be denoted
Calculating, Interpreting, and Reporting Estimates of Effect Size (Magnitude of an Effect or the Strength of a Relationship)
") 1 Calculating, Interpreting, and Reporting Estimates of Effect Size (Magnitude of an Effect or the Strength of a Relationship) I. Authors should report effect sizes in the manuscript and tables when reporting
1 Calculating, Interpreting, and Reporting Estimates of Effect Size (Magnitude of an Effect or the Strength of a Relationship) I. Authors should report effect sizes in the manuscript and tables when reporting
t Tests in Excel The Excel Statistical Master By Mark Harmon Copyright 2011 Mark Harmon
 t-tests in Excel By Mark Harmon Copyright 2011 Mark Harmon No part of this publication may be reproduced or distributed without the express permission of the author. [email protected] www.excelmasterseries.com
DATA COLLECTION AND ANALYSIS
 DATA COLLECTION AND ANALYSIS Quality Education for Minorities (QEM) Network HBCU-UP Fundamentals of Education Research Workshop Gerunda B. Hughes, Ph.D. August 23, 2013 Objectives of the Discussion 2 Discuss
Simple Predictive Analytics Curtis Seare
 Using Excel to Solve Business Problems: Simple Predictive Analytics Curtis Seare Copyright: Vault Analytics July 2010 Contents Section I: Background Information Why use Predictive Analytics? How to use
Nonparametric Statistics
 Nonparametric Statistics References Some good references for the topics in this course are 1. Higgins, James (2004), Introduction to Nonparametric Statistics 2. Hollander and Wolfe, (1999), Nonparametric
Foundation of Quantitative Data Analysis
 Foundation of Quantitative Data Analysis Part 1: Data manipulation and descriptive statistics with SPSS/Excel HSRS #10 - October 17, 2013 Reference : A. Aczel, Complete Business Statistics. Chapters 1
Recall this chart that showed how most of our course would be organized:
 Chapter 4 One-Way ANOVA Recall this chart that showed how most of our course would be organized: Explanatory Variable(s) Response Variable Methods Categorical Categorical Contingency Tables Categorical
Association Between Variables
 Contents 11 Association Between Variables 767 11.1 Introduction............................ 767 11.1.1 Measure of Association................. 768 11.1.2 Chapter Summary.................... 769 11.2 Chi
TABLE OF CONTENTS. About Chi Squares... 1. What is a CHI SQUARE?... 1. Chi Squares... 1. Hypothesis Testing with Chi Squares... 2
 About Chi Squares TABLE OF CONTENTS About Chi Squares... 1 What is a CHI SQUARE?... 1 Chi Squares... 1 Goodness of fit test (One-way χ 2 )... 1 Test of Independence (Two-way χ 2 )... 2 Hypothesis Testing
X X X a) perfect linear correlation b) no correlation c) positive correlation (r = 1) (r = 0) (0 < r < 1)
 perfect linear correlation b) no correlation c) positive correlation (r = 1) (r = 0) (0 < r < 1)") CORRELATION AND REGRESSION / 47 CHAPTER EIGHT CORRELATION AND REGRESSION Correlation and regression are statistical methods that are commonly used in the medical literature to compare two or more variables.
CORRELATION AND REGRESSION / 47 CHAPTER EIGHT CORRELATION AND REGRESSION Correlation and regression are statistical methods that are commonly used in the medical literature to compare two or more variables.
We are often interested in the relationship between two variables. Do people with more years of full-time education earn higher salaries?
 Statistics: Correlation Richard Buxton. 2008. 1 Introduction We are often interested in the relationship between two variables. Do people with more years of full-time education earn higher salaries? Do
DATA ANALYSIS. QEM Network HBCU-UP Fundamentals of Education Research Workshop Gerunda B. Hughes, Ph.D. Howard University
 DATA ANALYSIS QEM Network HBCU-UP Fundamentals of Education Research Workshop Gerunda B. Hughes, Ph.D. Howard University Quantitative Research What is Statistics? Statistics (as a subject) is the science
Parametric and Nonparametric: Demystifying the Terms
 Parametric and Nonparametric: Demystifying the Terms By Tanya Hoskin, a statistician in the Mayo Clinic Department of Health Sciences Research who provides consultations through the Mayo Clinic CTSA BERD
Why Taking This Course? Course Introduction, Descriptive Statistics and Data Visualization. Learning Goals. GENOME 560, Spring 2012
 Why Taking This Course? Course Introduction, Descriptive Statistics and Data Visualization GENOME 560, Spring 2012 Data are interesting because they help us understand the world Genomics: Massive Amounts
COMPARISONS OF CUSTOMER LOYALTY: PUBLIC & PRIVATE INSURANCE COMPANIES.
 277 CHAPTER VI COMPARISONS OF CUSTOMER LOYALTY: PUBLIC & PRIVATE INSURANCE COMPANIES. This chapter contains a full discussion of customer loyalty comparisons between private and public insurance companies
Likert Scales. are the meaning of life: Dane Bertram
 are the meaning of life: Note: A glossary is included near the end of this handout defining many of the terms used throughout this report. Likert Scale \lick urt\, n. Definition: Variations: A psychometric
Introduction to Regression and Data Analysis
 Statlab Workshop Introduction to Regression and Data Analysis with Dan Campbell and Sherlock Campbell October 28, 2008 I. The basics A. Types of variables Your variables may take several forms, and it
11. Analysis of Case-control Studies Logistic Regression
 Research methods II 113 11. Analysis of Case-control Studies Logistic Regression This chapter builds upon and further develops the concepts and strategies described in Ch.6 of Mother and Child Health:
CHAPTER 14 ORDINAL MEASURES OF CORRELATION: SPEARMAN'S RHO AND GAMMA
 CHAPTER 14 ORDINAL MEASURES OF CORRELATION: SPEARMAN'S RHO AND GAMMA Chapter 13 introduced the concept of correlation statistics and explained the use of Pearson's Correlation Coefficient when working
NCSS Statistical Software
 Chapter 06 Introduction This procedure provides several reports for the comparison of two distributions, including confidence intervals for the difference in means, two-sample t-tests, the z-test, the
1. What is the critical value for this 95% confidence interval? CV = z.025 = invnorm(0.025) = 1.96
 = 1.96") 1 Final Review 2 Review 2.1 CI 1-propZint Scenario 1 A TV manufacturer claims in its warranty brochure that in the past not more than 10 percent of its TV sets needed any repair during the first two years
1 Final Review 2 Review 2.1 CI 1-propZint Scenario 1 A TV manufacturer claims in its warranty brochure that in the past not more than 10 percent of its TV sets needed any repair during the first two years
Bill Burton Albert Einstein College of Medicine [email protected] April 28, 2014 EERS: Managing the Tension Between Rigor and Resources 1
 Bill Burton Albert Einstein College of Medicine [email protected] April 28, 2014 EERS: Managing the Tension Between Rigor and Resources 1 Calculate counts, means, and standard deviations Produce
SPSS TUTORIAL & EXERCISE BOOK
 UNIVERSITY OF MISKOLC Faculty of Economics Institute of Business Information and Methods Department of Business Statistics and Economic Forecasting PETRA PETROVICS SPSS TUTORIAL & EXERCISE BOOK FOR BUSINESS
Linear Models in STATA and ANOVA
 Session 4 Linear Models in STATA and ANOVA Page Strengths of Linear Relationships 4-2 A Note on Non-Linear Relationships 4-4 Multiple Linear Regression 4-5 Removal of Variables 4-8 Independent Samples
Independent t- Test (Comparing Two Means)
") Independent t- Test (Comparing Two Means) The objectives of this lesson are to learn: the definition/purpose of independent t-test when to use the independent t-test the use of SPSS to complete an independent
Independent t- Test (Comparing Two Means) The objectives of this lesson are to learn: the definition/purpose of independent t-test when to use the independent t-test the use of SPSS to complete an independent
Tutorial 5: Hypothesis Testing
 Tutorial 5: Hypothesis Testing Rob Nicholls [email protected] MRC LMB Statistics Course 2014 Contents 1 Introduction................................ 1 2 Testing distributional assumptions....................
Difference tests (2): nonparametric
: nonparametric") NST 1B Experimental Psychology Statistics practical 3 Difference tests (): nonparametric Rudolf Cardinal & Mike Aitken 10 / 11 February 005; Department of Experimental Psychology University of Cambridge
NST 1B Experimental Psychology Statistics practical 3 Difference tests (): nonparametric Rudolf Cardinal & Mike Aitken 10 / 11 February 005; Department of Experimental Psychology University of Cambridge
Permutation Tests for Comparing Two Populations
 Permutation Tests for Comparing Two Populations Ferry Butar Butar, Ph.D. Jae-Wan Park Abstract Permutation tests for comparing two populations could be widely used in practice because of flexibility of
Part 3. Comparing Groups. Chapter 7 Comparing Paired Groups 189. Chapter 8 Comparing Two Independent Groups 217
 Part 3 Comparing Groups Chapter 7 Comparing Paired Groups 189 Chapter 8 Comparing Two Independent Groups 217 Chapter 9 Comparing More Than Two Groups 257 188 Elementary Statistics Using SAS Chapter 7 Comparing
Descriptive and Inferential Statistics
 General Sir John Kotelawala Defence University Workshop on Descriptive and Inferential Statistics Faculty of Research and Development 14 th May 2013 1. Introduction to Statistics 1.1 What is Statistics?
Dongfeng Li. Autumn 2010
 Autumn 2010 Chapter Contents Some statistics background; ; Comparing means and proportions; variance. Students should master the basic concepts, descriptive statistics measures and graphs, basic hypothesis
NCSS Statistical Software
 Chapter 06 Introduction This procedure provides several reports for the comparison of two distributions, including confidence intervals for the difference in means, two-sample t-tests, the z-test, the
The Wilcoxon Rank-Sum Test
 1 The Wilcoxon Rank-Sum Test The Wilcoxon rank-sum test is a nonparametric alternative to the twosample t-test which is based solely on the order in which the observations from the two samples fall. We
Correlation Coefficient The correlation coefficient is a summary statistic that describes the linear relationship between two numerical variables 2
 Lesson 4 Part 1 Relationships between two numerical variables 1 Correlation Coefficient The correlation coefficient is a summary statistic that describes the linear relationship between two numerical variables
Instructions for SPSS 21
 1 Instructions for SPSS 21 1 Introduction... 2 1.1 Opening the SPSS program... 2 1.2 General... 2 2 Data inputting and processing... 2 2.1 Manual input and data processing... 2 2.2 Saving data... 3 2.3
Chapter 13 Introduction to Linear Regression and Correlation Analysis
 Chapter 3 Student Lecture Notes 3- Chapter 3 Introduction to Linear Regression and Correlation Analsis Fall 2006 Fundamentals of Business Statistics Chapter Goals To understand the methods for displaing
6.4 Normal Distribution
 Contents 6.4 Normal Distribution....................... 381 6.4.1 Characteristics of the Normal Distribution....... 381 6.4.2 The Standardized Normal Distribution......... 385 6.4.3 Meaning of Areas under
Students' Opinion about Universities: The Faculty of Economics and Political Science (Case Study)
") Cairo University Faculty of Economics and Political Science Statistics Department English Section Students' Opinion about Universities: The Faculty of Economics and Political Science (Case Study) Prepared
Cairo University Faculty of Economics and Political Science Statistics Department English Section Students' Opinion about Universities: The Faculty of Economics and Political Science (Case Study) Prepared
Reporting Statistics in Psychology
 This document contains general guidelines for the reporting of statistics in psychology research. The details of statistical reporting vary slightly among different areas of science and also among different