A host-pathogen simulation model: powdery mildew of grapevine
|
|
|
- Corey Clark
- 10 years ago
- Views:
Transcription
1 Doi: /j x Blackwell Publishing Ltd A host-pathogen simulation model: powdery mildew of grapevine A. Calonnec a *, P. Cartolaro a, J.-M. Naulin a, D. Bailey a and M. Langlais b a INRA-Bordeaux, UMR INRA-ENITA 1065 Santé Végétale BP 81, Villenave d Ornon; and b UMR CNRS 5251, IMB & INRIA Futurs Anubis case 26, Université Victor Segalen Bordeaux 2, Bordeaux, France An epidemiological model simulating the growth of a single grapevine stock coupled to the dispersal and disease dynamics of the airborne conidia of the powdery mildew pathogen Erysiphe necator was developed. The model input variables were either climatic (temperature, wind speed and direction) or related to the pathogen (location and onset of primary infection). The environmental input variables dictated plant growth and pathogen spread (latent period, infection, lesion growth, conidial spore production and release). Input parameters characterized the crop production system, the growth conditions and the epidemiological characteristics of the pathogen. Output described, at each time step, number, age and pattern of healthy and infected organs, infected and infectious leaf area and aerial density of spores released. Validation of the model was achieved by comparing model output with experimental data for epidemics initiated at different times of host growth. Epidemic behaviour for two contrasting years of crop development and 7 phenological stages at the time of primary infection (PI) was examined. For PI occurring at day 115 a vine with late budbreak (1998) showed 58% of primary leaves diseased at flowering compared with only 19% for a vine with early budbreak (2003). Depending on the phenological stage at PI (1 4 leaves), the proportion of diseased primary leaves decreased from 42% to 6% at flowering. Simulations suggested that differences resulted from the interplay between the timing of the first sporulation event, the phenological stage at the time of initial infection, and the age structure and spatial distribution of the leaf population. Keywords: architectural model, dispersal, Erysiphe necator, invasive spread, Vitis vinifera Introduction In this paper the construction of a detailed, discrete deterministic simulation model coupling the development and spread of a fungus Erysiphe necator, with the development of its host, the perennial crop Vitis vinifera, is described. The model was used to show, by simulation, the dependence of epidemic development on climatic variables and crop management parameters. The model was designed to (i) quantify and rank the most important host and pathogen factors that modify the dynamic interactions between pathogen, host and their environment and, (ii) simulate the spatiotemporal dynamics of host growth and epidemic development, beginning from a range of climatic conditions, production systems and initial conditions for the density and location of the pathogen, in order to identify situations most conducive to the spread of disease. * [email protected] Present address: UMR Bio3P, INRA-Agrocampus Rennes, BP35327, Le Rheu cedex, France. Accepted 20 August 2007 The grape-powdery mildew pathosystem is characterized by a polycyclic pathogen capable of explosive multiplication and a host population with a high degree of spatial structure at the field level and with a complex architecture of leaf and berry structure at the individual plant level exhibiting rapid changes over time. As well as environmental differences, the high degree of human interference during vine development and the wide diversity of cropping systems further enhances variability from one crop to another and hence, variability between epidemics. Primary infection occurs either through ascospore release from chasmothecia that overwinter in the bark of the vine (Cortesi et al., 1995) or via colonization of new shoots from resting mycelium that overwinter within dormant buds (Sall & Wrysinski, 1982). Epidemics continue to spread by secondary infections by conidia from sporulating lesions of infected leaves to new susceptible leaves. Importantly, the leaf epidemic provides a source of inoculum for the infection of developing berries. Because of the tight relationship between powdery mildew and its host (Doster & Schnathorst, 1985; Ficke et al., 2002, 2003; Gadoury et al., 2003) and of the spatial location of primary infections on the vine stock, dynamic changes in crop structure should be considered as key factors for explaining variability in the severity of epidemic behaviour The Authors Journal compilation 2008 BSPP 493
 or related to the pathogen (location and onset of primary infection).")
2 494 A. Calonnec et al. Indeed, by modifying the movement of inoculum (by creating a leaf barrier or by altering the distance between infected and susceptible leaves), or by altering the susceptibility of the leaf population as it changes with age of the crop, natural and management-induced changes in crop growth and crop architecture may significantly affect the course of an epidemic. In the first analytical model of Van der Plank (1963, 1982) disease development was proportional to the amount of infectious (sporulating) and available tissue with a constant infection rate (multiplication factor of disease per unit), a constant latent period and with random dispersion of inoculum between infected and susceptible hosts. There have been several attempts to combine host and pathogen development since in order to account for the effect of changing environments on disease progress. According to Hau (1990), the only way for a disease progress curve to diminish is through a changing host, either by (i) an increase of susceptible tissue, referred to as a dilution effect, or (ii) by the loss of the diseased tissue by defoliation, referred to as a thinning-out effect, or (iii) as a result of ontogenic resistance. For vine and powdery mildew, a set of deterministic models taking into account host growth and based on the modified Van der Plank equations were developed (Sall, 1980; Blaise & Gessler, 1992; Gessler & Blaise, 1992). In the Sall model, vine growth was introduced through a submodel of global surface area evolving as a function of temperature and time. The apparent infection rate was a function of temperature and moisture. The model was able to describe differences in disease severity depending on weather conditions, especially temperature. Blaise & Gessler (1992), introduced host growth into Van der Plank s equation as a homogenous, increasing susceptible surface, and a latent period as a function of temperature. In their simulations, introduction of host growth affected the rate of infection and was sufficient to slow down or even arrest the spread of disease. The model did not, however, account for studies concerning the dependence of infection rate on pathogen dispersal and/or on host-pathogen interactions. The infection rate used to initiate the model was calculated from epidemic data, incorporating environmental conditions of that epidemic alone. Thus, for a better understanding of host/pathogen dynamic interactions and the capacity of host development to modify disease progress, a spatially explicit, epidemiological simulation model coupling vine stock growth with the spread of powdery mildew was developed in the present work. This model incorporated terms for the dynamics of host growth, ontogenic resistance, the distance between susceptible and resistant organs, the synchronism between host and pathogen development, and the epidemiological traits of pathogen growth and dispersal. The model was built at the scale of a single vine, yet facilitated the study of interactions between all of these components during a single growing season. The behaviour of the model and the interactions at the single-vine scale was considered an essential first step prior to incorporating the role of the host, i.e. crop structure and heterogeneity in vine vigour, into powdery mildew invasion at larger scale (Calonnec et al., 2005; Tessier et al., 2006). Because of the complexity involved in the accurate description of the geometry of cluster development (Fanizza & Colonna, 1996) and the high correlation between damage on bunches and the amount and dynamics of the disease on leaves, the spread of disease was restricted to the leaf population only. Indeed, the spatial relationship between the maps of the frequency of diseased leaves around flowering and the maps of frequency of bunches with high severity at bunch closure was demonstrated on grape cv. Cabernet Sauvignon (Peyrard et al., 2005; Calonnec et al., 2006). The development of the spatial arrangement of host organs within the vine stock was achieved by using a 3-D architectural model. Such virtual plant growth models providing visual output already exist (Weber & Penn, 1995; Deussen & Linterman, 1997; Prusinkiewicz, 1997) and are considered powerful research tools (Room et al., 1996; Birch et al., 2003), especially after interfacing with models of plant ecophysiology (Tardieu, 2003), insect behaviour (Hanan et al., 2002; Skirvin, 2006) or disease damage (Wilson & Chakraborty, 1998). In this paper the derivation, parameterization, output and behaviour of the epidemiological model coupling the temporal and spatial vine growth with the development and spread of powdery mildew at the vine stock scale is presented. To illustrate the behaviour of the model and the use of the model as a research tool, epidemics were simulated using environmental data reflecting two contrasting but representative seasons of vine growth. The model was used to identify key processes in the interplay between host and pathogen factors that account for differences in epidemic development. Materials and methods Model derivation The model simulated the development of a single vine stock during a single season. This was coupled with the simulation of inoculum and disease dynamics from primary infection of susceptible leaves and secondary conidial infection as disease spreads from sporulating lesions. Functions, parameterized from the literature or from experimental data, were used to describe growth of the host and spread of the pathogen. The model input variables were environmental (temperature, wind speed and direction) or related to the pathogen (location and onset of primary infection). The environmental input variables dictated growth of the crop (appearance and growth of organs) and spread of the pathogen (latent period, infection, lesion growth, spore production and release). Input parameters characterized the crop system (number of buds, training system) and conditions of growth for the vine and the pathogen. Grapevine development The development of the spatial arrangement of host organs within the vine stock was captured within a 3-D
 disease development was proportional to the amount of infectious (sporulating) and available tissue with a constant infection rate")
3 Simulating grapevine powdery mildew epidemiology 495 architectural model. An object-based approach, considering the plant as a structure composed of relatively simple units (leaves, internodes, growth units, etc.), was used. This had the advantage that changes in plant architecture would appear automatically in the model, resulting from interactions between the units. The generation rules were derived from the following assumptions: (i) Plants naturally involve, not just a set of elements, but also a set of connections between pairs of elements. To model this situation, abstract objects called graphs (a graph being a set of vertices and a set of edges that connect pairs of distinct vertices) (West, 1995; Diestel, 2000) were used. The vine stock was divided into three principal components: leaves, internodes and bunches. Each element was connected to subsequent elements by order of growth and could be tracked in space by its x, y and z coordinates, which could, in turn, be used to store all other associated information (e.g. position, angle, age, etc.). This relatively simple structure enabled the state of the plant and of each of its components at a given time to be defined. (ii) A set of modules (appearance, organ growth, development of the pathogen) described the rules driving each component dynamics. Each module integrated the biological rules described in the next section. The time interval for updating the simulation was 1 day. At each time step, rules were applied to each component depending on the accumulated temperature. The structure of the vine stock was recomputed at each time step and the status of the epidemic updated following the update of host growth. Initial conditions and development of the host Differences in initial host structure were facilitated by input parameters that reflecting different pruning strategies: height of the trunk, initial number of buds, and distance between buds. First leaves were initiated after reaching a certain sum of degree-days above 10 C (starting on 1 January), varying depending on grape cultivar and date of pruning (Bindi et al., 1997; Gaudillere et al., 1999). For shoot topping, removal of leaves associated with shoots exceeding a given height at a chosen date was simulated. Leaves and internodes The model included the appearance and development of both primary and secondary leaves. The initial appearance of leaves on the shoots was controlled by temperature and corresponded to an accumulated sum of 20 degree-days above 10 C (Miglietta et al., 1992; Schultz, 1992). The maximum theoretical size, S row, for a leaf at a given level on a shoot depended on its row on the shoot and on a theoretical maximum leaf surface, S max, thus: Smax Srow = (1) ( 1 row) 1 + ae where a was a scaling parameter fitted to the surface of the first leaf, S 1, thus: a = (S max S 1 )/S 1. Change in the area of leaf surface, S, with time, t, followed a logistic equation of the form ds S = Ψ( TS ) ( 1 ) (2) dt S row with a growth-rate-functional response to temperature Ψ(T) (from 0 to 1). Temperature for leaf appearance and S max were input parameters that could be changed depending upon the grape cultivar, whilst parameters could vary for primary and secondary leaves. The length of internodes depended also on temperature and their position on the shoot. The maximum size of internodes followed a logistic growth pattern similar to that of the leaves (Eqn 1). Secondary shoots In vineyards, the appearance and growth of secondary shoots is highly variable, depending on the vigour of the vine and the date and extent of shoot topping. The final length of a secondary shoot depends on the position of the shoot on the primary stem and on the dominance (apical) of the primary stem. In this model, the number of leaves on a secondary shoot depended on its row, N, on the primary shoot and was given by a distribution function E[ ν N e kn ] where k was a shape parameter, 1/k corresponded to the row at which a secondary shoot achieved the maximum number of leaves, ν drove the maximum number of leaves on a secondary shoot and E[X] was the integer part of X. The development of secondary shoots is stimulated by topping (resulting from the removal of apical dominance in primary shoots), but growth was described in a similar way to that for primary shoots (logistic in type and dependent on temperature), with different parameters (maximum length). The rate of appearance and development of secondary leaves could also be enhanced by a parameter for vigour. Grape clusters The precise geometry of grape cluster development was not introduced into the model. Grape clusters were instead represented as simple cones growing over time and located on primary shoots at a level between the second and fifth primary leaf (based on experimental data). Grapes appeared at the same time as primary leaves and their growth followed a rhythm driven by temperature. Parameters Parameters related to the appearance and size of leaves and internodes were assessed and estimated from data collected during 2002 from vineyards at INRA Grande Ferrade of cv. Cabernet Sauvignon, after marking and scoring the occurrence of each new leaf on a set of 94 (2002) shoots. Other parameters, such as angles of growth and leaf orientation were directly included in the computing code and were determined based on 20 digitalized vines. (3)
 Plants naturally involve, not just a set of elements, but also a set of connections between pairs of elements.")
4 496 A. Calonnec et al. Pathogen development Temperature and leaf age are generally recognized as the driving force for pathogen development (growth and sporulation of lesions), whilst wind factors (direction, speed) dictate inoculum (spore) dispersal (Rabbinge & Bastiaans, 1989). In the model presented here, the dynamics of the pathogen population on leaves were split into three key processes: (a) infection, (b) colony or mycelium growth, and (c) sporulation and dispersion. The time between infection and sporulation was described as the latent period, and the duration of sporulation as the infectious period. The standard formula of Analytis (1977, 1980) was used to describe the effect of temperature on the rate of spore infection and on the rate of mycelium growth. F was a function of a normalized temperature T n. ( m + n) FT ( n) = nm ( mn + ) n m n n m Tt () T T ( 1 Tn), with Tn = T T where T(t) was temperature at time t and T max and T min were the cardinal temperatures for either mycelial growth or infection (T maxg and T ming, respectively), with m and n (mg and ng, respectively) shape parameters of the curve. F followed a gamma function with temperature. Infection Experimental data relating percentage, I, of spores capable of infecting a leaf of age, A, were described by the function max min min, (4) Latent period The latent period represented the time between initial infection and the appearance of new spores. The expected latent period, ρ(t), at temperature T was given by ρmin ρ( T) = (8) FT ( n ) where ρ min was the minimum time before the appearance of the first spores (Analytis, 1980; Gessler & Blaise, 1992; Rumbolz, 1999). In the model, the latent period was completed when Σ [1/ρ(T)] = 1, with 1/ρ(T) the fraction of the latent period at temperature T. Sporulation The quantity of spores released from a lesion depends on wind speed (Willocquet et al., 1998). The fraction, Q s, of spores dispersed from a sporulating leaf at a given wind speed, u (m s 1 ), takes the following form αub + e Qs = (9) αub e with parameters α and b. The quantity of spores, Q, produced during a given period was a function of the colony size, s, thus: Q = βe ( δ s) (10) with δ and β scaling parameters. The quantity of spores released from a colony of a given size at time t was: I = I FT ( ) e 0 n τ* A (5) Qr = Qs[ Qt ( ) + Rt ( 1)] (11) with τ the decay rate of leaf susceptibility, I 0 the maximum infection rate at optimum temperature, and F(T n ) the gamma function with change in temperature T (cf. Eqn 4). I 0 F(T n ) was almost zero at T < 10 C and T > 30 C; it had a maximum at T 22 C (Delp, 1954; Sall, 1980). Colony growth From experimental data describing the growth of powdery mildew colonies on leaves sampled in the vineyard and contaminated by one spore, the colony diameter, D, over time, t, had a temperature-dependent logistic form. To avoid temperature-driven numerical oscillations in diameter, the discrete linearized form was used: Dt ( + 1) = Dt () + K FT ( ) max with K max the maximum colony diameter, r the rate of growth, t* the time to K max /2, and F(T n ) the rate of mycelium growth with temperature (cf. Eqn 4). The maximum diameter of the colony also decreased as a function of leaf age ( c* age) K = ( A Be ) + B max where A, B and c were scaling parameters. n rt (* t) r e 2 rt (* t) [ 1 + e ] (6) (7) with R(t 1) the quantity of infectious spores not dispersed at time t 1. Infectious period The sporulation period or infectious period is poorly understood for powdery mildew of grapevine, with reports of it ranging from 3 to 20 days (Chellemi & Marois, 1991; Blaise & Gessler, 1992; Gessler & Blaise, 1992). In this model, the infectious period, one of the most difficult parameters to measure, is accounted for with one input variable. Inoculum (spore) dispersal Spore dispersal was described as the motion and shortrange dispersal of a large sample of particles released from each source (colony). At each time step, a quantity, Q r, of spores was released, depending on wind intensity and colony size. These spores were dispersed within a cone of angle θ with respect to an axis given by wind direction. Spore density decreased in two ways, first as an exponential dilution with axial distance to the source, d (with cid a parameter of decay with the distance) and then linearly according to the radial position, r(θ), within the cone. The quantity of spores deposited on a leaf, Q c, depended upon its distance from the source, (d, r(θ)), and was proportional to surface area (Q c Q r S exp( cid d)) (Fig. 1).
 infection, (b) colony or mycelium growth, and (c) sporulation and dispersion.")
5 Simulating grapevine powdery mildew epidemiology 497 Figure 1 Schematic representation of the dispersal process from a sporulating source. The number of spores deposited on a leaf depends upon its distance, d, from the source, its radial position, r (θ), in the cone of spores released, and its surface area, S. Following each time step, the model tracked the x, y, and z coordinates of each group of released and received spores over time. The percentage of spores infecting a leaf of a given age and at a given temperature was determined by Eqn 5. Eddies of wind and leaf shaking are the most efficient for the spore dispersion. Because vertical wind speed was not available from standard climatic data and had to be calculated from hourly climatic data, maximum wind speed and direction for the maximum speed during the day were used instead of the average wind speed. Parameters Parameters for pathogen development were assessed from literature (latent period, spore release) or estimated from laboratory experiments carried out at INRA, Bordeaux, from 2001 to 2003 on detached leaves removed from cuttings (infection and colony growth as a function of temperature) or from shoots of field grown vines (sporulation, infection or colony growth, depending on leaf age). Model output Outputs of the model described temporal changes over time in: Number and location of healthy and infected (latent or infectious) primary and secondary leaves; Surface area of healthy, infected and sporulating tissues, with corresponding severity (percentage of area diseased or percentage of area sporulating); Number and state of leaves for their corresponding age class; leaves were classified into four susceptibility classes, based on data of ontogenic resistance under controlled conditions: s1, leaves younger than 5 days (highly susceptible); s2, leaves older than 5 and younger than 10 days (susceptible); s3, leaves older than 10 and younger than 20 days (low susceptibility); s4, leaves older than 20 days; Number of infectious colonies; Total quantity of spores released by the vine and quantity of spores escaping from the vine (i.e. not deposited on leaves or lost to the ground). Outputs also described the spatial state of the vine stock at each time step, together with all other necessary information: coordinates, size, age and disease severity of all plant organs. These outputs were translated by the computer graphics software povray, providing a representation of the development of the single vine stock over time and its infestation by E. necator. The series of images obtained could then be transformed into an animation of annual vine growth (Fig. 2). The simulator was developed using the high-level programming language C++, an interface making the model available to a wider scientific audience. The exported files were processed by excel macros to provide pertinent epidemiological graphs and were compatible with amapmod (Godin & Caraglio, 1998) to provide users with a supplementary background of statistical tests. Table 1 and Fig. 3 illustrate all the processes and parameters of host growth and pathogen development included in the model. Validation of the model Final leaf surface areas and internode lengths were validated from data of 2002 (Fig. 4). Primary and secondary leaf production were validated by tracking their appearance on a set of 20 shoots during 2003 (Fig. 5a,b,c). A preliminary validation of disease progression was performed by comparing simulated epidemics with disease data from experiments conducted in 2001 (Calonnec et al., 2006). These experiments were performed on threevine microplots (cv. Cabernet Sauvignon) in which the central vine was artificially inoculated on the central shoot on one of two dates: 4 May (day 124) or 16 May (day 133) corresponding respectively to the three- (L3) and five- (L5) expanded-leaves phenological stages. Inoculation was performed by dispersing spores from two sporulating leaf discs placed at the top of a Cellophane funnel attached around the shoot. Disease incidence and disease severity were assessed on the central vine: 10 primary leaves per shoot, two shoots per vine (30 May, 8 and 18 June and 2 July). Two simulations were performed to reproduce disease data from these artificial inoculations with infections at day 124 on leaves L1 to L3 (sim 124) and at day 133 on leaves L1 to L5 (sim 133). Three variables of interest available from the data were considered: the proportion of primary diseased leaves, the average severity on primary leaves and the relationship between disease incidence and disease severity. Data and simulations were compared by repeated measures analysis of variance. Model behaviour Environmental data of 1998 and 2003, reflecting two contrasting yet representative seasons of vine growth (Fig. 6), were used to examine the sensitivity of a leaf epidemic to the date and stage of initial inoculation and to explain differences in epidemic development according to interactions between the development of the host and the pathogen. The year 2003 was characterized by early budbreak, quicker development and high production of secondary shoots because of high temperatures. Simulated

6 498 A. Calonnec et al. Figure 2 3-D descriptions of the development of a single grapevine stock over time for the year 1998, inoculated with powdery mildew (Erysiphe necator) on day 115 or day 131. Shoot topping occurred on day 170. Leaf colour indicates disease severity.
 on day 115 or day 131.")
7 Simulating grapevine powdery mildew epidemiology 499 Table 1 Grapevine powdery mildew model parameters Process Parameter Description Equation no. Parameterization Range of value Units Initial conditions h_trunk Height of the trunk Input 50 cm n_buds Number of buds Input 8 d_buds Distance between buds Input 10 cm h_topping Height of topping Input 150 cm t_topping Day of topping Input calendar day Leaf appearance v Drives the maximum number of secondary leaves on a secondary shoot 3 INRA, field measurements cm 2 k Shape parameter S max1 S max2 Maximum theoretical surface of a primary (max1) or secondary (max2) leaf L max1 L max2 Maximum theoretical length of an internode cm on primary (max1) or secondary shoot (max2) Spore infection I 0 Maximum infection rate 5 INRA, controlled 0 53 τ Leaf susceptibility decay with age 5 inoculations on ng, mg Shape parameter 4 detached leaves T maxg T ming Cardinal temperature for pathogen infection 4 Delp (1954); Sall (1980) 33 5 C Colony growth n m Shape parameter 4 Analytis (1977, 1980) T max T min Cardinal temperature for pathogen growth 4 Analytis (1977, 1980) 33 5 C r Rate of colony growth 6 INRA, controlled 0 2 t* Time at 50% of growth 6 inoculations on 13 day A B Maximum, minimum colony diameter 7 detached leaves 18 2 mm c Rate of colony growth with the leaves age Latent period ρ min Minimum time (in day) for latency 8 Blaise & Gessler 6 day (1992); Rumbolz (1999) Sporulation α, b Parameters in the release function 9 Willocquet et al. (1998) β, δ Parameters in the spore production function 10 INRA, controlled inoculations on detached leaves Dispersion process cid Spore decay with distance 0 04 Infectious period DI Duration of infectious period in days Input 10 day Figure 3 Schematic representation of host grapevine growth during a season and of pathogen (Erysiphe necator) development during an infection cycle, implemented in the model. Numbers refer to equations in the text.
 or secondary (max2) leaf L max1 L max2 Maximum theoretical length of an internode 1 9 6 cm on primary (max1)")
8 500 A. Calonnec et al. Figure 4 Variation of the average grapevine leaf area and internode length as a function of row number on a primary shoot for the year epidemics were initiated by considering the infection of the first expanded leaf (the closest to the bark) at different phenological stages (from stage-1 to stage-7 expanded leaves; L1 L7) of vine development. For these simulations, the day of flowering, when grape bunches were at their most susceptible to the disease, was achieved when the accumulated sum of the mean daily temperature above 10 C reached 380 starting from day 1 (1 January). Shoot topping was simulated 10 days after flowering. Parameters used for simulation are summarized in Table 1. In these simulations, for two contrasting growing seasons, 1998 and 2003, (i) the sensitivity of epidemic development to the time of first infection was examined with particular emphasis on disease severity at time of flowering, (ii) a direct comparison of epidemic behaviour was made for the two contrasting growing seasons from the same day of initial infection, (iii) differences in epidemic development were examined according to changes in susceptibility classes of the leaf population and (iv) the relationship between rate of disease development and relative volumes of sporulating and susceptible leaf tissue was investigated. Results Model validation for temporal disease progression Data describing changes in the proportion of primary leaves diseased over time were highly variable, with a higher standard deviation for vines inoculated on day 124 than for those inoculated on day 133 (Fig. 7). Simulations were remarkably consistent with experimental data, showing the same trends and with no significant differences for the three variables of interest: proportion of primary diseased leaves (data 124 vs. sim 124, P = 0 81, interaction P = 0 47; data 133 vs. sim 133, P = 0 91, interaction P = 0 88), average disease severity (data 124 vs. sim 124, P = 0 74, interaction P = 0 97; data 133 vs. sim 133, P = 0 35, interaction P = 0 50) and the relationship between the two hierarchical scales (disease incidence vs. disease severity) (Fig. 7). There was, however, a closer Figure 5 Results of grapevine host development for the year (a) Comparison of observed and simulated numbers of primary leaves per shoot over time. (b) Observed and (c) simulated evolution of the average number of secondary leaves per primary shoot rank, from day 143 to day 176.

9 Simulating grapevine powdery mildew epidemiology 501 Figure 6 Comparison of the sum of degree days above 10 C for the years 1998 and 2003 (climatic data for Cadaujac, 3 km south of Bordeaux). relationship for the later inoculation date. For both experimental data and simulations, an effect of the date of primary inoculation resulted in a delay in epidemic development of about 12 days and a significant difference in disease severity on primary leaves. Effects of date of primary inoculation and of host development on disease progress Epidemics simulated using environmental data from 1998 and 2003 were characterized by increasing disease progression on primary leaves until the time of the second shoot topping (day 177 for 1998 and day 167 for 2003) (Fig. 8a,b) and lengthened on secondary leaves (Fig. 8c,d). For early inoculation (at phenological stage L1 L3), the rate of initial disease progress on primary leaves followed the rate of leaf production, with a delay of approximately 18 days (1998) or 28 days (2003) (Fig. 8c,d). For 1998, disease was most severe for an epidemic initiated at the first leaf stage (day 115) (Fig. 8a,c). In relation to the critical time for berry infection (day 159, corresponding to flowering) a significant reduction in the proportion of diseased leaves, from 42% when inoculated at stage L1 (day 115) to 23% at L2 (day 123) and L3 (day 129), and to 6% at L4 (day 131), was detected (Fig. 8e). Stimulated by differences in climatic variables, vine development in 2003 was characterized by budbreak 10 days earlier than for 1998, a higher rate of initial primary leaf development and a higher rate of development of secondary leaves after day 160. For 2003 data, disease severity at flowering (day 152) was similar when inoculation occurred at either L1 (day 105) or L2 (day 108) (24% of total leaves diseased) and decreased when initial infection was delayed to L3 or L4 (days 111 and 115, respectively; 9% of leaves diseased) and further still when delayed to L5 L7 (days ; 1% of leaves diseased) (Fig. 8b,d,f). Depending on the date of initial contamination, these differences could result in the 1998 epidemic being characterized by higher levels of disease than the 2003 epidemic at around the time of Figure 7 Comparison of experimental data (squares) with model simulations (continuous lines) for grapevine powdery mildew for the year 2001, for three variables: the proportion of diseased primary leaves, the average severity for diseased primary leaves and the incidence vs. severity for diseased primary leaves. Inoculations were performed on day 124 on first to third leaves (grey) and on day 133 on first to fifth leaves (black). Bars indicate the standard deviation of the mean for experimental data.

10 502 A. Calonnec et al.
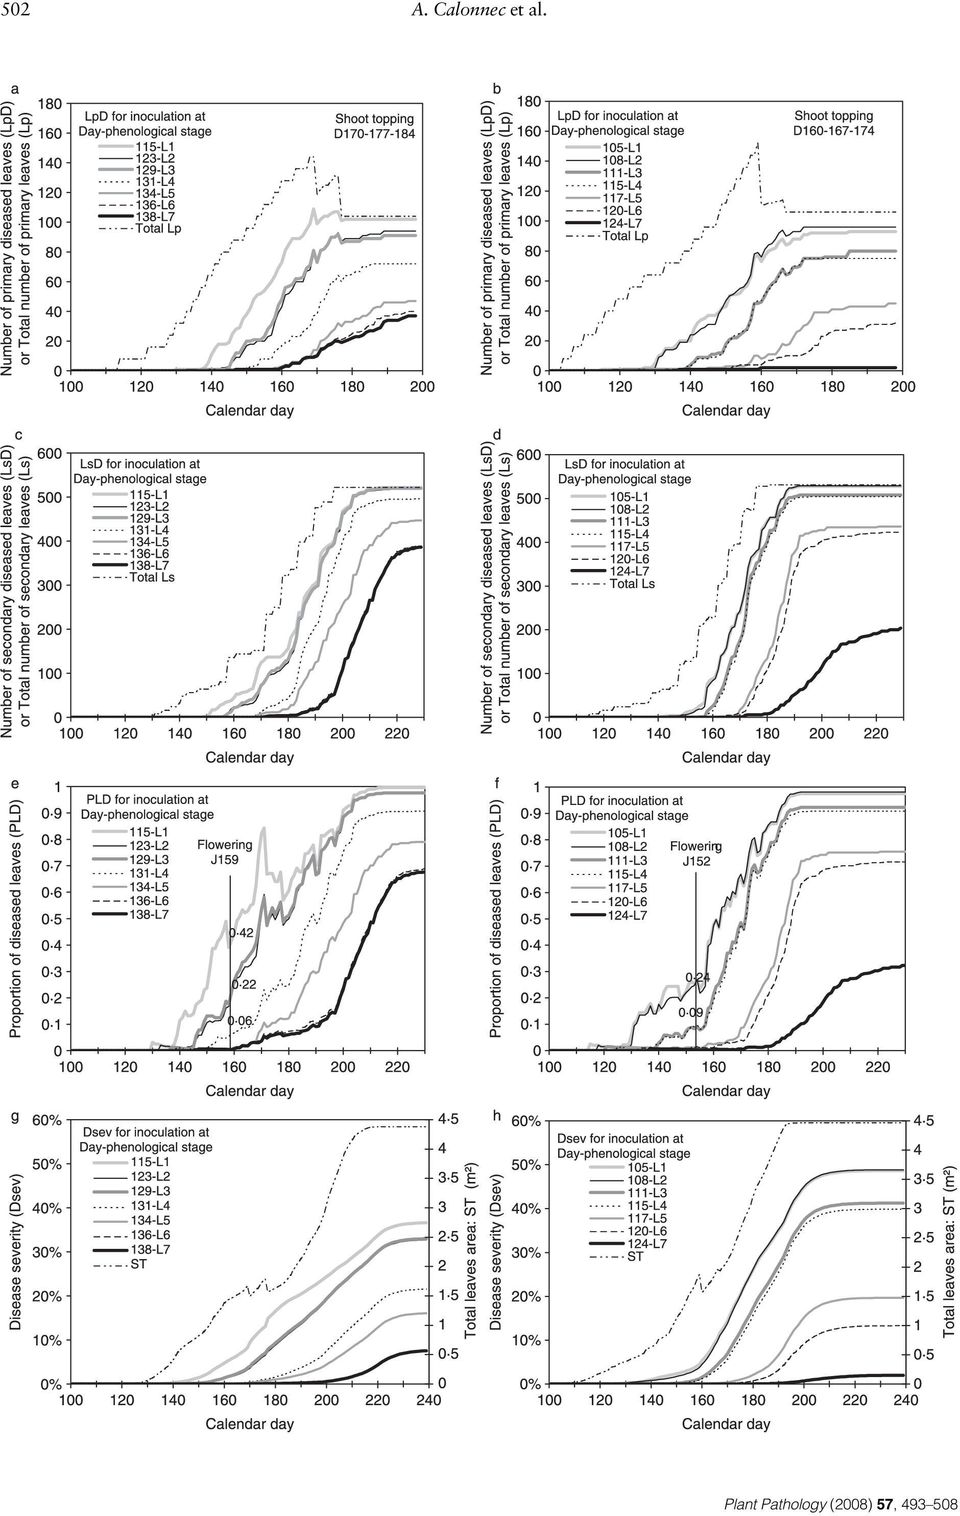
11 Simulating grapevine powdery mildew epidemiology 503 Table 2 Initial conditions for 1998 and 2003 grapevine powdery mildew simulations Year Condition at inoculation Stage a /Day Conditions at beginning of first sporulation event Phenological stage a Length of shoots (cm) spo1 b days Average percentage susceptible leaves during spo1 Number of spores captured during spo1 Number of infected leaves during spo L/115 L L/123 L L/129 L L/131 L L/134 L L/136 L L/138 L L/105 L L/108 L L/111 L L/115 L L/117 L L/120 L L/124 L a Number of expanded leaves. b spo1 = first sporulation event. flowering (incidence and severity), but with lower final levels of disease. When comparing the same dates of initial infection across the two different growing seasons, differences in epidemic behaviour were enhanced. For primary infections occurring at day 115, a vine with late budbreak (such as in 1998) could show 58% of primary leaves diseased at flowering compared with only 19% for a vine with early budbreak (such as in the 2003 season) (data not shown). In contrast, for early primary infection at day 105 and with only one ascospore release event, the year 1998 (or a variety having a late budbreak) could escape the epidemic. Decrease in disease severity with a delay in the date of first infection was higher for 2003 than for 1998 (Fig. 8g,h). Shoot topping had an effect in decreasing disease severity in 1998, but not in In both years, growth of the vine was characterized by a progressive change from a leaf population of age classes corresponding to highly susceptible leaves (s1 5 days old) to a leaf population of age classes corresponding to lower susceptibility to disease (Fig. 9). For 2003, the percentages of highly susceptible leaves (s1 + s2) decreased rapidly at the beginning of the season (until day 135) and increased again with the development of secondary leaves until day 155 and then decreased to zero after 190 days. For 1998, the overall decrease in the most susceptible classes was less rapid, declining to zero after approximately 210 days. When the early stage of the epidemic was considered, the average percentage of infected leaves during the first sporulation event was positively and linearly correlated with the percentage of susceptible leaves (s1 + s2) present during this period (for 1998, R 2 = 0 60, P = 0 04; for 2003, R 2 = 0 76, P = 0 008) (Table 2). Furthermore, the number of leaves infected at the first sporulation event was negatively correlated with the length of the shoot at the stage of the first sporulation event (Table 2). The sensitivity of these leaf epidemics to the stage of initial inoculation could result in a dilution of susceptible leaves (s1 + s2) with older leaves, combined with an increase in distance between primary infected leaves and these susceptible leaves. The rate of disease development (dsinf/dt) corresponding to the variation with time of infected area (SInf = latent + sporulating) was proportional to the variation of infectious (sporulating) area (Si), in accordance with Van der Plank s equation dsinf/dt = Rc Si (1 SInf/ ST) (Fig. 9c,d). Furthermore, the rate of disease development decreased in accordance with a logistic growth of the disease, at the time when 50% of the maximum infected area was reached. As a result of ontogenic resistance only 36% (1998) to 48% (2003) of the total area was diseased. From the variation of infected area (SInf), the sporulating area (Si) and the total area available for contamination (ST), the infection rate (Rc) was calculated at each time step (Fig. 9e,f). The last ST considered corresponded to the total leaf surface until about 15 days after emergence of the last leaf (end of leaves surface extension). Infection rate showed some variations: a Figure 8 Evolution over time of (a, b) the number of diseased primary and (c, d) secondary leaves, (e, f) the proportion of diseased leaves or (g, h) the mean severity of disease on individual leaves for several grapevine phenological stages and times of primary inoculation (one to seven expanded leaves; L1 L7) with powdery mildew (Erysiphe necator) and two sets of environmental data (1998 and 2003). (a, c, e, g) Simulations for 1998; (b, d, f, h) simulations for Inoculation was on the first primary leaf.

12 504 A. Calonnec et al.

13 Simulating grapevine powdery mildew epidemiology 505 Figure 10 Evolution over time of the proportion of Erysiphe necator spores produced per grapevine stock. Simulation based on environmental data of (a) 1998 and (b) 2003 for two dates of primary infection (days for 1998 and for 2003). reduction after shoot topping, especially for 1998, and an increase linked to development of secondary leaves after day 180 for the year The relationship between disease incidence and disease severity, when considering primary leaves, was similar to that observed in 2001, with about 15% severity for approx % of diseased leaves (Fig. 8g,h). Dispersion was less for the first part of the epidemic in 2003 (more aggregation), probably because of a higher rate of shoot development. Sporulation profiles were different for 1998 and 2003, following the trend of sporulating areas, with a delayed major peak of sporulation and a decreased total amount of sporulation for delayed inoculation (Fig. 10a,b). The number of spores released per area of sporulating tissue was on average around 5000 spores cm 2. Discussion The objective of this work was to build a simulation model combining growth of the vine plant with the development of a powdery mildew epidemic, providing a tool with which to examine the dynamic interactions between pathogen, host and environment, which together account for variability in epidemic behaviour and the capacity of host development to modify disease progress. The model developed had several advantages over other existing models. It accounted for key pathogen, host and environmental parameters that determine the spread of plant disease. In particular, the rate of production, location and phenological status of the host (leaf) population, together with the dispersal process and parameters specific to the development and spread of the pathogen, were included. Considering these parameters and their control together, the model allowed their interactions to be analysed. Moreover, where many models assume synchronous initiation of host and pathogen growth, this model allowed different times for the initiation of host growth and pathogen infection, together with periodic changes resulting from host development forced by crop management (shoot topping and vigour). The model also enabled the impact on epidemic development of real sets of climatic data, corresponding to known and contrasting scenarios for crop development, to be tested. For a given set of environmental inputs, the model output was remarkably consistent both with epidemiological field data (Fig. 7) and with the output from other theoretical analytical models (Van der Plank, 1963). Particularly notable was the consistency of model output with the ratio of disease incidence to disease severity for epidemics initiated at different times. This suggested a high degree of accuracy for the host growth and epidemiological parameters used in the model, affecting the appearance and expansion of leaves and fungal colonies. Simulations also suggested that the spread of disease is sensitive to changes in host growth, host phenology and host susceptibility, and to parameters that affect the specificity of the viticultural production system. In this paper, a relatively simple but very important example was used to demonstrate the potential of the model for use as a research tool. By considering epidemic behaviour in response to a characteristic feature of powdery mildew epidemics, namely, contrasting environmental regimes that lead to early or late budbreak, the model was used to understand the link between the timing of initial contamination and disease severity at flowering. Given that the disease severity on leaves represents the inoculum load for grape infection, this difference has significant implications for grape damage (Calonnec et al., 2006). The results of these initial simulations showed that the severity of a leaf epidemic at the time when grape bunches Figure 9 Evolution over time of (a, b) grapevine leaves in age classes according to simulation, (c, d) rate of Erysiphe necator disease development and infectious area, (e, f) infection rate and (g, h) incidence vs. severity relationship for two dates of inoculation. (a, c, e, g) Simulations for 1998; (b, d, f, h) simulations for S1 + S2 = leaves up to 10 days old; S3 = leaves older than 10 and younger than 20 days; S4 = leaves older than 20 days.

14 506 A. Calonnec et al. are most sensitive to powdery mildew was conditional upon two key factors: (i) the timing of the first sporulation event, upon which, in turn, depended the time of initial infection and the length of the latent period thereafter, and (ii) the availability (number, location and susceptibility) of susceptible leaves during this period. Moreover, the results pointed to a high degree of nonlinearity in the system whereby small changes in the onset of an epidemic can, as a consequence of changes in leaf susceptibility and of their position in the leaf canopy, have profound consequences for the severity of an epidemic later in the season (Xu & Ridout, 1998). This dynamically generated variability (Kleczkowski et al., 1996) was demonstrated previously for soilborne plant pathogens, in which small differences early in an epidemic, combined with the non-linear, multiplicative effects of secondary infection and dynamic changes in host susceptibility, can lead to large differences in final levels of disease. Increased host development, later in the season, may also increase final levels of disease and disease severity. Whilst late disease development may be of no consequence in terms of the damage caused to grape bunches, it may affect the amount of chasmothecia formed and consequently the quantity of primary inoculum in the next year. In contrast to the results of simulations performed by Gessler & Blaise (1992), an increase in host growth (secondary leaves) at the time at which the rate of disease development began to decrease did not slow the epidemic in the present model. As soon as new susceptible leaves were produced, the rate of disease development increased. The simulations suggested that infection rate may also decrease after shoot topping. This was no doubt the result of the loss of sporulating leaf area, especially pronounced for the 1998 epidemic. It is suggested that, by using this model to better understand the dynamic interactions between pathogen, host and environment, the variability that develops within and between epidemics can be both accounted for and exploited (for better disease management) by, for example, the use of phenological status as a disease risk indicator, the deployment of control agents, the management of the training system or the selection of varietal traits that delay the first sporulation event beyond the critical time of high leaf susceptibility. However, the model did not take into account the potential effect of a reduction in host development as a result of water stress. In such conditions, an increase in temperature later in the season may be not followed by an increase in host development (Garcia de Cortazar Atauri, 2007). Two key areas for model development are considered: (i) the introduction of variability in budbreak and bunch development and (ii) integration of the model as a submodel for simulations on a larger plot or field scale. This study gave particular emphasis to the status of the leaf epidemic at the time when the grape cluster was most susceptible to the presence of mildew inoculum, yet the susceptibility of a grape cluster also depends on its phenological age (Gadoury et al., 2003), providing still more scope for nonlinear behaviour within this system. In the simplest form, berry clusters might be considered as homogeneous units that behave in an identical manner. In reality, the berry cluster is a complex organ with heterogeneous development within and between clusters (Gadoury et al., 2006), leading to equally high levels of heterogeneity in susceptibility to powdery mildew and affecting the impact of the leaf epidemic on the severity of the disease on the berries. To take this into account, it is proposed that a submodel be developed to consider the development of berry structure in space together with changes and variability in phenological status. The model developed here accounted for the spread of disease within a single vine plant, yet powdery mildew is capable of travelling over considerable distances (Jarvis et al., 2002). The influence of the epidemic at the plant level on the spread of the epidemic at the field level is of considerable interest. For example, are the factors that most affect the local spread of disease (within a plant) the same factors that are largely responsible for the wide-scale (field-scale) dynamics of the epidemic? Consequently, the model at the vine-stock level is being integrated into a model describing disease dynamics at the plot level (Calonnec et al., 2005). At this scale two modes of disease transmission can be considered, short-distance spore transmission described by a ray model, and long-distance spore transmission using a normal distribution model (Bache, 1979; Slinn, 1982). Expansion of a pathogen population in space and time is then modelled by combining the model for the local increase of individuals (spores) with a model for the dispersal of these individuals to new sites (Aylor & Flesch, 2003). In parallel, mathematical models are also being developed to study more precisely the dispersion process on a larger scale (Burie et al., 2006, 2007). Experimentation to examine other epidemiological components of the system is ongoing, in particular, to improve the accuracy of the model via a better understanding of the roles of leaf infectivity, grape cluster susceptibility and secondary leaf production. Whilst the role of leaf age on leaf susceptibility and hence the probability of infection has been considered, the model will be extended to include the influence of vine management and vine vigour on leaf susceptibility. Acknowledgements We thank Y. Brunet (INRA, Ephyse) for his assistance and comments concerning wind dispersion and J. Roman and G. Tessier (LaBRI and INRIA Futurs) for their important contributions on computing. This work was funded by the INRA department of Santé des Plantes, by the French Ministry of Agriculture and Research, and by the region Aquitaine. References Analytis S, Über die Relation zwischen biologischer Entwicklung und Temperatur bei phytopathogenen Pilzen. Phytopathologische Zeitschrift 90,

15 Simulating grapevine powdery mildew epidemiology 507 Analytis S, Obtaining of sub-models for modeling the entire life cycle of a pathogen. Journal of Plant Diseases and Protection 87, Aylor D, Flesch T, Spread of plant disease on a continental scale: role of aerial dispersal of pathogens. Ecology 84, Bache D, Particle transport within plant canopies. I. A framework for analysis. Atmospheric Environment 13, Bindi M, Miglietta F, Gozzini B, Orlandini S, Seghi L, A simple model for simulation and development in grapevine (Vitis vinifera L.). I. Model description. Vitis 2, Birch CJ, Andrieu B, Fournier C, Vos J, Room P, Modelling kinetics of plant canopy architecture: concepts and applications. European Journal of Agronomy 19, Blaise P, Gessler C, An extended progeny/parent ratio model. I. Theoretical development. Journal of Phytopathology 134, Burie J-B, Calonnec A, Ducrot A, Singular perturbation analysis of travelling waves for a model in phytopathology. Mathematical Modelling of Natural Phenomena 1, Burie J-B, Calonnec A, Langlais M, Modeling of the invasion of a fungal disease over a vineyard. In: Deutsch A, Bravo de la Parra R, de Boer RJ et al., eds. Mathematical Modeling of Biological Systems, Volume II. Series: Modeling and Simulation in Science, Engineering and Technology. Boston, MA, USA: Springer, Calonnec A, Latu G, Naulin J-M, Roman J, Tessier G, Parallel simulation of the propagation of powdery mildew in a vineyard. Computer Science 3648, Calonnec A, Cartolaro P, Deliere L, Chadoeuf J, Powdery mildew on grapevine: the date of primary contamination affects disease development on leaves and damage on grape. IOBC/WPRS Bulletin 29(11), Chellemi D, Marois J, Sporulation of Uncinula necator on grape leaves as influenced by temperature and cultivar. Journal of Phytopathology 8, Cortesi P, Gadoury DM, Seem RC, Pearson RC, Distribution and retention of cleistothecia of Uncinula necator on the bark of grapevines. Plant Disease 79, Delp C, Effect of temperature and humidity on the grape powdery mildew fungus. Phytopathology 44, Deussen O, Linterman B, A modeling method and user interface for creating plants. In: Moller T, Ware C, eds. Graphics Interface Proceedings Wellesley, MA, USA: AK Peters Ltd, Diestel R, Graph Theory. New York, USA: Springer-Verlag. Doster MA, Schnathorst WC, Effects of leaf maturity and cultivar resistance on development of the powdery mildew fungus on grapevines. Phytopathology 75, Fanizza G, Colonna G, A mathematical function to study berry growth variability in grapes (Vitis vinifera). Journal of Wine Research 2, Ficke A, Gadoury DM, Seem RC, Ontogenic resistance and plant disease management: a case study of grape powdery mildew. Phytopathology 92, Ficke A, Gadoury D, Seem R, Dry I, Effects of ontogenic resistance upon establishment and growth of Uncinula necator on grape berries. Phytopathology 93, Gadoury D, Seem R, Ficke A, Wilcox W, Ontogenic resistance to powdery mildew in grape berries. Phytopathology 93, Gadoury DM, Seem RC, Wilcox WF et al., Modeling and mapping the relationship between climate and ontogenic resistance to the major fungal diseases of grapevine. In: Proceedings of the 5th International Workshop on Grapevine Downy and Powdery Mildew, Garcia De Cortazar Atauri I, Adaptation du Modèle STICS à la Vigne (Vitis vinifera L.). Utilisation dans le Cadre d une Étude d Impact du Changement Climatique à l Échelle de la France. Montpellier, France: ENSAM, PhD Thesis. Gaudillere J, Dayau S, Guimberteau G, Effets des facteurs de l environnement sur le développement de la vigne. Relations avec l effet terroir. In: Actes du Colloque, 5. ème Journée Technique du CIVB, Bordeaux, 1999, Gessler C, Blaise P, An extended progeny/parent ratio model. II. Application to experimental data. Journal of Phytopathology 134, Godin C, Caraglio Y, A multiscale model of plant topological structures. Journal of Theoretical Biology 191, Hanan J, Prusinkiewicz P, Zalucki M, Skirvin D, Simulation of insect movement with respect to plant architecture and morphogenesis. Computers and Electronics in Agriculture 35, Hau B, Analytic models of plant disease in a changing environment. Annual Review of Phytopathology 28, Jarvis WR, Gubler WD, Grove GG, Epidemiology of Powdery Mildews in Agricultural Pathosystems. In: Bélanger RR, Bushnell WR, Dik AJ, Carver TLW, eds. The Powdery Mildews. A Comprehensive Treatise. St Paul, MN, USA: APS Press, Kleczkowski A, Bailey DJ, Gilligan CA, Dynamically generated variability in plant pathogen systems with biological control. Proceedings of the Royal Society of London Series B Biological Sciences 263, Miglietta F, Gozzini B, Orlandini S, Simulation of leaf appearance in grapevine. Viticultural and Enological Science 47, Peyrard N, Calonnec A, Bonnot F, Chadoeuf J, Explorer un jeu de données sur grille par tests de permutation. Revue de Statistique Appliquée 53, Prusinkiewicz P, In search of the right abstraction: the synergie between art, science, and information technology in the modeling of natural phenomena. In: Sommerer C, Mignonneau L, eds. Vienna, Austria: Springer-Verlag. Rabbinge R, Bastiaans L, Combination models, crop growth and pests and diseases. In: Rabbinge R, Ward SA, Van Laar HH, eds. Simulation and Systems Management in Crop Protection. Wageningen, Netherlands: PUDOC: Simulation Monographs 32, Room P, Hanan J, Prusinkiewicz P, Virtual plants: new perspectives for ecologists, pathologists and agricultural scientists. Trends in Plant Science 1, Rumbolz J, Untersuchungen zur Konidienkeimung und Mycelentwicklung des Echten Mehltaus der Weinrebe (Uncinula necator (Scw.) Burr.) und deren Einfluß auf die Epidemiologie. Konstanz, Germany: Universität Konstanz, Dissertation. Sall M, Epidemiology of grape powdery mildew: a model. Phytopathology 70,
. I. Model description. Vitis 2, 67 71. Birch CJ, Andrieu B, Fournier C, Vos J, Room P, 2003.")
16 508 A. Calonnec et al. Sall M, Wrysinski J, Perennation of powdery mildew in buds of grapevines. Plant Disease 66, Schultz H, An empirical model for the simulation of leaf appearance and leaf area development of primary shoots of several grapevine (Vitis vinifera L.) canopy-systems. Scientia Horticulturae 52, Skirvin DJ, Virtual plant models of predatory mite movement in complex plant canopies. Ecological Modelling 171, Slinn W, Predictions for particle deposition to vegetative canopies. Atmospheric Environment 166, Tardieu F, Virtual plants: modelling as a tool for the genomics of tolerance to water deficit. Trends in Plant Science 8, Tessier G, Roman J, Latu G, Hybrid MPI-thread implementation on a cluster of SMP nodes of a parallel simulator for the propagation of powdery mildew in a vineyard. Lecture Notes in Computer Science 4208, Van Der Plank J, Plant Diseases: Epidemic and Control. New York, USA: Academic Press. Van Der Plank J, Host-Pathogen Interactions in Plant Disease. New York, USA: Academic Press. Weber J, Penn J, Creation and rendering of realistic trees. In: Proceedings of SIGGRAPH, West D, Introduction to Graph Theory. Upper Saddle River, NJ, USA: Prentice Hall. Willocquet L, Berud F, Raoux L, Clerjeau M, Effects of wind, relative humidity, leaf movement and colony age on dispersal of conidia of Uncinula necator, causal agent of grape powdery mildew. Plant Pathology 47, Wilson PA, Chakraborty S, The virtual plant: a new tool for the study and management of plant diseases. Crop Protection 17, Xu X-M, Ridout M, Effects of initial epidemic conditions, sporulation rate, and spore dispersal gradient on the spatio-temporal dynamics of plant disease epidemics. Phytopathology 88,

Biology, Epidemiology, and Control of Powdery Mildew: Use of the UC Davis Powdery Mildew Risk Index
 Sonoma County Grape Day February 15, 2012 Biology, Epidemiology, and Control of Powdery Mildew: Use of the UC Davis Powdery Mildew Risk Index W. D. Gubler, Department of Plant Pathology, University of
runing & Orchard Renewal
 P runing & Orchard Renewal Richard G. St-Pierre, Ph.D. (January 2006) The Basics Of Pruning & Orchard Renewal Pruning is defined as the art and science of cutting away a portion of a plant to improve its
Time series analysis as a framework for the characterization of waterborne disease outbreaks
 Interdisciplinary Perspectives on Drinking Water Risk Assessment and Management (Proceedings of the Santiago (Chile) Symposium, September 1998). IAHS Publ. no. 260, 2000. 127 Time series analysis as a
Introduction: Growth analysis and crop dry matter accumulation
 PBIO*3110 Crop Physiology Lecture #2 Fall Semester 2008 Lecture Notes for Tuesday 9 September How is plant productivity measured? Introduction: Growth analysis and crop dry matter accumulation Learning
Protecting vineyards using large data sets: VineAlert and monitoring cold tolerance in grapevines
 Protecting vineyards using large data sets: VineAlert and monitoring cold tolerance in grapevines Jim Willwerth, PhD Cool Climate Oenology & Viticulture Institute Brock University Overview CCOVI has been
Current Standard: Mathematical Concepts and Applications Shape, Space, and Measurement- Primary
 Shape, Space, and Measurement- Primary A student shall apply concepts of shape, space, and measurement to solve problems involving two- and three-dimensional shapes by demonstrating an understanding of:
Common Core Unit Summary Grades 6 to 8
 Common Core Unit Summary Grades 6 to 8 Grade 8: Unit 1: Congruence and Similarity- 8G1-8G5 rotations reflections and translations,( RRT=congruence) understand congruence of 2 d figures after RRT Dilations
Big Ideas in Mathematics
 Big Ideas in Mathematics which are important to all mathematics learning. (Adapted from the NCTM Curriculum Focal Points, 2006) The Mathematics Big Ideas are organized using the PA Mathematics Standards
Basic research methods. Basic research methods. Question: BRM.2. Question: BRM.1
 BRM.1 The proportion of individuals with a particular disease who die from that condition is called... BRM.2 This study design examines factors that may contribute to a condition by comparing subjects
Algebra 1 Course Information
 Course Information Course Description: Students will study patterns, relations, and functions, and focus on the use of mathematical models to understand and analyze quantitative relationships. Through
with functions, expressions and equations which follow in units 3 and 4.
 Grade 8 Overview View unit yearlong overview here The unit design was created in line with the areas of focus for grade 8 Mathematics as identified by the Common Core State Standards and the PARCC Model
Algebra 1 2008. Academic Content Standards Grade Eight and Grade Nine Ohio. Grade Eight. Number, Number Sense and Operations Standard
 Academic Content Standards Grade Eight and Grade Nine Ohio Algebra 1 2008 Grade Eight STANDARDS Number, Number Sense and Operations Standard Number and Number Systems 1. Use scientific notation to express
VOLATILITY AND DEVIATION OF DISTRIBUTED SOLAR
 VOLATILITY AND DEVIATION OF DISTRIBUTED SOLAR Andrew Goldstein Yale University 68 High Street New Haven, CT 06511 [email protected] Alexander Thornton Shawn Kerrigan Locus Energy 657 Mission St.
Strawberry Leaf Spot
 Strawberry Leaf Spot Cathy Heidenreich and Bill Turechek Introduction - Leaf spot is one of the most common and widespread diseases of strawberry. Mycosphaerella fragariae is also the cause of black seed
Exploratory data analysis (Chapter 2) Fall 2011
 Fall 2011") Exploratory data analysis (Chapter 2) Fall 2011 Data Examples Example 1: Survey Data 1 Data collected from a Stat 371 class in Fall 2005 2 They answered questions about their: gender, major, year in school,
Exploratory data analysis (Chapter 2) Fall 2011 Data Examples Example 1: Survey Data 1 Data collected from a Stat 371 class in Fall 2005 2 They answered questions about their: gender, major, year in school,
Light penetration into the soybean canopy and its influence on soybean rust infection
 Light penetration into the soybean canopy and its influence on soybean rust infection Jim Marois David Wright, Sheeja George, Pratibha Srivastava, Phil Harmon, Carrie Harmon, Heather Young (UF) Andy Schuerger
AP Physics 1 and 2 Lab Investigations
 AP Physics 1 and 2 Lab Investigations Student Guide to Data Analysis New York, NY. College Board, Advanced Placement, Advanced Placement Program, AP, AP Central, and the acorn logo are registered trademarks
STATS8: Introduction to Biostatistics. Data Exploration. Babak Shahbaba Department of Statistics, UCI
 STATS8: Introduction to Biostatistics Data Exploration Babak Shahbaba Department of Statistics, UCI Introduction After clearly defining the scientific problem, selecting a set of representative members
A Quick Start Guide to Establishing a Vineyard in Oregon Patty Skinkis, Ph.D.
 A Quick Start Guide to Establishing a Vineyard in Oregon Patty Skinkis, Ph.D. When thinking of starting a vineyard, many questions come to mind: Would my land be suitable for growing grapes? What types
For example, estimate the population of the United States as 3 times 10⁸ and the
 CCSS: Mathematics The Number System CCSS: Grade 8 8.NS.A. Know that there are numbers that are not rational, and approximate them by rational numbers. 8.NS.A.1. Understand informally that every number
Exploratory Data Analysis
 Exploratory Data Analysis Johannes Schauer [email protected] Institute of Statistics Graz University of Technology Steyrergasse 17/IV, 8010 Graz www.statistics.tugraz.at February 12, 2008 Introduction
Developing Response Strategies Against Powdery Mildew of Strawberry Based on Risk Estimation and Fungicide Effectiveness.
 Developing Response Strategies Against Powdery Mildew of Strawberry Based on Risk Estimation and Fungicide Effectiveness Project QP0018CO Applicant Association des producteurs de fraises et framboises
MIDLAND ISD ADVANCED PLACEMENT CURRICULUM STANDARDS AP ENVIRONMENTAL SCIENCE
 Science Practices Standard SP.1: Scientific Questions and Predictions Asking scientific questions that can be tested empirically and structuring these questions in the form of testable predictions SP.1.1
Maximum likelihood estimation of mean reverting processes
 Maximum likelihood estimation of mean reverting processes José Carlos García Franco Onward, Inc. [email protected] Abstract Mean reverting processes are frequently used models in real options. For
NEW MEXICO Grade 6 MATHEMATICS STANDARDS
 PROCESS STANDARDS To help New Mexico students achieve the Content Standards enumerated below, teachers are encouraged to base instruction on the following Process Standards: Problem Solving Build new mathematical
Descriptive Statistics
 Y520 Robert S Michael Goal: Learn to calculate indicators and construct graphs that summarize and describe a large quantity of values. Using the textbook readings and other resources listed on the web
Data Exploration Data Visualization
 Data Exploration Data Visualization What is data exploration? A preliminary exploration of the data to better understand its characteristics. Key motivations of data exploration include Helping to select
CAMI Education linked to CAPS: Mathematics
 - 1 - TOPIC 1.1 Whole numbers _CAPS curriculum TERM 1 CONTENT Mental calculations Revise: Multiplication of whole numbers to at least 12 12 Ordering and comparing whole numbers Revise prime numbers to
The Basics of Tree Pruning
 The Basics of Tree Pruning By John Ball, Forest Health Specialist and Aaron Kiesz, Urban and Community Forestry Specialist Until the end of the 19 th century, trees were not a common sight in many parts
Pennsylvania System of School Assessment
 Pennsylvania System of School Assessment The Assessment Anchors, as defined by the Eligible Content, are organized into cohesive blueprints, each structured with a common labeling system that can be read
DO's and DON'Ts in Pruning
 DO's and DON'Ts in Pruning Introduction "Pruning is one of the best things an arborist can do for a tree but one of the worst things we can do to a tree" -Alex Shigo Pruning is the most common tree maintenance
Interpreting Data in Normal Distributions
 Interpreting Data in Normal Distributions This curve is kind of a big deal. It shows the distribution of a set of test scores, the results of rolling a die a million times, the heights of people on Earth,
Introduction to time series analysis
 Introduction to time series analysis Margherita Gerolimetto November 3, 2010 1 What is a time series? A time series is a collection of observations ordered following a parameter that for us is time. Examples
BNG 202 Biomechanics Lab. Descriptive statistics and probability distributions I
 BNG 202 Biomechanics Lab Descriptive statistics and probability distributions I Overview The overall goal of this short course in statistics is to provide an introduction to descriptive and inferential
Experiment #1, Analyze Data using Excel, Calculator and Graphs.
 Physics 182 - Fall 2014 - Experiment #1 1 Experiment #1, Analyze Data using Excel, Calculator and Graphs. 1 Purpose (5 Points, Including Title. Points apply to your lab report.) Before we start measuring
Introduction to Error Analysis
 UNIVERSITÄT BASEL DEPARTEMENT CHEMIE Introduction to Error Analysis Physikalisch Chemisches Praktikum Dr. Nico Bruns, Dr. Katarzyna Kita, Dr. Corinne Vebert 2012 1. Why is error analysis important? First
Practical Uses of Crop Monitoring for Arizona Cotton
 Practical Uses of Crop Monitoring for Arizona Cotton J. C. Silvertooth The use of crop monitoring and plant mapping has received a considerable amount of attention in the cotton production arena in recent
Time series Forecasting using Holt-Winters Exponential Smoothing
 Time series Forecasting using Holt-Winters Exponential Smoothing Prajakta S. Kalekar(04329008) Kanwal Rekhi School of Information Technology Under the guidance of Prof. Bernard December 6, 2004 Abstract
Sound Power Measurement
 Sound Power Measurement A sound source will radiate different sound powers in different environments, especially at low frequencies when the wavelength is comparable to the size of the room 1. Fortunately
2. Simple Linear Regression
 Research methods - II 3 2. Simple Linear Regression Simple linear regression is a technique in parametric statistics that is commonly used for analyzing mean response of a variable Y which changes according
1 Introduction. JS'12, Cnam Paris, 3-4 Avril 2012. Ourouk Jawad 1, David Lautru 2, Jean Michel Dricot, François Horlin, Philippe De Doncker 3
 Statistical Study of SAR under Wireless Channel Exposure in Indoor Environment Etude Statistique du DAS sous Exposition d un Canal sans Fils en Environnement Intérieur Ourouk Jawad 1, David Lautru 2, Jean
Glencoe. correlated to SOUTH CAROLINA MATH CURRICULUM STANDARDS GRADE 6 3-3, 5-8 8-4, 8-7 1-6, 4-9
 Glencoe correlated to SOUTH CAROLINA MATH CURRICULUM STANDARDS GRADE 6 STANDARDS 6-8 Number and Operations (NO) Standard I. Understand numbers, ways of representing numbers, relationships among numbers,
Engineering Problem Solving and Excel. EGN 1006 Introduction to Engineering
 Engineering Problem Solving and Excel EGN 1006 Introduction to Engineering Mathematical Solution Procedures Commonly Used in Engineering Analysis Data Analysis Techniques (Statistics) Curve Fitting techniques
Strawberry Anthracnose
 Strawberry Anthracnose Bill Turechek and Cathy Heidenreich Introduction - The term anthracnose is a general term used to describe plant diseases. Strawberry anthracnose refers to several diseases of strawberry
Gamma Distribution Fitting
 Chapter 552 Gamma Distribution Fitting Introduction This module fits the gamma probability distributions to a complete or censored set of individual or grouped data values. It outputs various statistics
E190Q Lecture 5 Autonomous Robot Navigation
 E190Q Lecture 5 Autonomous Robot Navigation Instructor: Chris Clark Semester: Spring 2014 1 Figures courtesy of Siegwart & Nourbakhsh Control Structures Planning Based Control Prior Knowledge Operator
A wave lab inside a coaxial cable
 INSTITUTE OF PHYSICS PUBLISHING Eur. J. Phys. 25 (2004) 581 591 EUROPEAN JOURNAL OF PHYSICS PII: S0143-0807(04)76273-X A wave lab inside a coaxial cable JoãoMSerra,MiguelCBrito,JMaiaAlves and A M Vallera
Powdery Mildew in Western Washington Commercial Grape Production: Biology and Disease Management. washington state university extension em059e
 Powdery Mildew in Western Washington Commercial Grape Production: Biology and Disease Management washington state university extension em059e Powdery Mildew in Western Washington Commercial Grape Production:
Industry Environment and Concepts for Forecasting 1
 Table of Contents Industry Environment and Concepts for Forecasting 1 Forecasting Methods Overview...2 Multilevel Forecasting...3 Demand Forecasting...4 Integrating Information...5 Simplifying the Forecast...6
Chapter 9 Summary and outlook
 Chapter 9 Summary and outlook This thesis aimed to address two problems of plasma astrophysics: how are cosmic plasmas isotropized (A 1), and why does the equipartition of the magnetic field energy density
Statistical Forecasting of High-Way Traffic Jam at a Bottleneck
 Metodološki zvezki, Vol. 9, No. 1, 2012, 81-93 Statistical Forecasting of High-Way Traffic Jam at a Bottleneck Igor Grabec and Franc Švegl 1 Abstract Maintenance works on high-ways usually require installation
Tutorial on Using Excel Solver to Analyze Spin-Lattice Relaxation Time Data
 Tutorial on Using Excel Solver to Analyze Spin-Lattice Relaxation Time Data In the measurement of the Spin-Lattice Relaxation time T 1, a 180 o pulse is followed after a delay time of t with a 90 o pulse,
Two Main Precautions Before You Begin Working
 Pruning Mango Trees Roy Beckford, Ag/Natural Resources Agent, UF/IFAS Lee County Two Main Precautions Before You Begin Working 1. Mango peel and sap contain urushiol, the chemical in poison ivy and poison
Artificial Neural Network and Non-Linear Regression: A Comparative Study
 International Journal of Scientific and Research Publications, Volume 2, Issue 12, December 2012 1 Artificial Neural Network and Non-Linear Regression: A Comparative Study Shraddha Srivastava 1, *, K.C.
STUDENT VERSION INSECT COLONY SURVIVAL OPTIMIZATION
 STUDENT VERSION INSECT COLONY SURVIVAL OPTIMIZATION STATEMENT We model insect colony propagation or survival from nature using differential equations. We ask you to analyze and report on what is going
99.37, 99.38, 99.38, 99.39, 99.39, 99.39, 99.39, 99.40, 99.41, 99.42 cm
 Error Analysis and the Gaussian Distribution In experimental science theory lives or dies based on the results of experimental evidence and thus the analysis of this evidence is a critical part of the
EE4367 Telecom. Switching & Transmission. Prof. Murat Torlak
 Path Loss Radio Wave Propagation The wireless radio channel puts fundamental limitations to the performance of wireless communications systems Radio channels are extremely random, and are not easily analyzed
Prentice Hall Mathematics Courses 1-3 Common Core Edition 2013
 A Correlation of Prentice Hall Mathematics Courses 1-3 Common Core Edition 2013 to the Topics & Lessons of Pearson A Correlation of Courses 1, 2 and 3, Common Core Introduction This document demonstrates
GRADES 7, 8, AND 9 BIG IDEAS
 Table 1: Strand A: BIG IDEAS: MATH: NUMBER Introduce perfect squares, square roots, and all applications Introduce rational numbers (positive and negative) Introduce the meaning of negative exponents for
Evaluating the Lead Time Demand Distribution for (r, Q) Policies Under Intermittent Demand
 Policies Under Intermittent Demand") Proceedings of the 2009 Industrial Engineering Research Conference Evaluating the Lead Time Demand Distribution for (r, Q) Policies Under Intermittent Demand Yasin Unlu, Manuel D. Rossetti Department of
Proceedings of the 2009 Industrial Engineering Research Conference Evaluating the Lead Time Demand Distribution for (r, Q) Policies Under Intermittent Demand Yasin Unlu, Manuel D. Rossetti Department of
Impacts of large-scale solar and wind power production on the balance of the Swedish power system
 Impacts of large-scale solar and wind power production on the balance of the Swedish power system Joakim Widén 1,*, Magnus Åberg 1, Dag Henning 2 1 Department of Engineering Sciences, Uppsala University,
Prentice Hall Connected Mathematics 2, 7th Grade Units 2009
 Prentice Hall Connected Mathematics 2, 7th Grade Units 2009 Grade 7 C O R R E L A T E D T O from March 2009 Grade 7 Problem Solving Build new mathematical knowledge through problem solving. Solve problems
PRINCIPAL INVESTIGATORS:
 Annual Report 2011: Organic Wine Grapes Carol Miles, Walter Mahaffee, Michelle Moyer, Jonathan Roozen, David Wheeler, Gale Sterrett, Esther Nielsen, and Jacqueline King WSU Mount Vernon NWREC 16650 State
C;Ri.N. (<b &>o3s8: Université Louis Pasteur de Strasbourg. Institut National de Physique Nucléaire et de Physique des Particules t...
 (o3s8: C;Ri.N CWMB 7»-fi CO i\ ANGULAR ASSÏMBTRIBS IN A SHIELDED -^ PAIR LINE CO CJ H.-FANMarri, C.A. GMCIA CANAL «nd H. VUCETICH o \. CHRKE DE «CH.1RCHES KKXEAIRES UHIVERSITB LOUIS PASTEUR STRASBOURG
Determination of g using a spring
 INTRODUCTION UNIVERSITY OF SURREY DEPARTMENT OF PHYSICS Level 1 Laboratory: Introduction Experiment Determination of g using a spring This experiment is designed to get you confident in using the quantitative
Chapter 111. Texas Essential Knowledge and Skills for Mathematics. Subchapter B. Middle School
 Middle School 111.B. Chapter 111. Texas Essential Knowledge and Skills for Mathematics Subchapter B. Middle School Statutory Authority: The provisions of this Subchapter B issued under the Texas Education
Algebra I Vocabulary Cards
 Algebra I Vocabulary Cards Table of Contents Expressions and Operations Natural Numbers Whole Numbers Integers Rational Numbers Irrational Numbers Real Numbers Absolute Value Order of Operations Expression
A Comparison of System Dynamics (SD) and Discrete Event Simulation (DES) Al Sweetser Overview.
 and Discrete Event Simulation (DES) Al Sweetser Overview.") A Comparison of System Dynamics (SD) and Discrete Event Simulation (DES) Al Sweetser Andersen Consultng 1600 K Street, N.W., Washington, DC 20006-2873 (202) 862-8080 (voice), (202) 785-4689 (fax) [email protected]
A Comparison of System Dynamics (SD) and Discrete Event Simulation (DES) Al Sweetser Andersen Consultng 1600 K Street, N.W., Washington, DC 20006-2873 (202) 862-8080 (voice), (202) 785-4689 (fax) [email protected]
Bridging Documents for Mathematics
 Bridging Documents for Mathematics 5 th /6 th Class, Primary Junior Cycle, Post-Primary Primary Post-Primary Card # Strand(s): Number, Measure Number (Strand 3) 2-5 Strand: Shape and Space Geometry and
COTTON WATER RELATIONS
 COTTON WATER RELATIONS Dan R. Krieg 1 INTRODUCTION Water is the most abundant substance on the Earth s surface and yet is the most limiting to maximum productivity of nearly all crop plants. Land plants,
Fairfield Public Schools
 Mathematics Fairfield Public Schools AP Statistics AP Statistics BOE Approved 04/08/2014 1 AP STATISTICS Critical Areas of Focus AP Statistics is a rigorous course that offers advanced students an opportunity
ANNEX 2: Assessment of the 7 points agreed by WATCH as meriting attention (cover paper, paragraph 9, bullet points) by Andy Darnton, HSE
 by Andy Darnton, HSE") ANNEX 2: Assessment of the 7 points agreed by WATCH as meriting attention (cover paper, paragraph 9, bullet points) by Andy Darnton, HSE The 7 issues to be addressed outlined in paragraph 9 of the cover
ANNEX 2: Assessment of the 7 points agreed by WATCH as meriting attention (cover paper, paragraph 9, bullet points) by Andy Darnton, HSE The 7 issues to be addressed outlined in paragraph 9 of the cover
South Carolina College- and Career-Ready (SCCCR) Probability and Statistics
 Probability and Statistics") South Carolina College- and Career-Ready (SCCCR) Probability and Statistics South Carolina College- and Career-Ready Mathematical Process Standards The South Carolina College- and Career-Ready (SCCCR)
South Carolina College- and Career-Ready (SCCCR) Probability and Statistics South Carolina College- and Career-Ready Mathematical Process Standards The South Carolina College- and Career-Ready (SCCCR)
Bachelor's Degree in Business Administration and Master's Degree course description
 Bachelor's Degree in Business Administration and Master's Degree course description Bachelor's Degree in Business Administration Department s Compulsory Requirements Course Description (402102) Principles
Prentice Hall Algebra 2 2011 Correlated to: Colorado P-12 Academic Standards for High School Mathematics, Adopted 12/2009
 Content Area: Mathematics Grade Level Expectations: High School Standard: Number Sense, Properties, and Operations Understand the structure and properties of our number system. At their most basic level
How To Write A Data Analysis
 Mathematics Probability and Statistics Curriculum Guide Revised 2010 This page is intentionally left blank. Introduction The Mathematics Curriculum Guide serves as a guide for teachers when planning instruction
Manual for simulation of EB processing. Software ModeRTL
 1 Manual for simulation of EB processing Software ModeRTL How to get results. Software ModeRTL. Software ModeRTL consists of five thematic modules and service blocks. (See Fig.1). Analytic module is intended
SIMPLIFIED PERFORMANCE MODEL FOR HYBRID WIND DIESEL SYSTEMS. J. F. MANWELL, J. G. McGOWAN and U. ABDULWAHID
 SIMPLIFIED PERFORMANCE MODEL FOR HYBRID WIND DIESEL SYSTEMS J. F. MANWELL, J. G. McGOWAN and U. ABDULWAHID Renewable Energy Laboratory Department of Mechanical and Industrial Engineering University of
EXPERIENCES ON TRANSFER OF MANAGEMENT OF TECHNOLOGY FOR ASCOCHYTA BLIGHT OF CHICKPEA IN TURKEY. Nevin AÇIKGÖZ
 ANADOLU, J. of AARI 7 (1) 1997, 1-8 MARA EXPERIENCES ON TRANSFER OF MANAGEMENT OF TECHNOLOGY FOR ASCOCHYTA BLIGHT OF CHICKPEA IN TURKEY Nevin AÇIKGÖZ Aegean Agricultural Research Institute POB. 9 Menemen,
Simple Predictive Analytics Curtis Seare
 Using Excel to Solve Business Problems: Simple Predictive Analytics Curtis Seare Copyright: Vault Analytics July 2010 Contents Section I: Background Information Why use Predictive Analytics? How to use
Wind Turbine Power Calculations
 Wind Turbine Power Calculations RWE npower renewables Mechanical and Electrical Engineering Power Industry INTRODUCTION RWE npower is a leading integrated UK energy company and is part of the RWE Group,
Enhancing the SNR of the Fiber Optic Rotation Sensor using the LMS Algorithm
 1 Enhancing the SNR of the Fiber Optic Rotation Sensor using the LMS Algorithm Hani Mehrpouyan, Student Member, IEEE, Department of Electrical and Computer Engineering Queen s University, Kingston, Ontario,
Physics 9e/Cutnell. correlated to the. College Board AP Physics 1 Course Objectives
 Physics 9e/Cutnell correlated to the College Board AP Physics 1 Course Objectives Big Idea 1: Objects and systems have properties such as mass and charge. Systems may have internal structure. Enduring
Protein Protein Interaction Networks
 Functional Pattern Mining from Genome Scale Protein Protein Interaction Networks Young-Rae Cho, Ph.D. Assistant Professor Department of Computer Science Baylor University it My Definition of Bioinformatics
Curriculum Map Statistics and Probability Honors (348) Saugus High School Saugus Public Schools 2009-2010
 Saugus High School Saugus Public Schools 2009-2010") Curriculum Map Statistics and Probability Honors (348) Saugus High School Saugus Public Schools 2009-2010 Week 1 Week 2 14.0 Students organize and describe distributions of data by using a number of different
Curriculum Map Statistics and Probability Honors (348) Saugus High School Saugus Public Schools 2009-2010 Week 1 Week 2 14.0 Students organize and describe distributions of data by using a number of different
In developmental genomic regulatory interactions among genes, encoding transcription factors
 JOURNAL OF COMPUTATIONAL BIOLOGY Volume 20, Number 6, 2013 # Mary Ann Liebert, Inc. Pp. 419 423 DOI: 10.1089/cmb.2012.0297 Research Articles A New Software Package for Predictive Gene Regulatory Network
business statistics using Excel OXFORD UNIVERSITY PRESS Glyn Davis & Branko Pecar
 business statistics using Excel Glyn Davis & Branko Pecar OXFORD UNIVERSITY PRESS Detailed contents Introduction to Microsoft Excel 2003 Overview Learning Objectives 1.1 Introduction to Microsoft Excel
HAS FINANCE BECOME TOO EXPENSIVE? AN ESTIMATION OF THE UNIT COST OF FINANCIAL INTERMEDIATION IN EUROPE 1951-2007
 HAS FINANCE BECOME TOO EXPENSIVE? AN ESTIMATION OF THE UNIT COST OF FINANCIAL INTERMEDIATION IN EUROPE 1951-2007 IPP Policy Briefs n 10 June 2014 Guillaume Bazot www.ipp.eu Summary Finance played an increasing
ANIMATED PHASE PORTRAITS OF NONLINEAR AND CHAOTIC DYNAMICAL SYSTEMS
 ANIMATED PHASE PORTRAITS OF NONLINEAR AND CHAOTIC DYNAMICAL SYSTEMS Jean-Marc Ginoux To cite this version: Jean-Marc Ginoux. ANIMATED PHASE PORTRAITS OF NONLINEAR AND CHAOTIC DYNAMICAL SYSTEMS. A.H. Siddiqi,
Parallel Computing for Option Pricing Based on the Backward Stochastic Differential Equation
 Parallel Computing for Option Pricing Based on the Backward Stochastic Differential Equation Ying Peng, Bin Gong, Hui Liu, and Yanxin Zhang School of Computer Science and Technology, Shandong University,
Competency 1 Describe the role of epidemiology in public health
 The Northwest Center for Public Health Practice (NWCPHP) has developed competency-based epidemiology training materials for public health professionals in practice. Epidemiology is broadly accepted as
Fast Multipole Method for particle interactions: an open source parallel library component
 Fast Multipole Method for particle interactions: an open source parallel library component F. A. Cruz 1,M.G.Knepley 2,andL.A.Barba 1 1 Department of Mathematics, University of Bristol, University Walk,
Experimental Evaluation of the Discharge Coefficient of a Centre-Pivot Roof Window
 Experimental Evaluation of the Discharge Coefficient of a Centre-Pivot Roof Window Ahsan Iqbal #1, Alireza Afshari #2, Per Heiselberg *3, Anders Høj **4 # Energy and Environment, Danish Building Research
DESCRIPTIVE STATISTICS AND EXPLORATORY DATA ANALYSIS
 DESCRIPTIVE STATISTICS AND EXPLORATORY DATA ANALYSIS SEEMA JAGGI Indian Agricultural Statistics Research Institute Library Avenue, New Delhi - 110 012 [email protected] 1. Descriptive Statistics Statistics
ECONOMIC INJURY LEVEL (EIL) AND ECONOMIC THRESHOLD (ET) CONCEPTS IN PEST MANAGEMENT. David G. Riley University of Georgia Tifton, Georgia, USA
 AND ECONOMIC THRESHOLD (ET) CONCEPTS IN PEST MANAGEMENT. David G. Riley University of Georgia Tifton, Georgia, USA") ECONOMIC INJURY LEVEL (EIL) AND ECONOMIC THRESHOLD (ET) CONCEPTS IN PEST MANAGEMENT David G. Riley University of Georgia Tifton, Georgia, USA One of the fundamental concepts of integrated pest management
ECONOMIC INJURY LEVEL (EIL) AND ECONOMIC THRESHOLD (ET) CONCEPTS IN PEST MANAGEMENT David G. Riley University of Georgia Tifton, Georgia, USA One of the fundamental concepts of integrated pest management
Local outlier detection in data forensics: data mining approach to flag unusual schools
 Local outlier detection in data forensics: data mining approach to flag unusual schools Mayuko Simon Data Recognition Corporation Paper presented at the 2012 Conference on Statistical Detection of Potential