FIBER OPTIC EVANESCENT WAVE BIOSENSOR
|
|
|
- Felix Payne
- 8 years ago
- Views:
Transcription
1 FIBER OPTIC EVANESCENT WAVE BIOSENSOR Project report submitted in partial fulfillment of the requirement of the award of degree MASTER OF TECHNOLOGY IN OPTOELECTRONICS AND LASER TECHNOLOGY Submitted by Smrithi.V Register No Under the guidance of Dr. P. Radhakrishnan, International School of Photonics Cochin University of Science & Technology Cochin

2 ACKNOWLEDGEMENT With deep sense of gratitude, I express my heartfelt thanks to Dr. P. Radhakrishnan, Professor, ISP for the guidance, motivation, support and encouragement given throughout my project work. I express my sincere gratitude to Dr. M. Kailasnath, Director, ISP for the help rendered. I also express my sincere thanks to Dr. V.P.N Nampoori Emeritus Professor, ISP for his help. I am thankful to all the research scholars of ISP especially Mr. Bobby Mathews. C, Ms. Roopa Venkataraj and Sister Rosmin for their constant support and help. I extend my sincere thanks to the teaching and non teaching staff of ISP for all the help and assistance. I would like to remember my friends who helped me and supported me. I am extremely grateful to my family who were a constant source of encouragement. Last, but most important of all, I thank Almighty God. Smrithi.V

3 ABSTRACT Biosensors are analytical devices that can detect chemical or biological species or a microorganism. A biosensor utilizes a biological recognition element that senses the presence of an analyte ie; the species to be detected and creates a physical or chemical response that is converted by a transducer to a signal. Biosensors can be used in clinical diagnostics, drug development, environmental monitoring air, water, soil and food quality control. Fiber Optic Biosensors (FOBS) are optical fiber derived devices which use optical field to measure biological species. Because of their chemical inertness, their compatibility to a wide range of surface modification, the potential for remote sensing, efficiency, accuracy, low cost, and the ready availability of inexpensive lasers and photodetectors, FOBS are promising alternatives to traditional methods for biomolecule measurements. One reliable and sensitive optical method is evanescent sensing. A sensor based on evanescent field absorption relies on the interaction of a target substance with the evanescent field adjacent to the fibre core. Removing the cladding from a portion of an optical fibre permits the evanescent field to interact with the substances in which the fibre is immersed. The objective of this project work is to develop a Fiber Optic Biosensor based on evanescent wave to detect the microorganisms such as Yeast molecule and to evaluate their activity in the presence of Curcumin and Neera.
 are optical fiber derived devices which use optical field to measure biological species.")
4 CONTENTS 1. Introduction Optical Fiber Fiber Optic Sensor Classification of Fiber Optic Sensors Biosensors Introduction Principles of Optical Biosensors Optical Transduction Immobilization of Biorecognition elements Fiber Optic Biosensors Different types of FOBS Evanescent Wave Fiber Optic Biosensors Yeast Curcumin Neera Measurement of absorption spectrum of yeast in curcumin Measurement of absorption spectrum of yeast in neera Measurement of absorption spectrum of curcumin in neera Measurement of absorption spectrum of yeast in curcumin and neera Conclusions 61 References 62

5 CHAPTER 1 INTRODUCTION The field of biosensors has emerged as a topic of great interest because of the great need in medical diagnostics and, more recently, the worldwide concern of the threat of chemical and bioterrorism. The constant health danger posed by new strands of microbial organisms and spread of infectious diseases is another concern requiring biosensing for detecting and identifying them rapidly. Conventional laboratory methods for the detection of microorganisms and biological toxins in food, water, and human specimens are often time consuming, require extensive training in microbiology and give delayed results. Various rapid methods have also been attempted. These methods, while rapid, require sophisticated, expensive, non portable equipment, thus limiting their usefulness as real world detection systems. These sensitivities also are often limited. Optical biosensors utilize optical techniques to detect and identify chemical or biological species. They offer a number of advantages such as the ability for principally remote sensing with high selectivity and specificity and the ability to use unique biorecognition schemes. A biosensor is an analytical device that combines a biological sensing element with a transducer to produce a signal proportional to the analyte concentration. This signal can result from a change in protons concentration, release or uptake of gases, light emission, absorption and so forth, brought about by the metabolism of the target compound by the biological recognition element. The transducer converts this biological signal into a measurable response such as current, potential or absorption of light through electrochemical or optical means, which can be further amplified, processed and stored for later analysis. Fiber Optic Biosensors (FOBS) use optical fibers as the transduction element, and rely exclusively on optical transduction mechanisms for detecting target biomolecules. Evanescent wave FOBS are biosensors that utilize evanescent wave detection techniques. Electromagnetic waves propagate within an optical fiber by total internal reflection at the exposed surface. Light propagating through an optical fiber consists of two components: the guided field in the core and the exponentially decaying evanescent field in the cladding. In evanescent wave FOBS the cladding of a fiber is reduced or removed, the evanescent wave can interact with the surroundings. Thus evanescent wave FOBS can identify such target analytes in minutes directly from complex matrix samples, significantly improving the detection sensitivity, selectivity, and speed. The detection of chemical and biological agents is a key problem in environment protection and food monitoring. Traditional laboratory methods can accurately detect the chemical and biological agents. But the need for expensive devices, special operators, and also long time for detection limit their wide applications. Thus, it is an urgent demand to develop a simple, rapid, economical, portable and accurate detection device based on biological agent. 1

6 This project aims to investigate the properties of evanescent waves and to explore their novel applications as sensing devices for detecting Yeast molecules, because the rapid detection and identification of Yeast molecules are necessary for the assessment of their beneficial and harmful roles in the production and spoilage of foods respectively Fiber optic communication systems are light wave systems that employ optical fibers for information transmission. Such systems have been deployed worldwide since 1980 and have indeed revolutionized the technology behind telecommunications. Indeed, the light wave technology, together with microelectronics, is believed to be a major factor in the advent of the information age. 1.1 OPTICAL FIBER An optical fiber is a dielectric waveguide that operates at optical frequencies. An optical fiber is cylindrical in form consisting of the core, the cladding and the buffer. The basic structure is shown in figure 1.1. Fig 1.1 Basic structure of an optical fiber The core is a cylindrical rod of dielectric material and is generally made of glass. Light propagates mainly along the core of the fiber. The cladding layer is made of a dielectric material with an index of refraction less than that of the core material. The cladding is usually made of glass or plastic. The cladding reduces scattering loss that results from dielectric discontinuities at the core surface, it adds mechanical strength to the fiber, and it protects the core from absorbing surface contaminants with which it could come in contact. The coating or buffer is a layer of material used to protect an optical fiber from physical damage. The material used for a buffer is a type of plastic. The buffer is elastic in nature and prevent abrasions. The light propagates through the fiber by total internal reflection. The angle at which total internal reflection occurs is called the critical angle of incidence. At any angle of incidence, 2

7 greater than the critical angle, light is totally reflected back into the glass medium. The critical angle of incidence is determined by Snell s Law. Figure 1.2 Total Internal Reflection in an Optical Fiber Optical fibers are divided into two groups called single mode and multimode. Single mode fiber is optical fiber that is designed for the transmission of a single ray or mode of light as a carrier and is used for long distance signal transmission. Single mode fiber has a much smaller core than multimode fiber. Multimode fiber is optical fiber that is designed to carry multiple light rays or modes concurrently, each at a slightly different reflection angle within the optical fiber core. Multimode fiber transmission is used for relatively short distances because the modes tend to disperse over longer lengths (this is called modal dispersion).for longer distances, single mode fiber sometimes called monomode) fiber is used. In classifying the index of refraction profile, we differentiate between step index and graded index. Step index fibers have a constant index profile over the whole cross section. Graded index fibers have a nonlinear, rotationally symmetric index profile, which falls off from the center of the fiber outwards. Figure 1.3 shows the different types of optical fibers 3

8 Chapter 2 MEASUREMENT OF ABSORPTION SPECTRUM OF YEAST IN CURCUMIN This section deals with the determination of the absorption spectrum of (a) Curcumin in ethanol, (b) Yeast and Curcumin dissolved in ethanol using Jasco V 570 UV/ Visible/ NIR Spectrophotometer and Ocean Optics Spectrometer Measurement of absorption spectrum of Curcumin in ethanol and different concentrations 0.2, 0.4, 0.6 and 0.8 gms of yeast in curcumin using Spectrophotometer. Preparation of the sample (i) (ii) Curcumin 40 ml of ethanol is taken in a beaker molar curcumin is weighed and dissolved well in ethanol. Yeast in Curcumin Take four 100ml beakers and label them as 0.2, 0.4, 0.6 and 0.8 gms. Add 20 ml of sterilized water into each of these beakers. Then weigh 0.2, 0.4, 0.6 and 0.8 gms of Yeast using a weighing balance and dissolved well into the sterilized water. Divide the curcumin solution into four equals parts and pour into the four beakers containing yeast extract. Experimental procedure Absorption spectrum of the samples are taken using UV Visible NIR Spectrophotometer. Graph showing absorption spectrum for curcumin and different concentrations of Yeast in curcumin are shown in figures below. 19

9 (a) (b) (c) 20
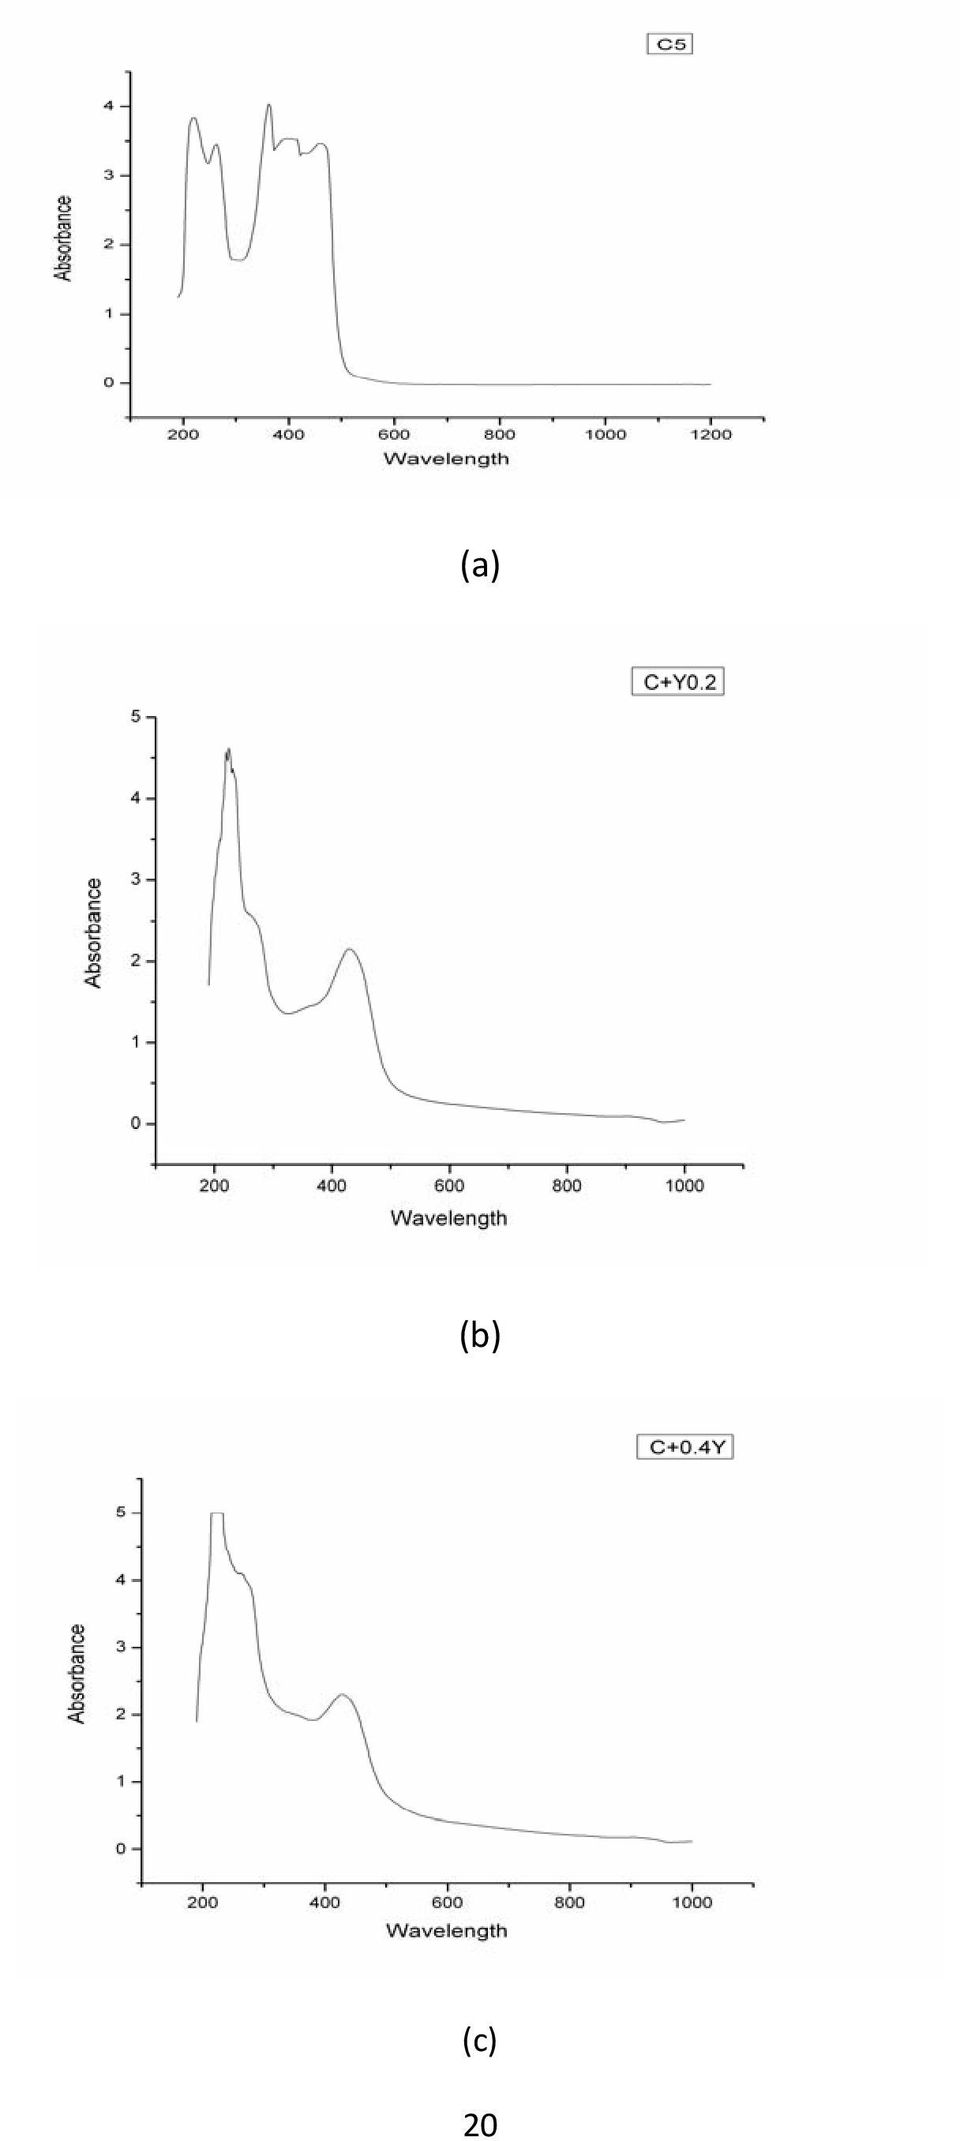
10 (d) (e) Fig 2.1 Absorption spectrum for curcumin and different concentrations of yeast in curcumin. Variation in the wavelength of peak 3 for different concentrations of yeast is plotted below. Conc Vs wavelength Wavelength (nm) Concentration of yeast (gms) Fig 2.2 Graph showing the variation in wavelength of peak 3 for different concentrations of yeast in the presence of constant amount of curcumin 21
 Fig 2.")
11 Conclusions 1. Absorption spectrum was well defined at lower concentrations. 2. As the concentration of yeast in curcumin is increased peak 3 showed a blue shift in wavelength. 3. The experiment was repeated for lower concentrations , 0.001, 0.005, 0.01, 0.05, 0.1 and 0.2 gms and for higher concentrations 1, 3 and 5 gms of yeast. The above result was repeated for lower concentrations. For higher concentrations structure of the absorption spectrum changes with the addition of yeast. 2.2 Measurement of evanescent wave absorption spectrum of Curcumin in ethanol and different concentrations of yeast in curcumin. Absorption spectrum is obtained using evanescent wave sensor and ocean optics spectrometer. Experimental layout is as follows. Here the variation in intensity of output light is determined for different concentrations of yeast in curcumin. Equipments required are (i) White light LED source (ii) Sensing cell : Made of glass, 15 cm long, 2.5 cm wide (iii) Sensing fiber: Multimode, 400 μm core diameter, 430 μm cladding diameter (iii) Ocean optics spectrometer: HR 4000, responsive from nm. Preparation of Sensing Fiber Take Plastic Clad Silica fiber of length 30 cm. The ends of the fiber should be polished for maximum coupling of light from source to fiber and also from fiber to detector. A small portion of the fiber is removed from both the ends of the fiber. These ends are then cut with a diamond cutter. Hand polishing is done by drawing figure "8" patterns on a polishing sheet. After determining the desired sensor length, it is marked at the middle portion of the fiber. The sheath as well as the cladding of the marked portion is then removed using a razor blade. The remaining cladding is removed by dipping that portion in acetone. Preparation of Sensing Cell The sensing cell is made from cylindrical glass tube of length 15cm and of diameter 2.5 cm. The two ends of the tubes are closed and a hole is made at each ends through which the fiber is passed. 22

12 Preparation of the sample (i) Curcumin 40 ml of ethanol is taken in a beaker molar curcumin is weighed and dissolved well in ethanol. (ii) Yeast in Curcumin Take seven 100ml beakers and label them as , 0.001, 0.005, 0. 01, 0.05, 0.1 and 0.2 gms. Add 20 ml of sterilized water into each of these beakers. Then weigh , 0.001, 0.005, 0. 01, 0.05, 0.1 and 0.2 gms of Yeast using a weighing balance and dissolved well into the sterilized water. Divide the curcumin solution into seven equals parts and pour into the seven beakers containing yeast extract. Experimental Set Up 23

13 Fig 2.3 Experimental set up for Evanescent wave biosensor Experimental procedure Fix the components required for the sensing on the optical bench. Switch on the white light source. Align the components in such a way that light coming out from the fiber falls on the ocean optics spectrometer. Take the spectrum of the cell. Then pour the different concentrations of sample into the glass cell one by one and note the corresponding intensity of output light in terms of wavelength. Ensure that each time before adding the new concentration of sample into the glass cell, the sensing cell must be cleaned using the sterilized water. 24

14 Absorption spectrum of source, cell, curcumin and different concentrations of yeast in curcumin are shown below. The first peak is obtained at 453 nm. Second peak is obtained at 545 nm. (a) Second peak is at 549 nm (b) 25

15 Second peak for curcumin is at 555 nm. (c) 1600 Yeast gm + Curcumin 1400 Intensity Wavelength Wavelength of the second peak is at 591 nm. (d) 1300 Yeast gm + Curcumin 1200 Intensity Wavelength Wavelength of the second peak is at 601 nm. (e) 1200 Yeast gm + Curcumin 1100 Intensity Wavelength 26

16 Wavelength of the second peak is at 596 nm. (f) 1300 Yeast 0.01 gm + Curcumin 1200 Intensity Wavelength Wavelength of the second peak is at 593 nm. (g) 1300 Yeast 0.05 gm + Curcumin Intensity Wavelength Wavelength of the second peak is at 545 nm. (h) 1600 Yeast 0.1 gm + Curcumin 1400 Intensity Wavelength Wavelength of the second peak is at 545 nm. 27

17 (i) 1800 Yeast 0.2 gm + Curcumin 1600 Intensity Wavelength Wavelength of the second peak is at 545 nm. Fig 2.4 Evanescent wave absorption spectrum for different concentrations of yeast in curcumin (j) Graph showing the variation in relative intensity and wavelength of the second peak with concentration of yeast are shown below Conc. Vs Relative intensity 1.8 Relative intensity Conc. oc yeast in gms (a) 28
 Graph showing the variation in")
18 Y+C 1600 Intensity of first peak Conc. of yeast in gms (b) Conc. Vs Wavelength Wavelength (nm) Concentration of Yeast (gms) (c) Fig 2.5 Graph showing the variation in (a) relative intensity, (b) Intensity of peak 1 and wavelength of peak 2 for different concentrations of yeast (c) Conclusions 1. It was observed that when yeast was added to curcumin, there was a red shift in wavelength for peak When concentration of yeast was increased further there is a blue shift followed by saturation. 3. In the presence of curcumin, the first peak gets suppressed especially at lower concentrations of yeast. 29

19 4. Thus yeast can be detected in the presence of curcumin especially at low concentrations. 30

20 Chapter 3 MEASUREMENT OF ABSORPTION SPECTRUM OF YEAST IN NEERA This section deals with the determination of the absorption spectrum of Yeast dissolved in sterilized water in neera using Jasco V 570 UV/ Visible/ NIR Spectrophotometer and Ocean Optics Spectrometer. 3.1 Measurement of absorption spectrum of different concentrations 0.1, 0.5, 1 and 2 gms of yeast in neera. Yeast in neera Preparation of the sample Take four 100ml beakers and label them as 0.1, 0.5, 1 and 2 gms. Add 20 ml of sterilized water into each of these beakers. Then weigh 0.1, 0.5, 1 and 2 gms of Yeast using a weighing balance and dissolve well into the sterilized water. Add 30 ml neera into these beakers and stir well. Experimental procedure Absorption spectrum of the samples are taken using UV Visible NIR Spectrophotometer. Graph showing absorption spectrum for neera, 0.1 gm concentration of Yeast and different concentrations of yeast in neera are shown in figures below. Neera Absorbance (AU) Wavelength (nm) (a) 30

21 (b) Downward peak is observed at 298 nm and upward peak at 360 nm. (c) Upward peak is observed at 338 nm. (d) 31
22 Upward peak is observed at 332 nm. (e) Upward peak is observed at 328 nm. (f) Fig 3.1 Absorption spectrum for neera, yeast and yeast in neera Graph showing the variation in wavelength of the absorption peak with concentration of yeast in neera is shown below. 32
23 365 Y+N Wavelength (nm) Concentration of yeast (gms) Fig 3.2 Graph showing variation in wavelength for the peak with concentration of yeast Conclusions 1. Peak absorption spectrum of neera is at 238 nm. 2. Addition of yeast shifts the absorption maximum of yeast from around 220 nm to 360 nm at low concentration. 3. With increase in concentration of yeast, the peak shifts to blue side. 4. In the presence of neera, there is a switch over from negative values of absorption to positive values at lower concentrations of yeast. 5. This enables the measurement of concentration of yeast in the presence of neera. 3.2 Measurement of evanescent wave absorption spectrum of different concentrations of yeast in neera. Evanescent wave absorption spectrum is obtained using evanescent wave sensor and ocean optics spectrometer. Experimental layout and set up is explained in section II of chapter 2. Here the variation in intensity of output light is determined for different concentrations of yeast in neera. Evanescent wave absorption spectrum of of source, cell, neera and different concentrations of yeast in neera are given below. For all cases first peak is obtained at 453 nm. 33
24 Second peak is obtained at 545 nm. (a) Second peak is at 549 nm (b) Wavelength of second peak is 556 nm. (c) 34
25 Peak is obtained at 569 nm. (d) Second Peak is obtained 568 nm. (e) Peak obtained at and 568 nm. (f) 35
26 Peaks is obtained at 568 nm. (g) Fig 3.3 Evanescent wave absorption spectrum for different concentrations of yeast in neera Variation in wavelength of second peak with increase in the concentration of yeast is shown below Conc. Vs Wavelength Wavelength (nm) Conc. of yeast in gms Fig 3.4 Concentration of yeast Vs wavelength of second peak 36
27 Conclusions 1. In the presence of neera with increase in concentration of yeast, the relative intensity increases. 2. There is no appreciable change in the evanescent wave absorption spectrum of yeast in neera at higher concentrations. The first peak was immersed in noise. 3. Absorption spectrum gives a better signature regarding the measurement of yeast in the presence of neera. 4. Experiment was performed for higher concentrations of yeast (upto 20 gms). But there was not much variation in the output and hence has not been presented here. 37
28 Chapter 4 MEASUREMENT OF EVANESCENT WAVE ABSORPTION SPECTRUM OF CURCUMIN IN NEERA Absorption spectrum is obtained using evanescent wave sensor and ocean optics spectrometer. Experimental layout and set up is explained in section II of chapter 2. Here the variation in intensity of output light is determined for different concentrations of curcumin in neera. 4.1Measurement of Evanescent wave absorption spectrum of 10 3 molar curcumin in neera. Preparation of the sample Curcumin in neera Take four 100ml beakers and label them as 0.25*10 3 molar curcumin, 0.33*10 3 molar, 0.5*10 3 molar curcumin and 10 3 molar curcumin,. Take 80ml, 60ml, 40ml and 20ml ethanol in the above beakers. Weigh 10 3 molar curcumin using a weighing balance and add into the beakers and dissolve well in ethanol. Add 30 ml neera into these beakers and stir well. Graph showing evanescent wave absorption spectrum for neera, different concentrations of curcumin in neera are shown in figure below. The first peak was at 453 nm for all the cases. The second peak is at 545 nm. (a) 38
29 Second peak is observed at 547 nm. (b) The second peak is at 555 nm. (c) Second peak is observed at 553 nm. (d) 39
30 c Second peak is observed at 549 nm. (e) (f) Second peak is observed at 545 nm. (g) Second peak is observed at 545 nm. Fig 4.1 Evanescent wave absorption spectrum for different concentrations of curcumin in neera. 40
31 Variation in the intensity of peak 1 and wavelength of peak 2 for different concentrations of curcumin are plotted below C+N 3000 Intensity (AU) * * * Molar conc of curcumin (a) 554 C+N 552 Wavelength (nm) * * * Molar concentration of curcumin (b) Fig 4.2 Graphs showing (a) Concentration of curcumin Vs intensity of peak 1 & (b) Concentration of curcumin Vs wavelength of peak 2 for to 10 3 Molar curcumin in the presence of neera. 41
32 4.2 Measurement of evanescent wave absorption spectrum of 10 6, 10 5, 10 4 molar curcumin in neera. Preparation of the sample Curcumin in neera Take three 100ml beakers and label them as 10 6 molar curcumin, 10 5 molar curcumin and 10 4 molar curcumin. Take 40 ml ethanol in the above beakers. Weigh 10 6 molar curcumin, 10 5 molar curcumin and 10 4 molar curcumin using a weighing balance and add into the respective beakers and dissolve well in ethanol. Add 10 ml neera into these beakers and stir well. Add 10 ml ethanol to the above three samples to obtain the next sample to obtain 0.8 molar concentrations. 10 ml ethanol is again added to obtain the 0.67 molar concentrations. Graph showing evanescent wave absorption spectrum for neera, different concentrations of curcumin in neera are shown in figure below. The first peak was at 453 nm for all the cases. Second peak is observed at 560 nm. (a) 42
33 Second peak is observed at 555 nm. (b) Second peak is observed at 555 nm. (c) Second peak is observed at 557 nm. (d) 43
34 Second peak is observed at 560 nm. (e) Second peak is observed at 551 nm. (f) Second peak is observed at 552 nm. (g) 44
35 Second peak is observed at 558 nm. (h) Second peak is observed at 549 nm. (i) Second peak is observed at 553 nm. (j) 45
36 Second peak is observed at 557 nm. (k) Fig 4.3 Evanescent wave absorption spectrum for different concentrations of curcumin in neera. C+N Intensity (AU) * * * * Molar conc. of Curcumin (a) 46
37 C+N Wavelength (nm) * * * * Molar conc. of Curcumin (b) Fig 4.4 Graphs showing (a) Concentration of curcumin Vs intensity of peak 1 & (b) Concentration of curcumin Vs wavelength of peak 2 in the presence of neera. Conclusions 1. When neera is added to curcumin there was a blue shift in wavelength for the second peak when the concentration of curcumin was increased. 2. Also the amplitude of the first peak decreased with the concentration of curcumin. 3. The device performs in a linear fashion at lower concentrations and shows saturation at higher concentrations. 4. Hence neera can be used to measure the concentration of curcumin. 47
38 Chapter 5 MEASUREMENT OF ABSORPTION SPECTRUM OF YEAST IN CURCUMIN AND NEERA This section deals with the determination of the absorption spectrum of Yeast dissolved in sterilized water in neera and curcumin using Jasco V 570 UV/ Visible/ NIR Spectrophotometer and Ocean Optics Spectrometer HR 4000 ( nm). 5.1 Measurement of absorption spectrum of different concentrations 0.001, 0.01, 0.1 and 1 gm Yeast in curcumin and neera. Preparation of the sample (i) Curcumin 40 ml of ethanol is taken in a beaker molar curcumin is weighed and dissolved well in ethanol. (ii) Yeast in Curcumin and Neera Take four 100ml beakers and label them as 0.001, 0.01, 0.1 and 1 gms. Add 20 ml of sterilized water into each of these beakers. Then weigh 0.001, 0.01, 0.1 and 1 gms of Yeast using a weighing balance and dissolved well into the sterilized water. Divide the curcumin solution into four equal parts and pour into the four beakers containing yeast extract. Add 30 ml of neera into four beakers and stir well. Experimental procedure Absorption spectrum of the samples are taken using UV Visible NIR Spectrophotometer. Graph showing absorption spectrum for curcumin and different concentrations of Yeast in curcumin are shown in figures below. (a) 48
39 Neera Absorbance (AU) Wavelength (nm) (b) (c) (d) 49
40 (e) (f) (g) 50
41 (h) (i) (j) Fig 5.1 Absorption spectrum for yeast in curcumin and neera 51
42 Graph showing the variation in wavelength of the absorption peak with concentration of yeast in neera and curcumin is shown below. 440 YNC 420 Wavelength of peak (nm) Conc. of yeaast in gms Fig 5.2 Absorption peak Vs concentration of yeast Conclusions 1. With increase in concentration of yeast, the peak shifts to blue side. 2. This enables the measurement of concentration of yeast in the presence of neera and curcumin. 5.2 Measurement of evanescent wave absorption spectrum of different concentrations of yeast in curcumin and neera. Absorption spectrum is obtained using evanescent wave sensor and ocean optics spectrometer. Experimental layout and set up is explained in section II of chapter 2. Here the variation in intensity of output light is determined for different concentrations of yeast in curcumin and neera. Preparation of the sample is explained in section I. Absorption spectrum using ocean optics spectrometer is shown below. 52
43 Second peak is obtained at 545 nm. (a) Second peak is at 549 nm (b) Wavelength of second peak is 556 nm. (c) 53
44 Peak is obtained at 573 nm. (d) Second Peak is obtained 572 nm. (e) Peak obtained at and 569 nm. (f) 54
45 Peak obtained at and 569 nm. (g) Fig 5.3 Evanescent wave absorption spectrum of yeast in neera and curcumin Variation in wavelength of second peak with increase in the concentration of yeast is shown below. 573 YNC 572 Wavelength (nm) Concentration of yeast (gms) Fig 5.4 Concentration of yeast Vs wavelength of the second peak 55
46 Conclusions 1. First peak was suppressed when neera and curcumin are added to yeast. 2. For lower concentrations of yeast, there is blue shift in wavelength of the second peak. 3. For higher concentrations wavelength saturates so sensitivity is low. 4. This enables the measurement of lower concentration of yeast in the presence of neera and curcumin. 5.3 Measurement of absorption spectrum of different concentrations of curcumin in Yeast and neera. Absorption spectrum is obtained using evanescent wave sensor and ocean optics spectrometer. Experimental layout and set up is explained in section II of chapter 2. Here the variation in intensity of output light is determined for different concentrations of yeast in curcumin and neera. Preparation of the sample a) Curcumin in neera Take four 100ml beakers and label them as 10 4,5*10 4,10 3 and 5* 10 3 molar.take 40ml ethanol into each of these beakers. Then weigh 10 4,5*10 4, 10 3 and 5* 10 3 molar curcumin using a weighing balance and add into the beakers and dissolve well into the ethanol. b) Yeast in neera Take a 100ml beaker and add 20 ml of sterilized water into it. Then weigh 0.01 gm of Yeast using a weighing balance and dissolve well into the sterilized water. Add 30ml neera into this beaker and stir well. Now the solution is divided into four and poured into the four beakers containing curcumin. Evanescent wave absorption spectrum of the samples are determined using Ocean Optics Spectrometer Graph showing evanescent wave absorption spectrum for neera, concentrations of curcumin in neera and yeast are shown in figure below. different 56
47 Second peak is at 547 nm (a) Wavelength of second peak is 556 nm. (b) Wavelength of second peak is 545 nm. (c) 57
48 Peak is obtained at 557 nm. (d) Second Peak is obtained 552 nm. (e) Peak obtained at and 560 nm. (f) 58
49 Peaks is obtained at 576 nm. (g) Peaks is obtained at 585 nm. (h) Fig 5.5 Evanescent wave absorption spectrum of curcumin in yeast and neera Variation in wavelength of second peak with increase in the concentration of curcumin is shown below. 59
50 Y+N+C Wavelength (nm) * *10-3 Molar Concentration of curcumin Fig 5.6 Concentration of Curcumin Vs wavelength of second peak Conclusions 1. There is complete elimination of first peak in the presence of neera and yeast. 2. Signal strength is comparatively high and noise is also absent. 3. When concentration of curcumin was increased, spectrum shows red shift which is a concentration related feature. 4. This enables the detection of curcumin in the presence of neera and yeast. Comparison In Evanescent wave absorption 1. When concentration of curcumin in the presence of yeast and neera is increased, there was red shift in wavelength of peak 2 from 552 nm to 585 nm. 2. When concentration of yeast in the presence of curcumin and neera was increased, there was blue shift in wavelength of peak 2 from 573 nm to 569nm. 60
51 Chapter 6 CONCLUSIONS This project started with the detection of yeast in the presence of curcumin. First absorption spectrum for different concentrations of yeast in curcumin was studied. Absorption spectrum was well defined at lower concentrations. As the concentration of yeast in curcumin is increased peak 3 showed a blue shift in wavelength. Then the spectral analysis of the samples was done using evanescent wave sensor and ocean optics spectrometer. It was observed that as the concentration of yeast was increased there was a small red shift in wavelength for peak 2 initially. When yeast concentration was increased further there was a blue shift and subsequent saturation. Also the first peak gets suppressed at lower concentrations of yeast.thus yeast can be detected in the presence of curcumin. For the next studies neera was added to yeast. With increase in concentration of yeast, the second peak shifts to blue side. There was a switch over from negative values of absorption to positive values of absorption at lower concentrations of yeast in the absorption spectrum. This enables the measurement of concentration of yeast in the presence of neera. There was no appreciable change in the evanescent wave absorption spectrum of yeast in neera at higher concentrations. Next reaction between neera and curcumin was studied using ocean optics spectrometer. When neera is added to curcumin there was a blue shift in wavelength for the second peak when the concentration of curcumin was increased. Also the amplitude of the first peak decreased with the concentration of curcumin unlike in the case of reaction between curcumin and yeast where there was an increase in the amplitude of the first peak. Hence neera can be used to measure the concentration of curcumin. For the final studies yeast in the presence of curcumin and neera was taken. Evanescent wave absorption spectrum for different concentrations of yeast in curcumin and neera are taken using ocean optics spectrometer. First peak was suppressed due to the presence of curcumin and neera. Second peak has a blue shift and saturation, as concentration of yeast was increased. This enables the measurement of concentration of yeast in the presence of neera and curcumin. Evanescent wave absorption spectrum for different concentrations of curcumin in the presence of yeast and neera was studied next. Here also the first peak was suppressed. As the concentration of curcumin was increased, there was a red shift in wavelength. This enables the detection of curcumin in the presence of neera and yeast. From this studies I conclude that even small concentrations of yeast and curcumin can be detected in the presence of neera. 61
52 REFERENCES [1] B.D.Gupta, Fiber Optic Sensors: Principles and Applications, 3 rd Edition, 2006, ( New India Publishing Agency). [2] Paras N Prasad, Introduction to Biophotonics, 4 th Edition, 2003, (published by John. Wile and sons, Inc). [3] Otto S Wolfbeis, Fiber optic chemical sensors and Biosensors, Analytical Chemistry, 2004 Vol. 76, pages [4] Mehrab Mehrvar and Chris Bis, Fiber Optic Biosensors Trends and Advances, Analytical Sciences, 2000, Vol. 16, pages [5] Angela Leung, P. Mohana Shankar, Raj Mutharasan, A Review of Fiber Optic Biosensors, Sensors and Actuators B Vol. 125, 2007 pages [6] S. F. D Souza, Microbial Biosensors, Biosensors and Bioelectronics Vol 16, 2001 pages [7] Chunhui Dai, Seokheun Choi, Technology and Applications of Microbial Biosensors, Open Journal of Applied Biosensor, 2013 Vol 2, pages [8] Yu Lei, Wilfred Chen, Ashok Mulchandani, Microbial Biosensors, Analytica Chimica Acta 2006, pages [9] Daniel V. Lim, Detection of Microorganisms and Toxins with Evanescent Wave Fiber Optic Biosensors, Proceedings of the IEEE, 2003, Vol 91, pages [10] Maria Espinosa Bosch, Antonio Jesus Ruiz Sanchez, Fuensanta Sanchez Rojas, Catalina Bosch Ojeda, Recent Development in Optical Fiber Biosensors, Sensors, 2007, Vol. 7, pages [11] Miso Park, Shen Long Tsai and Wilfred Chen, Microbial Biosensors: Engineered Microorganisms as the Sensing Machinery, Sensors, 2013, Vol. 13, pages
53 63
Experiment #5: Qualitative Absorption Spectroscopy
 Experiment #5: Qualitative Absorption Spectroscopy One of the most important areas in the field of analytical chemistry is that of spectroscopy. In general terms, spectroscopy deals with the interactions
Upon completion of this lab, the student will be able to:
 1 Learning Outcomes EXPERIMENT B4: CHEMICAL EQUILIBRIUM Upon completion of this lab, the student will be able to: 1) Analyze the absorbance spectrum of a sample. 2) Calculate the equilibrium constant for
EXPERIMENT 11 UV/VIS Spectroscopy and Spectrophotometry: Spectrophotometric Analysis of Potassium Permanganate Solutions.
 EXPERIMENT 11 UV/VIS Spectroscopy and Spectrophotometry: Spectrophotometric Analysis of Potassium Permanganate Solutions. Outcomes After completing this experiment, the student should be able to: 1. Prepare
Fiber Optics: Fiber Basics
 Photonics Technical Note # 21 Fiber Optics Fiber Optics: Fiber Basics Optical fibers are circular dielectric wave-guides that can transport optical energy and information. They have a central core surrounded
Limiting factors in fiber optic transmissions
 Limiting factors in fiber optic transmissions Sergiusz Patela, Dr Sc Room I/48, Th. 13:00-16:20, Fri. 9:20-10:50 sergiusz.patela@pwr.wroc.pl eportal.pwr.wroc.pl Copying and processing permitted for noncommercial
Application Note: Absorbance
 Units Units Theory of absorbance Light absorption occurs when atoms or molecules take up the energy of a photon of light, thereby reducing the transmission of light as it is passed through a sample. Light
GLOBAL COLLEGE OF ENGINEERING &TECHNOLOGY: YSR DIST. Unit VII Fiber Optics Engineering Physics
 Introduction Fiber optics deals with the light propagation through thin glass fibers. Fiber optics plays an important role in the field of communication to transmit voice, television and digital data signals
INTRODUCTION FIGURE 1 1. Cosmic Rays. Gamma Rays. X-Rays. Ultraviolet Violet Blue Green Yellow Orange Red Infrared. Ultraviolet.
 INTRODUCTION Fibre optics behave quite different to metal cables. The concept of information transmission is the same though. We need to take a "carrier" signal, identify a signal parameter we can modulate,
Optical Fibers Fiber Optic Cables Indoor/Outdoor
 presents Optical Fibers Fiber Optic Cables Indoor/Outdoor Content Optical fiber function, types optical effects applications production of optical fibre Cable - general types Indoor Indoor / outdoor Outdoor
Electromagnetic Radiation (EMR) and Remote Sensing
 and Remote Sensing") Electromagnetic Radiation (EMR) and Remote Sensing 1 Atmosphere Anything missing in between? Electromagnetic Radiation (EMR) is radiated by atomic particles at the source (the Sun), propagates through
Electromagnetic Radiation (EMR) and Remote Sensing 1 Atmosphere Anything missing in between? Electromagnetic Radiation (EMR) is radiated by atomic particles at the source (the Sun), propagates through
Module 13 : Measurements on Fiber Optic Systems
 Module 13 : Measurements on Fiber Optic Systems Lecture : Measurements on Fiber Optic Systems Objectives In this lecture you will learn the following Measurements on Fiber Optic Systems Attenuation (Loss)
Austin Peay State University Department of Chemistry Chem 1111. The Use of the Spectrophotometer and Beer's Law
 Purpose To become familiar with using a spectrophotometer and gain an understanding of Beer s law and it s relationship to solution concentration. Introduction Scientists use many methods to determine
Laboratory #3 Guide: Optical and Electrical Properties of Transparent Conductors -- September 23, 2014
 Laboratory #3 Guide: Optical and Electrical Properties of Transparent Conductors -- September 23, 2014 Introduction Following our previous lab exercises, you now have the skills and understanding to control
Polarization of Light
 Polarization of Light References Halliday/Resnick/Walker Fundamentals of Physics, Chapter 33, 7 th ed. Wiley 005 PASCO EX997A and EX999 guide sheets (written by Ann Hanks) weight Exercises and weights
Fundamentals of modern UV-visible spectroscopy. Presentation Materials
 Fundamentals of modern UV-visible spectroscopy Presentation Materials The Electromagnetic Spectrum E = hν ν = c / λ 1 Electronic Transitions in Formaldehyde 2 Electronic Transitions and Spectra of Atoms
Using the Spectrophotometer
 Using the Spectrophotometer Introduction In this exercise, you will learn the basic principals of spectrophotometry and and serial dilution and their practical application. You will need these skills to
Overview. What is EMR? Electromagnetic Radiation (EMR) LA502 Special Studies Remote Sensing
 LA502 Special Studies Remote Sensing") LA502 Special Studies Remote Sensing Electromagnetic Radiation (EMR) Dr. Ragab Khalil Department of Landscape Architecture Faculty of Environmental Design King AbdulAziz University Room 103 Overview What
LA502 Special Studies Remote Sensing Electromagnetic Radiation (EMR) Dr. Ragab Khalil Department of Landscape Architecture Faculty of Environmental Design King AbdulAziz University Room 103 Overview What
Blackbody Radiation References INTRODUCTION
 Blackbody Radiation References 1) R.A. Serway, R.J. Beichner: Physics for Scientists and Engineers with Modern Physics, 5 th Edition, Vol. 2, Ch.40, Saunders College Publishing (A Division of Harcourt
Spectrophotometry and the Beer-Lambert Law: An Important Analytical Technique in Chemistry
 Spectrophotometry and the Beer-Lambert Law: An Important Analytical Technique in Chemistry Jon H. Hardesty, PhD and Bassam Attili, PhD Collin College Department of Chemistry Introduction: In the last lab
Different Types of Dispersions in an Optical Fiber
 International Journal of Scientific and Research Publications, Volume 2, Issue 12, December 2012 1 Different Types of Dispersions in an Optical Fiber N.Ravi Teja, M.Aneesh Babu, T.R.S.Prasad, T.Ravi B.tech
Measuring of optical output and attenuation
 Measuring of optical output and attenuation THEORY Measuring of optical output is the fundamental part of measuring in optoelectronics. The importance of an optical power meter can be compared to an ammeter
E F G. Overview of the activities. SAPIE ZA Università di Roma - Laboratorio di Fotonica Molecolare
 SAPIE ZA Università di Roma Dipartimento di Energetica Laboratorio di Fotonica Molecolare Francesco Michelotti E-Mail: francesco.michelotti@uniroma1.it Tel: +39 06-49.91.65.62 Workshop Future Trends in
Experiment #2: Determining Sugar Content of a Drink. Objective. Introduction
 Experiment #2: Determining Sugar Content of a Drink Objective How much sugar is there in your drink? In this experiment, you will measure the amount of sugar dissolved in a soft drink by using two different
What are Fibre Optics?
 Fibre Optics Fibre Optics? Fibre optics (optical fibres) are the guiding channels through which light energy propagates. These are long, thin strands of very pure glass about the diameter of a human hair
P R E A M B L E. Facilitated workshop problems for class discussion (1.5 hours)
") INSURANCE SCAM OPTICS - LABORATORY INVESTIGATION P R E A M B L E The original form of the problem is an Experimental Group Research Project, undertaken by students organised into small groups working as
INSURANCE SCAM OPTICS - LABORATORY INVESTIGATION P R E A M B L E The original form of the problem is an Experimental Group Research Project, undertaken by students organised into small groups working as
PIPELINE LEAKAGE DETECTION USING FIBER-OPTIC DISTRIBUTED STRAIN AND TEMPERATURE SENSORS WHITE PAPER
 PIPELINE LEAKAGE DETECTION USING FIBER-OPTIC DISTRIBUTED STRAIN AND TEMPERATURE SENSORS WHITE PAPER Lufan Zou and Taha Landolsi OZ Optics Limited, 219 Westbrook Road, Ottawa, ON, Canada, K0A 1L0 E-mail:
ILLUSTRATIVE EXAMPLE: Given: A = 3 and B = 4 if we now want the value of C=? C = 3 + 4 = 9 + 16 = 25 or 2
 Forensic Spectral Anaylysis: Warm up! The study of triangles has been done since ancient times. Many of the early discoveries about triangles are still used today. We will only be concerned with the "right
The photoionization detector (PID) utilizes ultraviolet
 utilizes ultraviolet") Chapter 6 Photoionization Detectors The photoionization detector (PID) utilizes ultraviolet light to ionize gas molecules, and is commonly employed in the detection of volatile organic compounds (VOCs).
Chapter 6 Photoionization Detectors The photoionization detector (PID) utilizes ultraviolet light to ionize gas molecules, and is commonly employed in the detection of volatile organic compounds (VOCs).
Optical Fibres. Introduction. Safety precautions. For your safety. For the safety of the apparatus
 Please do not remove this manual from from the lab. It is available at www.cm.ph.bham.ac.uk/y2lab Optics Introduction Optical fibres are widely used for transmitting data at high speeds. In this experiment,
Raman spectroscopy Lecture
 Raman spectroscopy Lecture Licentiate course in measurement science and technology Spring 2008 10.04.2008 Antti Kivioja Contents - Introduction - What is Raman spectroscopy? - The theory of Raman spectroscopy
Chem 131A: Absorbance of Riboflavin
 Chem 131A: Absorbance of Riboflavin Purpose: The purpose of this experiment is to: 1) Familiarize the student with the use of the HP 8452 diode array spectrophotometer, 2) examine the limitations of the
EXPERIMENT 5. Molecular Absorption Spectroscopy: Determination of Iron With 1,10-Phenanthroline
 EXPERIMENT 5 Molecular Absorption Spectroscopy: Determination of Iron With 1,10-Phenanthroline UNKNOWN Submit a clean, labeled 100-mL volumetric flask to the instructor so that your unknown iron solution
Lecture 3: Fibre Optics
 Lecture 3: Fibre Optics Lecture aims to explain: 1. Fibre applications in telecommunications 2. Principle of operation 3. Single- and multi-mode fibres 4. Light losses in fibres Fibre is a transparent
Quantifying Bacterial Concentration using a Calibrated Growth Curve
 BTEC 4200 Lab 2. Quantifying Bacterial Concentration using a Calibrated Growth Curve Background and References Bacterial concentration can be measured by several methods, all of which you have studied
Scanning Near Field Optical Microscopy: Principle, Instrumentation and Applications
 Scanning Near Field Optical Microscopy: Principle, Instrumentation and Applications Saulius Marcinkevičius Optics, ICT, KTH 1 Outline Optical near field. Principle of scanning near field optical microscope
Suppression of Four Wave Mixing in 8 Channel DWDM System Using Hybrid Modulation Technique
 International Journal of Electronic and Electrical Engineering. ISSN 0974-2174, Volume 7, Number 2 (2014), pp. 97-108 International Research Publication House http://www.irphouse.com Suppression of Four
Lab #11: Determination of a Chemical Equilibrium Constant
 Lab #11: Determination of a Chemical Equilibrium Constant Objectives: 1. Determine the equilibrium constant of the formation of the thiocyanatoiron (III) ions. 2. Understand the application of using a
Related concepts Kohlrausch s law, equivalent conductivity, temperature dependence of conductivity, Ostwald s dilution law.
 Conductivity of strong and weak electrolytes TEC Related concepts Kohlrausch s law, equivalent conductivity, temperature dependence of conductivity, Ostwald s dilution law. Principle It is possible to
Problem Set 6 UV-Vis Absorption Spectroscopy. 13-1. Express the following absorbances in terms of percent transmittance:
 Problem Set 6 UV-Vis Absorption Spectroscopy 13-1. Express the following absorbances in terms of percent transmittance: a 0.051 b 0.918 c 0.379 d 0.261 e 0.485 f 0.072 A = log P o /P = log1/t = - log T
The Conversion Technology Experts. Fiber Optics Basics
 The Conversion Technology Experts Fiber Optics Basics Introduction Fiber optic technology is simply the use of light to transmit data. The general use of fiber optics did not begin until the 1970s. Robert
Symmetric Stretch: allows molecule to move through space
 BACKGROUND INFORMATION Infrared Spectroscopy Before introducing the subject of IR spectroscopy, we must first review some aspects of the electromagnetic spectrum. The electromagnetic spectrum is composed
Lab Exercise 3: Media, incubation, and aseptic technique
 Lab Exercise 3: Media, incubation, and aseptic technique Objectives 1. Compare the different types of media. 2. Describe the different formats of media, plate, tube etc. 3. Explain how to sterilize it,
Reaction Stoichiometry and the Formation of a Metal Ion Complex
 Reaction Stoichiometry and the Formation of a Metal Ion Complex Objectives The objectives of this laboratory are as follows: To use the method of continuous variation to determine the reaction stoichiometry
5. Scanning Near-Field Optical Microscopy 5.1. Resolution of conventional optical microscopy
 5. Scanning Near-Field Optical Microscopy 5.1. Resolution of conventional optical microscopy Resolution of optical microscope is limited by diffraction. Light going through an aperture makes diffraction
Bandwidth analysis of multimode fiber passive optical networks (PONs)
") Optica Applicata, Vol. XXXIX, No. 2, 2009 Bandwidth analysis of multimode fiber passive optical networks (PONs) GRZEGORZ STEPNIAK *, LUKASZ MAKSYMIUK, JERZY SIUZDAK Institute of Telecommunications, Warsaw
Optica Applicata, Vol. XXXIX, No. 2, 2009 Bandwidth analysis of multimode fiber passive optical networks (PONs) GRZEGORZ STEPNIAK *, LUKASZ MAKSYMIUK, JERZY SIUZDAK Institute of Telecommunications, Warsaw
Raman Spectroscopy Basics
 Raman Spectroscopy Basics Introduction Raman spectroscopy is a spectroscopic technique based on inelastic scattering of monochromatic light, usually from a laser source. Inelastic scattering means that
A Guide to Acousto-Optic Modulators
 A Guide to Acousto-Optic Modulators D. J. McCarron December 7, 2007 1 Introduction Acousto-optic modulators (AOMs) are useful devices which allow the frequency, intensity and direction of a laser beam
UV/VIS/IR SPECTROSCOPY ANALYSIS OF NANOPARTICLES
 UV/VIS/IR SPECTROSCOPY ANALYSIS OF NANOPARTICLES SEPTEMBER 2012, V 1.1 4878 RONSON CT STE K SAN DIEGO, CA 92111 858-565 - 4227 NANOCOMPOSIX.COM Note to the Reader: We at nanocomposix have published this
AMPLIFIED HIGH SPEED FIBER PHOTODETECTOR USER S GUIDE
 AMPLIFIED HIGH SPEED FIBER PHOTODETECTOR USER S GUIDE Thank you for purchasing your Amplified High Speed Fiber Photodetector. This user s guide will help answer any questions you may have regarding the
Spectroscopy. Biogeochemical Methods OCN 633. Rebecca Briggs
 Spectroscopy Biogeochemical Methods OCN 633 Rebecca Briggs Definitions of Spectrometry Defined by the method used to prepare the sample 1. Optical spectrometry Elements are converted to gaseous atoms or
Christine E. Hatch University of Nevada, Reno
 Christine E. Hatch University of Nevada, Reno Roadmap What is DTS? How Does it Work? What Can DTS Measure? Applications What is Distributed Temperature Sensing (DTS)? Temperature measurement using only
Lab 5: Quantitative Analysis- Phosphates in Water By: A Generous Student. LBS 171L Section 9 TA: Dana October 27, 2005
 How uch Phosphate is the Body Being Exposed to During a Lifetime by Showering? Lab 5: Quantitative Analysis- Phosphates in Water By: A Generous Student LBS 171L Section 9 TA: Dana October 7, 005 [Note:
Fiber Optics: Engineering from Global to Nanometer Dimensions
 Fiber Optics: Engineering from Global to Nanometer Dimensions Prof. Craig Armiento Fall 2003 1 Optical Fiber Communications What is it? Transmission of information using light over an optical fiber Why
PHOTOELECTRIC EFFECT AND DUAL NATURE OF MATTER AND RADIATIONS
 PHOTOELECTRIC EFFECT AND DUAL NATURE OF MATTER AND RADIATIONS 1. Photons 2. Photoelectric Effect 3. Experimental Set-up to study Photoelectric Effect 4. Effect of Intensity, Frequency, Potential on P.E.
ATOMIC ABSORTION SPECTROSCOPY: rev. 4/2011 ANALYSIS OF COPPER IN FOOD AND VITAMINS
 1 ATOMIC ABSORTION SPECTROSCOPY: rev. 4/2011 ANALYSIS OF COPPER IN FOOD AND VITAMINS Buck Scientific Atomic Absorption Spectrophotometer, Model 200 Atomic absorption spectroscopy (AAS) has for many years
Experiment C-31 Color Absorption
 1 Experiment C-31 Color Absorption Objectives To understand the concepts of light waves and color. To investigate how red, green and blue liquids absorb light of different wavelengths. To learn about colorimeter
Katharina Lückerath (AG Dr. Martin Zörnig) adapted from Dr. Jörg Hildmann BD Biosciences,Customer Service
 adapted from Dr. Jörg Hildmann BD Biosciences,Customer Service") Introduction into Flow Cytometry Katharina Lückerath (AG Dr. Martin Zörnig) adapted from Dr. Jörg Hildmann BD Biosciences,Customer Service How does a FACS look like? FACSCalibur FACScan What is Flow Cytometry?
Introduction into Flow Cytometry Katharina Lückerath (AG Dr. Martin Zörnig) adapted from Dr. Jörg Hildmann BD Biosciences,Customer Service How does a FACS look like? FACSCalibur FACScan What is Flow Cytometry?
Shielding Ourselves from Ultraviolet Light
 Shielding Ourselves from Ultraviolet Light Introduction The purpose of this experiment is to examine the effect of passing ultraviolet (UV) light through a variety of materials to determine how well each
2 Absorbing Solar Energy
 2 Absorbing Solar Energy 2.1 Air Mass and the Solar Spectrum Now that we have introduced the solar cell, it is time to introduce the source of the energy the sun. The sun has many properties that could
Molecular Spectroscopy
 Molecular Spectroscopy UV-Vis Spectroscopy Absorption Characteristics of Some Common Chromophores UV-Vis Spectroscopy Absorption Characteristics of Aromatic Compounds UV-Vis Spectroscopy Effect of extended
OPTICAL FIBERS INTRODUCTION
 OPTICAL FIBERS References: J. Hecht: Understanding Fiber Optics, Ch. 1-3, Prentice Hall N.J. 1999 D. R. Goff: Fiber Optic Reference Guide (2 nd ed.) Focal Press 1999 Projects in Fiber Optics (Applications
ANALYSIS OF ASPIRIN INFRARED (IR) SPECTROSCOPY AND MELTING POINT DETERMINATION
 SPECTROSCOPY AND MELTING POINT DETERMINATION") Chem 306 Section (Circle) M Tu W Th Name Partners Date ANALYSIS OF ASPIRIN INFRARED (IR) SPECTROSCOPY AND MELTING POINT DETERMINATION Materials: prepared acetylsalicylic acid (aspirin), stockroom samples
Chem 306 Section (Circle) M Tu W Th Name Partners Date ANALYSIS OF ASPIRIN INFRARED (IR) SPECTROSCOPY AND MELTING POINT DETERMINATION Materials: prepared acetylsalicylic acid (aspirin), stockroom samples
Encoders for Linear Motors in the Electronics Industry
 Technical Information Encoders for Linear Motors in the Electronics Industry The semiconductor industry and automation technology increasingly require more precise and faster machines in order to satisfy
Master Degree Program
 SAINT PETERSBURG STATE ELECTROTECHNICAL UNIVERSITY LETI Laser Measurement and Navigation Systems department Master Degree Program ETU LETI TRADITIONS AND INNOVATIONS ETU LETI is the oldest Electrotechnical
Advancements in High Frequency, High Resolution Acoustic Micro Imaging for Thin Silicon Applications
 Advancements in High Frequency, High Resolution Acoustic Micro Imaging for Thin Silicon Applications Janet E. Semmens Sonoscan, Inc. 2149 E. Pratt Boulevard Elk Grove Village, IL 60007 USA Phone: (847)
Specifying Plasma Deposited Hard Coated Optical Thin Film Filters. Alluxa Engineering Staff
 Specifying Plasma Deposited Hard Coated Optical Thin Film Filters. Alluxa Engineering Staff December 2012 Specifying Advanced Plasma Deposited Hard Coated Optical Bandpass and Dichroic Filters. Introduction
Chemistry 111 Lab: Intro to Spectrophotometry Page E-1
 Chemistry 111 Lab: Intro to Spectrophotometry Page E-1 SPECTROPHOTOMETRY Absorption Measurements & their Application to Quantitative Analysis study of the interaction of light (or other electromagnetic
Determination of Molecular Structure by MOLECULAR SPECTROSCOPY
 Determination of Molecular Structure by MOLEULAR SPETROSOPY hemistry 3 B.Z. Shakhashiri Fall 29 Much of what we know about molecular structure has been learned by observing and analyzing how electromagnetic
Various Technics of Liquids and Solids Level Measurements. (Part 3)
") (Part 3) In part one of this series of articles, level measurement using a floating system was discusses and the instruments were recommended for each application. In the second part of these articles,
(Part 3) In part one of this series of articles, level measurement using a floating system was discusses and the instruments were recommended for each application. In the second part of these articles,
5.33 Lecture Notes: Introduction to Spectroscopy
 5.33 Lecture Notes: ntroduction to Spectroscopy What is spectroscopy? Studying the properties of matter through its interaction with different frequency components of the electromagnetic spectrum. Latin:
Beer's Law: Colorimetry of Copper(II) Solutions
 Solutions") Exercise 11 Page 1 Illinois Central College CHEMISTRY 130 Name: Beer's Law: Colorimetry of Copper(II) Solutions Objectives In this experiment, we will use Beer's Law to determine the unknown concentrations
Exercise 11 Page 1 Illinois Central College CHEMISTRY 130 Name: Beer's Law: Colorimetry of Copper(II) Solutions Objectives In this experiment, we will use Beer's Law to determine the unknown concentrations
Infrared Spectroscopy: Theory
 u Chapter 15 Infrared Spectroscopy: Theory An important tool of the organic chemist is Infrared Spectroscopy, or IR. IR spectra are acquired on a special instrument, called an IR spectrometer. IR is used
Indiana's Academic Standards 2010 ICP Indiana's Academic Standards 2016 ICP. map) that describe the relationship acceleration, velocity and distance.
 that describe the relationship acceleration, velocity and distance.") .1.1 Measure the motion of objects to understand.1.1 Develop graphical, the relationships among distance, velocity and mathematical, and pictorial acceleration. Develop deeper understanding through representations
.1.1 Measure the motion of objects to understand.1.1 Develop graphical, the relationships among distance, velocity and mathematical, and pictorial acceleration. Develop deeper understanding through representations
Improved predictive modeling of white LEDs with accurate luminescence simulation and practical inputs
 Improved predictive modeling of white LEDs with accurate luminescence simulation and practical inputs TracePro Opto-Mechanical Design Software s Fluorescence Property Utility TracePro s Fluorescence Property
Waves Sound and Light
 Waves Sound and Light r2 c:\files\courses\1710\spr12\wavetrans.doc Ron Robertson The Nature of Waves Waves are a type of energy transmission that results from a periodic disturbance (vibration). They are
Fiber optic communication
 Fiber optic communication Fiber optic communication Outline Introduction Properties of single- and multi-mode fiber Optical fiber manufacture Optical network concepts Robert R. McLeod, University of Colorado
E190Q Lecture 5 Autonomous Robot Navigation
 E190Q Lecture 5 Autonomous Robot Navigation Instructor: Chris Clark Semester: Spring 2014 1 Figures courtesy of Siegwart & Nourbakhsh Control Structures Planning Based Control Prior Knowledge Operator
A Beer s Law Experiment
 A Beer s Law Experiment Introduction There are many ways to determine concentrations of a substance in solution. So far, the only experiences you may have are acid-base titrations or possibly determining
Catalase. ***You will be working with hot water, acids and bases in this laboratory*** ****Use Extreme Caution!!!****
 AP BIOLOGY BIOCHEMISTRY ACTIVITY #9 NAME DATE HOUR CATALASE LAB INTRODUCTION Hydrogen peroxide (H 2 O 2 ) is a poisonous byproduct of metabolism that can damage cells if it is not removed. Catalase is
Reaction of Blue Food Dye with Bleach
 Exercise 2 Reaction of Blue Food Dye with Bleach 2 Introduction In the experiment, you will study the rate of the reaction of FD&C Blue #1 (Blue #1 is denoted by E number E133 in food stuff) with sodium
CPI Links Content Guide & Five Items Resource
 CPI Links Content Guide & Five Items Resource Introduction The following information should be used as a companion to the CPI Links. It provides clarifications concerning the content and skills contained
Experiment 13H THE REACTION OF RED FOOD COLOR WITH BLEACH 1
 Experiment 13H FV 1/25/2011(2-run) THE REACTION OF RED FOOD COLOR WITH BLEACH 1 PROBLEM: Determine the rate law for the chemical reaction between FD&C Red Dye #3 and sodium hypochlorite. LEARNING OBJECTIVES:
The Determination of an Equilibrium Constant
 The Determination of an Equilibrium Constant Computer 10 Chemical reactions occur to reach a state of equilibrium. The equilibrium state can be characterized by quantitatively defining its equilibrium
where h = 6.62 10-34 J s
 Electromagnetic Spectrum: Refer to Figure 12.1 Molecular Spectroscopy: Absorption of electromagnetic radiation: The absorptions and emissions of electromagnetic radiation are related molecular-level phenomena
Laboratory 5: Properties of Enzymes
 Laboratory 5: Properties of Enzymes Technical Objectives 1. Accurately measure and transfer solutions with pipettes 2. Use a Spectrophotometer to study enzyme action. 3. Properly graph a set of data. Knowledge
Preview of Period 3: Electromagnetic Waves Radiant Energy II
 Preview of Period 3: Electromagnetic Waves Radiant Energy II 3.1 Radiant Energy from the Sun How is light reflected and transmitted? What is polarized light? 3.2 Energy Transfer with Radiant Energy How
TOPIC 5 (cont.) RADIATION LAWS - Part 2
 RADIATION LAWS - Part 2") TOPIC 5 (cont.) RADIATION LAWS - Part 2 Quick review ELECTROMAGNETIC SPECTRUM Our focus in this class is on: UV VIS lr = micrometers (aka microns) = nanometers (also commonly used) Q1. The first thing
TOPIC 5 (cont.) RADIATION LAWS - Part 2 Quick review ELECTROMAGNETIC SPECTRUM Our focus in this class is on: UV VIS lr = micrometers (aka microns) = nanometers (also commonly used) Q1. The first thing
Rice University Laser Safety Manual
 Rice University Laser Safety Manual Environmental Health and Safety MS 123 P.O. Box 1892 Houston, TX 77251-1892 December 2012 RICE UNIVERSITY 1 Introduction This manual is intended to provide the basic
Spherical Beam Volume Holograms Recorded in Reflection Geometry for Diffuse Source Spectroscopy
 Spherical Beam Volume Holograms Recorded in Reflection Geometry for Diffuse Source Spectroscopy Sundeep Jolly A Proposal Presented to the Academic Faculty in Partial Fulfillment of the Requirements for
EE4367 Telecom. Switching & Transmission. Prof. Murat Torlak
 FIBER OPTIC COMMUNICATIONS Optical Fibers Fiber optics (optical fibers) are long, thin strands of very pure glass about the size of a human hair. They are arranged in bundles called optical cables and
Colorimetric Determination of Iron in Vitamin Tablets
 Cautions: 6 M hydrochloric acid is corrosive. Purpose: To colorimetrically determine the mass of iron present in commercial vitamin tablets using a prepared calibration curve. Introduction: Iron is considered
Optical Communications
 Optical Communications Telecommunication Engineering School of Engineering University of Rome La Sapienza Rome, Italy 2005-2006 Lecture #2, May 2 2006 The Optical Communication System BLOCK DIAGRAM OF
Numerical Analysis of Perforated Microring Resonator Based Refractive Index Sensor
 Numerical Analysis of Perforated Microring Resonator Based Refractive Index Sensor M. Gabalis *1, D. Urbonas 1, and R. Petruškevičius 1 1 Institute of Physics of Center for Physical Sciences and Technology,
Introduction to Fourier Transform Infrared Spectrometry
 Introduction to Fourier Transform Infrared Spectrometry What is FT-IR? I N T R O D U C T I O N FT-IR stands for Fourier Transform InfraRed, the preferred method of infrared spectroscopy. In infrared spectroscopy,
D.S. Boyd School of Earth Sciences and Geography, Kingston University, U.K.
 PHYSICAL BASIS OF REMOTE SENSING D.S. Boyd School of Earth Sciences and Geography, Kingston University, U.K. Keywords: Remote sensing, electromagnetic radiation, wavelengths, target, atmosphere, sensor,
Chemistry 321, Experiment 8: Quantitation of caffeine from a beverage using gas chromatography
 Chemistry 321, Experiment 8: Quantitation of caffeine from a beverage using gas chromatography INTRODUCTION The analysis of soft drinks for caffeine was able to be performed using UV-Vis. The complex sample
Infrared Spectroscopy 紅 外 線 光 譜 儀
 Infrared Spectroscopy 紅 外 線 光 譜 儀 Introduction Spectroscopy is an analytical technique which helps determine structure. It destroys little or no sample (nondestructive method). The amount of light absorbed
SINGLEMODE OR MULTIMODE FIBER OPTIC PATCHCORDS
 Features: SINGLEMODE OR MULTIMODE FIBER OPTIC PATCHCORDS Low insertion loss < 0.2 db Excellent repeatability FC/PC, SC, ST, LC, MU, E2000 termination available Custom ferrule termination available Designed
Sunny 1, Rinku Garg 2 Department of Electronics and Communication Engg. GJUS&T Hissar, India
 Performance Analysis of Optical CDMA System Using W/T Codes Sunny 1, Rinku Garg 2 Department of Electronics and Communication Engg. GJUS&T Hissar, India Abstract This paper represents the performance of