MCA Data Discoveries
|
|
|
- Gervase Justin Robbins
- 8 years ago
- Views:
Transcription
1 MCA Data Discoveries

2 What does Minnesota think is important? What do we want kids to do? Pass important tests Be Proficient Grow in their knowledge Growth Have equal opportunity to learn Close the Achievement Gap Graduate from high school Graduation Minnesota believes each of the above things are equally important so

3
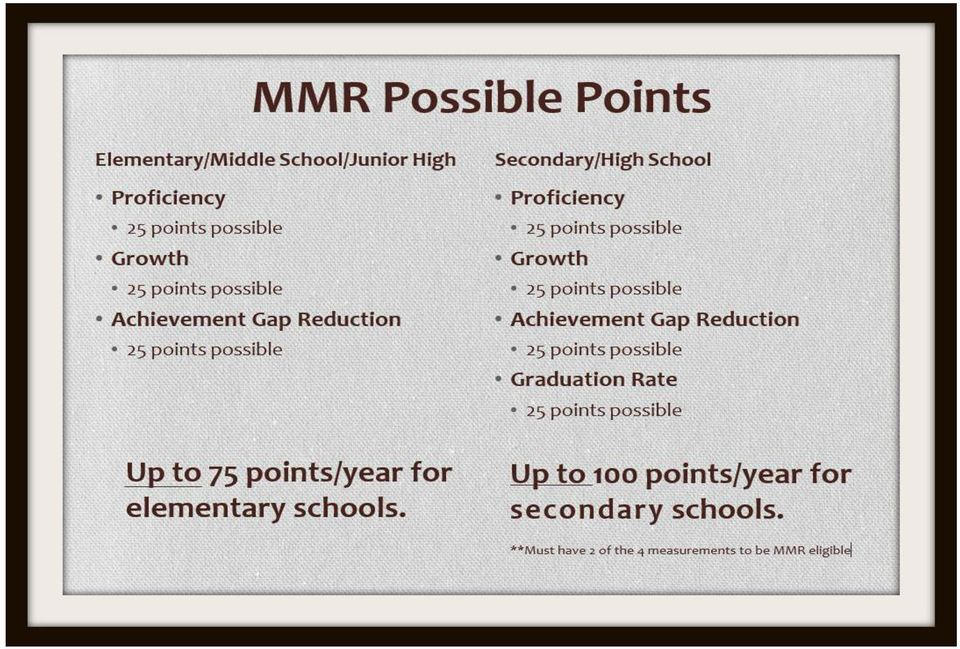
4 Because each of these things are equally important, they should be treated that way Pieces of the MMR Pie for High Schools Proficiency Growth Achievement Gap Graduation

5 Elementary and Middle Schools don t graduate students so for them the pie looks like this Pieces of the MMR Pie for Elementary and Junior High Schools Proficiency Growth Achievement Gap

6 Focus Rating Consists of: Focused Proficiency Achievement Gap Reduction

7 Title I schools can fall into 5 groups based on MMR and FR Reward Schools: These schools are the top 15 percent of Title I schools based on the MMR. They represent the highest-performing schools on the four domains in the MMR. Celebration Eligible: These are the 25 percent of schools directly below the Reward school cutoff. These schools may apply to be Celebration schools, and MDE selects approximately 10 percent of Title I schools to receive the Celebration school recognition. Continuous Improvement: These are the bottom 25 percent of Title I schools that have not already been identified as Priority or Focus. Continuous Improvement schools must work with their districts to create and implement improvement plans as well as set aside 20 percent of Title I funds to support school improvement efforts. Focus: All Minnesota schools receive a Focus Rating (FR) that measures their contribution to the state s achievement gap. The 10 percent of Title I schools with the lowest FR are identified as Focus Schools. Focus schools are required to set aside 20 percent of Title I funds to support school improvement efforts. These schools are identified every three years. Some Focus schools are identified for persistent low graduation rates. These are schools with a six-year graduation rate, averaged over three years, below 60 percent. This separate group of low graduation rate Priority: These are the 5 percent most persistently low-performing Title I schools based on the MMR. Priority schools are required to set aside 20 percent of Title I funds to support turnaround efforts, and these schools are also identified every three years.

8

9 District Demographics subgroup State District American Indian 2.4%.3% Asian 7.2% 2.6% Hispanic 8.4% 3.4% Black 11.5%.8% White 70.5% 93% English Learners 8.3% 0% Special Education 14.9% 10.3% Free/Reduced Price Lunch 38.3% 42.8%

10 subgroup Elementary Demographics State Elementar y American Indian 2.4%.8% Asian 7.2% 2.3% Hispanic 8.4% 3% Black 11.5% 0% White 70.5% 94% English Learners 8.3% 0% Special Education 14.9% 15% Free/Reduced Price Lunch 38.3% 52.6%

11 Secondary Demographics subgroup State Elementar y American Indian 2.4% 0% Asian 7.2% 2.7% Hispanic 8.4% 3.5% Black 11.5% 1.2% White 70.5% 92.5% English Learners 8.3% 0% Special Education 14.9% 7.8% Free/Reduced Price Lunch 38.3% 37.6%

12

13 Reading Attention: First year assessed on the reading mca-iii 2013 for 3 rd -8 th grades & 10 th grade


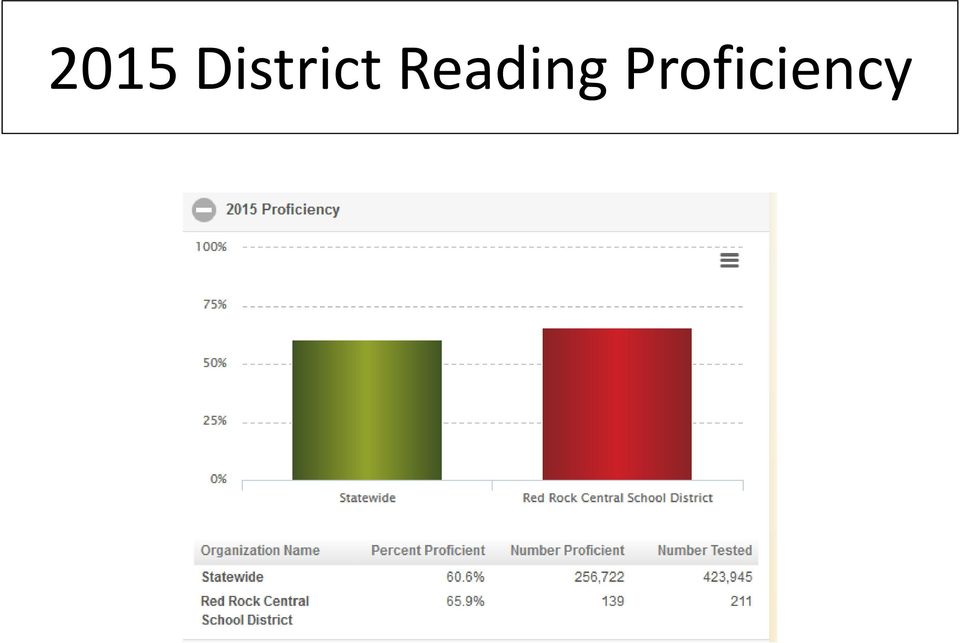
14 2015 District Reading Proficiency

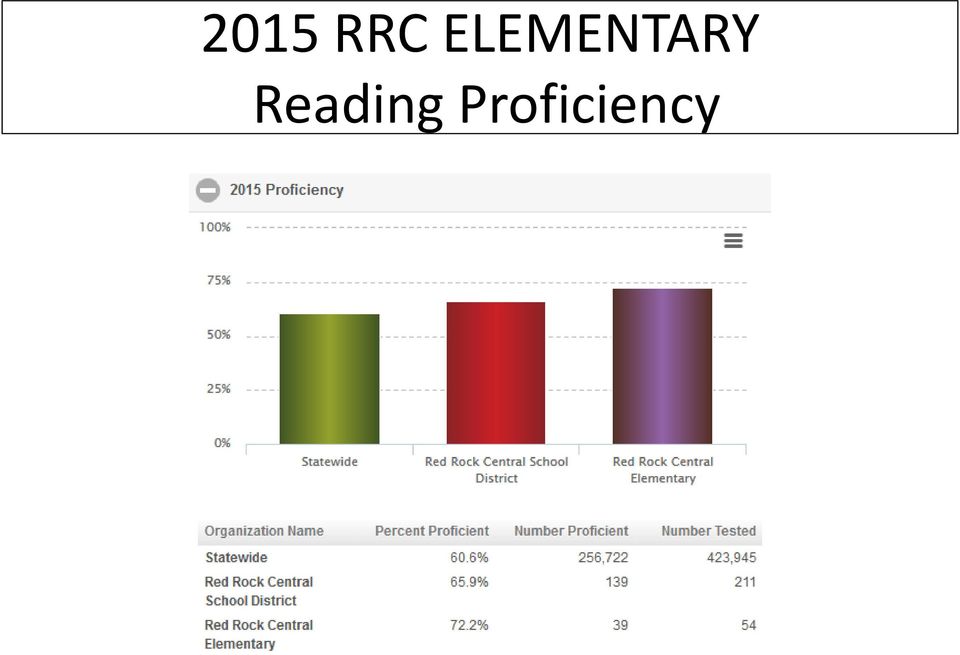
15 2015 RRC ELEMENTARY Reading Proficiency
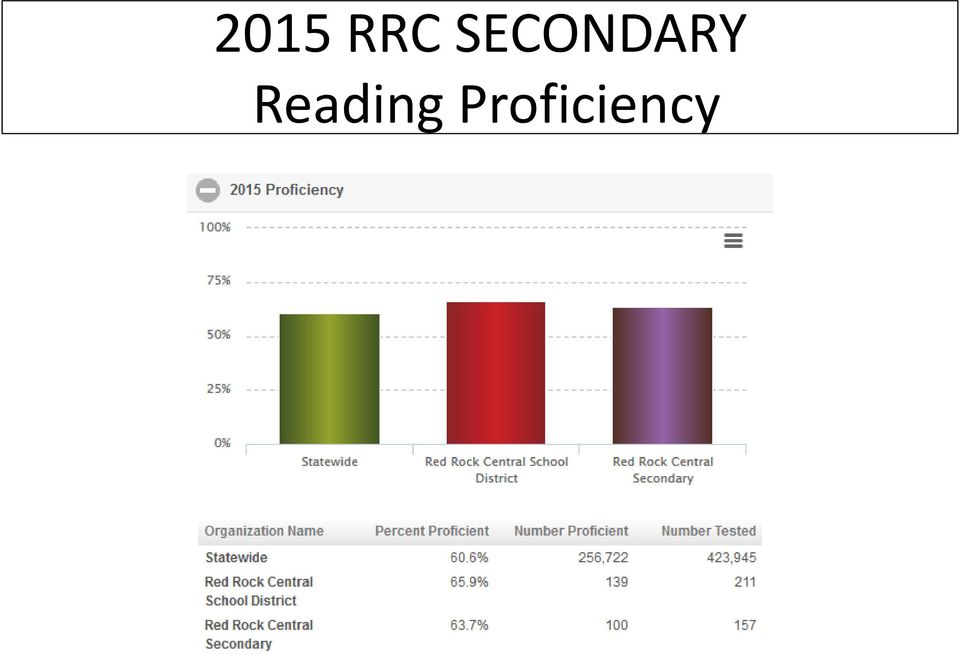
16 2015 RRC SECONDARY Reading Proficiency
17 District Reading Proficiency Trends

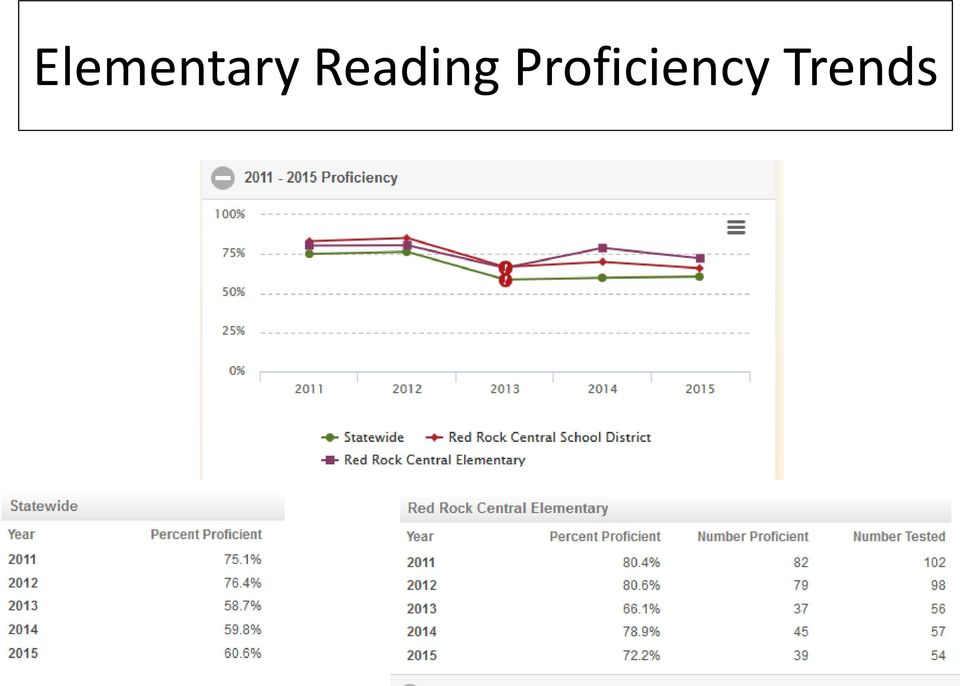
18 Elementary Reading Proficiency Trends
19 Secondary/High School Reading Proficiency Trends

20 Examining Data - D.I.E. Protocol D: Describe I: Interpret E: Evaluate

21 Subgroup Reading Proficiency Data Looking at your demographics, is there a subgroup that makes up a significant part of your student population?
22 RRC DISTRICT VS STATEWIDE SpEd Trend Data
23 RRC DISTRICT VS STATEWIDE SpEd Trend Data
24 RRC ELEMENTARY VS STATEWIDE SpEd Trend Data
25 RRC SECONDARY VS STATEWIDE SpEd Trend Data
26 RRC DISTRICT SpEd vs. Non-SpEd Trend Data
27 RRC ELEMENTARY SpEd vs. Non-SpEd Trend Data
28 RRC SECONDARY SpEd vs. Non-SpEd Trend Data
29 RRC DISTRICT FRP vs. non-frp Trend Data
30 RRC ELEMENTARY FRP vs. non-frp Trend Data
31 RRC SECONDARY FRP vs. non-frp Trend Data
32 RRC DISTRICT VS STATEWIDE FRP TREND DATE
33 RRC ELEMENTARY VS STATEWIDE FRP TREND DATE
34 RRC SECONDARY VS STATEWIDE FRP TREND DATE
35 Examining Data - D.I.E. Protocol D: Describe I: Interpret E: Evaluate
36 Level Proficiency Trend Data Helps Identify: Possible gaps in instructional practices Possible gaps in curriculum and resources
37 Cohort Proficiency Trend Data Helps Identify: Possible gaps in student learning Possible instructional gaps
38 Axis Title Cohort follows the same group of students from year to year Class of 2017 Cohort Reading Trend Data 8th 10th District State
39 Axis Title Add Cohort trend data slides if you wish Cohort follows the same group of students from year to year Class of 2018 Cohort Reading Trend Data 7th 8th 10th District State
40 Axis Title Add Cohort trend data slides if you wish Cohort follows the same group of students from year to year Class of 2019 Cohort Reading Trend Data 6th 7th 8th 10th District State
41 Axis Title Add Cohort trend data slides if you wish Cohort follows the same group of students from year to year Class of 2020 Cohort Reading Trend Data 5th 6th 7th 8th 10th District State
42 Axis Title Add Cohort trend data slides if you wish Cohort follows the same group of students from year to year % 90.00% 80.00% 70.00% 60.00% 50.00% 40.00% 30.00% 20.00% 10.00% 0.00% Class of 2021 Cohort Reading Trend Data 4th 5th 6th 7th 8th 10th District State
43 Axis Title Add Cohort trend data slides if you wish Cohort follows the same group of students from year to year % 90.00% 80.00% 70.00% 60.00% 50.00% 40.00% 30.00% 20.00% 10.00% 0.00% Class of 2022 Cohort Reading Trend Data 3rd 4th 5th 6th 7th 8th 10th District State
44 Axis Title Add Cohort trend data slides if you wish Cohort follows the same group of students from year to year % 90.00% 80.00% 70.00% 60.00% 50.00% 40.00% 30.00% 20.00% 10.00% 0.00% Class of 2023 Cohort Reading Trend Data 3rd 4th 5th 6th 7th 8th 10th District State
45 Axis Title Add Cohort trend data slides if you wish Cohort follows the same group of students from year to year % Class of 2024 Cohort Reading Trend Data 90.00% 80.00% 70.00% 60.00% 50.00% 40.00% 30.00% 20.00% 10.00% 0.00% 3rd 4th 5th 6th 7th 8th 10th District State
46 Axis Title Add Cohort trend data slides if you wish Cohort follows the same group of students from year to year rd Class of Cohort Reading Trend Data 4th 5th 6th 7th 8th 10th District State
47 3 rd Reading Proficiency Trend Data
48 4th Reading Proficiency Trend Data
49 5th Reading Proficiency Trend Data
50 6th Reading Proficiency Trend Data
51 7th Reading Proficiency Trend Data
52 8th Reading Proficiency Trend Data
53 10th Reading Proficiency Trend Data
54 MCA Reading Strand Data Literature 4 Inf Text rd 4th 5th 6th 7th 8th 10th
55 MCA Reading Strand Data Literature 4 Inf Text rd 4th 5th 6th 7th 8th 10th
56 MCA Reading Strand Data Literature 4 Inf Text rd 4th 5th 6th 7th 8th 10th
57 MCA Reading Strand Data Literature Inf Text rd 4th 5th 6th 7th 8th 10th
58 Examining Data - D.I.E. Protocol D: Describe I: Interpret E: Evaluate
59 District Wide Action Plan Complete: Current Curriculum and Instruction Data for Reading Reading Action Plan
60
61 Math Attention: First year assessed on the math mca-iii 2011 for 3 rd -8 th grades 2014 for 11 th

62 District Math Proficiency
63 RRC ELEMENTARY Math Proficiency

64 RRC SECONDARY Math Proficiency
65 District Math Proficiency Trends
66 Elementary Math Proficiency Trends
67 Secondary/High School Math Proficiency Trends
68 Examining Data - D.I.E. Protocol D: Describe I: Interpret E: Evaluate
69 Subgroup Math Proficiency Data Looking at your demographics, is there a subgroup that makes up a significant part of your student population?
70 SpEd vs. Non-SpEd Trend Data
71 RRC ELEMENTARY SpEd vs. Non-SpEd Trend Data
72 RRC SECONDARY SpEd vs. Non-SpEd Trend Data
73 RRC DISTRICT VS STATEWIDE SPED TREND DATA
74 RRC ELEMENTARY VS STATEWIDE SPED TREND DATA
75 RRC SECONDARY VS STATEWIDE SPED TREND DATA
76 RRC DISTRICT VS STATEWIDE FRP Trend Data
77 RRC ELEMENTARY VS STATEWIDE FRP Trend Data
78 RRC SECONDARY VS STATEWIDE FRP Trend Data
79 FRP vs. non-frp Trend Data
80 RRC ELEMENTARY FRP vs. non-frp Trend Data
81 RRC SECONDARY FRP vs. non-frp Trend Data
82 Examining Data - D.I.E. Protocol D: Describe I: Interpret E: Evaluate
83 Level Proficiency Trend Data Helps Identify: Possible gaps in instructional practices Possible gaps in curriculum and resources
84 Cohort Proficiency Trend Data Helps Identify: Possible gaps in student learning Possible instructional gaps
85 Axis Title Add Cohort trend data slides if you wish Cohort follows the same group of students from year to year % 90.00% 80.00% 70.00% 60.00% 50.00% 40.00% 30.00% 20.00% 10.00% 0.00% Class of _2016 Cohort Math Trend Data 3rd grade 4th grade 5th grade 6th grade 7th 8th 11th District State
86 Axis Title Add Cohort trend data slides if you wish Cohort follows the same group of students from year to year % 90.00% 80.00% 70.00% 60.00% 50.00% 40.00% 30.00% 20.00% 10.00% 0.00% Class of _2017 Cohort Math Trend Data 3rd grade 4th grade 5th grade 6th grade 7th 8th 11th District State
87 Axis Title Add Cohort trend data slides if you wish Cohort follows the same group of students from year to year % 90.00% 80.00% 70.00% 60.00% 50.00% 40.00% 30.00% 20.00% 10.00% 0.00% Class of _2018 Cohort Math Trend Data 3rd grade 4th grade 5th grade 6th grade 7th 8th 11th District State
88 Axis Title Add Cohort trend data slides if you wish Cohort follows the same group of students from year to year % 90.00% 80.00% 70.00% 60.00% 50.00% 40.00% 30.00% 20.00% 10.00% 0.00% Class of _2019 Cohort Math Trend Data 3rd grade 4th grade 5th grade 6th grade 7th 8th 11th District State
89 Axis Title Add Cohort trend data slides if you wish Cohort follows the same group of students from year to year % 90.00% 80.00% 70.00% 60.00% 50.00% 40.00% 30.00% 20.00% 10.00% 0.00% Class of _2020 Cohort Math Trend Data 3rd grade 4th grade 5th grade 6th grade 7th 8th 11th District State
90 Axis Title Add Cohort trend data slides if you wish Cohort follows the same group of students from year to year % 90.00% 80.00% 70.00% 60.00% 50.00% 40.00% 30.00% 20.00% 10.00% 0.00% Class of _2021 Cohort Math Trend Data 3rd grade 4th grade 5th grade 6th grade 7th 8th 11th District State
91 Axis Title Add Cohort trend data slides if you wish Cohort follows the same group of students from year to year % 90.00% 80.00% 70.00% 60.00% 50.00% 40.00% 30.00% 20.00% 10.00% 0.00% Class of _2022 Cohort Math Trend Data 3rd grade 4th grade 5th grade 6th grade 7th 8th 11th District State
92 Axis Title Add Cohort trend data slides if you wish Cohort follows the same group of students from year to year % 90.00% 80.00% 70.00% 60.00% 50.00% 40.00% 30.00% 20.00% 10.00% 0.00% Class of _2023 Cohort Math Trend Data 3rd grade 4th grade 5th grade 6th grade 7th 8th 11th District State
93 Axis Title Add Cohort trend data slides if you wish Cohort follows the same group of students from year to year % 90.00% 80.00% 70.00% 60.00% 50.00% 40.00% 30.00% 20.00% 10.00% 0.00% Class of _2024 Cohort Math Trend Data 3rd grade 4th grade 5th grade 6th grade 7th 8th 11th District State
94 Axis Title Add Cohort trend data slides if you wish Cohort follows the same group of students from year to year % 90.00% 80.00% 70.00% 60.00% 50.00% 40.00% 30.00% 20.00% 10.00% 0.00% Class of _2025 Cohort Math Trend Data 3rd grade 4th grade 5th grade 6th grade 7th 8th 11th District State
95 3 rd Math Proficiency Trend Data
96 4th Math Proficiency Trend Data
97 5th Math Proficiency Trend Data
98 6th Math Proficiency Trend Data
99 7th Math Proficiency Trend Data
100 8th Math Proficiency Trend Data
101 11th Math Proficiency Trend Data
102 MCA Math Strand Data Number & Operation Algebra Geometry & Measurem ent rd 4th 5th 6th 7th 8th 11th Data Analysis
103 Examining Data - D.I.E. Protocol D: Describe I: Interpret E: Evaluate

104 District Science Proficiency
105 RRC 5 th grade Science Proficiency

106 RRC 8 th grade Science Proficiency
107 RRC 10 th grade Science Proficiency
108 District Science Proficiency Trends
109 5 th grade Science Proficiency Trends
110 8 th grade Science Proficiency Trends
111 10 th grade Science Proficiency Trends
112 District Wide Action Plan Complete: Current Curriculum and Instruction Data for Reading Reading Action Plan
113 Graduation Rate Report The 2014 Graduation Rate is used for calculation on the 2015 MMR. This is because 2015 Graduation Rates will not be released until February/March 2016 & the 2015 MMR is calculated in August/September 2015.
114 Graduation Trend Data Year % Students Graduated % % % % % State goal is that all districts have 90% graduation rate by 2017, with no sub-group less than 85%.
115 Testing in Districts need to hold ACT contract directly with ACT deadline is AUGUST 14 Testing limits s 1 6 max 10 hrs s 7 12 max 11 hrs State required tests are not to be included in this Writing Assessment TBD HS Graduation requirements no GRAD ACCESS available online
116 Next steps Exit Ticket: Please share out how you plan to utilize information from today and how you will share with the rest of your staff
2012-2013. Annual Report on Curriculum Instruction and Student. Achievement
 2012-2013 Annual Report on Curriculum Instruction and Student Achievement 2012-2013 A MESSAGE FROM SUPERINTENDENT PACE Our 2012-2013 Annual Report on Curriculum, Instruction and Student Achievement is
Minnesota s New Accountability System. Leading for educational excellence and equity. Every day for every one.
 Minnesota s New Accountability System Leading for educational excellence and equity. Every day for every one. What Stays the Same? Academic Standards Assessments Public Reporting Calculating AYP Disaggregating
Technical Assistance Response 1
 Technical Assistance Response Date: March 23, 2015 To: From: Re: Michigan Department of Education Bersheril Bailey, State Manager, and Beverly Mattson, Ph.D., contributing author, Great Lakes Comprehensive
WORLD S BEST WORKFORCE PLAN
 WORLD S BEST WORKFORCE PLAN ANNUAL REPORT 2014 2015 School Year South Early Learning Center, North Intermediate, Saint Peter Middle/High School 1 Saint Peter Public Schools World s Best Workforce Report
2012-2013 Annual Report on Curriculum, Instruction, and Student Achievement
 2012-2013 Annual Report on Curriculum, Instruction, and Student Achievement Chokio-Alberta Schools, ISD #771 School districts annually publish an Annual Report on Curriculum, Instruction, and Student Achievement.
ANNUAL REPORT ON CURRICULUM, INSTRUCTION AND STUDENT ACHIEVEMENT
 The mission of the Greenbush-Middle River School is to provide a quality education which will prepare all students to meet success by developing self-directed thinkers and communicators who are responsible,
Annual Report on Curriculum, Instruction, and Student Achievement Independent School District 700, Hermantown Community Schools
 Annual Report on Curriculum, Instruction, and Student Achievement Independent School District 700, Hermantown Community Schools Information for the constituents of the Hermantown School District of curriculum,
EXPEDITIONARY LEARNING SCHOOL PERFORMANCE. www.elschools.org! Expeditionary Learning 2010
 EXPEDITIONARY LEARNING SCHOOL PERFORMANCE REPORT www.elschools.org Expeditionary Learning 2010 www.elschools.org Expeditionary Learning 2010 A National Network Impact in 2009-2010 165 Schools 29 States
Allen Elementary School
 Allen Elementary School April 4, 216 Dear Parents and Community Members: We are pleased to present you with the (AER), which provides key information on the 214-15 educational progress for the. The AER
South Dakota DOE 2014-2015 Report Card
 Performance Indicators School Performance Index District Classification: - Exemplary Schools 1 / 24 Schools 4.17% Status Schools 1 / 24 Schools 4.17% Progressing Schools 19 / 24 Schools * No bar will display
District #2358 Tri-County Schools
 District #2358 Tri-County Schools 2013-2014 World s Best Workforce Report Summary In accordance with 2013 Minnesota Statutes, section 120B.11, a school board, at a public meeting, shall adopt a comprehensive,
Texas Education Agency 2014 15 Federal Report Card for Texas Public Schools
 Part I: Student Achievement by Proficiency Level Texas Education Agency 2014 15 Federal Report Card for Texas Public Schools Campus Name: AIKIN EL Campus ID: 057916135 District Name: RICHARDSON ISD This
State of New Jersey 2014-15
 Page 1 of 22 OVERVIEW COUNTY VOCATIONAL GRADE SPAN 0912 1.00 313995050 WAYNE, NJ 074702210 The New Jersey Department of Education (NJDOE) is pleased to present these annual reports of Performance. These
State of New Jersey 2012-13 41-5460-050 OVERVIEW WARREN COUNTY VOCATIONAL TECHNICAL SCHOOL WARREN 1500 ROUTE 57 WARREN COUNTY VOCATIONAL
 1 415465 OVERVIEW TECHNICAL SCHOOL 15 ROUTE 57 GRADE SPAN 912 WASHINGTON, NEW JERSEY 78829618 1. This school's academic performance is high when compared to schools across the state. Additionally, its
South Dakota DOE 2013-2014 Report Card
 School Classification: Focus Title I Designation: Schoolwide Performance Indicators * No bar will display at the school or district level if the subgroup does not meet minimum size for reporting purposes.
Louisiana Special Education Guidance
 Louisiana Special Education Guidance This document outlines how special education policies impact students with disabilities and serves as a reference guide for LEA administrators and high school staff
Fulda Independent School District 505
 Fulda Independent School District 505 Local World s Best Workforce Plan The World s Best Workforce Plan (state statute, section 120B.11) is a comprehensive, long-term strategic plan to support and improve
DRAFT. Denver Plan 2014. Every Child Succeeds
 Denver Plan 2014 Every Child Succeeds 100 80 Introduction Every child takes that first step into their first day of school with butterflies and talent, potential and dreams. It s the day that the door
State of New Jersey 2012-13
 1 OVERVIEW GRADE SPAN 912 395262 SCOTCH PLAINS, NEW JERSEY 776 1. This school's academic performance is very high when compared to schools across the state. Additionally, its academic performance is very
SCHOOL PROGRESS INDEX Data Release
 1 SCHOOL PROGRESS INDEX Data Release Office of Achievement and Accountability BALTIMORE CITY PUBLIC SCHOOLS What is the School Progress Index? 2 The School Progress Index (SPI) is the measure Maryland
The Impact of Bilingual Education on English Language Acquisition Rates for English Language Learners, Including Exceptionalities. Dr.
 The Impact of Bilingual Education on English Language Acquisition Rates for English Language Learners, Including Exceptionalities Dr. Jennifer Dixon Statement on Labels and Acronyms 1. I believe that each
CPM High Schools California Standards Test (CST) Results for 2004-2010
 Results for 2004-2010") CPM High California Standards Test (CST) Results for 2004-2010 The tables below show a comparison between CPM high schools and all high schools in California based on the percentage of students who scored
CPM High California Standards Test (CST) Results for 2004-2010 The tables below show a comparison between CPM high schools and all high schools in California based on the percentage of students who scored
P-20 in Action Michigan s Focus on Career and College Ready Students: Student Success through Collaborative Efforts Pk-20
 P-20 in Action Michigan s Focus on Career and College Ready Students: Student Success through Collaborative Efforts Pk-20 Michigan Community College Association Student Success Applied Research Symposium
2015-2016 SCHOOL YEAR
 2015-2016 SCHOOL YEAR Virginia s accountability system supports teaching and learning by setting rigorous academic standards known as the Standards of Learning (SOL) and through annual assessments of student
SCHOOL IMPROVEMENT GRANT (SIG) PRACTICE:
 PRACTICE:") SCHOOL IMPROVEMENT GRANT (SIG) PRACTICE: BUILDING DISTRICT CAPACITY THROUGH TECHNICAL ASSISTANCE VIRGINIA DEPARTMENT OF EDUCATION Recognizing that the causes of low student achievement in a state s lowest
SCHOOL IMPROVEMENT GRANT (SIG) PRACTICE: BUILDING DISTRICT CAPACITY THROUGH TECHNICAL ASSISTANCE VIRGINIA DEPARTMENT OF EDUCATION Recognizing that the causes of low student achievement in a state s lowest
College and Career Readiness: Access to Advanced Coursework prior to Graduation
 College and Career Readiness: Access to Advanced Coursework prior to Graduation 1 There are multiple domains of college and career readiness. Defines the academic knowledge and skills students need to
For Immediate Release: Thursday, July 19, 2012 Contact: Jim Polites 860.713.6525
 For Immediate Release: Thursday, July 19, 2012 Contact: Jim Polites 860.713.6525 2012 CMT, CAPT RESULTS SHOW SOME INCREASES, WHILE GAPS IN ACHIEVEMENT PERSIST The Connecticut State Department of Education
Frequently Asked Questions
 1. What are academic standards? Minnesota s K-12 Academic Standards Frequently Asked Questions The Minnesota K-12 Academic Standards are the statewide expectations for student achievement in K-12 public
JUST THE FACTS. Memphis, Tennessee
 JUST THE FACTS Memphis, Tennessee The Institute for a Competitive Workforce (ICW) is a nonprofit, nonpartisan, 501(c)(3) affiliate of the U.S. Chamber of Commerce. ICW promotes the rigorous educational
Readiness Matters The Impact of College Readiness on College Persistence and Degree Completion
 Readiness Matters The Impact of College Readiness on College Persistence and Degree Completion Steve Kappler AVP Career & College Readiness ACT, Inc. steve.kappler@act.org NACAC Webinar Series February
BOSTON PUBLIC SCHOOLS Academics. Network B: Geography
 Network B: Geography 1 Network B at a glance There are 16 schools in Network B 2 - Early learning centers 8 - K-5 schools 4 - K-8 schools K-8 1 - Middle school (6-8) 1 - Specialized SWD School Of these:
State of New Jersey 2013-14
 1 OVERVIEW 21314 GRADE SPAN 912 31411 15 PARK AVENUE PATERSON, NJ 751 1. This school's academic performance significantly lags in comparison to schools across the state. Additionally, its academic performance
St. Paul Children s Collabora4ve. Youth Master Plan Data Update 2014
 St. Paul Children s Collabora4ve Youth Master Plan Data Update 2014 SIX GOALS Learn: Children are ready for Kindergarten Children are reading by third grade Grow: Children have health care coverage Children
New Jersey High School Performance Ranking - A Summary
 1 OVERVIEW This school's academic performance significantly lags in comparison to schools across the state. Additionally, its academic performance lags in comparison to its peers. This school's college
How To Improve Your School Performance
 1. Data Component New per 2013 Amendment Name of : Moore MS Address of : 1221 Lawrenceville Highway Lawrenceville, GA 30046 GaDOE Code: Designated Contact Person: Name Lamont Mays Title Principal Telephone
2013-2014 SCHOOL YEAR
 2013-2014 SCHOOL YEAR Virginia s accountability system supports teaching and learning by setting rigorous academic standards known as the Standards of Learning (SOL) and through annual assessments of student
Michigan School Accountability Scorecards Business Rules
 Michigan School Accountability Scorecards Business Rules Contents Overview... 2 Scorecard Display... 2 Scorecard Components... 3 Color Status... 3 School Label... 3 Participation and Proficiency... 3 Graduation
2009 CREDO Center for Research on Education Outcomes (CREDO) Stanford University Stanford, CA http://credo.stanford.edu June 2009
 Stanford University Stanford, CA http://credo.stanford.edu June 2009") Technical Appendix 2009 CREDO Center for Research on Education Outcomes (CREDO) Stanford University Stanford, CA http://credo.stanford.edu June 2009 CREDO gratefully acknowledges the support of the State
Technical Appendix 2009 CREDO Center for Research on Education Outcomes (CREDO) Stanford University Stanford, CA http://credo.stanford.edu June 2009 CREDO gratefully acknowledges the support of the State
Advanced Program Information The percentage of students enrolled in advanced programs is a key indicator of school quality at the secondary level.
 Virginia Department of Education P.O. Box 2120, Richmond, VA 23218 Superintendent: Dr. Steven R. Staples 1-800-292-3820 The is committed to providing a quality education for all students. The Virginia
Connecticut College and Career Readiness Toolkit Supplemental Data Central High School
 Connecticut College and Career Readiness Toolkit Supplemental Data Central High School Prepared by the Educational Policy Improvement Center on behalf of the Connecticut P-20 Council Preface This packet
Top-to-Bottom (TTB) Ranking 2014-2015
 Ranking 2014-2015") Top-to-Bottom (TTB) Ranking 2014-2015 UNDERSTANDING HOW THE RANKING IS CALCULATED Introduction Presentation Roadmap What changed vs what stayed the same Brief z-score refresher Top-to-Bottom (TTB) ranking
Top-to-Bottom (TTB) Ranking 2014-2015 UNDERSTANDING HOW THE RANKING IS CALCULATED Introduction Presentation Roadmap What changed vs what stayed the same Brief z-score refresher Top-to-Bottom (TTB) ranking
Alabama State Board of Education PLAN 2020
 Alabama State Board of Education PLAN 2020 Our Vision Every Child a Graduate Every Graduate Prepared for College/Work/Adulthood in the 21 st Century Prepared Graduate Defined Possesses the knowledge and
School Performance Framework: Technical Guide
 School Performance Framework: Technical Guide Version 1.6 August 2010 This technical guide provides information about the following topics as they related to interpreting the school performance framework
Bangor Central Elementary School 2014-2015 Annual Education Report
 Bangor Central Elementary School 24-25 Melissa Vrable; Principal March 23, 26 Dear Parents and Community Members: We are pleased to present you with the (AER) which provides key information on the 24 5
Latinos in Massachusetts Public Schools: Holyoke
 University of Massachusetts Boston ScholarWorks at UMass Boston Gastón Institute Publications Gastón Institute for Community Development and Public Policy Publications 3-2015 s in Massachusetts Public
2015 TN Accountability Protocol
 SAS EVAAS 2015 TN Accountability Protocol 06/09/2015 2015 TN Accountability Protocol Contents 1 Document Intent...4 2 Accountability Background...4 2.1 Accountability Subjects... 4 2.2 Accountability Subgroups...
State of New Jersey 2012-13
 1 OVERVIEW Graduation and PostSecondary 18 27 1% Very High Performance is defined as being equal to or above the 8th percentile. High Performance is defined as being between the 6th and 79.9th percentiles.
Performance of Online and Nononline Schools as Measured by the School Performance Frameworks. Marie Huchton Colorado Department of Education
 Performance of Online and Nononline Schools as Measured by the School Performance Frameworks Marie Huchton Colorado Department of Education December 16, 2014 Purposes of the SPF For all districts and schools,
Orange County High 201 Selma Road, Orange, VA 22960
 State Accreditation Results for All Students This table summarizes the data used in calculating the state accreditation status of the school and is reported for the "all students" group. Proficiency Gap
ANNUAL REPORT ON CURRICULUM INSTRUCTION AND STUDENT ACHIEVEMENT. ADA-BORUP PUBLIC SCHOOLS District #2854. School year 2012-13 Report - October 2013
 ANNUAL REPORT ON CURRICULUM INSTRUCTION AND STUDENT ACHIEVEMENT ADA-BORUP PUBLIC SCHOOLS District #2854 School year 2012-13 Report - October 2013 Mike Kolness approved on October 8, 2013 Ada-Borup Schools
Preliminary Analysis of D.C. Public Schools Reading and Math Scores By the Council of the Great City Schools
 Preliminary Analysis of D.C. Public Schools Reading and Math Scores By the Council of the Great City Schools July 3, 13 Highlights of Preliminary Analysis of D.C. Schools Reading and Math Scores By the
2013-2014 School Accountability Report
 of the Arts Clark County School District 315 S. 7th St. Scott M. Walker, Principal, NV 89101 Grade Levels: 9-12 Ph: 702-799-7800, Fax: 702-799-7948 Website: www.lasvegasacademy.net 2013-2014 School Accountability
Please read this carefully prior to submitting your application.
 GUIDE TO BECOMING A MATH CORPS SITE 2015-16 This document contains information administrators should know in considering becoming a Math Corps site for the 2015-16 school year. Please read this carefully
SCHOOL IMPROVEMENT GRANT (SIG) PRACTICE:
 PRACTICE:") SCHOOL IMPROVEMENT GRANT (SIG) PRACTICE: TURNAROUND LEADERSHIP ASPIRING LEADERS PIPELINE MIAMI-DADE COUNTY PUBLIC SCHOOLS MIAMI, FLORIDA In response to a critical shortage of leaders to support school
SCHOOL IMPROVEMENT GRANT (SIG) PRACTICE: TURNAROUND LEADERSHIP ASPIRING LEADERS PIPELINE MIAMI-DADE COUNTY PUBLIC SCHOOLS MIAMI, FLORIDA In response to a critical shortage of leaders to support school
JUST THE FACTS. New Mexico
 JUST THE FACTS New Mexico The Institute for a Competitive Workforce (ICW) is a nonprofit, nonpartisan, 501(c)(3) affiliate of the U.S. Chamber of Commerce. ICW promotes the rigorous educational standards
College and career readiness
 College and career readiness A review and analysis conducted for Generation Next A P R I L 2 0 1 3 Prepared by: Dan Mueller and Edith Gozali-Lee 451 Lexington Parkway North Saint Paul, Minnesota 55104
WEST OTTAWA PUBLIC SCHOOLS
 WEST OTTAWA PUBLIC SCHOOLS EAT LAKES ELEMENTARY SCHOOL 3200 N. 152 nd Ave. Holland, MI 49424 (616) 738-6300 Fax (616) 738-6391 Safety Hotline (616) 738-5750 www.westottawa.net August 15, Dear Parents and
State of New Jersey 2012-13
 OVERVIEW SWEDESBOROWOOLWICH 21213 GRADE SPAN 6 Student Growth 83 85 1% Very High Performance is defined as being equal to or above the 8th percentile. High Performance is defined as being between the 6th
Eden Prairie Schools (District #272) Annual Report on Curriculum, Instruction, and Student Achievement
 Annual Report on Curriculum, Instruction, and Student Achievement") Eden Prairie Schools (District #272) Annual Report on Curriculum, Instruction, and Student Achievement Student Achievement Goals for Meeting State Academic Standards Reading and Mathematics Goals: We will
Eden Prairie Schools (District #272) Annual Report on Curriculum, Instruction, and Student Achievement Student Achievement Goals for Meeting State Academic Standards Reading and Mathematics Goals: We will
Arizona AYP Terms. Arizona AMOs. Math AMO (percent passing) Reading AMO
 Reading AMO") Arizona AYP Terms Annual Measurable Objectives (AMOs) In accordance with the No Child Left Behind Act of 2001, the Arizona Department of Education (ADE) has established the following intermediate goals:
Arizona AYP Terms Annual Measurable Objectives (AMOs) In accordance with the No Child Left Behind Act of 2001, the Arizona Department of Education (ADE) has established the following intermediate goals:
Frequently Asked Questions Contact us: RAC@doe.state.nj.us
 Frequently Asked Questions Contact us: RAC@doe.state.nj.us 1 P a g e Contents Identification of a Priority, Focus, or Reward School... 4 Is a list of all Priority, Focus, and Reward Schools available to
State of New Jersey 2012-13
 1 OVERVIEW GRADE SPAN 912 2152151 TRENTON CENTRAL HIGH SCHOOL WEST CAMPUS 11 WEST STATE ST TRENTON, NEW JERSEY 8618 1. This school's academic performance lags in comparison to schools across the state.
Characteristics of Colorado s Online Students
 Characteristics of Colorado s Online Students By: Amanda Heiney, Dianne Lefly and Amy Anderson October 2012 Office of Online & Blended Learning 201 E. Colfax Ave., Denver, CO 80203 Phone: 303-866-6897
Advanced Analytics Leading to New Insights into College Readiness in Fort Worth ISD
 Advanced Analytics Leading to New Insights into College Readiness in Fort Worth ISD Texas Association of School Administrators Summer Conference June 27, 2011 The Challenge A variety of data tell us that
State of New Jersey 2013-14 31-4010-002 OVERVIEW SCHOOL OF CULINARY ARTS HOSPITALITY AND TOURI PASSAIC 150 PARK AVENUE PATERSON CITY
 1 31412 OVERVIEW 15 PARK AVENUE GRADE SPAN 912 PATERSON, NJ 751 1. This school's academic performance significantly lags in comparison to schools across the state. Additionally, its academic performance
Achievement of Children Identified with Special Needs in Two-way Spanish/English Immersion Programs
 The Bridge: From Research to Practice Achievement of Children Identified with Special Needs in Two-way Spanish/English Immersion Programs Dr. Marjorie L. Myers, Principal, Key School - Escuela Key, Arlington,
State of New Jersey 2014-15
 Page 1 of 2 OVERVIEW PK5 1. 7199 The New Jersey Department of Education (NJDOE) is pleased to present these annual reports of Performance. These reports are designed to inform parents, educators and communities
Successful RtI Selection and Implementation Practices
 Successful RtI Selection and Implementation Practices Dr. Lawrence D. Tihen Executive Director of Curriculum and Staff Development Maria Callis Schneider Secondary Reading Coordinator Virginia Department
Participation and pass rates for college preparatory transition courses in Kentucky
 U.S. Department of Education March 2014 Participation and pass rates for college preparatory transition courses in Kentucky Christine Mokher CNA Key findings This study of Kentucky students who take college
Are ALL children receiving a high-quality education in Ardmore, Oklahoma? Not yet.
 Are ALL children receiving a high-quality education in Ardmore, Oklahoma? Not yet. Despite a relatively high graduation rate, too many students are not graduating from Ardmore Public Schools ready for
RELATIONSHIP BETWEEN THE PATTERN OF MATHEMATICS AND SCIENCE COURSES TAKEN AND TEST SCORES ON ITED FOR HIGH SCHOOL JUNIORS
 RELATIONSHIP BETWEEN THE PATTERN OF AND COURSES TAKEN AND TEST SCORES ON FOR HIGH SCHOOL JUNIORS Xiaoping Wang, Administrative Consultant Abstract Three years of student-level data were used in this study
State of New Jersey 2012-13 31-4010-002 OVERVIEW SCHOOL OF CULINARY ARTS HOSPITALITY & TOURISM PASSAIC 150 PARK AVENUE PATERSON CITY
 1 31412 OVERVIEW 15 PARK AVENUE GRADE SPAN 912 PATERSON, NEW JERSEY 751 1. This school's academic performance significantly lags in comparison to schools across the state. Additionally, its academic performance
ILLINOIS SCHOOL REPORT CARD
 5-8-9-6- MASCOUTAH ELEM SCHOOL MASCOUTAH C U DISTRICT 9 MASCOUTAH, ILLINOIS GRADES : PK K 5 6 MASCOUTAH ELEM SCHOOL ILLINOIS SCHOOL REPORT CARD and federal laws require public school districts to release
Approval of Revised Michigan School Accreditation and Accountability System (MI-SAAS)
") RICK SNYDER GOVERNOR STATE OF MICHIGAN DEPARTMENT OF EDUCATION LANSING MICHAEL P. FLANAGAN SUPERINTENDENT OF PUBLIC INSTRUCTION MEMORANDUM TO: FROM: State Board of Education Mike Flanagan, Chairman DATE:
RICK SNYDER GOVERNOR STATE OF MICHIGAN DEPARTMENT OF EDUCATION LANSING MICHAEL P. FLANAGAN SUPERINTENDENT OF PUBLIC INSTRUCTION MEMORANDUM TO: FROM: State Board of Education Mike Flanagan, Chairman DATE:
High School Graduation and the No Child Left Behind Act
 Connecticut The Policy Context High School Graduation and the No Child Left Behind Act The federal No Child Left Behind Act (NCLB), enacted in 2002, holds states and the schools under their jurisdictions
Methodology, business rules, and data components used in the implementation of the Washington State Equity Plan, 2015
 Methodology, business rules, and data components used in the implementation of the Washington State Equity Plan, 2015 Table of Contents I Table of Contents 1 II Objective and Overview of 2013 14 school
San Diego Unified School District California
 San Diego Unified School District California PAGE DATA 2 Background Information 3 Trends in Overall Reading, Mathematics, and Science Proficiency READING 4 Reading Performance and Improvement at the Proficient
Transitioning English Language Learners in Massachusetts: An Exploratory Data Review. March 2012
 Transitioning English Language Learners in Massachusetts: An Exploratory Data Review March 2012 i This document was prepared by the Massachusetts Department of Elementary and Secondary Education Mitchell
2012-2013 Annual Report on Curriculum, Instruction and Student Achievement
 Office of Teaching and Learning Randy Smasal, Director 952-848-4001 www.edina.k12.mn.us 2012-2013 Annual Report on Curriculum, Instruction and Student Achievement The Minnesota Department of Education
PENNSYLVANIA SCHOOL PERFORMANCE PROFILE Frequently Asked Questions
 PENNSYLVANIA SCHOOL PERFORMANCE PROFILE Frequently Asked Questions Introduction The Pennsylvania School Performance Profile (SPP) is an integral part of the Educator Effectiveness System (teacher and principal
Top-to-Bottom Ranking, Priority, Focus and Rewards Schools Identification Business Rules. Overview
 Top-to-Bottom Ranking, Priority, Focus and Rewards Schools Identification Business Rules Overview Top-to-Bottom Ranking: List of schools and ranked by their performance. The ranking is based on student
RESOURCES. What is provided in this packet? TTB Individual School. Lookup Tools. Worksheet. Worksheet
 RESOURCES accountability system used by Michigan educators in response to the accountability, and ensure that all students are on track to graduate career- and college-ready. TTB Individual School Lookup
Peck Full Service Community School Improvement Plan 2014 2015 Principal: Justin Cotton Jr.
 Peck Full Service Community School Improvement Plan 2014 2015 Principal: Justin Cotton Jr. Theory of Action for Peck school In the spirit of the Theory of Action for the Holyoke Public Schools district,
West Seattle Elementary A School in Transformation. Leveraging adaptive technology to close the math achievement gap.
 West Seattle Elementary A School in Transformation Leveraging adaptive technology to close the math achievement gap. Presenters Host: Casey Davidson Director of Product Marketing Presenter: Vicki Sacco
School Levels of Support. By Dr. Kristine Harms
 School Levels of Support By Dr. Kristine Harms By definition : A priority school is a school whose overall score on the School Performance Index is at/or below the 5 th percentile. The total number of
Texas Education Agency 2013-14 Federal Report Card for Texas Public Schools State
 Texas Education Agency 2013-14 Federal Report Card for Texas Public Schools State Part I: Percent Tested and Student Achievement by Proficiency Level This section provides the State of Texas Assessments
WHAT IT MEANS TO BE A FOCUS DISTRICT OR SCHOOL
 WHAT IT MEANS TO BE A FOCUS DISTRICT OR SCHOOL Details from Regulation 703 KAR 5:225 on FOCUS Districts and Schools I. DEFINITIONS Focus Schools: 1) Schools that have a non-duplicated student gap group*
South Dakota s Growth Model. From Student Growth Percentiles to School Accountability Scores
 South Dakota s Growth Model From Student Growth Percentiles to School Accountability Scores Background History Points Contact How did South Dakota arrive at an Academic Growth model? Background History
Understanding Ohio s New Local Report Card System
 Achievement Performance Indicators Performance Index The Performance Indicators show how many students have a minimum, or proficient, level of knowledge. These indicators are not new to Ohio students or
YES Prep Public Schools
 The Broad Prize for Public Charter Schools 2012 Winner Profile: YES Prep Public Schools June 21, 2012 National Charter Schools Conference Minneapolis, Minn. Winner of the Inaugural Broad Prize for Public
REPORT CARD THE STATE OF SOUTH CAROLINA ANNUAL SCHOOL. Airport High School 1315 Boston Avenue West Columbia, SC 29170 RATINGS OVER 5-YEAR PERIOD YEAR
 Airport High School 1315 Boston Avenue West Columbia, SC 29170 Grades 9-12 High School Enrollment 1,330 Students Principal Dr. Dixon Brooks 803-822-5600 Superintendent Dr. Venus J. Holland 803-796-4708
FEDERAL ROLE IN EDUCATION
 FEDERAL ROLE IN EDUCATION KEY ISSUES The majority of decisions on public education are made at the state and local levels, but the federal government does contribute resources to North Carolina s public
Oklahoma City Public Schools Oklahoma
 Oklahoma City Public Schools Oklahoma PAGE DATA 2 Background Information 3 Trends in Overall Reading, Mathematics, and Science Proficiency READING 4 Reading Performance and Improvement at the Proficient
2014-2015 School Accountability Report
 Northwest Career and Technical Academy Clark County School District 8200 W. Tropical Parkway Kimberly S. Mangino, Principal Las Vegas, NV 89149 Grade Levels: 9-12 Ph: 702-799-4640, Fax: 702-799-4644 Website:
CHARTER SCHOOL PERFORMANCE IN PENNSYLVANIA. credo.stanford.edu
 CHARTER SCHOOL PERFORMANCE IN PENNSYLVANIA credo.stanford.edu April 2011 TABLE OF CONTENTS INTRODUCTION... 3 DISTRIBUTION OF CHARTER SCHOOL PERFORMANCE IN PENNSYLVANIA... 7 CHARTER SCHOOL IMPACT BY DELIVERY
2012 13 Academic Performance Index Reports
 2012 13 Accountability Progress Reporting System 2012 13 Academic Performance Index Reports Information Guide May 2013 Prepared by the California Department of Education Available online at: http://www.cde.ca.gov/ta/ac/ap/
K12 Virtual Academies February 4, 2014
 K12 Virtual Academies February 4, 2014 2 Map of enrollment 3 K12 Profile Provide curriculum and administrative services to 48 full time online partner schools in 38 states and 5 blended, or flex, sites
YEAR 3 REPORT: EVOLUTION OF PERFORMANCE MANAGEMENT ALBANY NY CHARTER SCHOO CHARTER SCHOOL PERFORMANCE IN NEW YORK CITY. credo.stanford.
 YEAR 3 REPORT: EVOLUTION OF PERFORMANCE MANAGEMENT CHARTER SCHOOL PERFORMANCE IN NEW YORK CITY IN credo.stanford.edu ALBANY NY CHARTER SCHOO January 2010 SUMMARY This report supplements the CREDO National
A Matched Study of Washington State 10th Grade Assessment Scores of Students in Schools Using The Core-Plus Mathematics Program
 A ed Study of Washington State 10th Grade Assessment Scores of Students in Schools Using The Core-Plus Mathematics Program By Reggie Nelson Mathematics Department Chair Burlington-Edison School District
2014 LOUISIANA TEACHER PREPARATION PROGRAM FACT BOOK. Prepared by the Louisiana Board of Regents
 2014 LOUISIANA TEACHER PREPARATION PROGRAM FACT BOOK Prepared by the Louisiana Board of Regents Updated November 13, 2014 Table of Contents Introduction 3 Current and Future Data. 4 Listing of Teacher