Transitioning English Language Learners in Massachusetts: An Exploratory Data Review. March 2012
|
|
|
- Pearl Jackson
- 10 years ago
- Views:
Transcription
1 Transitioning English Language Learners in Massachusetts: An Exploratory Data Review March 2012 i

2 This document was prepared by the Massachusetts Department of Elementary and Secondary Education Mitchell D. Chester, Ed.D. Commissioner The Massachusetts Department of Elementary and Secondary Education, an affirmative action employer, is committed to ensuring that all of its programs and facilities are accessible to all members of the public. We do not discriminate on the basis of age, color, disability, national origin, race, religion, sex or sexual orientation. Inquiries regarding the Department s compliance with Title IX and other civil rights laws may be directed to the Human Resources Director, 75 Pleasant St., Malden, MA Massachusetts Department of Elementary and Secondary Education Permission is hereby granted to copy for non-commercial educational purposes any or all parts of this document. Please credit the Massachusetts Department of Elementary and Secondary Education. Massachusetts Department of Elementary and Secondary Education 75 Pleasant Street, Malden, MA Phone TTY: N.E.T. Relay i

3 Foreword The Department of Elementary and Secondary Education commissioned this paper to explore several questions about students who are English language learners (ELL) in Massachusetts: For how many years is a typical ELL student in Massachusetts classified as limited English proficient (LEP)? How much variation is there in the number of years it takes to exit a student from ELL services and LEP status, and does this suggest different policies and practices at the district level? How do formerly LEP students perform on MCAS tests relative to the number of years they were classified as LEP, and do they perform better if they exited LEP status relatively sooner than later? How predictive are MEPA scores in determining when ELL students transition out of LEP status? The following paper reviews the data that bear on these questions to help identify successful approaches for transitioning ELL students out of LEP status and into the general education program. The Department thanks Charles DePascale of the National Center for the Improvement of Educational Assessment for undertaking this work and presenting his findings. i

4 Contents Foreword... i Executive Summary... iv Introduction... 1 Exploratory Data Review... 2 Data Sources... 2 SIMS file... 2 MCAS files... 3 MEPA files... 3 Transition... 3 I. Who Are the English Language Learners?... 5 Grade Level... 5 Race/Ethnicity... 6 Low Income Status... 8 Students with Disabilities... 8 Initial Grade Level as LEP... 9 School Districts II. How Long are Students Classified as Limited English Proficient? Transition Rate Transitioning by Grade Level Transitioning by Subgroup of Years Classified as LEP of Years to Transitioning of Years and Transition Rate by District III. Is there a Relationship between MCAS Performance and Transitioning? MCAS Performance and Transitioning District Level MCAS Performance Individual District Results ii

5 IV. Do Students Benefit from Early Transition? ELL Students in the School Year Grade Level of Transition and MCAS Performance Years to Transition and MCAS Performance District Rate of Transition and MCAS Performance V. Transitioning and Performance on MEPA MEPA Sample of students included in the analysis Students Matched on MEPA and SIMS Years in Massachusetts Schools Race/Ethnicity MEPA Performance and Transitioning MEPA and Transitioning Appendix I A Appendix I B Appendix II A Appendix III A Appendix IV A Appendix V A: Matching of Students in the MEPA and Core SIMS file Students classified as LEP in SIMS file but not found in MEPA file Students participating in MEPA but not in the SIMS file Appendix V B iii

6 Executive Summary Between 2002 and 2011 the English language learner (ELL) population in Massachusetts grew from approximately 49,000 to approximately 71,000 students. This has increased the percentage of ELL students in Massachusetts schools from 4.7 percent to 7.1 percent over the same time period. The purpose of this paper is to gather and analyze information about the state s ELL population to help determine the best way to transition students out of ELL services. Following is a summary of the results presented in the five sections of the paper. Section I describes the ELL population in Massachusetts, looking at categories such as grade level, lowincome status, race/ethnicity, and disability status. It also provides an overview of which districts ELL students are enrolled in. Nearly 50 percent of ELL students are enrolled in grades PK 3. The number of ELL students decreases steadily from grades 1 to 12 except for a single spike in enrollment at grade 9. The largest racial category for ELL students was White (55 percent), followed by Black (21 percent) and Asian (18 percent). Ethnically, 56 percent of ELL students were identified as Hispanic. In 2011, 79 percent of ELL students were classified as low income, and 15 percent of ELL students were classified as students with disabilities. The majority of ELL students (51 percent) are enrolled in just five districts: Boston (23 percent), Worcester (11 percent), Lowell (7 percent), Springfield (5 percent), and Lawrence (5 percent). Five other districts (Brockton, Lynn, Holyoke, Framingham, and Quincy) have over 1,000 ELL students. Section II addresses how long, on average, ELL students have been classified as limited English proficient (LEP). It also analyzes how many years students are classified as LEP before they transition out of LEP status, and at what grade level they are transitioning. In 2011, the average number of years that an ELL student had been classified as LEP was 3.5. The middle 50 percent had been classified as LEP between 2 and 5 years. Between grades 4 and 12, the mean number of years ranged from 4.1 (at grade 4) to 4.8 (at grade 8). Transition rates across grade levels ranged from 10 percent at grade 1 to 23 percent at grade 5. The highest rates of transition are seen between grades 4 and 8, and then transition rates decline throughout the high school grades. For students who transitioned in 2011, the average number of years classified as LEP was 3.7 compared to 4.0 for students who did not transition. From 2010 to 2011, districts with fewer than 30 LEP students had an overall transition rate of 34 percent. Districts with between 30 and 99 LEP students had an overall transition rate of 25 percent, and those with 100 or more LEP students had an overall transition rate of 14 percent. Section III examines the relationship between MCAS performance and transitioning, looking at 2010 and 2011 MCAS results to compare transitioned students with non transitioned students. The metric used for comparison was the percentage of students scoring Proficient or Advanced. In 2010 transitioned, or formerly LEP (FLEP), students scored 33 percentage points better than non transitioned students in English language arts (50 percent vs. 17 percent) and 22 percentage points better in mathematics (44 percent vs. 22 percent). iv

7 In 2011, FLEP students scored 34 percentage points better in English language arts (57 percent vs. 23 percent) and 24 percentage points better in mathematics (46 percent vs. 22 percent). Section IV examines whether students benefit from early transition, looking at MCAS performance between 2007 and 2011 for students who transitioned before the school year, to see how these students performed over time after the transition. For students in grades 1 6 who transitioned before the school year, a comparison between their mean scaled MCAS mathematics scores and the mean scores for the state as a whole reveal a gap of 3 points or more across all grades, as well as the following: There appears to be no steady pattern of increase or decrease in the scaled score gap over time. The scaled score gap appears to be larger when students are transitioned later. The gap is clustered around 8 to 9 points for students transitioned at grades 5 and 6, 5 to 7 points for students transitioned at grades 3 and 4, and 3 to 5 points for students transitioned at grades 1 and 2. The gap appears to be larger for students in their initial year of transition than in subsequent years. For English language arts, similar patterns are seen, including the presence of a scaled score gap across all grades, larger gaps when students are transitioned at higher grade levels, and a larger gap in the initial year of transition than in subsequent years. One difference is that, unlike the mathematics gap, the English language arts gap appears to decline over time for several of the grade level cohorts (particularly grades 3 4 and 5 6). When comparing the percentage of transitioned students scoring Proficient or Advanced on the MCAS with the percentage of students in the state scoring Proficient or Advanced, similar results emerge. Next, the section looks at MCAS performance over time based on years in Massachusetts schools at the time of transition from LEP status in Rather than comparing transitioned students with the state as a whole, this part looks at the percentage of transitioned students scoring Proficient or Advanced who have been enrolled in Massachusetts schools for 1, 2, 3, 4, or 5 years. For both mathematics and English language arts, there is a general trend of increasing performance from 2007 to A relatively large gap in performance between the 1 year and 5 year cohorts in 2007 narrows substantially by Across all cohorts, the percentage of transitioned students performing at the Proficient or Advanced levels in mathematics increased by 13 points, from 36 percent in 2007 to 49 percent in In English language arts, the percentage increased by 23 points, from 42 percent to 65 percent. Comparison with statewide results indicates that although the gap between transitioned students and the state as a whole is decreasing in the five years after the transition, it is still significant. Finally, the section looked at district level results to analyze patterns that might emerge based on two factors percentage of students transitioned (Transition) and mean years to transition (Years). Districts were placed in one of four categories: High Transition High Years, High Transition, Low Transition High Years, or Low Transition. Then MCAS performance was examined for transitioned students in each of the four categories. v

8 In English language arts there was no clear relationship between 2007 MCAS performance and Transition Percent or Years to Transition. However, in 2011 performance was somewhat better for low Years to Transition and for high Transition Percent. The highest combined category was High Transition. In mathematics, both the 2007 and 2011 MCAS results showed a similar result, that the best performance was in the High Transition category. There are preliminary indications of a relationship between earlier transition and higher performance, but it is too soon to reach a definitive conclusion. Section V explores the relationship between transitioning from LEP status and performance on the Massachusetts English Proficiency Assessment (MEPA). Overall there is a strong relationship between transitioning from LEP status and performance on the MEPA, which places students into five performance levels from Level 1 to Level 5. For students scoring at Levels 1, 2, and 3 on the spring 2010 MEPA, the rates of transition were 5 percent or lower, and for Level 4 students, the rate of transition was 14 percent. For Level 5 students, the rate of transition was 46 percent. Thus, despite the large jump in rate of transition, more than half of the students performing at Level 5 on the spring 2010 MEPA a level that should indicate solid English proficiency were still classified as LEP in the fall of the school year. The study also found the following regarding the transitioning of Level 5 students: There is little difference in Level 5 transition rates across the grade levels. Level 5 transitioned students, on average, were enrolled in Massachusetts schools one year less than non transitioned Level 5 students (4 years vs. 5 years). MEPA is broken into five different grade spans (K 2, 3 4, 5 6, 7 8, and 9 12). Within each grade span, Level 5 students in the earlier (or earliest) grade were transitioned at a higher rate than those in the other grades. The transition rates for Level 5 students categorized by race/ethnicity ranged from 50 percent for Hispanic students to 40 percent for Black students. MCAS scaled scores in both English language arts and mathematics were slightly higher for transitioned Level 5 students that non transitioned ones. At the district level, there is little correlation between the number of Level 5 students in a district and the percentage of those students transitioned. For example, in the districts with more than 700 Level 5 students, transition rates range from 97 percent (Lynn) to 49 percent (Boston) to 20 percent (Worcester). Despite the large gap between the percentage of students transitioned at Levels 1 4 and Level 5, students at Levels 1 4 represented almost half (45 percent) of the students transitioned. The percentage of transitioned students performing at each MEPA level decreases across levels from 55 percent (Level 5), to 30 percent (Level 4), to 11 percent (Level 3) to 3 percent (Level 2) to 1 percent (Level 1). vi

9 Introduction During the school year, there were 70,979 students classified as limited English proficient (LEP) enrolled in grades PK 12 in Massachusetts public schools. An additional 18,502 students were classified as formerly limited English proficient (FLEP) indicating that they had been classified as LEP within the previous two years. Although the majority (45,204) of those LEP and FLEP students (89,481 total) are enrolled in just six school districts, there are students classified as LEP or FLEP in 358 districts, charter schools, and other programs across the state. Similarly, although nearly half of the students classified as LEP are enrolled in grades PK 3 (47.5 percent), there are students with limited English proficiency in all grades PK 12. The English language learner (ELL) population has grown considerably in the last decade both in terms of the raw number of students and the percentage of the total student population they represent. The 70,979 ELL students enrolled in represent a 44 percent increase from the number of students classified as LEP in The 44 percent increase in the number of students classified as LEP combined with a 3 percent decline in overall PK 12 enrollment has resulted in the percentage of students classified as LEP increasing from 4.7 percent in to 7.1 percent in A common goal across all school districts and instructional programs is to help ELL students acquire the English language skills they need to participate fully and perform successfully in a general education program as quickly as possible. Educational research is unclear, however, on what as quickly as possible means with regard to transitioning students with limited English proficiency, and practices vary significantly across schools and districts. The purpose of the analyses described in this report is to begin a process that will identify successful approaches to transitioning ELL students and help to determine best practices that will enable students with limited English proficiency to be successfully and efficiently integrated into the general education program. The analyses described here are divided into five major sections. Section 1 includes basic descriptive information on who the ELL students are, where they are, and how long they remain classified as limited English proficient. Section 2 contains initial information on local transitioning statistics indicating how long students are classified as LEP. Section 3 includes initial analyses examining the relationship between student performance on the Massachusetts Comprehensive Assessment System (MCAS) tests and student transitioning. Section 4 contains analyses examining whether students benefit from early transitioning with regard to performance on the MCAS. Section 5 contains analyses examining the relationship between local transitioning statistics and student performance on the Massachusetts English Proficiency Assessment (MEPA). 1

10 Exploratory Data Review As mentioned above, the analyses described in this study are intended to be the first step in a larger process of understanding the make up and distribution of the ELL population in Massachusetts, and identifying best practices in the acquisition of skills for transition. The analyses were designed to address a set of specific questions: 1. Who are the English language learners? 2. How long are students classified as limited English proficient? 3. Is there a relationship between MCAS performance and ELL status? 4. Over time, do students benefit from transitioning earlier or staying classified as ELL longer? 5. What is the relationship between MEPA performance and transition from ELL status? Data Sources All data used in these analyses were provided by the Massachusetts Department of Elementary and Secondary Education (the Department). The primary source for information related to student classification as limited English proficient (LEP) was a student level data file containing records for all enrolled students classified as LEP at any point from the school year through the beginning of the school year. The primary sources for student achievement data were student level files containing results from MCAS and MEPA administrations. In addition to those student level data files provided directly by the Department for the purpose of these analyses, additional publicly available data files posted on the Department website ( were also accessed for enrollment information such as total annual ELL enrollment and total annual PK 12 enrollment for all students by state and district. SIMS file The SIMS file is a student level file containing records for 225,885 students classified as LEP between 2002 and For each student the file contains information drawn from the Student Information Management System (SIMS). The Department selected particular elements relevant to LEP classification from the complete set of 52 SIMS data elements. Identifying information such as state assigned student identifier (SASID), school identification number, and grade level were provided for all students. Additional demographic, background, and program information provided in the file included the following: Gender Race/ethnicity Low income status Special Education (ages 3 5) Special Education (ages 6 21) Enrollment status Limited English proficiency 2

11 MCAS files The MCAS files contained student level results from the annual MCAS test administrations for students in grades 3 through 8 and high school. MCAS results were provided for tests in English language arts, mathematics, and science and technology/engineering (STE). 1 MCAS results used in these analyses included scaled score and achievement level. Identifying information such as SASID, school identification number, and grade level were provided for all students. The files also included background and demographic information drawn from SIMS, including several elements that overlapped with data in the Core SIMS file. Demographic, background, and program information contained in the MCAS files was only used for analyses requiring internal comparisons of MCAS results for students classified as LEP and other students within a given MCAS administration. MEPA files The MEPA files contained student level results from the semiannual (fall and spring) MEPA administrations to students in grades K 12. MEPA results used in these analyses included scaled score and achievement level. Results from the spring 2010 MEPA administration are used in the analyses contained in this report. Transition For this study a student was classified as transitioned when he or she was classified as LEP in one school year, was enrolled in a school district the following year, and was not classified as LEP by that school district for the following school year. Data on student LEP classification is provided to the state by school districts at three points during the year October, March, and June. A student s LEP classification may change at any point during the year. However, in the large majority of cases, the re classification occurs in the end of year data submission in June, or the beginning of year data submission in October. For the purposes of this report, both of those situations are classified as a transition from LEP classification. Four examples are provided in Table 1 for clarification. 1 STE tests are only administered to students in grades 5, 8, and high school. STE test results were not used in these analyses. 3

12 Table 1 Four Examples of LEP Classification Across School Years and Transition Status Case 1: Continuous LEP classification Case 2: End of year re classification Case 3: Beginning ofyear reclassification Case 4: Not enrolled in following year Data Submission Oct 2009 LEP LEP LEP LEP March 2010 LEP LEP LEP LEP June 2010 LEP Not LEP LEP Not LEP Oct 2010 LEP Not LEP Not LEP Not Enrolled Transition Status Not Not 4

13 I. Who Are the English Language Learners? This section of the report provides basic information on the students classified as LEP during the school year. Student information is disaggregated by categories such as grade level 2, race/ethnicity, low income status, and disability status. The final analysis in this section identifies where the English learners are enrolled, providing enrollment information by school district and addressing the distribution of students across districts. In addition, school districts are classified into three categories (High Incidence, Low Incidence, Very Low Incidence) based on the number of their students classified as LEP. Those classifications will be used in subsequent sections of the report. Grade Level The number of students classified as LEP in 2011 decreases steadily from grades 1 through 12 with the exception of a single increase in enrollment at grade 9. Students in grade PK 2 account for 37.6 percent of English language learners; an additional 26.4 percent of students are enrolled in grades 3 5; 16.7 percent are enrolled in middle school grades 6 8; and the remaining 19.3 percent of students are enrolled in grades LEP student enrollment by grade level is shown in Figure In addition to grades 1 12, the following terms are used in charts. PK: Pre kindergarten KF: Full time kindergarten child attends school or school related activities over 25 hours per week and does not pay tuition. KP: Part time kindergarten child attends school or school related activities 25 hours or less per week. KT: Full time kindergarten, tuitioned child attends school or school related activities at least 25 hours per week, and pays tuition. SP: Beyond grade 12 special education student 5
 based on the number of their students classified as LEP.")
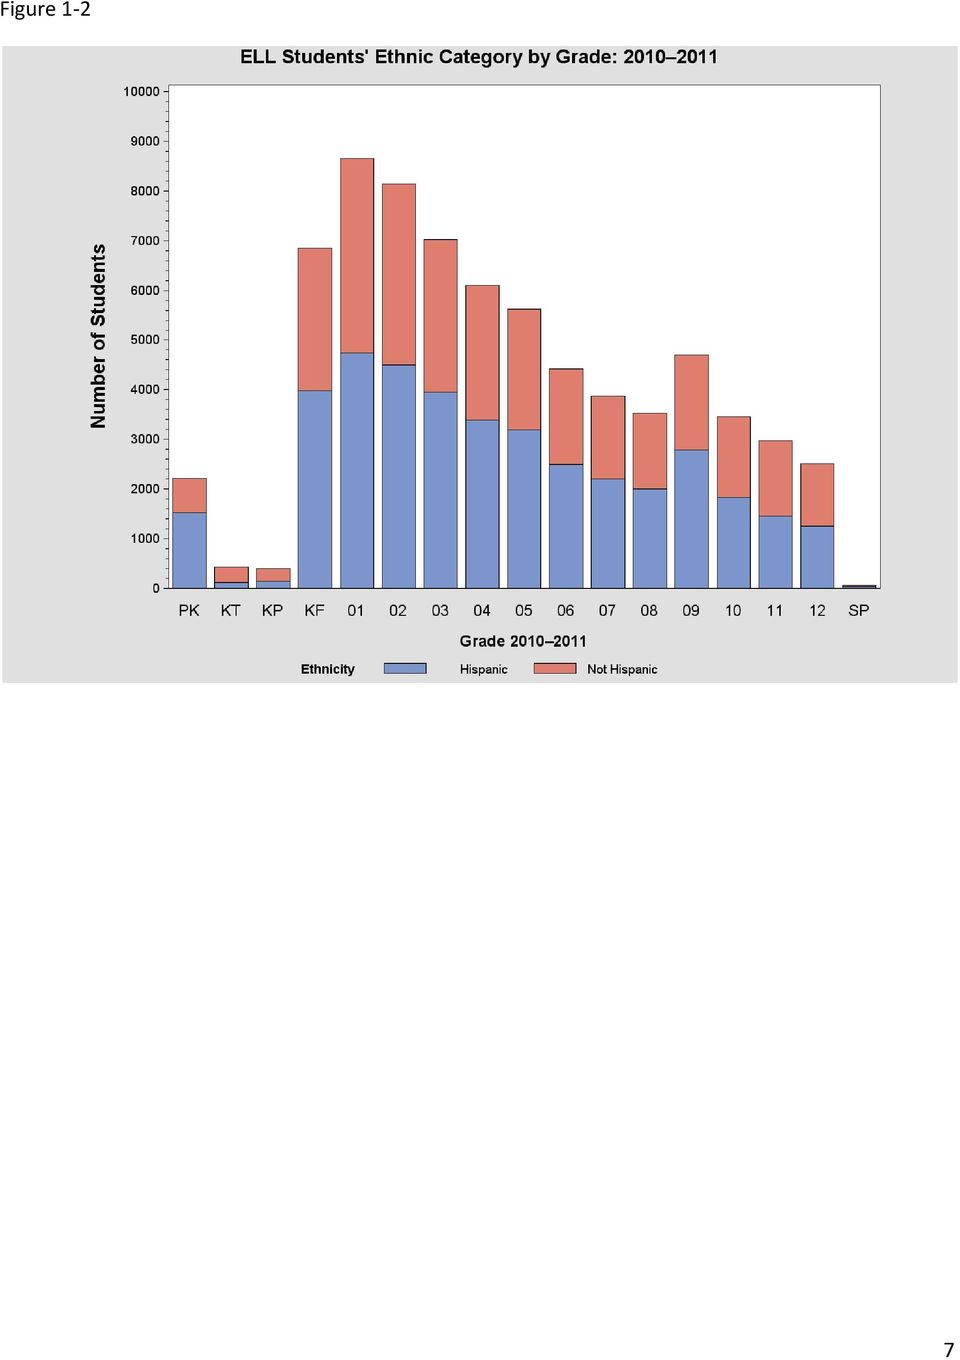
14 Figure 1 1 Race/Ethnicity In 2011, 55.8 percent of the students classified as LEP were identified as ethnically Hispanic. With regard to racial category, the majority of students were identified as White (54.7 percent), followed by Black or African American (20.6 percent), Asian (17.9 percent), American Indian or Alaskan Native (2.99 percent), and White Black (2.3 percent). The remaining 1.4 percent of students were distributed across 25 racial categories with each category containing less than one half percent. A complete list of the number of students in each racial/ethnic category is provided in Appendix I A. The distribution of students by ethnic category and grade level is shown in Figure

15 Figure 1 2 7
16 Low Income Status In 2011, 78.7 percent of student classified as LEP were also classified as low income. The distribution of low income English learners by grade level is shown in Figure 1 3 Figure 1 3 Students with Disabilities Overall, 15.1 percent of the LEP students in were also classified as students with disabilities. Across grade levels, the percentage of LEP students classified as students with disabilities increases steadily from 8.3 percent in Kindergarten to 22.3 percent in grade 7 before decreasing from grades 8 through 12 to 12.4 percent. The distribution of students with disabilities by grade level is provided in Figure

17 Figure 1 4 Initial Grade Level as LEP Based on an analysis of years in Massachusetts schools at each grade level, it appears that slightly more than half (53.2 percent) of students classified as LEP in 2011 have been enrolled in Massachusetts schools and classified as LEP since pre kindergarten or kindergarten. As expected, that percentage is highest at grade 1 (90.5 percent) and decreases steadily across grade levels. The percentage first drops below 50 percent at grade 5. At any given grade level through grade 8, the two most common entry points for students classified as LEP were PK/K or the preceding grade (i.e., students were entering their second year classified as LEP). The distribution of students classified as LEP since pre kindergarten or kindergarten is shown in Figure
.")
18 Figure 1 5 School Districts The majority of students classified as LEP in 2011 were enrolled in just five school districts, with Boston (23.2 percent), Worcester (11.3 percent), Lowell (6.8 percent), Springfield (5.3 percent), and Lawrence (4.5) accounting for 51.2 percent of students classified as LEP. An additional five districts also enroll 1,000 or more students classified as LEP: Brockton, Lynn, Holyoke, Framingham, and Quincy. The remaining students classified as LEP in 2011 are distributed across an additional 314 school districts with 112 districts serving 10 or fewer English language learners. In Table 1 1 school districts are classified into three categories based on the number of students classified as LEP that are enrolled. Districts with 100 students or more are classified as High Incidence. Districts with students are classified as Low Incidence, and districts with 1 29 students are classified as Very Low Incidence. 10

19 Table 1 1 of Districts Classified by Level of LEP Incidence of Districts of Students Grades PK 2 Grades 3 8 Grades 9 12 High Incidence (100 or more students) 65 65,450 24,561 28,346 12,453 Low Incidence (30 99 students) 65 3,587 1,527 1, Very Low Incidence (1 29 students) 194 1, A complete list of the number of students classified as LEP or FLEP by district is provided in Appendix I B. 11

20 II. How Long are Students Classified as Limited English Proficient? In this section of the report, we present analyses that examine factors such as the annual rate of transition, the number of years students are classified as LEP prior to transition, and grade level at the time of transition. Transition Rate As explained in the introduction to this report, a student s LEP classification and enrollment status in two consecutive school years are used in determining a transition status for the student. Students must be enrolled in a school district in both years to be classified as transitioned. That is, students who graduate or are no longer enrolled in public schools for any other reason are not considered transitioned. The statewide transition rate for each of the last nine years is provided in Table 2 1. Note that the total number of students included in the transition analysis between any two years is not equal to the total number of students classified as LEP in either year. Rather, it is the total number of LEP students in one year who are still enrolled in a public school the following year. For example, between 2010 and percent of students classified as LEP during the school year were enrolled in a school district and not classified as LEP at the beginning of the school year. Those are the students classified as transitioned from 2010 to Table 2 1 Annual Transition Rate: 2002 to 2003 through 2010 to 2011 Years Transition Rate (percent) of Students Total of Students 2010 to ,304 67, to ,514 59, to ,836 58, to ,338 58, to ,948 54, to ,635 51, to ,202 51, to ,155 53, to ,250 53,546 Transitioning by Grade Level Although the overall transition rate between 2010 and 2011 is 15.2 percent, there is variation in that rate across grade levels ranging from 10.1 percent at grade 1 to 23.0 percent at grade 5. Based on grade level in 2010, after an early surge in pre kindergarten, the transition rate builds each year through grade 5. The highest rates of transition are found between grade 4 and grade 8. Lower transition rates are seen after the students enter high school. The frequency of students transitioned by grade level is provided in Figure

21 Figure 2 1 Transitioning by Subgroup There was some variation in the transition rate for key subgroups of students. With regard to ethnicity, the percentage of Hispanic students classified as LEP who transitioned from 2010 to 2011 was 15.1 percent compared with 17.5 percent of students whose ethnicity was not Hispanic. Among the larger racial subgroups of students, the percentage of students transitioning was as follows: American Indian or Alaskan Native (18.6 percent); Asian (17.8 percent); Black or African American (13.0 percent); White (16.1 percent); and White Black (23.4 percent). In other subgroups, 14.5 percent of students with disabilities and 15.0 percent of low income students transitioned from LEP status. of Years Classified as LEP Among the 70,979 students classified as LEP in 2011, the mean number of years classified as LEP including the school year was 3.5, with a standard deviation (sd) of The median was 3 years, and the middle 50 percent of students had been classified as LEP between 2 and 5 years. There was slight variation in the number of years across grade levels 4 12 with a peak at 4.8 years at grade 8. 13
22 For students with disabilities, the mean number of years classified as LEP was 5.2 (sd=2.7). For low income students, the mean number of years classified as LEP was 3.6 (sd=2.3). With regard to ethnicity, the mean number of years classified as LEP for Hispanic students was 2.3 (sd= 2.3) and for non Hispanic students was 3.9 (sd=2.0). The mean number of years students were classified as LEP by grade level is provided in Figure 2 2. The distribution of number of years classified as LEP by grade level is provided in Figure 2 3. Figure 2 2 Mean Years Classified As LEP by Grade: Years PK KP KT KF SP Grade Level 14
23 Figure 2 3 of Years to Transitioning Between 2010 and 2011 there were 67,632 students eligible for transitioning from LEP classification (see Table 2 1). The mean number of years those students had been classified as LEP was 4.0 (sd=2.1). For those students who were transitioned in 2011 the mean number of years classified as LEP was 3.7 (sd=2.1), and for those students not transitioned the mean number of years was 4.0 (sd=2.1).the median number of years both groups of students were classified as LEP was 3, and the middle 50 percent of students had been classified as LEP between 2 and 5 years. For students with disabilities, the mean number of years for those transitioned was 5.1 (sd=2.3) and for those not transitioned was 5.1 (sd=2.4). The percentage of students transitioned by years in Massachusetts schools is provided in Table 2 2. The largest percentage for a given year is at 6 years in Massachusetts schools, but the total number of students classified as LEP at 6 years is significantly less than the number of students at 1 4 years. 15
24 Table 2 2 Percentage of ELL Students by Years in Massachusetts Schools Years in School of Students Percent 1 20, , , , , , , , , of Years and Transition Rate by District Of the 67,632 students eligible for transitioning from 2010 to 2011, 61,624 (91.1 percent) were enrolled in the High Incidence districts. Table 2 3 provides the percentage of students transitioned based on enrollment in districts at the three levels of incidence. The percentage of students transitioned increases as the level of incidence decreases, but recall that a large number of the Very Low Incidence districts have 10 or fewer students classified as LEP. The mean number of years classified as LEP for transitioning students enrolled in High Incidence districts was 3.8 years, compared with 3.4 for those in Low Incidence districts and 3.40 for those in Very Low Incidence districts. Table 2 3 Percentage of Students and Mean Years at Transitioning by Level of Incidence Level of Students Percent Mean Years at Transitioning and Standard Deviation (sd) High Incidence 61, (2.2) Low Incidence 3, (2.0) Very Low Incidence 2, (2.1) 16
25 Figure 2 4 shows the relationship between the percentage of students transitioned (Transition Percent), the mean number of years to transition, and the size of the districts. The relative size of the bubbles on the scatter plot indicates the number of students classified as LEP in the district. The data in the district level graph is consistent with the student level results provided above with regard to the percentage of students transitioned and mean number of years to transitioning based on level of incidence. Figure 2 4 A complete list of districts with their transition rate and mean number of years to transitioning is provided in Appendix II A. 17
26 III. Is there a Relationship between MCAS Performance and Transitioning? In the analyses presented in this section of the report we examined the performance on the MCAS tests of those students who were transitioned in 2011 and those who were not transitioned. Student performance on the 2010 and 2011 MCAS administrations was used in these analyses. The students used in these analyses were the 67,632 students eligible to be transitioned from LEP classification between 2010 and Of those students, 33,274 (49.2 percent) were enrolled in MCAS tested grades 3, 4, 5, 6, 7, 8, and 10. The transition rate for students in the MCAS tested grades was 18.7 percent, slightly higher than the overall transition rate. Note that these analyses focus on performance immediately prior to and immediately after transition. Analyses in Section IV look at the performance of transitioned students over a longer period of time. MCAS Performance and Transitioning In this initial set of analyses we compare the 2010 and 2011 MCAS performance of students who were transitioned and those students who were not transitioned from 2010 to The 2010 MCAS administration would have occurred during the year in which the transition decision was being made, and the 2011 MCAS administration would have occurred the following year. Table 3 1 contains information on the percentage of students performing at the Proficient or Advanced levels on the English language arts and mathematics MCAS tests. The results in Table 3 1 show a clear difference in the performance on the 2010 MCAS tests between those students who were transitioned from a classification as LEP and those students who were not transitioned. In terms of the percentage of students performing at the Proficient or Advanced levels on the MCAS tests, there was a gap of 33 percentage points between transitioned and non transitioned students in English language arts and a gap of 22 percentage points in mathematics. A similar gap in each content area was also found one year later on the 2011 MCAS tests. Table 3 1 Performance on the 2010 and 2011 MCAS Tests of Students Eligible to be in 2010 English Language Arts Mathematics 2010 # tested percent Prof/Adv # tested percent Prof/Adv 5, , Non transitioned 19, , # tested percent Prof/Adv # tested percent Prof/Adv 4, , Non transitioned 19, , The results in Table 3 1 are based on an analysis of MCAS performance aggregates across all grade levels. In Figure 3 1 and Figure 3 2, results are examined by grade level. 18
27 Figure and 2011 MCAS English Language Arts: Performance of and Non transitioned Students 80 Percent Proficient Grade Level 2010 Non transitioned Non transitioned
28 Figure 3 2 Percent Proficient and 2011 MCAS Mathematics: Performance of and Non transitioned Students Grade Level 2010 Non transitioned Non transitioned 2011 District Level MCAS Performance In the final set of analyses in this section we examined district level performance on the 2010 and 2011 MCAS tests. As in the analyses above, the focus was on comparing the performance of transitioned and non transitioned students between 2010 and MCAS results are aggregated across all grade levels. Table 3 2 contains results aggregated across High, Low, and Very Low Incidence school districts. Within each of the three incidence levels, the transitioned students had a higher percentage of students Proficient or Advanced than the non transitioned students. 20
29 Table 3 2 Performance on the 2010 and 2011 MCAS Tests of Students Eligible to be in 2010 By Level of Incidence High Incidence English Language Arts Mathematics 2010 # tested percent Prof/Adv # tested percent Prof/Adv 4, , Nontransitioned 20, , , , Nontransitioned 17, , Low Incidence English Language Arts Mathematics 2010 # tested percent Prof/Adv # tested percent Prof/Adv Nontransitioned Nontransitioned Very Low English Language Arts Mathematics Incidence 2010 # tested percent Prof/Adv # tested percent Prof/Adv Nontransitioned Nontransitioned Individual District Results Figures 3 3 through 3 8 contain 2010 MCAS results for transitioned and non transitioned students for individual districts. Graphs are provided for High Incidence and Low Incidence districts. Graphs are not provided for Very Low Incidence districts. A list of results for all districts is provided in Appendix III A. 21
30 Figure
31 Figure
32 Figure
33 Figure
34 Figure
35 Figure
36 IV. Do Students Benefit from Early Transition? One of the goals of the Department is to identify best practices related to the transitioning of ELL students. A key factor in identifying a transition as successful is the performance of the student in the years following the transition. The analyses presented in this section examined three aspects of early transition and their relationship to MCAS performance over time. The first two sets of analyses examined student level factors: grade level at time of transition, and years in Massachusetts schools at time of transition. The third analysis examined performance at the district level, classifying districts into four categories based on their rates of transition. ELL Students in the School Year This analysis examined the performance over time of the group of students transitioned from LEP status in school year 2007 (SY 2007) that is, students classified as LEP during the school year and no longer classified as LEP at the beginning of the school year. Across all grade levels, 9,948 students were identified as transitioning in SY Figure 4 1 shows the distribution of those students across grade levels. Students in grades 2 through 6 in SY 2007 had the opportunity to participate in four or five MCAS administrations between SY 2007 and SY This includes 4,923 students or nearly half of the 9,948 students transitioned in SY Students in earlier and later grade levels would have had fewer opportunities. Figure
37 Figure 4 2 shows the distribution of students transitioning in 2007 by years in Massachusetts schools. The bar graph appears to show that all students transitioned between 2006 and 2007 were in Massachusetts schools five years or less. However, that is an artifact of the available student level data. The availability of this level of SIMS data for ELL students begins with the school year. Therefore, because this set of analyses is focused on students transitioned from LEP classification between SY 2006 and SY 2007, it was only possible to trace those students back five years. To place this data in context, Figure 4 3 presents the same information for students transitioning between SY 2010 and SY 2011 (with nine years of available data). In Figure 4 3, there is a steady decline in the number of students transitioned after three years in contrast to the increase in number of students at five years shown in Figure 4 2. A closer comparison of the two figures indicates that approximately 30 percent of the transitioned students are accounted for by years 5 9 in Figure 4 3 and year 5 in Figure 4 2. This suggests that the year 5 bar in Figure 4 2 should be interpreted as including all students transitioned with five years or more in Massachusetts schools. Figure
38 Figure 4 3 Grade Level of Transition and MCAS Performance This first set of analyses examines the performance on MCAS of transitioned students based on their grade level in the year in which they were no longer classified as LEP. In this analysis we are tracking performance on grades 3 through 8 and grade 10 MCAS tests across the years of the grade level cohorts of students in grades 1 through 6 transitioned between SY 2006 and SY Because of the grades tested in MCAS the cohorts will have varying numbers of test scores available. Students transitioned in grades 3 and 4 will have tests scores for each of the five years Students transitioned in grades 5 and 6 will have only four years of test scores available because there is no ELA or Mathematics testing at grade 9. Students transitioned in grades 1 and 2 will have three and four years of test scores, respectively, because MCAS testing does not begin until grade 3. Note that there may be changes to each cohort of students over time as students leave the state or are not tested across grades for various reasons. 30
39 Scaled Scores Figure 4 4 provides one depiction of performance of the six grade level cohorts of transitioned students on their MCAS mathematics tests in grades 3 through 8 and grade 10. The data in Figure 4 4 shows the gap in mean scaled score between the transitioned students and the state as a whole on each of the grade level MCAS tests (the gap score is the difference between the mean scaled score for the state and mean scaled score for transitioned students, with a positive number indicating that the mean scaled score for the state was higher than the mean scaled score for the transitioned students). 3 The graph provides information on whether the achievement gap between the transitioned students and the state narrows, widens, or remains constant over time. The graph also provides information on the gap in a particular grade level test based on the number of years a student had transitioned prior to taking that test. Before considering the results of this analysis, a cautionary reminder is important. Figure 4 4 and the following figures in this section contain several data points, which actually represent a single longitudinal data point for each grade level cohort. That is, there is no evidence presented here to support the generalization that the performance of other grade 3 cohorts will be consistent with the performance of this SY 2007 grade 3 cohort. 3 Because MCAS scaled scores are based on four separate performance level scales rather than a single scale across performance levels, mean scaled scores are not computed in the operational reporting of MCAS test results and should be interpreted cautiously. 31
40 Figure 4 4 Mathematics Achievement Gap Based on Grade Level of Transition: Scaled Scores Scaled Score Gap Grade 3 Grade 4 Grade 5 Grade 6 Grade 7 Grade 8 Grade 10 Grade 1 Grade 2 Grade 3 Grade 4 Grade 5 Grade 6 The MCAS results provided in Figure 4 4 show several patterns of performance: The scaled score gap between the state and transitioned students remains at 3 points or more across all tests. With the possible exception of the grade 4 cohort, there does not appear to be a steady decrease in the scaled score gap across time. Conversely, there also does not appear to be a steady increase in the gap over time. Overall, the gap appears to increase the later a student is transitioned, with the scaled score gap somewhat clustered at 8 9 points for students transitioned at grades 5 and 6, 5 7 points for students transitioned at grades 3 and 4, and 3 5 points for students transitioned at grades 1 and 2. Across grade levels, it does appear to some extent that the gap is larger for students in their initial year of transition at the grade level being tested. Performance on the grade 10 test, with high student level stakes for graduation, may be different from that on other tests. 32
41 Figure 4 5 English Language Arts Achievement Gap Based on Grade Level of Transition: Scaled Scores Scaled Score Gap Grade 3 Grade 4 Grade 5 Grade 6 Grade 7 Grade 8 Grade 10 Grade 1 Grade 2 Grade 3 Grade 4 Grade 5 Grade 6 Figure 4 5 provided corresponding results to Figure 4 4, but for performance on the English language arts MCAS tests. There are some similarities and one distinct difference between the results for the English language arts and mathematics tests. The similarities between content areas can be seen in the positive gap on all tests presented the clustering of performance by grade level cohorts 1 2, 3 4, and 5 6 the gap during the initial year of transition A distinction between the content areas, however, is the apparent downward trajectory, indicating a closing of the gap, for several of the cohorts. That is, relative to mathematics in which the trend lines tended to be flat for each cohort, in English language arts there appears to be more suggestion of a closing of the gap over time. Achievement Levels Figure 4 6 and Figure 4 7 depict the achievement gap information in English language arts and mathematics in terms of MCAS achievement levels (or performance levels). Specifically, the graphs present the difference in the percentage of students whose performance is classified at the Proficient or Advanced levels between the state as a whole and the transitioned students. As 33
42 with the scaled score analysis, a positive gap indicates a higher percentage of Proficient or Advanced students at the state level than in the transitioned group of students. There are many similarities between the scaled score and achievement level results, but there are also some key points to note: Although the shape of the graphs is similar, note the difference in scale between the scaled scores and achievement level graphs. Relatively small differences in scaled scores can translate into large differences in percent proficient. In mathematics, there is some indication that the relatively flat performance in mean scaled scores across years results in a widening of the gap in terms of achievement levels. This suggests that there may be changes in the shape of the underlying distribution that are masked by the mean scaled scores. In English language arts, there is a relatively steady closing of the achievement level gap across years for all cohorts. This results in a gap of approximately percentage points after four years for each cohort. 34
43 Figure Mathematics Achievement Gap Based on Grade Level of Transition: Percent Proficient 20 Achievement Level Gap Grade 3 Grade 4 Grade 5 Grade 6 Grade 7 Grade 8 Grade 10 Grade 1 Grade 2 Grade 3 Grade 4 Grade 5 Grade 6 35
44 Figure English Language Arts Achievement Gap Based on Grade Level of Transition: Percent Proficient 30 Achievement Level Gap Grade 3 Grade 4 Grade 5 Grade 6 Grade 7 Grade 8 Grade 10 Grade 1 Grade 2 Grade 3 Grade 4 Grade 5 Grade 6 Years to Transition and MCAS Performance Figures 4 8, 4 9, 4 10, and 4 11 depict MCAS performance over time based on years in Massachusetts schools at the time of transition from LEP classification for the school year. There are five cohorts of students based on the number of years in Massachusetts schools prior to being transitioned: 1, 2, 3, 4, and 5. The results presented in these graphs are the percentage of students performing at the Proficient or Advanced level on the MCAS administrations in 2007, 2008, 2009, 2010, and Note that the results presented in this analysis focus on the actual performance of the transitioned students (i.e., percent proficient) rather than the gap in performance between the transitioned students and the state as a whole. The rationale for this difference is that years in Massachusetts schools naturally leads to a different question than grade level when tracking the performance of transitioned students over time. With years in Massachusetts schools the question of interest is more focused on the difference between the different cohorts of transitioned students within each year. That is, in a given year and test, is there a difference in the performance of students transitioned after 1 year and the performance of students transitioned after 5 years? Additionally, there is interest in the extent to which that difference narrows, widens, or stays the same over time. 36
45 Also note that to a much greater extent than with the grade level results described in the preceding section, there are changes to the students included in each cohort over time. Most of that change is due to each cohort decreasing in size as students move beyond grade 10 in each year. Students in grades 3 or 4 in 2007 were included in MCAS testing in each of the five years. Students in grades 5 and 6 in 2007 were included in MCAS testing in each year except Students in grade 7 in 2007 were included in the 2007, 2008, and 2010 MCAS results, and students in grade 8 in 2007 were included in the 2007 and 2009 MCAS results. The alternative to allowing the cohort to change each year based on MCAS testing would have been to limit the analysis to students in grades 3 and 4 in 2007 or to conduct separate analyses for each grade level. Either approach would have significantly reduced the number of available students. Figure 4 8 (mathematics) and Figure 4 9 (English language arts) present cohort performance on the MCAS tests in 2007, 2008, 2009, 2010, and Within each cohort, results are collapsed across grade level tests. In both content areas two main results emerge. The first is that there is a general trend of increasing performance across years. The second is that a relatively wide gap in performance between the 1 year and 5 year cohorts at the time of transition in 2007 narrows considerably by Figure Percent Proficient Over Time Based on Years at Transition in 2007: Math
46 Figure Percent Proficient Over Time Based on Years at Transition in 2007: ELA Figures 4 10 and 4 11 collapse results across all cohorts to focus on the increase in percent proficient from 2007 through In mathematics (Figure 4 10), the percentage of transitioned students performing at the Proficient or Advanced levels increases by 13 percentage points, from 36 percent in 2007 to 49 percent in In English language arts (Figure 4 11), the percentage of transitioned students performing at the Proficient or Advanced levels increases by 23 percentage points, from 42 percent in 2007 to 65 percent in For comparison purposes, state results based on the 2007 cohort of students are also provided in Figures 4 10 and That is, state level results on the MCAS tests in 2007 through 2011 are provided for the cohort of students who participated in the 2007 MCAS testing. Approximately 40 percent of the original cohort of nearly 500,000 students tested in 2007 were also tested in Comparison with the state level results suggests that although the performance of transitioning students is improving over time, and the gap between the performance of transitioned students and the state is decreasing over time, there is still a significant gap between the performance of transitioned students and overall state performance after five years. 38
47 Figure Percent Proficient Over Time Based on Years at Transition in 2007: Math State Figure Percent Proficient Over Time Based on Years at Transition in 2007: ELA State District Rate of Transition and MCAS Performance In the final set of analyses in this section of the report we shifted from a student level to a district level emphasis with regard to the grouping factors used in the comparisons. In these analyses we examined MCAS performance of transitioned students based on their school district s rate of transition. School districts were classified into one of four categories of Rate of Transition based on consideration of two factors: percentage of students transitioned and 39
48 mean years to transition. The distribution of school districts on these two factors is presented in Figure A simple normative cut based on the median value on each of these factors (weighted by size of district) was used to divide the school districts into four categories: High Transition High Years; High Transition ; Low Transition High Years; Low Transition Low Years. The upper left quadrant contains districts with a High percentage of transitioned students and a Low mean number of years to transitioning. Conversely, the lower right quadrant contains districts with a Low percentage of transitioned students and a High mean number of years to transitioning. A cursory examination of Figure 4 12 with the largest districts clustered on the lower end of percentage of students transitioned indicates that weighting by size of district had more impact on the high low cut for transition percent than on the high low cut for mean years to transition. Figure 4 12 Information on the number of districts and students included in each of the four classifications is provided in Table
49 Table 4 1 Distribution of Districts and Students Across Rate of Transition Categories Years to Transition Low High Total Transition Percent Low High 68 districts 12,693 students 140 districts 15,071 students 20 districts 12,147 students 84 districts 14,913 students 88 24, ,984 Total , , ,824 After districts were classified into the four Rate of Transition categories, MCAS performance was examined for transitioned students within each of the four categories. Including only students in tested grades and only transitioned students reduced the total number of students from approximately 54,000 to 5,400, or 10 percent of the total sample of students classified as LEP in As in the previous analyses, MCAS performance included mean scaled score and the percent of students performing at the Proficient or Advanced achievement levels. In addition to the 2007 MCAS results, we examined 2011 MCAS results for remaining students in the 2007 cohort. This further reduced the number of students in the cohort to approximately 4,000, with fairly small numbers of students in the low Transition Percent cells. Results of the MCAS analyses are presented in Table 4 2 for English language arts and Table 4 3 for mathematics. As previously reported, the percentage of students performing at the Proficient or Advanced level increases from 2007 to 2011, and there is a corresponding increase in mean scaled score. In English language arts there is not a clear relationship between 2007 MCAS performance and transition percent or years to transition. Both Transition Percent and Years to Transition show 41
50 slightly better performance for students in districts in the Low category than those in the High category. However, within the crossed categories, the highest performing cell is districts with high Years to Transition and low Transition Percent. The pattern of performance is more internally consistent on the 2011 MCAS tests. Performance is better for the low Years to Transition and the high Transition Percent categories, and in 2011 the highest performing cell is the High Transition cell. The relatively high performance of districts in the High Transition cell is repeated for mathematics in both 2007 and Although these analyses are not sufficient to reach a definitive conclusion, there are preliminary indications of a relationship between earlier transition and high performance. 42
51 Table and 2011 MCAS ELA Performance of 2007 Students by District Rate of Transition 2007 scaled score (sd) 2011 scaled score (sd) 2007 percent Proficient/Advanced 2011 percent Proficient/Advanced Years to Transition Low High Total 2007 number of students 2011 number of students (14.17) (15.32) (12.90) (15.41) (13.11) (15.43) Low 40.6% 64.1% % 57.6% % 59.3% Transition Percent High (13.27) (14.58) 43.8% 64.5% (12.81) (14.86) 37.3% 60.7% (13.06) (14.68) 40.7% 63.2% (13.35) (14.63) (12.87) (15.06) Total 43.5% 64.4% 39.71% 59.7%
52 Table and 2011 MCAS Mathematics Performance of Students by District Rate of Transition 2007 scaled score (sd) 2011 scaled score (sd) 2007 percent Proficient/Advanced 2011 percent Proficient/Advanced 2007 number of students 2011 number of students Years to Transition Low High Total (17.81) (19.69) (16.56) (18.92) (16.77) (19.18) Low 27.5% 48.4% 29.6% 43.5% 29.1% 44.8% Transition Percent High (17.61) (18.88) 39.8% 50.6% (16.76) (19.33) 31.8% 44.6% (17.24) (19.07) 36.0% 48.6% (17.63) (18.94) (16.70) (19.21) Total 38.6% 50.4% 31.1% 44.3%
53 V. Transitioning and Performance on MEPA In this section of the report we present analyses examining the relationship between student performance on the Massachusetts English Proficiency Assessment (MEPA) and the transitioning of students from LEP status. Three sets of analyses are presented. The first set provides background information on students included in these analyses. The second set of analyses examines the percentage of students transitioning at various levels of performance on the MEPA. The third set of analyses focuses more closely on the statewide and district level transitioning patterns of students performing at the highest performance level (Level 5) on the MEPA. The third set of analyses includes examination of the MCAS performance of Level 5 MEPA students. MEPA In accordance with state and federal requirements, English language learners in grades K 12 participate in the annual administration of the Massachusetts English Proficiency Assessment (MEPA). Based on grade level, students participate in one of the five MEPA grade span test forms (K 2, 3 4, 5 6, 7 8, 9 12). MEPA is designed to measure the performance of ELL students and their progress toward acquiring English language skills in the domains of reading, writing, listening, and speaking (MA DESE, 2010, p.2) 4 One intended use of MEPA results is guiding decisions regarding the planning of instruction for ELL students and the readiness of ELL students to perform ordinary classroom work in English without supplemental support. (p. 8). Although performance on the MEPA is not the only factor in determining student readiness to perform ordinary classroom work in English, it is expected that there will be a strong relationship between MEPA performance and the decision to transition students from LEP status. In particular, performance at Level 5 on the MEPA should be a strong indicator of readiness to transition. The performance level descriptor for Level 5 for grades 3 12 makes this quite clear: A student at Level 5 communicates effectively in English across all academic subjects, with few errors. The student shows control of standard English. Oral and written communication is correct and understandable. A student performing at this level typically Reads and understands most grade level texts, including a range of academic vocabulary Writes and edits texts of different lengths, giving details and descriptions to suit the purpose and audience, and shows a general control of standard grade level English writing conventions Speaks English with grade level fluency, using academic language and descriptive vocabulary in conversations and classroom discussions 4 Quotes in this section are drawn from the Guide to Interpreting The Spring 2010 MEPA Reports for Schools and Districts produced by the Department. 45
54 Understands spoken English during nearly all conversations and classroom discussions. (MA DESE, 2010, p. 7) Sample of students included in the analysis The analyses described in this portion of the report were based primarily on 59,432 English language learners who participated in the spring 2010 administration of the MEPA across the five grade spans. Primary information on these students was drawn from two data sources. MEPA test participation and score information was drawn from the MEPA student level file. Information related to LEP status, years in Massachusetts, etc., was drawn from the Core SIMS file. The matched students met the three criteria of being classified as LEP at some point during the school year, participating in the spring 2010 MEPA administration, and being enrolled in school in fall By policy, with few exceptions, all students in grades K 12 classified as LEP are expected to participate in MEPA. Combining the SIMS and MEPA data shows that although there is not a perfect 1 to 1 correspondence between LEP classification in the SIMS file and MEPA participation, it does appear that the policy is being implemented effectively, with more than 99 percent of students classified as LEP being accounted for in MEPA testing. More detailed information on the matching of students in the MEPA and Core SIMS file is presented in Appendix V A. After the matched sample was created, MCAS performance for students in MCAS tested grades was obtained from the spring 2010 and spring 2011 MCAS student level data files. Students Matched on MEPA and SIMS Figure 5 1 presents the number and percentage of LEP students participating in each of the five MEPA grade span tests. Consistent with the distribution of students classified as LEP, the highest concentration of students was on the K 2 test (37.7 percent) with more than half of the students completing either the K 2 or 3 4 tests (57.6 percent). 46
55 Figure 5 1 Years in Massachusetts Schools Figure 5 2 presents the distribution of number of years in Massachusetts schools through spring of the school year for the students across grades K 12 completing the spring 2010 MEPA tests. The chart shows a steadily decreasing number of students through 8 years in Massachusetts schools with three fifths of the students (61.0 percent) at 3 years or less. In part, however, this is caused by the grade level of the LEP student population, as 91.9 percent of students in the K 2 grade span, the largest single block of students, have been in Massachusetts schools three years or less. 47
56 Figure 5 2 The percentage of students in Massachusetts schools 3 years or less and 5 years or more participating in each of the five grade span tests is shown in Table 5 1. With the exception of the K 2 grade span there is a substantial pool of students classified as LEP for 5 years or more on each of the MEPA tests. Note that the relationship between grade level and years in Massachusetts schools suggests that most of the students with 5 years or more completing the grade span 3 4 and 5 6 MEPA tests have been enrolled in Massachusetts schools since kindergarten. Table 5 1 Percentage of Students by Years in Massachusetts Schools on each Spring 2010 MEPA Test Grade Span Percent 3 years or Percent 5 years or of Students less more K 2 22, percent 1.1 percent , percent 36.0 percent 5 6 8, percent 51.8 percent 7 8 6, percent 44.3 percent , percent 33.0 percent Total 58,796* 61.0 percent 25.7 percent *Note: The number of students across the five tests does not equal the reported matched total 48
57 of 59,432 because of 630 students in the MEPA file with no test level data. Race/Ethnicity Slightly more than half of the students are Hispanic (55.1 percent). The next three largest groups represented on the MEPA tests overall are Asian (18.3 percent), Black (13.5 percent), and White (11.8 percent). Students who are Native American or Pacific Islander account for less than 2 percent of the MEPA sample. As shown in Figure 5 3, although the majority of students participating in each grade span test are Hispanic, there is some variation in the distribution of students by race/ethnicity across the five grade spans with the percentage of Black students increasing from 9.8 percent to 21.2 percent across the five tests, and the percentage of Asian and White students gradually decreasing across the grade spans. Figure % Percentage of Students by Race/Ethnicity Across MEPA Grade Span Tests 80% 60% 40% 20% 0% Grades K 2 Grades 3 4 Grades 5 6 Grades 7 8 Grades 9 12 Asian Black Hispanic Native American Pacific Islander White Multiple Races MEPA Performance and Transitioning Overall, there is a very strong relationship between performance on the MEPA and transitioning from LEP status. Figure 5 4 shows the percentage of students transitioning based on their performance level on the spring 2010 administration of the MEPA. No more than 5 percent of the students performing at Levels 1, 2, or 3 on the 2010 spring MEPA were transitioned from LEP status the following fall. That percentage increases to 49
58 13.8 percent of students performing at Level 4 on MEPA and jumps to 46 percent of students performing at Level 5. Figure % 45% 40% 35% 30% 25% 20% 15% 10% 5% 0% Percent Transitioning from LEP Status by MEPA Performance Level Level 1 Level 2 Level 3 Level 4 Level 5 Percent Transitioning by MEPA Performance Level There is clearly a break between Level 5 and lower performance levels with regard to the percentage of students transitioning from LEP status. However, more than half of the students performing at Level 5 on the spring MEPA performance that should reflect solid English proficiency are still classified as LEP the following year. Level 5 students perform slightly better than those students not transitioned with a median MEPA scaled score of 510 for the transitioned students compared to 506 for the students not transitioned. 5 The following analyses examine transitioning among MEPA Level 5 students more closely. Transitioning of MEPA Level 5 Students by Grade Span An examination of the transitioning of Level 5 students on each of five MEPA grade span tests shows little variation across tests. The percentage of Level 5 students transitioned from LEP status ranges only from 44.5 percent on the Grade 7 8 test to a 47.2 percent on the Grade K 2 test. Figure 5 5 shows the total number of students tested and the breakdown of transitioned/not transitioned on each of the five grade span tests. 5 Level 5 scaled scores on MEPA tests range from 500 to
59 Figure 5 5 Transitioning of MEPA Level 5 students by Years in Massachusetts Schools On average, Level 5 transitioned students were enrolled in Massachusetts schools for one year less than those students not transitioned. The mean and standard deviation in number of years in Massachusetts was 4.33 (2.00) for the 4,370 transitioned students and 5.32 (2.00) for the 5,133 non transitioned students. Table 5 2 shows virtually no difference between transitioned and non transitioned students in terms of students enrolled in Massachusetts schools 3 years or less or 5 years or more. Table 5 2 Distribution of Years in Massachusetts Schools for Level 5 MEPA Students 3 Years or Less 5 Years or More 40.4% 42.8% Non 40.6% 42.6% 51
60 Transitioning of MEPA Level 5 students by Year in Grade Span Each of the MEPA grade span tests is administered to students in two or more grade levels. Table 5 3 presents the number of students performing at Level 5 at each grade level and the percentage of those students transitioned. On each grade span test, a higher percentage of students in the earlier (earliest) grade level within the span were transitioned. However, the difference across grade levels was not large enough for grade level to be identified as a primary factor in the decision to transition a student. Table 5 3 Percentage of Level 5 Students by Student Grade Level Grade Span K 2 Grade K Grade 1 Grade 2 Grade Span 3 4 Grade 3 Grade 4 Grade Span 5 6 Grade 5 Grade 6 Grade Span 7 8 Grade 7 Grade 8 Grade Span 9 12 Grade 9 Grade 10 Grade 11 Grade 12 of Level 5 Students , ,474 1,187 1, Percent Transitioning of MEPA Level 5 Students by Race/Ethnicity The race or ethnicity of the student also does not appear to be a primary factor in the decision on whether to transition a student performing at Level 5. The percentage of Level 5 students transitioned was highest for the Hispanic subgroup, but the range was fairly narrow across subgroups. Among the four major racial/ethnic subgroups represented on the MEPA tests the percentage of Level 5 students transitioned ranged from 40.3 percent to 49.9 percent. The number of Level 5 students and the percentage of those students by race/ethnicity is presented in Table
61 Table 5 4 Percentage of Level 5 Students by Race/Ethnicity of Level 5 Students Percent Asian 2, Black 1, Hispanic 4, White 1, Native American, Pacific Islander, and Multiple Race subgroups account for 101 of the Level 5 students. Transitioning of MEPA Level 5 Students and MCAS Performance Of the approximately 9,500 students performing at Level 5 on the Spring 2010 MEPA tests, 6,370 were enrolled in grades with MCAS testing, and 6,314 (99.1 percent) received MCAS scores in English language arts and mathematics. 6 Across all MEPA Level 5 students the mean of MCAS scaled scores was in English language arts and in Mathematics. 7 As shown in Table 5 5, the mean MCAS scaled scores were slightly higher for transitioned students than nontransitioned students in both English language arts and mathematics. In terms of MCAS performance levels, the percentage of MEPA Level 5 students classified as Proficient or Advanced was 54.0 percent in English language arts and 48.4 percent in Mathematics. 8 The difference in percent proficient for transitioned and not transitioned was 10.4 percentage points in English language arts and 7.7 percentage points in mathematics favoring transitioned students in both content areas. To some extent the magnitude of this difference may be affected by the mean scaled scores straddling the proficient cut score of The equal number of students receiving MCAS scaled scores in English language arts and mathematics suggests that few, if any, of the MEPA Level 5 students were first year students. 7 This is approximately 10 points higher than the mean MCAS English language arts (mean=228.6, sd=13.0) and Mathematics (mean=229.0, sd=16.4) scaled scores for the more than 25,000 students with both MEPA and MCAS scores in The higher percentage of MEPA Level 5 students classified Proficient or Advanced in English language arts than mathematics is not reflected for MEPA students overall (22.7 percent ELA v percent MATH), but is consistent with the performance of all students overall (69.3 percent ELA v percent MATH). 53
62 Table 5 5 MCAS Performance of MEPA Level 5 Students English Language Arts Mathematics of Students Mean (sd) Scaled Score Percent Proficient or Advanced of Students Mean (sd) Scaled Score Percent Proficient or Advanced (11.0) (16.5) 52.6 Non (10.7) (16.3) 44.9 Figure 5 6 presents the percentage of transitioned and non transitioned students classified as Proficient or Advanced on the English language arts MCAS test by grade level. The percentage of transitioned students classified as Proficient or Advanced is greater than the percentage of nontransitioned students classified as Proficient or Advanced at each grade level 3, 4, 5, 6, 7, 8, and 10. The percent Proficient or Advanced is highest for both groups of students at grade 3. The gap between groups is smallest at grade 8. 54
63 Figure 5 6 Figure 5 7 presents the percentage of transitioned and non transitioned students classified as Proficient or Advanced on the mathematics MCAS test by grade level. Unlike the results on the English language arts MCAS tests, the mathematics results favor the transitioned students at grades 3 through 7, and the non transitioned students at grades 8 and 10. Across grades, the gap between groups is smaller in grades 7 through 10 than in grades 3 through 6. Consistent with the English language arts results, the highest level of performance for both groups of students is found at grade 3. Consistent with overall state results, performance is lowest at grade 8 and rebounds significantly at grade
64 Figure 5 7 Transitioning of MEPA Level 5 Students by District The preceding analyses in this section examined differences between MEPA Level 5 students who were transitioned and those who were not transitioned with regard to grade span, grade level, years in Massachusetts schools, race/ethnicity, and MCAS performance. Although some differences between groups were found, none of those differences were large enough to account for the almost even split between MEPA level 5 transitioned and non transitioned students. This final analysis examines differences in transitioning patterns by district. Statewide, 98 districts had 10 or more students with performances classified at MEPA Level 5 on the Spring 2010 test administration. Overall, there was a negative correlation between the percentage of those students transitioned and the percentage of those students Proficient or Advanced on the 2010 MCAS tests. The unweighted correlations with both content areas and the weighted 9 correlation for mathematics were not significantly different from 0. Conversely, there was a strong positive correlation between the percentage of students Proficient or Advanced in English language arts and mathematics. Additionally, there was a near zero correlation between the percent transitioned and the number of MEPA Level 5 students. Table 5 6 provides those correlations both unweighted and weighted by the number of MEPA Level 5 students in the district. For both unweighted and weighted correlations, a stronger relationship 9 Weighted by number of students in the district. 56
65 with the percentage of student transitioned was found for English language arts than mathematics. Table 5 6 Intercorrelations among Percent of MEPA Level 5 Students and MCAS Performance For Districts with 10 or more Level 5 Students of districts: 98 Unweighted Weighted Percent and Percent Proficient or Advanced, English language arts 0.11 (p =.268) 0.30 (p =.003) Percent and Percent Proficient or Advanced, Mathematics Percent and # MEPA Level 5 Students 0.05 (p =.647) 0.14 (p =.180) 0.08 (p =.456) Percent Proficient or Advanced in English language arts and Mathematics 0.73 (p <.0001) 0.79 (p<.0001) The bubble plot in Figure 5 8 shows the relationship among percentage of Level 5 students transitioned, percentage of students Proficient or Advanced in English language arts, and number of Level 5 students for the 97 districts with 10 or more Level 5 students. An examination of the plot reveals that across the performance continuum there are districts with very low to very high percentages of MEPA Level 5 students transitioned. Most of the districts transitioning at least 80 percent of MEPA Level 5 students are relatively small districts. However, most of the districts transitioning 15 percent of MEPA Level 5 students are also small districts. Overall, the plot shows little relationship between the number of MEPA Level 5 students in the district and the percentage of those students transitioned. A complete list of the districts shown in Figure 5 8 is provided in Appendix V B. 57
66 Figure 5 8 Figure 5 9 presents the same bubble plot, but includes only the 13 districts with 100 or more MEPA Level 5 students. The plot shows 3 districts transitioning more than 70 percent of MEPA Level 5 students, 4 districts transitioning less than 30 percent of MEPA Level 5 students, and 6 districts transitioning between 30 percent and 70 percent of students with the largest district close to the overall mean of 46 percent transitioned. 58
67 Figure
68 Table 5 7 provides a list of the 13 large districts shown in Figure 5 9. The list is sorted in descending order by the percentage of MEPA Level 5 students transitioned. Table 5 7 District Code District of MEPA Level 5 Students Percent Percent Prof/Adv ELA Percent Prof/Adv MATH Lynn Lawrence Quincy Brookline Malden Boston 1, Springfield Newton Fitchburg Brockton Framingham Worcester 1, Lowell 1, MEPA and Transitioning As shown in Figure 5 4, there is a clear break between the percentage of students transitioned at MEPA Levels 1 4 and MEPA Level 5. Notwithstanding this difference, students at MEPA Levels 1 4 represent nearly half (45 percent) of the students transitioned. The percentage of transitioned students performing at each MEPA Level decreases across levels from Level 5 (55 percent), Level 4 (30 percent), Level 3 (11 percent), Level 2 (3 percent), and Level 1 (1 percent). Although nearly half of students transitioning from 2010 to 2011 performed at Level 1 4 on the Spring 2010 MEPA tests, MCAS performance drops off dramatically as MEPA Level decreases from Level 5 to Level 1. Additionally, students performing at MEPA Level 5 demonstrate the 60
69 greatest increase in MCAS performance from 2010 to Those results are presented in Figure 5 10 for English language arts and Figure 5 11 for Mathematics. Figure
70 Figure
71 Appendix I A Table of race by ethnicity race(racial Category) ethnicity(ethnic Category) Hispanic Not Hispanic Total White (W) Black or African American (B) Asian (A) Amer Indian or Alaskan Nat(AI) W-B Haw Nat or Pac Islander (PI) W-A W-B-AI W-AI
72 Table of race by ethnicity race(racial Category) ethnicity(ethnic Category) Hispanic Not Hispanic Total B-A B-AI W-B-A-AI-PI W-PI A-PI B-PI A-AI W-B-A AI-PI B-A-AI-PI
73 Table of race by ethnicity race(racial Category) ethnicity(ethnic Category) Hispanic Not Hispanic Total W-A-AI W-B-A-AI B-A-AI W-A-AI-PI W-B-A-PI A-AI-PI B-A-PI B-AI-PI W-A-PI W-AI-PI
74 Table of race by ethnicity race(racial Category) ethnicity(ethnic Category) Hispanic Not Hispanic Total W-B-AI-PI Total
75 Appendix I B of Students Classified as LEP or FLEP by District: Obs District Code District Total LEP or FLEP PK Boston 18,374 5,806 8,706 3, Worcester 8,318 3,312 3,675 1, Lowell 5,210 1,271 2,817 1, Lawrence 4,603 1,721 2, Lynn 4,477 1,344 2, Springfield 4,222 1,081 2,118 1, Brockton 3, , Holyoke 1, Quincy 1, Framingham 1, Chelsea 1, Malden 1, Somerville 1, Revere 1, Newton 1, Everett 1, Fall River Brookline New Bedford
76 Obs District Code District Total LEP or FLEP PK Fitchburg Marlborough Waltham Methuen Leominster Salem Cambridge Haverhill Chicopee Lexington West Springfield Peabody Beverly Outplacement Watertown Westfield Lowell Community Charter Public Milford Attleboro Randolph Westborough Lawrence Family Development Ch Woburn Arlington
77 Obs District Code District Total LEP or FLEP PK Pittsfield Southbridge Taunton Shrewsbury Barnstable Norwood Stoughton Clinton Amherst Greater Lowell Regional Vocational Agawam Braintree Winchester Hudson Belmont Dennis-Yarmouth Chelmsford Dedham Weymouth Seven Hills Charter Public (Di Andover Walpole Acton
78 Obs District Code District Total LEP or FLEP PK Melrose Community Day Charter Public Burlington Bedford Gardner Winthrop Wachusett Nantucket North Andover Ashland Abby Kelley Foster Charter Pub Billerica Dartmouth Needham Saugus Holyoke Community Charter Sharon Amherst-Pelham Northborough South Middlesex Regional Vocational Beverly Greater Lawrence Regional Vocational
79 Obs District Code District Total LEP or FLEP PK Wellesley Boston Renaissance Charter Pub Auburn Weston Gloucester Stoneham Westford Dracut Webster KIPP Academy Lynn Charter Dudley-Charlton Regional Franklin Swampscott Northeast Metropolitan Regional Northampton Canton Natick Greenfield Mansfield Rockland Easthampton Plymouth
80 Obs District Code District Total LEP or FLEP PK Milton Southborough Easton Test Site North Attleborough Ayer Gill-Montague Barnstable Horace Mann Charter Falmouth Ludlow Harwich Longmeadow Holliston Foxborough Regional Charter Sabis International Charter Westwood Danvers Acton-Boxborough Hopkinton Leicester Montachusett Regional Vocational Belchertown
81 Obs District Code District Total LEP or FLEP PK Marblehead Maynard Wilmington Barnstable Community Horace Ma Hamilton-Wenham Holbrook Concord Lincoln Bridgewater-Raynham Bellingham Uxbridge Roxbury Preparatory Charter Hampden-Wilbraham Sudbury Conservatory Lab Charter Berkshire Hills Scituate Wakefield Silver Hill Horace Mann Charter Greater New Bedford Regional Vocational Tisbury
82 Obs District Code District Total LEP or FLEP PK Advanced Math and Science Academy Test Site Oak Bluffs Reading Academy Of the Pacific Rim Cha Benjamin Banneker Charter Public Edgartown Wayland Assabet Valley Regional Vocational Amesbury Marshfield Mashpee Palmer Seekonk Tewksbury City On A Hill Charter Public Martin Luther King Jr. Charter Phoenix Charter Academy Nashoba Abington Athol-Royalston
83 Obs District Code District Total LEP or FLEP PK Millbury Oxford Excel Academy Charter Southeastern Regional Vocation Grafton Hadley North Adams Community Charter School of Cambridge Martha s Vineyard Triton Lee Foxborough Middleborough Neighborhood House Charter Salem Academy Charter Littleton Newburyport Winchendon Hampden Charter School of Science Middleton Shirley
84 Obs District Code District Total LEP or FLEP PK Southwick-Tolland South Hadley Boston Preparatory Charter Pubic Pioneer Charter School of Science Ashburnham-Westminster North Middlesex Ipswich Smith Leadership Academy Chart Blackstone-Millville Cape Cod Regional Vocational Whittier Regional Vocational North Reading Westport Hingham Mendon-Upton Wareham Spirit of Knowledge Charter Sc Groton-Dunstable Carlisle Granby Northbridge Williamstown
85 Obs District Code District Total LEP or FLEP PK Gateway Chatham Hanover Lunenburg Swansea Ware Lowell Middlesex Academy Charter North Central Charter Essential Northboro-Southboro Hopedale Boston Day and Evening Academy New Leadership Charter Greater Fall River Regional Vocational Boylston Edward M. Kennedy Academy for Health Careers Dighton-Rehoboth Spencer-E Brookfield Blue Hills Regional Vocational Lenox Medfield Monson
86 Obs District Code District Total LEP or FLEP PK Wrentham Nauset Frontier Brewster Dover East Longmeadow Medway Edward Brooke Charter Boston Collegiate Charter Avon Carver East Bridgewater Fairhaven Sunderland Dorchester Collegiate Academy Lincoln-Sudbury Whitman-Hanson Provincetown Sandwich Southampton Northampton-Smith Vocational Agricultural Concord-Carlisle
87 Obs District Code District Total LEP or FLEP PK Ralph C Mahar Minuteman Regional Vocational Tyngsborough Christa McAuliffe Regional Charter Innovation Academy Charter Hill View Montessori Charter Public Dover-Sherborn Blackstone Valley Regional Vocational Bristol-Plymouth Regional Vocational Southern Worcester County Regional Boxborough Boxford Deerfield Pembroke Topsfield West Boylston Martha's Vineyard Charter Test Site Test Site Masconomet
88 Obs District Code District Total LEP or FLEP PK Mohawk Trail Up-Island Regional North Shore Regional Vocational Harvard Rockport Southern Berkshire Eastham Lynnfield Norwell Somerset King Philip Kingston Orleans Adams-Cheshire Central Berkshire Freetown-Lakeville Manchester Essex Regional Narragansett Pentucket Tantasqua Bourne Hull North Brookfield
89 Obs District Code District Total LEP or FLEP PK Norton Orange Rochester Sherborn West Bridgewater South Shore Charter Public Global Learning Charter Public Pioneer Valley Chinese Immersion Berlin-Boylston Old Rochester Quabbin Acushnet Berlin Georgetown Lanesborough Mattapoisett Millis Sturbridge Sutton Williamsburg Codman Academy Charter Public Benjamin Franklin Classical Charter
90 Obs District Code District Total LEP or FLEP PK Ma Academy for Math and Science Hampshire Mount Greylock Silver Lake Quaboag Regional South Shore Regional Vocational Brimfield Clarksburg Conway Douglas Duxbury Freetown Hatfield Holland Marion Pelham Petersham Plainville Shutesbury Wales Four Rivers Charter Public Berkshire Arts and Technology
91 Obs District Code District Total LEP or FLEP PK Gloucester Community Arts Charter Hilltown Cooperative Charter Marblehead Community Charter Pioneer Valley Performing Arts Hawlemont Franklin County Regional Vocational Northern Berkshire Regional Vocational Nashoba Valley Regional Vocational Tri County Regional Vocational Bristol County Agricultural Essex Agricultural Technical Norfolk County Agricultural
92 Appendix II A Transition Rate and Years to Transitioning by District Obs Code District # of Students Percent Mean Years to Transitioning Boston 15, Worcester 6, Lowell 4, Lynn 3, Springfield 3, Lawrence 3, Brockton 2, Holyoke 1, Framingham 1, Quincy 1, Chelsea Malden Somerville Newton Everett Revere Fitchburg Brookline New Bedford
93 Obs Code District # of Students Percent Mean Years to Transitioning Salem Fall River Marlborough Waltham Haverhill Methuen Leominster Chicopee Peabody Cambridge Lexington West Springfield Medford Watertown Attleboro Westfield Randolph Pittsfield Woburn Westborough Lawrence Family Development Charter
94 Obs Code District # of Students Percent Mean Years to Transitioning Milford Southbridge Lowell Community Charter Public Arlington Norwood Taunton Barnstable Shrewsbury Stoughton Amherst Clinton Dennis-Yarmouth Winchester Greater Lowell Regional Vocational Technical Braintree Seven Hills Charter Public Hudson Dedham Weymouth
95 Obs Code District # of Students Percent Mean Years to Transitioning Agawam Chelmsford Andover Belmont Community Day Charter Public Walpole Melrose Gardner Acton Billerica Burlington Sharon Amherst-Pelham Ashland Saugus Gloucester Wellesley Winthrop Wachusett North Andover Northborough
96 Obs Code District # of Students Percent Mean Years to Transitioning Northeast Metropolitan Regional Vocational Technical Nantucket South Middlesex Regional Vocational Technical Swampscott Auburn Franklin Needham Greenfield Weston Bedford Dracut Mansfield Abby Kelley Foster Charter Public Northampton Stoneham Webster Boston Renaissance Charter Public
97 Obs Code District # of Students Percent Mean Years to Transitioning Dudley-Charlton Regional Greater Lawrence Regional Vocational Technical Westford Plymouth Southborough Beverly Canton Ludlow Easthampton Natick Barnstable Horace Mann Charter Ayer (non-op) Harwich Dartmouth North Attleborough Holyoke Community Charter Falmouth Prospect Hill Academy Charter
98 Obs Code District # of Students Percent Mean Years to Transitioning Easton Milton Holliston Rockland Westwood Holbrook Longmeadow Maynard Hamilton-Wenham Concord Hopkinton Gill-Montague Uxbridge Danvers Barnstable Community Horace Mann Charter Public Foxborough Regional Charter Roxbury Preparatory Charter Lincoln
99 Obs Code District # of Students Percent Mean Years to Transitioning Tisbury City On A Hill Charter Public Silver Hill Horace Mann Charter KIPP Academy Lynn Charter Martin Luther King Jr. Charter School of Excellence Bellingham Academy Of the Pacific Rim Charter Public Hampden- Wilbraham Belchertown Marshfield Benjamin Banneker Charter Public Acton-Boxborough Berkshire Hills Assabet Valley Regional Vocational Technical
100 Obs Code District # of Students Percent Mean Years to Transitioning Marblehead Wilmington Sabis International Charter Bridgewater- Raynham Phoenix Charter Academy Nashoba Leicester North Adams Palmer Seekonk Tewksbury Wakefield MATCH Charter Public School Triton Edgartown Hadley Sudbury Greater New Bedford Regional Vocational Technical
101 Obs Code District # of Students Percent Mean Years to Transitioning Wayland Excel Academy Charter Salem Academy Charter Littleton Reading Conservatory Lab Charter Southeastern Regional Vocational Technical Middleborough Millbury Oak Bluffs Shirley (non-op) Montachusett Regional Vocational Technical Mashpee Middleton Oxford Boston Preparatory Charter Public Neighborhood House Charter
102 Obs Code District # of Students Percent Mean Years to Transitioning Martha s Vineyard North Middlesex Lee Smith Leadership Academy Charter Public Community Charter School of Cambridge Spirit of Knowledge Charter School Southwick-Tolland Newburyport Ashburnham- Westminster Blackstone-Millville Amesbury Grafton Granby Ipswich Scituate Athol-Royalston Groton-Dunstable Mendon-Upton
103 Obs Code District # of Students Percent Mean Years to Transitioning Chatham Northbridge North Reading Wareham Westport Foxborough Winchendon Whittier Regional Vocational Technical Abington Boylston Carlisle South Hadley Swansea Ware Advanced Math and Science Academy Charter Spencer-E Brookfield Williamstown Edward M. Kennedy Academy for Health Careers (Horace Mann Charter)
104 Obs Code District # of Students Percent Mean Years to Transitioning New Leadership Charter Dighton-Rehoboth Northboro- Southboro Cape Cod Regional Vocational Technical Lunenburg North Central Charter Essential Pioneer Charter School of Science Hampden Charter School of Science Frontier Gateway Brewster Dover Hanover Hingham Lenox Medway Wrentham
105 Obs Code District # of Students Percent Mean Years to Transitioning Boston Day and Evening Academy Charter Boston Collegiate Charter Nauset Minuteman Regional Vocational Technical Hopedale Monson Christa McAuliffe Regional Charter Public Lincoln-Sudbury Ralph C Mahar Whitman-Hanson East Bridgewater Northampton-Smith Vocational Agricultural Hill View Montessori Charter Public Lowell Middlesex Academy Charter Concord-Carlisle
106 Obs Code District # of Students Percent Mean Years to Transitioning Blue Hills Regional Vocational Technical Avon Boxborough Deerfield Fairhaven Medfield Provincetown West Boylston Innovation Academy Charter Dorchester Collegiate Academy Charter Southern Berkshire Up-Island Regional Southern Worcester County Regional Vocational Technical East Longmeadow Norwell Rockport Sandwich E. Brooke Charter
107 Obs Code District # of Students Percent Mean Years to Transitioning Mystic Valley Regional Charter Dover-Sherborn Mohawk Trail North Shore Regional Vocational Technical Sunderland Martha's Vineyard Charter Adams-Cheshire Freetown-Lakeville King Philip Manchester Essex Regional Masconomet Pentucket Bristol-Plymouth Regional Vocational Technical Greater Fall River Regional Vocational Technical Boxford Carver Harvard
108 Obs Code District # of Students Percent Mean Years to Transitioning Hull Lynnfield North Brookfield Norton Orange Orleans Rochester Southampton Central Berkshire Narragansett Blackstone Valley Regional Vocational Technical Acushnet Berlin Georgetown Kingston Lanesborough Mattapoisett Pembroke Somerset Sturbridge Tyngsborough
109 Obs Code District # of Students Percent Mean Years to Transitioning West Bridgewater Williamsburg Codman Academy Charter Public Benjamin Franklin Classical Charter Public South Shore Charter Public Atlantis Charter Global Learning Charter Public Berlin-Boylston Mount Greylock Quabbin Tantasqua Quaboag Regional Bourne Clarksburg Conway Duxbury Eastham
110 Obs Code District # of Students Percent Mean Years to Transitioning Freetown (non-op) Holland Marion Millis Pelham Sherborn Topsfield Wales Gloucester Community Arts Charter Hilltown Cooperative Charter Public Marblehead Community Charter Public Ma Academy for Math and Science Pioneer Valley Performing Arts Charter Public Pioneer Valley Chinese Immersion Charter Hampshire Hawlemont
111 Obs Code District # of Students Percent Mean Years to Transitioning Old Rochester Silver Lake Franklin County Regional Vocational Technical Nashoba Valley Regional Vocational Technical Tri County Regional Vocational Technical Essex Agricultural Technical Norfolk County Agricultural
112 Appendix III A 2010 MCAS Proportion Proficient of and Non- Students Code District # of Eligible Students Math - Math - Non ELA - ELA - Non 0001 Abington Acton Acushnet Agawam Amesbury Amherst Andover Arlington Ashland Attleboro Auburn Avon Ayer (non-op) Barnstable Bedford Belchertown Bellingham Belmont Berlin Beverly Billerica Boston 7,
113 Code District # of Eligible Students Math - Math - Non ELA - ELA - Non 0037 Boxborough Boxford Boylston Braintree Brewster Brockton 1, Brookline Burlington Cambridge Canton Carlisle Carver Chatham Chelmsford Chelsea Chicopee Clarksburg Clinton Concord Danvers Dartmouth Dedham Deerfield Douglas
114 Code District # of Eligible Students Math - Math - Non ELA - ELA - Non 0078 Dover Dracut Duxbury East Bridgewater Easthampton East Longmeadow Easton Edgartown Everett Fairhaven Fall River Falmouth Fitchburg Foxborough Framingham Franklin Freetown (non-op) Gardner Gloucester Grafton Granby Greenfield Hadley
115 Code District # of Eligible Students Math - Math - Non ELA - ELA - Non 0122 Hanover Harvard Harwich Haverhill Hingham Holbrook Holland Holliston Holyoke Hopedale Hopkinton Hudson Hull Ipswich Kingston Lanesborough Lawrence 1, Lee Leicester Lenox Leominster Lexington Lincoln Littleton
116 Code District # of Eligible Students Math - Math - Non ELA - ELA - Non 0159 Longmeadow Lowell 2, Ludlow Lunenburg Lynn 1, Lynnfield Malden Mansfield Marblehead Marion Marlborough Marshfield Mashpee Maynard Medfield Medford Medway Melrose Methuen Middleboroug Middleton Milford Millbury Milton
117 Code District # of Eligible Students Math - Math - Non ELA - ELA - Non 0191 Monson Nantucket Natick Needham New Bedford Newburyport Newton North Adams Northampton North Andover North Attleborough Northboroug Northbridge North Brookfield North Reading Norwell Norwood Oak Bluffs Orleans Oxford Palmer Peabody Pelham
118 Code District # of Eligible Students Math - Math - Non ELA - ELA - Non 0231 Pembroke Pittsfield Plymouth Provincetown Quincy Randolph Reading Revere Rochester Rockland Rockport Salem Sandwich Saugus Scituate Seekonk Sharon Shirley (nonop) Shrewsbury Somerville Southampton Southboroug Southbridge South Hadley
119 Code District # of Eligible Students Math - Math - Non ELA - ELA - Non 0281 Springfield 1, Stoneham Stoughton Sudbury Swampscott Swansea Taunton Tewksbury Tisbury Tyngsboroug Uxbridge Wakefield Walpole Waltham Ware Wareham Watertown Wayland Webster Wellesley Westborough West Boylston West Bridgewater Westfield
120 Code District # of Eligible Students Math - Math - Non ELA - ELA - Non 0326 Westford Weston Westport West Springfield Westwood Weymouth Williamstown Wilmington Winchendon Winchester Winthrop Woburn Worcester 3, Wrentham Northampton- Smith Vocational Agricultural 0410 Excel Academy Charter 0412 Academy Of the Pacific Rim Charter Public 0414 Berkshire Arts Technology Charter Public
121 Code District # of Eligible Students Math - Math - Non ELA - ELA - Non 0416 Boston Preparatory Charter Public 0418 Christa McAuliffe Regional Charter Public 0419 Smith Leadership Academy Charter Public 0420 Benjamin Banneker Charter Public 0423 Barnstable Horace Mann Charter 0424 Boston Day and Evening Academy Charter 0427 Barnstable Community Horace Mann Charter Public 0428 Edward Brooke Charter 0429 KIPP Academy Lynn Charter
122 Code District # of Eligible Students Math - Math - Non ELA - ELA - Non 0430 Advanced Math and Science Academy Charter Innovation Academy Charter 0436 Community Charter School of Cambridge 0437 City On A Hill Charter Public 0439 Conservatory Lab Charter 0440 Community Day Charter Public 0441 Sabis International Charter 0444 Neighborhd House Charter 0445 Abby Kelley Foster Charter Public 0446 Foxborough Regional Charter
123 Code District # of Eligible Students Math - Math - Non ELA - ELA - Non 0448 Gloucester Community Arts Charter 0449 Boston Collegiate Charter 0452 Edward M. Kennedy Academy for Health Careers (Horace Mann Charter 0453 Holyoke Community Charter 0454 Lawrence Family Development Charter 0455 Hill View Montessori Charter Public 0456 Lowell Community Charter Public 0458 Lowell Middlesex Academy Charter 0464 Marblehead Community Charter Public
124 Code District # of Eligible Students Math - Math - Non ELA - ELA - Non 0466 Martha's Vineyard Charter 0469 MATCH Charter Public School 0470 Mystic Valley Regional Charter 0471 New Leadership Charter 0474 North Central Charter Essential 0475 Dorchester Collegiate Academy Charter 0476 Spirit of Knowledge Charter School 0477 Silver Hill Horace Mann Charter 0479 Pioneer Valley Performing Arts Charter Public/District
125 Code District # of Eligible Students Math - Math - Non ELA - ELA - Non 0481 Boston Renaissance Charter Public/District Roxbury Preparatory Charter 0485 Salem Academy Charter 0486 Seven Hills Charter Public 0487 Prospect Hill Academy Charter 0488 South Shore Charter Public 0491 Atlantis Charter 0492 Martin Luther King Jr. Charter School of Excellence 0493 Phoenix Charter Academy 0494 Pioneer Charter School of Science
126 Code District # of Eligible Students Math - Math - Non ELA - ELA - Non 0496 Global Learning Charter Public 0499 Hampden Charter School of Science 0600 Acton- Boxborough 0603 Adams- Cheshire 0605 Amherst- Pelham 0610 Ashburnham- Westminster 0615 Athol- Royalston Berkshire Hills Berlin- Boylston 0622 Blackstone- Millville 0625 Bridgewater- Raynham 0635 Central Berkshire 0640 Concord- Carlisle 0645 Dennis- Yarmouth 0650 Dighton- Rehoboth
127 Code District # of Eligible Students Math - Math - Non ELA - ELA - Non 0655 Dover- Sherborn 0658 Dudley- Charlton Regional Nauset Freetown- Lakeville Frontier Gateway Groton- Dunstable Gill-Montague Hamilton- Wenham 0680 Hampden- Wilbraham Hampshire Hawlemont King Philip Lincoln- Sudbury 0698 Manchester Essex Regional 0700 Martha s Vineyard Masconomet Mendon- Upton Mt Greylock
128 Code District # of Eligible Students Math - Math - Non ELA - ELA - Non 0717 Mohawk Trail Narragansett Nashoba Northboro- Southboro 0735 North Middlesex Old Rochester Pentucket Quabbin Ralph C Mahar 0765 Southern Berkshire 0766 Southwick- Tolland 0767 Spencer-E Brookfield Tantasqua Triton Up-Island Regional Wachusett Quaboag Regional 0780 Whitman- Hanson 0801 Assabet Valley Regional Vocational
129 Code District # of Eligible Students Math - Math - Non ELA - ELA - Non 0806 Blue Hills Regional Vocational Technical 0810 Bristol- Plymouth Regional Vocational Technical 0815 Cape Cod Regional Vocational Technical 0823 Greater Lawrence Regional Vocational Technical 0825 Greater New Bedford Regional Vocational Technical 0828 Greater Lowell Regional Vocational Technical 0829 South Middlesex Regional Vocational Technical 0832 Montachusett Regional Vocational Technical 0853 Northeast Metropolitan Regional Vocational Technical
130 Code District # of Eligible Students Math - Math - Non ELA - ELA - Non 0872 Southeastern Regional Vocational Technical 0876 Southern Worcester County Regional Vocational Technical 0885 Whittier Regional Vocational Technical 0915 Norfolk County Agricultural
131 Appendix IV A List of Districts with 2007 Transition Rate Information 10 or more students Code District Name Transition- Years Group Transition Percent 2007 All LEP Mean Years LEP Mean Years of Students 0002 Acton High Trans - High Years 0005 Agawam High Trans Amherst Low Trans Andover High Trans Arlington High Trans Ashland Low Trans Attleboro High Trans Auburn High Trans - High Years 0019 Ayer (non-op) Low Trans Barnstable High Trans Bedford High Trans Belchertown High Trans Bellingham High Trans - High Years 0026 Belmont High Trans
132 Code District Name Transition- Years Group Transition Percent 2007 All LEP Mean Years LEP Mean Years of Students 0030 Beverly High Trans Billerica High Trans Boston Low Trans Braintree High Trans Brockton Low Trans - High Years 0046 Brookline High Trans Burlington High Trans Cambridge High Trans Canton High Trans Chatham High Trans Chelmsford High Trans - High Years 0057 Chelsea High Trans Chicopee High Trans - High Years 0064 Clinton High Trans Concord High Trans Danvers High Trans , , ,
133 Code District Name Transition- Years Group Transition Percent 2007 All LEP Mean Years LEP Mean Years of Students 0072 Dartmouth Low Trans Dedham High Trans Dracut High Trans Easthampton High Trans Easton High Trans Edgartown Low Trans Everett High Trans Fall River High Trans Falmouth High Trans - High Years 0097 Fitchburg High Trans - High Years 0099 Foxborough High Trans Framingham High Trans - High Years 0101 Franklin High Trans Gardner High Trans Gloucester Low Trans Grafton High Trans , ,
134 Code District Name Transition- Years Group Transition Percent 2007 All LEP Mean Years LEP Mean Years of Students 0114 Greenfield High Trans Harwich High Trans - High Years 0128 Haverhill Low Trans Holbrook High Trans Holyoke Low Trans - High Years 0139 Hopkinton High Trans - High Years 0141 Hudson Low Trans - High Years 0144 Ipswich High Trans Lawrence High Trans Lee High Trans - High Years 0151 Leicester High Trans - High Years 0153 Leominster Low Trans Lexington High Trans Lincoln Low Trans Longmeadow High Trans Lowell Low Trans - High Years , , ,
135 Code District Name Transition- Years Group Transition Percent 2007 All LEP Mean Years LEP Mean Years of Students 0161 Ludlow High Trans Lynn Low Trans - High Years 0165 Malden High Trans Mansfield High Trans Marblehead Low Trans Marlborough High Trans - High Years 0171 Marshfield High Trans - High Years 0174 Maynard Low Trans Medford High Trans - High Years 0178 Melrose High Trans Methuen High Trans Milford High Trans Milton High Trans - High Years 0191 Monson High Trans Nantucket Low Trans - High Years 0198 Natick High Trans ,
136 Code District Name Transition- Years Group Transition Percent 2007 All LEP Mean Years LEP Mean Years of Students 0199 Needham High Trans New Bedford High Trans - High Years 0207 Newton High Trans North Adams Low Trans - High Years 0210 Northampton High Trans North Andover High Trans North Attleborough High Trans Northborough Low Trans Northbridge High Trans North Reading High Trans Norwood High Trans Oak Bluffs Low Trans Oxford High Trans Palmer High Trans Peabody Low Trans Pittsfield Low Trans - High Years
137 Code District Name Transition- Years Group Transition Percent 2007 All LEP Mean Years LEP Mean Years of Students 0239 Plymouth High Trans Provincetown High Trans - High Years 0243 Quincy High Trans - High Years 0244 Randolph Low Trans Reading High Trans - High Years 0248 Revere High Trans Rockland Low Trans - High Years 0258 Salem Low Trans - High Years 0262 Saugus High Trans Scituate Low Trans - High Years 0266 Sharon High Trans Shrewsbury High Trans Somerville Low Trans - High Years 0276 Southborough High Trans Southbridge Low Trans South Hadley High Trans - High Years ,
138 Code District Name Transition- Years Group Transition Percent 2007 All LEP Mean Years LEP Mean Years of Students 0281 Springfield High Trans - High Years 0284 Stoneham High Trans Stoughton High Trans - High Years 0288 Sudbury High Trans Swampscott High Trans Taunton High Trans Tewksbury Low Trans - High Years 0296 Tisbury High Trans Uxbridge Low Trans Wakefield High Trans Walpole Low Trans Waltham High Trans Watertown High Trans - High Years 0315 Wayland High Trans - High Years 0316 Webster High Trans Wellesley Low Trans ,
139 Code District Name Transition- Years Group Transition Percent 2007 All LEP Mean Years LEP Mean Years of Students 0321 Westborough Low Trans Westfield High Trans - High Years 0326 Westford High Trans Weston High Trans West Springfield High Trans Westwood High Trans Weymouth High Trans Wilmington High Trans Winchendon High Trans Winchester High Trans Winthrop Low Trans - High Years 0347 Woburn Low Trans Worcester High Trans - High Years , Excel Academy Charter 0418 Christa McAuliffe Regional Charter Public High Trans - High Years Low Trans - High Years
140 Code District Name Transition- Years Group Transition Percent 2007 All LEP Mean Years LEP Mean Years of Students 0420 Benjamin Banneker Charter Public 0423 Barnstable Horace Mann Charter 0428 Edward Brooke Charter 0429 KIPP Academy Lynn Charter 0436 Community Charter School of Cambridge 0439 Conservatory Lab Charter 0440 Community Day Charter Public 0445 Abby Kelley Foster Charter Public 0453 Holyoke Community Charter 0454 Lawrence Family Development Charter 0456 Lowell Community Charter Public 0458 Lowell Middlesex Academy Charter High Trans - High Years High Trans - High Years High Trans - High Trans - High Years High Trans - High Years Low Trans - High Years High Trans - High Trans - High Trans - High Years High Trans - High Trans - High Years High Trans
141 Code District Name Transition- Years Group Transition Percent 2007 All LEP Mean Years LEP Mean Years of Students 0481 Boston Renaissance Charter Public 0485 Salem Academy Charter 0486 Seven Hills Charter Public 0487 Prospect Hill Academy Charter High Trans - High Trans - High Years Low Trans - High Trans High Trans - High Years 0600 Acton-Boxborough High Trans Amherst-Pelham High Trans - High Years 0615 Athol-Royalston Low Trans - High Years 0618 Berkshire Hills High Trans - High Years 0645 Dennis-Yarmouth Low Trans - High Years Dudley-Charlton Reg Low Trans - High Years Gill-Montague High Trans - High Years Hampden- Wilbraham High Trans Martha s Vineyard Low Trans Nashoba High Trans
142 Code District Name Transition- Years Group Transition Percent 2007 All LEP Mean Years LEP Mean Years of Students 0730 Northboro- Southboro Low Trans Triton High Trans Wachusett High Trans Assabet Valley Regional Vocational Technical 0821 Greater Fall River Regional Vocational Technical 0823 Greater Lawrence Regional Vocational Technical 0825 Greater New Bedford Regional Vocational Technical 0828 Greater Lowell Regional Vocational Technical 0829 South Middlesex Regional Vocational Technical 0832 Montachusett Regional Vocational Technical 0853 Northeast Metropolitan Regional Vocational High Trans - High Years High Trans - High Trans - High Trans - High Years High Trans - High Years High Trans - High Years High Trans - High Years High Trans - High Years
143 Code District Name Transition- Years Group Transition Percent 2007 All LEP Mean Years LEP Mean Years of Students 0872 Southeastern Regional Vocational Technical 0885 Whittier Regional Vocational Technical High Trans - High Years High Trans - High Years
144 Appendix V A: Matching of Students in the MEPA and Core SIMS file Students classified as LEP in SIMS file but not found in MEPA file The SIMS file contains 67,632 students enrolled in school in the fall of the school year who were classified as LEP at some point during the school year. Of these LEP students, 59,432 (87.9 percent) participated in one of the five MEPA grade span tests administered in spring The remaining 8,200 students (12.1 percent) did not participate in MEPA. 1,747 (21.3 percent) of the 8,200 were enrolled in pre kindergarten and not required to participate in MEPA. An additional 5,721 (69.8 percent) of the 8,200 students were classified as LEP in the final data collection period of , but not in prior data collection periods. An addition 102 (1.2 percent) of the 8,200 students were classified as LEP in one of the two early data collection periods but were no longer classified as LEP in the final data collection period. The remaining 630 students constitute less than 1 percent of the total LEP population for the school year. They were distributed across 82 school districts in roughly the same proportions as the overall LEP population. They were distributed fairly equally across grade levels. More than one third of those students (34.3 percent) were in their first year of school in Massachusetts. Students participating in MEPA but not in the SIMS file There are 63,377 students included in the spring 2010 MEPA file. Of these students, 59,432 (93.8 percent) can be identified in the SIMS file as students classified as LEP in spring 2010 and enrolled in school in the fall of the school year. The remaining 3,945 students participating in MEPA in spring 2010 do not meet one of those criteria. 2,646 (67 percent) of the 3,945 are students who were no longer enrolled in school in the fall of the school year. More than half of the no longer enrolled students (57.4 percent) were enrolled in grade 12 in spring The remaining students were distributed across grade levels with the largest single concentration at grade 9 (225 student, 8.5 percent) An additional 1,203 students (30.5 percent) were classified in the MEPA file as not enrolled in an ELL program based on data available in SIMS, and 95 students (2.4 percent) were classified as no match to SIMS under ELL program status. More than half of the 1,299 students were tested in either grade span K 2 (32.0 percent) or 3 4 (23.3 percent). More than half of the 1,299 students (53.7 percent) were first tested on MEPA in spring 2009 and 27.4 percent were in their first year of school in Massachusetts in The students were distributed across 151 school districts. 136
145 Appendix V B List of Districts with 10 or more MEPA Level 5 Students District Code District of MEPA Level 5 Students Percent Percent Prof/Adv ELA Percent Prof/Adv MATH Easthampton Fall River Wachusett Everett Lynn Seven Hills Charter Public Somerville Chelsea Waltham Lawrence Family Development Charter Ashland Billerica West Springfield Revere Weymouth Woburn Methuen New Bedford Agawam
146 District Code District of MEPA Level 5 Students Percent Percent Prof/Adv ELA Percent Prof/Adv MATH Milford Braintree Cambridge Lawrence Quincy Walpole Marlborough Salem Winthrop Bedford Leominster Chelmsford Amherst-Pelham Webster Wellesley Clinton Bellingham Andover Sharon Acton Belmont Watertown
147 District Code District of MEPA Level 5 Students Percent Percent Prof/Adv ELA Percent Prof/Adv MATH Northeast Metropolitan Regional Vocational Technical Norwood Shrewsbury Westfield Brookline Taunton Barnstable Malden Medford Lexington North Reading Community Day Charter Public Peabody Boston 1, Longmeadow Melrose Haverhill Lincoln Amherst Weston Winchester
148 District Code District of MEPA Level 5 Students Percent Percent Prof/Adv ELA Percent Prof/Adv MATH Stoughton Canton Holyoke Springfield Attleboro Southborough Newton Hudson Fitchburg Westborough Barnstable Horace Mann Charter Chicopee Brockton Westwood Arlington Framingham Northborough Pittsfield Worcester 1, Dracut Swampscott Dennis-Yarmouth
149 District Code District of MEPA Level 5 Students Percent Percent Prof/Adv ELA Percent Prof/Adv MATH Lowell 1, Hamilton-Wenham Gloucester Stoneham Gardner Uxbridge Natick Lowell Community Charter Public Saugus Randolph Dedham Greenfield Harwich
For Immediate Release: Thursday, July 19, 2012 Contact: Jim Polites 860.713.6525
 For Immediate Release: Thursday, July 19, 2012 Contact: Jim Polites 860.713.6525 2012 CMT, CAPT RESULTS SHOW SOME INCREASES, WHILE GAPS IN ACHIEVEMENT PERSIST The Connecticut State Department of Education
Characteristics of Colorado s Online Students
 Characteristics of Colorado s Online Students By: Amanda Heiney, Dianne Lefly and Amy Anderson October 2012 Office of Online & Blended Learning 201 E. Colfax Ave., Denver, CO 80203 Phone: 303-866-6897
CHARTER SCHOOL PERFORMANCE IN INDIANA. credo.stanford.edu
 CHARTER SCHOOL PERFORMANCE IN INDIANA credo.stanford.edu March 2011 TABLE OF CONTENTS INTRODUCTION... 3 CHARTER SCHOOL IMPACT BY STUDENTS YEARS OF ENROLLMENT AND AGE OF SCHOOL... 6 DISTRIBUTION OF CHARTER
CHARTER SCHOOL PERFORMANCE IN PENNSYLVANIA. credo.stanford.edu
 CHARTER SCHOOL PERFORMANCE IN PENNSYLVANIA credo.stanford.edu April 2011 TABLE OF CONTENTS INTRODUCTION... 3 DISTRIBUTION OF CHARTER SCHOOL PERFORMANCE IN PENNSYLVANIA... 7 CHARTER SCHOOL IMPACT BY DELIVERY
Maine High School Graduates: Trends in College-Going, Persistence, and Completion August 2015
 Maine High School Graduates: Trends in College-Going, Persistence, and Completion August 2015 This report summarizes data from the Maine Department of Education (DOE) and the National Student Clearinghouse
Allen Elementary School
 Allen Elementary School April 4, 216 Dear Parents and Community Members: We are pleased to present you with the (AER), which provides key information on the 214-15 educational progress for the. The AER
WORLD S BEST WORKFORCE PLAN
 WORLD S BEST WORKFORCE PLAN ANNUAL REPORT 2014 2015 School Year South Early Learning Center, North Intermediate, Saint Peter Middle/High School 1 Saint Peter Public Schools World s Best Workforce Report
St. Paul Children s Collabora4ve. Youth Master Plan Data Update 2014
 St. Paul Children s Collabora4ve Youth Master Plan Data Update 2014 SIX GOALS Learn: Children are ready for Kindergarten Children are reading by third grade Grow: Children have health care coverage Children
Chapter 5 English Language Learners (ELLs) and the State of Texas Assessments of Academic Readiness (STAAR) Program
 and the State of Texas Assessments of Academic Readiness (STAAR) Program") Chapter 5 English Language Learners (ELLs) and the State of Texas Assessments of Academic Readiness (STAAR) Program Demographic projections indicate that the nation s English language learner (ELL) student
Chapter 5 English Language Learners (ELLs) and the State of Texas Assessments of Academic Readiness (STAAR) Program Demographic projections indicate that the nation s English language learner (ELL) student
Review of Special Education in the Commonwealth of Massachusetts
 Review of Special Education in the Commonwealth of Massachusetts Thomas Hehir and Associates Thomas Hehir, Todd Grindal and Hadas Eidelman Boston, Massachusetts April 2012 Report commissioned by the Massachusetts
Undergraduate Degree Completion by Age 25 to 29 for Those Who Enter College 1947 to 2002
 Undergraduate Degree Completion by Age 25 to 29 for Those Who Enter College 1947 to 2002 About half of those who start higher education have completed a bachelor's degree by the ages of 25 to 29 years.
MCAS Performance Appeal Application
 MCAS Performance Appeal Application 2015-2016 Introduction This application must be completed and submitted with all MCAS performance appeals, including cohort, portfolio, and transcript appeals. Please
Application for a Massachusetts Public Charter School: Proposed Commonwealth or Horace Mann Charter School By a New Operator 2015-2016
 Application for a Massachusetts Public Charter School: Proposed Commonwealth or Horace Mann Charter School By a New Operator 2015-2016 Massachusetts Department of Elementary and Secondary Education 75
Springfield Public Schools English Language Learner Recommended Actions and Implementation Plans
 Springfield Public Schools English Language Learner Recommended Actions and Implementation Plans Dr Alan J Ingram, Superintendent September 2010 Prepared for Springfield Public Schools by Rosann Tung,
RELATIONSHIP BETWEEN THE PATTERN OF MATHEMATICS AND SCIENCE COURSES TAKEN AND TEST SCORES ON ITED FOR HIGH SCHOOL JUNIORS
 RELATIONSHIP BETWEEN THE PATTERN OF AND COURSES TAKEN AND TEST SCORES ON FOR HIGH SCHOOL JUNIORS Xiaoping Wang, Administrative Consultant Abstract Three years of student-level data were used in this study
YEAR 3 REPORT: EVOLUTION OF PERFORMANCE MANAGEMENT ALBANY NY CHARTER SCHOO CHARTER SCHOOL PERFORMANCE IN ARIZONA. credo.stanford.edu.
 YEAR 3 REPORT: EVOLUTION OF PERFORMANCE MANAGEMENT CHARTER SCHOOL PERFORMANCE IN ARIZONA IN credo.stanford.edu ALBANY NY CHARTER SCHOO June 2009 INTRODUCTION This report supplements the CREDO National
A Matched Study of Washington State 10th Grade Assessment Scores of Students in Schools Using The Core-Plus Mathematics Program
 A ed Study of Washington State 10th Grade Assessment Scores of Students in Schools Using The Core-Plus Mathematics Program By Reggie Nelson Mathematics Department Chair Burlington-Edison School District
Who is Aurora? Supplement A: Education. An Overview of demographic and social data and trends
 Who is Aurora? An Overview of demographic and social data and trends Supplement A: City of Aurora Planning and Development Services December 2010 City of Aurora Planning & Development Services Department
Fall headcount enrollments in graduate level engineering programs within the State University System of Florida increased from 2,771 to 5,638 between
 1 2 In the fall of 1996 enrollment in graduate level engineering programs at all universities in Florida, including private and for profit universities, was 4,007. In the fall of 2012, enrollment increased
AMERICA S High School Graduates
 U.S. Department of Education NCES 2011-462 AMERICA S High School Graduates results of the 2009 naep high school transcript study What is the High School Transcript Study? The High School Transcript Study
YEAR 3 REPORT: EVOLUTION OF PERFORMANCE MANAGEMENT ALBANY NY CHARTER SCHOO CHARTER SCHOOL PERFORMANCE IN NEW YORK CITY. credo.stanford.
 YEAR 3 REPORT: EVOLUTION OF PERFORMANCE MANAGEMENT CHARTER SCHOOL PERFORMANCE IN NEW YORK CITY IN credo.stanford.edu ALBANY NY CHARTER SCHOO January 2010 SUMMARY This report supplements the CREDO National
ILLINOIS SCHOOL REPORT CARD
 5-8-9-6- MASCOUTAH ELEM SCHOOL MASCOUTAH C U DISTRICT 9 MASCOUTAH, ILLINOIS GRADES : PK K 5 6 MASCOUTAH ELEM SCHOOL ILLINOIS SCHOOL REPORT CARD and federal laws require public school districts to release
YEAR 3 REPORT: EVOLUTION OF PERFORMANCE MANAGEMENT ALBANY NY CHARTER SCHOO CHARTER SCHOOL PERFORMANCE IN FLORIDA. credo.stanford.edu.
 YEAR 3 REPORT: EVOLUTION OF PERFORMANCE MANAGEMENT CHARTER SCHOOL PERFORMANCE IN FLORIDA IN credo.stanford.edu ALBANY NY CHARTER SCHOO June 2009 INTRODUCTION This report supplements the CREDO National
South Dakota DOE 2013-2014 Report Card
 School Classification: Focus Title I Designation: Schoolwide Performance Indicators * No bar will display at the school or district level if the subgroup does not meet minimum size for reporting purposes.
JEFFREY A. LOWE, ESQ. Global Practice Leader - Law Firm Practice Managing Partner - Washington, D.C.
 JEFFREY A. LOWE, ESQ. Global Practice Leader - Law Firm Practice Managing Partner - Washington, D.C. TABLE OF CONTENTS Background... 4 The Survey... 4 Methodology... 5 Statistical Terms Used... 6 Key Findings...
State Assessments 2015: MCAS or PARCC? William H. Lupini Superintendent of Schools Thursday, May 22, 2014
 State Assessments 2015: MCAS or PARCC? William H. Lupini Superintendent of Schools Thursday, May 22, 2014 Massachusetts Plan for a Two Year Test Drive of PARCC 2013 BESE votes on 2-year test drive Mar-June
Report to the 79 th Legislature. Use of Credit Information by Insurers in Texas
 Report to the 79 th Legislature Use of Credit Information by Insurers in Texas Texas Department of Insurance December 30, 2004 TABLE OF CONTENTS Executive Summary Page 3 Discussion Introduction Page 6
MCPS Graduates Earning College Degrees in STEM-Related Fields
 Graduates Earning College Degrees in -Related Fields September 2012 Natalie Wolanin & Julie Wade OFFICE OF SHARED ACCOUNTABILITY Adrian B. Talley, Associate Superintendent 850 Hungerford Drive Rockville,
2012 13 Academic Performance Index Reports
 2012 13 Accountability Progress Reporting System 2012 13 Academic Performance Index Reports Information Guide May 2013 Prepared by the California Department of Education Available online at: http://www.cde.ca.gov/ta/ac/ap/
2015 TRENDS IN THE SUPPLY OF ACCOUNTING GRADUATES AND THE DEMAND FOR PUBLIC ACCOUNTING RECRUITS
 2015 TRENDS IN THE SUPPLY OF ACCOUNTING GRADUATES AND THE DEMAND FOR PUBLIC ACCOUNTING RECRUITS By AICPA Students, Academics & Inclusion CX Act Copyright 2015 American Institute of. All right reserved.
Prepared by: Andrew Sum Walter McHugh Jacqui Motroni Sheila Palma. Center for Labor Market Studies Northeastern University Boston, Massachusetts
 High School Graduation Outcomes and College Enrollment Plans of Class of 2009 High School Students by Gender in The City of Boston and Selected Large Urban and Affluent School Districts Across the State
66.1 59.9. District: LITTLESTOWN AREA SD AUN: 112015203 Test Date: PSSA Spring 2015. English Language Arts. Mathematics 46.8 39.7. Science 75.5 67.
 PENNSYLVANIA System of School Assessment (PSSA) Summary Report Dear Leader: This report provides you with information about your district's performance in English Language Arts, Mathematics, and Science
Colorado Springs School District 11
 Colorado Springs School District 11 Colorado Superintendent: Dr. Sharon A. Thomas Primary contact: Holly Brilliant, Title I facilitator 29,625 students, K-12, urban District Description Colorado Springs
Special Education Population Trends
 Special Education Population Trends Acton-Boxborough Consolidated* District 2004-2014 September 22, 2014 * The term AB Consolidated or similar refers to the combination of Acton, Boxborough, and Acton-
The Outcomes For CTE Students in Wisconsin
 Promoting Rigorous Career and Technical Education Programs of Study Quantitative Outcomes Study: Baseline Data Collection Report Prepared under contract to Division of Academic and Technical Education
Graduate Admission Application
 For applicants seeking Master s / Specialist Degree, or Post-Baccalaureate / Post-Master s Certificate Graduate Admission Application Office of Admissions, Box 1047, Edwardsville, Illinois 62026-1047,
2015 TRENDS IN THE SUPPLY OF ACCOUNTING GRADUATES AND THE DEMAND FOR PUBLIC ACCOUNTING RECRUITS
 2015 TRENDS IN THE SUPPLY OF ACCOUNTING GRADUATES AND THE DEMAND FOR PUBLIC ACCOUNTING RECRUITS By AICPA Students, Academics & Inclusion CX Act Copyright 2015 American Institute of CPAs. All right reserved.
State of New Jersey 2014-15
 Page 1 of 22 OVERVIEW COUNTY VOCATIONAL GRADE SPAN 0912 1.00 313995050 WAYNE, NJ 074702210 The New Jersey Department of Education (NJDOE) is pleased to present these annual reports of Performance. These
Bangor Central Elementary School 2014-2015 Annual Education Report
 Bangor Central Elementary School 24-25 Melissa Vrable; Principal March 23, 26 Dear Parents and Community Members: We are pleased to present you with the (AER) which provides key information on the 24 5
Iowa School District Profiles. Central City
 Iowa School District Profiles Overview This profile describes enrollment trends, student performance, income levels, population, and other characteristics of the Central City public school district. The
Texas Education Agency 2014 15 Federal Report Card for Texas Public Schools
 Part I: Student Achievement by Proficiency Level Texas Education Agency 2014 15 Federal Report Card for Texas Public Schools Campus Name: AIKIN EL Campus ID: 057916135 District Name: RICHARDSON ISD This
New York State Profile
 New York State Profile Jennifer Guinn EDUC 547 FALL 2008 According to 2006 U.S. Census estimates, with a total population of over 19 million people, 20 percent of New York State s population were foreign-born
Name: Office of Graduate Admission Loyola University Maryland 2034 Greenspring Drive Timonium, MD 21093
 Application Procedures and Inventory Listing Education Name: Application Deadline: Fall Semester June 15 Spring Semester November 1 Summer Session March 15 Kodály Music Education Summer Session only May
Brazos School for Inquiry and Creativity
 English as a Second Language (ESL) January 2013 It is the policy of the Brazos School for Inquiry and Creativity not to discriminate on the basis of race, color, national origin, sex or handicap in its
Chapter 10 Federal Accountability
 Chapter 10 Federal Accountability Elementary and Secondary Education Act (ESEA) and No Child Left Behind (NCLB) The Elementary and Secondary Education Act (ESEA) was first passed by Congress in 1965 as
Achievement of Children Identified with Special Needs in Two-way Spanish/English Immersion Programs
 The Bridge: From Research to Practice Achievement of Children Identified with Special Needs in Two-way Spanish/English Immersion Programs Dr. Marjorie L. Myers, Principal, Key School - Escuela Key, Arlington,
The New York State School Report Card for C.J. Hooker Middle School in Goshen Central School District
 440601-04-0004 The New York State School Report Card for in Goshen Central School District An Overview of Academic Performance February 2000 The University of the State of New York The State Education
ILLINOIS SCHOOL REPORT CARD
 17-2-15-2-24 Lincoln Elem Clinton CUSD 15 Clinton, ILLINOIS GRADES : 2 3 2 1 3 Lincoln Elem 1 ILLINOIS SCHOOL REPORT CARD and federal laws require public school districts to release report cards to the
FALL ENROLLMENT Report 2014
 FALL ENROLLMENT Report 2014 Community Colleges www.educateiowa.gov/ccpublications/ Helping Communities Meet the Learning Needs of All Their Children and Adults Phone: 515-281-8260 Fax: 515-242-5988 www.educateiowa.gov
Massachusetts Department of Elementary and Secondary Education
 Massachusetts Department of Elementary and Secondary Education 75 Pleasant Street, Malden, Massachusetts 02148-4906 Telephone: (781) 338-3000 TTY: N.E.T. Relay 1-800-439-2370 Mitchell D. Chester, Ed.D.
An Evaluation of Kansas City Reading Programs for Turn the Page Kansas City
 February 28, 2014 An Evaluation of Kansas City Reading Programs for Turn the Page Kansas City Leigh Anne Taylor Knight, Ed. D. Hajar Aghababa, Ph. D. Jiaxi Quan, Ph.D. Pat Oslund, M.A. Technical Assistance:
Requirements for the Participation of Students with Disabilities in MCAS
 2014 2015 Update Requirements for the Participation of Students with Disabilities in MCAS Including Test Accommodations and Alternate Assessment A Guide for Educators and Parents/Guardians This document
Enrollment Projections. New York City Public Schools. 2012-13 to 2021-22. Volume II
 Enrollment Projections for the New York City Public Schools 2012-13 to 2021-22 Volume II Prepared for the New York City School Construction Authority February 2013 2 TABLE OF CO TE TS Page Executive Summary...
Progress and Promise A report on the Boston Pilot Schools Executive Summary January 2006
 Progress and Promise A report on the Boston Pilot Schools Executive Summary January 2006 Center for Collaborative Education Boston, Massachusetts New research conducted by Boston s Center for Collaborative
The Effects of Read Naturally on Grade 3 Reading: A Study in the Minneapolis Public Schools
 The Effects of Read Naturally on Grade 3 Reading: A Study in the Minneapolis Public Schools David Heistad, Ph.D. Director of Research, Evaluation, and Assessment Minneapolis Public Schools Introduction
Accountability and Virginia Public Schools
 Accountability and Virginia Public Schools 2008-2009 School Year irginia s accountability system supports teaching and learning by setting rigorous academic standards, known as the Standards of Learning
Template for Local Grantee Evaluations ISBE 21st Century Community Learning Center Program. II. Overview and History of Program
 Template for Local Grantee Evaluations ISBE 21st Century Community Learning Center Program March 2015 Each grantee must complete an annual local evaluation, which will be reviewed and incorporated into
UNH Graduate Education Department. Quarterly Assessment Report
 First Quarter Assessment Report UNH Graduate Education Department Quarterly Assessment Report First Quarter i First Quarter Assessment Report Table of Contents Introduction... Section - Purpose of the
Roger L. Putnam. Vocational Technical Academy. Admission Policy
 Roger L. Putnam Vocational Technical Academy Admission Policy This admissions Policy has been developed in accordance with the Massachusetts General Law Chapter 74 (MGL Ch. 74) and the Vocational Technical