Water Resources and the Urban Environment, Lower Charles River Watershed, Massachusetts,
|
|
|
- Blake Andrews
- 10 years ago
- Views:
Transcription
1 Water Resources and the Urban Environment, Lower Charles River Watershed, Massachusetts, By Peter K. Weiskel, Lora K. Barlow and Tomas W. Smieszek In cooperation with the U.S. Environmental Protection Agency and the Massachusetts Department of Environmental Protection Circular 1280 U.S. Department of the Interior U.S. Geological Survey

2 U.S. Department of the Interior Gale A. Norton, Secretary U.S. Geological Survey Charles G. Groat, Director U.S. Geological Survey, Reston, Virginia: 2005 For sale by U.S. Geological Survey, Information Services Box 25286, Denver Federal Center Denver, CO For more information about the USGS and its products: Telephone: ASK-USGS World Wide Web: Any use of trade, product, or firm names in this publication is for descriptive purposes only and does not imply endorsement by the U.S. Government. Although this report is in the public domain, permission must be secured from the individual copyright owners to reproduce any copyrighted materials contained within this report. Suggested citation: Weiskel, P.K., Barlow, L.K., Smieszek, T.W., 2005, Water resources and the urban environment, lower Charles River watershed, Massachusetts, : U.S. Geological Survey Circular 1280, 46 p.

3 iii Contents Introduction 1 Purpose and Scope 2 Previous Investigations 2 Landscape History 11 Bedrock Geology 11 Surficial Geology 11 Human Alteration of the Landscape 12 Filling of Back Bay 12 Other Landmaking Projects 12 Water Resources 17 Surface-Water Resources 17 Streams 17 Charles River 17 Stony Brook 20 Muddy River 20 Laundry Brook 21 Faneuil Brook 22 Other Streams 22 Ponds, Reservoirs, and Wetlands 26 Ground-Water Resources 27 Water and the Urban Environment 28 Hydrologic Effects of Urbanization 29 Factors Controlling Runoff and Recharge 29 Runoff Quality 32 Water Supply and Sewage Disposal 33 The Colonial Era 33 Public-Water Supply in the Modern Era 34 Public-Sewage Collection and Disposal in the Modern Era 34 The Main Drainage Works 35 The Back Bay Fens Sanitary Improvement 38 The 1908 Charles River Dam 40 Recent History 41 Summary 42 Acknowledgments 44 References Cited 44

4 iv Figures Maps showing: 1. Location and major tributary watersheds of the lower Charles River, Massachusetts, A plan of the town of Boston and its environs, with the lines, batteries, and encampments of the British and American armies, Lower Charles River watershed, Lower Charles River watershed, Water resources of the lower Charles River watershed Topography of the lower Charles River watershed Simplified bedrock geology of the lower Charles River watershed Surficial deposits of the lower Charles River watershed The estimated 1630 Boston shoreline, overlying a 1999 orthophotograph of Boston and surrounding areas Land-use types in the lower Charles River watershed, Photograph showing the culverting of Stony Brook at Forest Hills, about Map showing major tributary watersheds and small watershed areas of the lower Charles River Graphs showing: 13. Population of Boston, 1790 to A, Average monthly precipitation and evaporation from surface-water bodies in the lower Charles River watershed; B, average monthly temperature, city of Boston; C, average annual rainfall, simulated runoff, simulated evapotranspiration, and simulated recharge in the lower Charles River watershed A, Rainfall measured in 15-minute increments at the Watertown Dam during a storm, July 27 28, 2000; B, streamflow per unit watershed area during this storm at stream-gaging stations in the multifamily, Faneuil Brook, Laundry Brook, and Charles River watersheds; C, surficial deposits; D, average slope; and E, impervious surface area in the Laundry Brook, Faneuil Brook, and multifamily watersheds Boxplots showing quality of runoff in the Charles River at Watertown, and in major tributary streams of the lower Charles River watershed during wet-weather events, 2000: A, fecal coliform; B, total phosphorus; C, total recoverable lead Lithograph of the Boston Water Celebration on Boston Common, October 25, Map showing the Main Drainage Works sewage-collection system, Boston, Schematic of combined-sewer overflow (CSO) under dry-and wet-weather conditions Map showing the confluence of Stony Brook, Muddy River, and the Charles River, as it existed in the early 19th century, and the subsequently constructed area of the Back Bay Fens, about Photograph showing the seawall and tidal flats on the Boston side of the lower Charles River, northern Back Bay, about

5 v Tables 1. Named tributaries of the lower Charles River, Massachusetts Characteristics of watersheds that drain directly to the lower Charles River Ponds, reservoirs, and wetlands of the lower Charles River watershed. 27 Conversion Factors, Datums, and Abbreviations Multiply By To obtain acre hectare (ha) cubic foot per second (ft 3 /s) cubic meter per second (m 3 /s) cubic foot per second per square mile [(ft 3 /s)/mi 2 ] cubic meter per second per square kilometer [(m 3 /s)/km 2 ] foot (ft) meter (m) foot per second (ft/s) meter per second (m/s) inch (in.) 25.4 millimeter (mm) inch per month (in/mo) 25.4 millimeter per month (mm/mo) inch per year (in/yr) 25.4 millimeter per year (mm/yr) mile (mi) kilometer (km) million gallons (Mgal) 3,785 cubic meter (m 3 ) million gallons per day (Mgal/d) cubic meter per second (m 3 /s) square mile (mi 2 ) hectare (ha) square mile (mi 2 ) square kilometer (km 2 ) Temperature in degrees Celsius ( C) may be converted to degrees Fahrenheit ( F) as follows: F = (1.8 C) + 32 Temperature in degrees Fahrenheit ( F) may be converted to degrees Celsius ( C) as follows: C = ( F - 32) / 1.8 Vertical coordinate information is referenced to the North American Vertical Datum of 1929 (NGVD 29). Horizontal coordinate information is referenced to the North American Datum of 1983 (NAD 83). Concentrations of chemical constituents in water are given either in milligrams per liter (mg/l) or micrograms per liter (µg/l). BWSC Boston Water and Sewer Commission CRWA Charles River Watershed Association MWRA Massachusetts Water Resources Authority USEPA U.S. Environmental Protection Agency USGS U.S. Geological Survey
![02832 cubic meter per second (m 3 /s) cubic foot per second per square mile [(ft 3 /s)/mi 2 ] 0.01093 cubic meter per second per square kilometer [(m 3 /s)/km 2 ] foot (ft) 0.](/docs-images/41/7042180/images/page_5.jpg "3048 meter (m) foot per second (ft/s) 0.3048 meter per second (m/s) inch (in.) 25.4 millimeter (mm) inch per month (in/mo) 25.4 millimeter per month (mm/mo) inch per year (in/yr) 25.")
6 Eel fishing, Back Bay section of the lower Charles River, about The causeway in the background was built for the Boston & Worcester Railroad, which began serving passengers in Courtesy of T.C. Weiskel

7 Water Resources and the Urban Environment, Lower Charles River Watershed, Massachusetts, By Peter K. Weiskel, Lora K. Barlow, and Tomas W. Smieszek Introduction The Charles River, one of the Nation s most historically significant rivers, flows through the center of the Boston metropolitan region in eastern Massachusetts (fig. 1). The lower Charles River, downstream of the original head of tide in Watertown, was originally a productive estuary and important source of fish and shellfish for the Native Americans of the region. This portion of the river has an exceptionally long and colorful human history. In 1615, the explorer Captain John Smith gave the river its modern name, in honor of young Prince Charles of England. In , the Native American community of the watershed was decimated by an epidemic, after having continuously occupied the area for the previous 4,000 years. In 1630, the first large group of English settlers, led by John Winthrop, set foot on the Shawmut Peninsula at the mouth of the river (fig. 2), and established the town of Boston. In the 1630s, the first printing press, public park, public school, and college in the English colonies were all established on the banks of the Charles River. Almost immediately, the settlers of Boston and adjacent towns also began to modify the landscape and water resources of the watershed. Perhaps the most important type of landscape alteration in the watershed was the filling of the extensive salt marshes and tidal flats of the estuary downstream of Watertown (fig. 2). This landmaking activity along the lower Charles River began in the mid- 1600s, and did not conclude until the 1950s (Seasholes, 2003). In the early 20th century, the estuary mouth was dammed, creating a freshwater basin in the lower 9.5 miles of the river. A system of parks and parkways was built along the banks of the impounded river (Haglund, 2003). In addition to the mainstem river, virtually all of the remaining water resources in the watershed have also been altered. Most of the river s tributaries, for example, were culverted, or placed into tunnels, and many of the ponds and freshwater wetlands in the watershed were filled to facilitate urban development. One additional legacy of the river s long human history is pollution from industry and sewage. By 1875, a total of 43 mills were operating along the lower Charles River between Watertown Dam and Boston Harbor (Charles River Watershed Association, 2004a). Thousands of gallons of untreated sewage and industrial wastewater entered the river daily through gravity drains, posing a major threat to public health (City of Boston, 1878). Concerted efforts to address the sewage problem began in the late 1870s. By the 1960s, the water quality of the river was significantly improved, yet still not suitable for swimming, fishing, or even boating under most conditions. In 1965, the Charles River Watershed Association was organized and the call to restore the environmental quality of the river and its parklands was heard anew. Passage of the Sailboats on the Charles River, with Beacon Hill and the Boston skyline in the background, The golden dome marks the location of the Massachusetts State House. Photograph courtesy of Daniel Bersak, MIT

8 2 Water Resources and the Urban Environment, Lower Charles River Watershed, Massachusetts, Federal Clean Water Act in 1972 and the subsequent court-ordered reconstruction of the region s sewagetreatment infrastructure in the 1980s and 1990s (the Boston Harbor Cleanup ) provided additional impetus to address the river s remaining pollution problems. In 1995, the U.S. Environmental Protection Agency launched the Clean Charles 2005 Initiative, which brought together government agencies, privatesector institutions, and environmental organizations to focus on restoring the river to fishable and swimmable conditions by Earth Day This initiative has achieved substantial improvements in water quality; sewage discharges to the river, for example, have been largely eliminated. Nevertheless, it is now widely acknowledged that full attainment of water-quality standards will likely depend upon improved public understanding of the watershed, continued efforts to eliminate illicit sewage discharges to the river, and better management of the urban runoff that enters the river both directly and from its many tributary streams. Purpose and Scope This report is intended to enhance public understanding of the physical and hydrologic setting of the lower Charles River and its many tributaries, ponds, and wetlands. Although the built environment of the watershed has been studied in detail, as have the geology and other aspects of its natural environment, the water resources of the lower Charles River watershed have not been previously described in their broad physical and human context. One reason for this lack of study has been previously mentioned most of the watershed s streams, though named and mapped by the first settlers (figs. 2, 3, and 4), were placed into culverts (fig. 5) and subsequently forgotten during the period of rapid urbanization in the 19th and early 20th centuries. Although largely hidden from view, these streams continue to convey surface runoff and groundwater discharge to the Charles River, and to provide important ecological and recreational benefits. Improved public understanding of the Charles River watershed and its tributaries can be considered a vital component of the larger river restoration effort. The first section of this report (Landscape History) describes the bedrock geology of the lower Charles River watershed, the surficial deposits that cover the bedrock, and significant human alterations of the landscape. The second section (Water Resources) describes the tributaries, ponds, reservoirs, wetlands, and ground-water resources of the watershed. The final section (Water and the Urban Environment) describes how people have affected the hydrologic functioning of the water resources indirectly through land-cover change, and directly through water withdrawals and wastewater discharge. The narrative Moon Island sewage reservoirs showing houses for flushing gates, about Courtesy of the Boston Water and Sewer Commission

9 Introduction 3 concludes with a review of current (2005) efforts to restore the water quality and hydrologic functioning of the lower Charles River and its tributaries. Previous Investigations In recent decades, aspects of both the natural and built (human-modified) environments of the lower Charles River watershed have been extensively studied. Kaye (1976) and Skehan (1979, 2001) summarize the area s geologic history, and Cotton and Delaney (1975) describe the ground-water hydrology of the Shawmut (or Boston) Peninsula. Studies of the built environment include compilations of historic maps (Krieger and others (1999), research on the history of land filling in the city of Boston (Whitehill, 1968; Seasholes, 2003), and accounts of parkland development in Boston proper, along the lower Charles River, and in the metropolitan region (Zaitzevsky, 1982; Eliot and Morgan, 2000; Haglund, 2003). In 1999, the Charles River Conservancy was organized to educate the public about the built environment of the lower Charles River, and to advocate for the restoration of its parks, parkways, and bridges (Haglund, 2003; Charles River Conservancy, 2004). The history of metropolitan Boston s water-supply system another critical aspect of the built environment has been well documented (Nesson, 1983; French, 1986; Elkind, 1998; Rawson, 2004), and the development of its wastewater infrastructure has also been described (Clarke, 1888; Massachusetts Water Resources Authority, 2004a). The water quality of the lower Charles River and its tributaries has been a matter of public concern and debate for at least the last 135 years. An 1891 proposal to dam the estuary and create a freshwater basin spawned a series of scientific and engineering studies, summarizing all aspects of the river system and the likely effects of the proposed dam on the river and Boston Harbor (Freeman, 1903). Since the 1960s, the revival of public interest in the environmental quality of the Charles and Muddy Rivers has prompted numerous additional studies and monitoring efforts by citizens groups, water and sewer authorities, and regulatory agencies. For summaries of the most recent efforts, consult Charles River Watershed Association (1999; 2004b), Massachusetts Water Resources Authority (1994; 2004b), and the U.S. Environmental Protection Agency (2004). The U.S. Geological Survey also recently completed a series of studies addressing sediment quality, stormwater flow, and contaminant loads in the river and its watershed (Breault and others, 1998; Breault, Barlow and others, 2000; Breault, Reisig, and others, 2000; Breault and others, 2002; Zarriello and Barlow, 2002; Zarriello and others, 2003). Courtesy of the Boston Water and Sewer Commission Hydraulic dredging of the Back Bay Fens, Boston, about 1895.
, research on the history of land filling in the city of Boston (Whitehill, 1968; Seasholes, 2003),")
10 4 Water Resources and the Urban Environment, Lower Charles River Watershed, Massachusetts, EASTERN MASSACHUSETTS UPPER CHARLES RIVER WATERSHED HOPKINTON Boston Boston Harbor ATLANTIC OCEAN 71 o 06' LOWER CHARLES RIVER WATERSHED 71 o 10' CAMBRIDGE SOMERVILLE New Charles River Dam (1978) WATERTOWN DAM (original head of tide) 42 o 22' WATERTOWN Allston LAUNDRY BROOK Brighton FANEUIL BROOK BROOKLINE Charles River Back Bay BOSTON Old Charles River Dam (1908) and the Museum of Science 42 o 20' NEWTON MUDDY RIVER Jamaica Plain Roxbury EXPLANATION 42 o 18' SURFACE-WATER BODIES See figure 5 for detailed map COMBINED-SEWER DRAINAGE AREA UNDIFFERENTIATED WATERSHED AREA See figure 12 for detailed map West Roxbury STONY BROOK Roslindale Forest Hills Mattapan BOUNDARY OF MAJOR TRIBUTARY WATERSHED CULVERTED STREAM SEGMENT OPEN-CHANNEL STREAM SEGMENT 42 o 16' MUNICIPAL BOUNDARY Roslindale NEIGHBORHOOD WITHIN MUNCIPALITY Hyde Park MILES Base map coverages from Boston Water and Sewer Commission, Beta Engineering, City of Cambridge Department of Public Works, City of Newton MIS Department, and City of Watertown Department of Public Works. Massachusetts State Plane Projection, NAD KILOMETERS Figure 1. Location and major tributary watersheds of the lower Charles River, Massachusetts, 2004.

11 Figure 2. A plan of the town of Boston and its environs, with the lines, batteries, and encampments of the British and American armies, by Sir Thomas Page (1776). Annotation has been added to the original map. Map courtesy of the Library of Congress.
.")
12
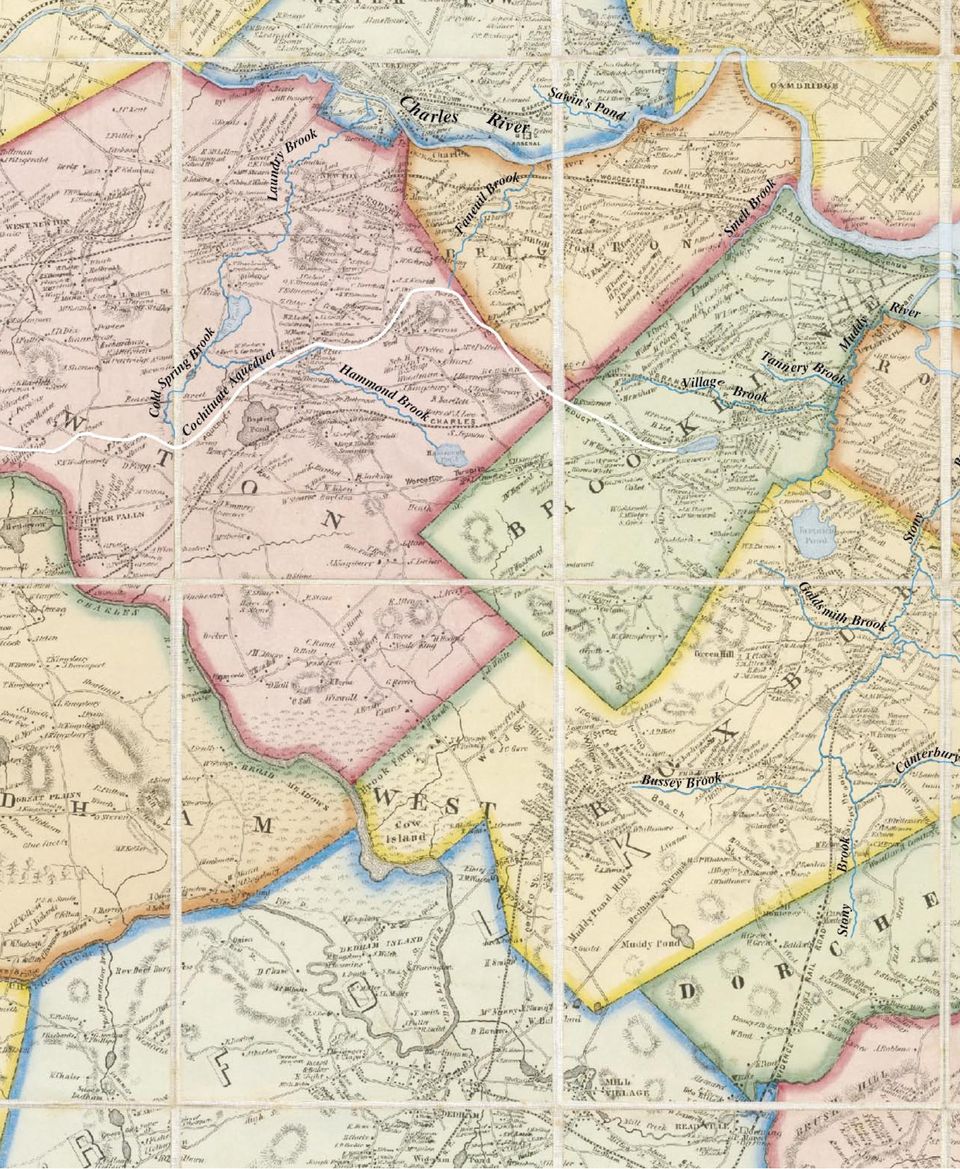
13 Figure 3. The Lower Charles River watershed in 1852 (modified from Sidney, 1852). Annotation shows the names of tributary streams and the Cochituate Aqueduct, completed in The towns of Brighton, Roxbury, West Roxbury, and Dorchester were all incorporated into the city of Boston by the late 19th century; Brookline remains an independent town. Map courtesy of the David Rumsey Map Collection.

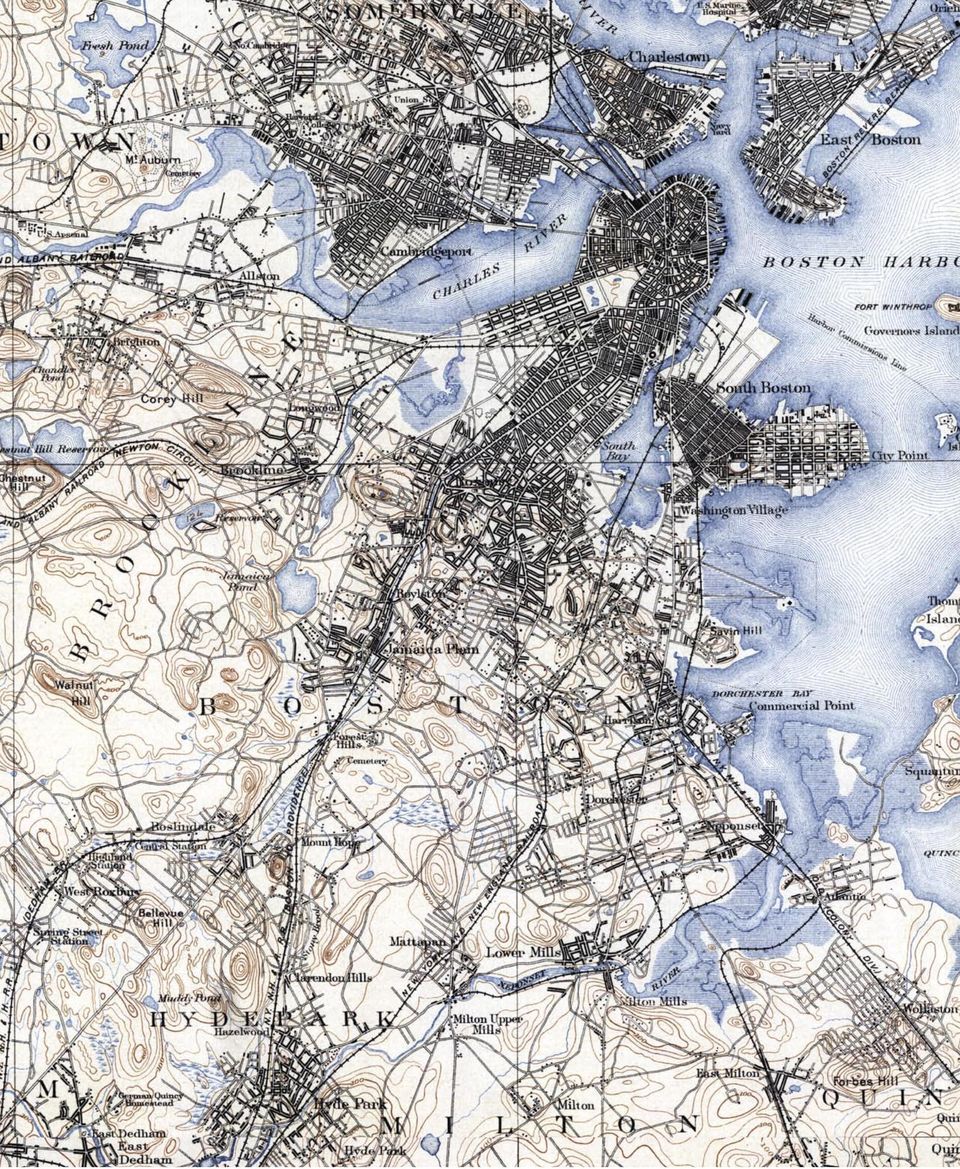
14 Figure 4. Lower Charles River watershed, Massachusetts, (U.S. Geological Survey, 1890).

15
16 10 Water Resources and the Urban Environment, Lower Charles River Watershed, Massachusetts, o 12' 71 o 08' CAMBRIDGE MULTIFAMILY LAND USE STUDY BASIN 71 o 04' 42 o 20' Cold Spring 42 o 22' Brook Laundry Brook NEWTON Bullough's Pond Ham mond Edmands Br Hyde Brook Brook WATERTOWN Charles River Faneuil Brook FaneuilBrook Sawins Brook Pond Chandler Pond Chestnut Hill Res. Hammond Pond Fisher Hill Res. Brookline Res. South Branch Shepard Brook BROOKLINE Village Br Smelt Brook Tannery Brook Village Brook Sargent Pond Halls Pond Ward Pond Muddy Muddy Leverett Pond Pond Jamaica Pond Stony Brook River Charles River BOSTON Back Bay Fens Swan Pond Frog Pond Brook Goldsmith EXPLANATION 42 o 18' Bussey Brook Scarboro Pond SURFACE WATER Canterbury Brook WETLAND OPEN-CHANNEL STREAM SEGMENT CULVERTED STREAM SEGMENT WATERSHED BOUNDARY U.S. GEOLOGICAL SURVEY STREAM-GAGING STATION 42 o 16' Turtle Pond Stony Brook Soil coverages digitized from National Resource Conservation Service soil maps, Massachusetts State Plane Projection, NAD MILES KILOMETERS Figure 5. Water resources of the lower Charles River watershed, Massachusetts, including streams, ponds, reservoirs, and wetlands, Stream-gaging stations were installed for studies by Zarriello and Barlow (2002). Multifamily watershed drains area of predominantly multifamily land use described by Zarriello and Barlow (2002).

17 Landscape History 11 Landscape History The longest river flowing entirely within Massachusetts, the Charles River winds 83 miles from its source to its mouth at Boston Harbor (fig. 1, inset map). The lower Charles River (the portion of the river downstream of Watertown Dam) flows the last 9.5 miles of this distance through a broad lowland (fig. 6). This section of the report introduces the bedrock and surficial geology of the lower Charles River watershed, and discusses some of the ways that humans have altered the landscape in recent centuries. Bedrock Geology Bedrock of the lower Charles River watershed consists of a sequence of sedimentary and volcanic rocks that were deposited about 580 million years ago in a broad sedimentary basin much larger than the present topographic lowland underlying the river. Some of the rock layers in this sequence consist of relatively soft siltstones and slates (known collectively as the Cambridge slate), which are easily eroded. Other rock formations in the sequence are more resistant to erosion. The most well-known of these formations is the Roxbury conglomerate (known locally as puddingstone ), which consists of pebbles and cobbles in a sand matrix (fig. 7). Numerous public buildings in the watershed are constructed of puddingstone, including the Old South Church in Boston and Gasson Hall on the Boston College campus in Newton. Subsequent folding and fracturing of the region s rock formations, and erosion of these rocks by water and ice over millions of years resulted in the present topography of the lower watershed. Uplands in Newton, Brookline, and the southern portion of Boston are underlain by the hard conglomerate and volcanic rocks; lowlands in Cambridge and the northern portion of Boston are underlain by the more easily eroded slates. Stream courses in the lower Charles River watershed are also determined, in part, by zones of weakness in the bedrock associated with major structural features (Skehan, 1979; 2001). For example, the mainstem of the Charles River overlies an east-west trending bedrock trough (or syncline) in the underlying Cambridge slate. Stony Brook and Muddy River, the two largest tributaries to the lower Charles River, follow the eastern and western limbs, respectively, of a large north-south trending fracture (or fault) that cuts across the Roxbury conglomerate (Skehan, 1979; 2001; Goldsmith, 1991). Surficial Geology During the last million years, a series of glacial episodes left an unmistakable signature on the New England landscape. The most recent ice sheet retreated from the Boston area about 15,000 years ago (Rosen and others, 1993). It left two principal types of deposits in the lower Charles River watershed: (1) glacial till (a typically hard and compact mixture of clay, silt, sand, pebbles, cobbles and boulders deposited directly by glacial ice); and (2) stratified or layered deposits, which may include both predominantly coarse-grained sand and gravel (or outwash) deposited by meltwater streams, and fine-grained silt and clay deposited in the standing water of a lake or a marine water body. Upland areas of the watershed are generally overlain by till; and lowland areas, where not covered by artificial fill, typically have stratified deposits at the surface (fig. 8). Perhaps the most striking landscape features in the Boston region are its many smooth, elongated hills, oriented mainly in a northwest-southeast direction (fig. 6). Known as drumlins, these hills consist mostly of glacial till, although some have a bedrock core. Their smooth shape and consistent orientation were imparted by flowing ice, likely near the end of the last glacial episode. About 200 drumlins have been identified in the lower Charles River watershed and surrounding areas, including most of the Boston Harbor Islands (Skehan, 2001; National Park Service, 2004a). Drumlins in the watershed include Chestnut Hill in Newton, Walnut Hill in Brookline, and Parker and Bussey Hills in Boston (fig. 6). Beacon Hill, the most well-known hill in Boston and the site, since 1797, of the Massachusetts State House, was originally a drumlin. It was reshaped, however, by a glacial readvance into an ice-marginal ridge (Kaye, 1976). Drumlins form the divides separating many of the tributary watersheds of the lower Charles River. Outwash is common in many lowland areas of the watershed. Outwash plains typically contain depressions, known as kettles, caused by the melting of stagnant blocks of glacial ice after the retreat of an ice sheet. If the water table in the surrounding outwash plain is higher in altitude than the base of the kettle, it will generally become a ground-water-fed kettle pond. A good example is Jamaica Pond, the source of the Muddy River (fig. 8). In the lowest lying areas of the watershed, near the mainstem Charles and Muddy Rivers, an extensive, fine-grained deposit known as the Boston blue clay was laid down under shallow-marine conditions as the ice

18 12 Water Resources and the Urban Environment, Lower Charles River Watershed, Massachusetts, sheet retreated from the region. The properties of this clay unit have been extensively studied in connection with various large construction projects in Boston (Ladd and others, 1999). The Boston blue clay is completely overlain by recent estuarine deposits (sand, silt, clay, and salt marsh peat) deposited over the past 10,000 years (Rosen and others, 1993). The sedimentary environment that produced these estuarine deposits was the same environment encountered by Native Americans when they first reached the area 4,000 to 6,000 years ago, and by the first European settlers nearly 400 years ago. The estuarine deposits, in turn, have been completely covered by artificial fill over the past several hundred years, as will be discussed further below. A large portion of the artificial fill and disturbed urban land area shown in figure 8 is underlain by a sequence of blue clay and estuarine deposits. Human Alteration of the Landscape Human activity has profoundly altered the landscape of the lower Charles River watershed. Although Native Americans are known to have constructed a fish weir in the Back Bay about 4,000 years ago (Decema and Dincauze, 1998), major landscape changes began after the establishment of the Massachusetts Bay Colony in These changes included the filling of former tidal flats and marshes with material excavated from drumlins and other upland glacial deposits, and the conversion of forest, wetlands, and open areas into farmland, and eventually into urban and suburban areas. The first type of landscape alteration the filling of former tidal lands was especially extensive in the lower Charles River watershed and completely transformed the original landscape of the lower watershed by the late 19th century (figs. 2, 3, and 4). The largest example of this landmaking activity (Seasholes, 2003) was the filling of Back Bay. The second type of landscape alteration conversion of the watershed to urban land uses will be considered in the context of watershed hydrology in the last section of the report. Filling of Back Bay The Back Bay was once a 738-acre system of tidal flats, marshes, and creeks that extended west from the base of Beacon Hill to the conjoined mouths of Stony Brook and Muddy River (figs. 2 and 3). The filling of Back Bay was not the first landmaking project on the Shawmut Peninsula, but it was the largest. It was accomplished through a series of projects, beginning at the base of Beacon Hill during the 1790s and ending near the western limit of the Bay in the late 19th century. Justifications given by project proponents were similar to arguments presented by proponents of earlier landfilling projects on the Shawmut Penisula: to create new real estate, and to remedy the growing problem of sewage pollution in poorly mixed tidal waters and mud flats (Seasholes, 2003). Toward the end of the 19th century, after most of eastern Back Bay had been filled, the remediation of sewage generated by a greatly increased population became the dominant justification for landmaking. The Back Bay Fens project, for example, was designed and constructed in the 1870s and 1880s largely to remediate the severe sewage pollution in western Back Bay. This project will be described in the final section of the report. Other Landmaking Projects Landmaking along the lower Charles River extended considerably beyond Back Bay. It was preceded by numerous smaller projects on the Shawmut Peninsula, including the filling of Mill Pond (originally known as Mill Cove), West Cove, and South Cove (figs. 2 and 9). It was followed by extensive filling projects on the north side of the Charles River in Cambridge (Haglund, 2003), including nearly the entire area now occupied by the Massachusetts Institute of Technology (fig. 9). On the south side of the river, upstream of Back Bay, about 200 acres of salt marsh in the Allston section of Brighton north of Smelt Brook (figs. 3 and 4) were filled in the early 20th century, to make land for railroad yards, the Harvard Business School, and Harvard s athletic fields. Additional salt marshes in Cambridge and Watertown also were filled during this period (Haglund, 2003). The filling of tidal lands along the original Charles River estuary created new real estate for private and public use, and ameliorated real and perceived threats to public health. This landscape transformation also affected the hydrologic functioning of the lower watershed in ways that were not fully anticipated at the time. The next section describes the freshwater resources of the watershed. The final section addresses the hydrologic effects of these and other landscape changes.

19 Landscape History 13 WALTHAM BELMONT CAMBRIDGE SOMERVILLE Watertown Dam Mt Auburn WATERTOWN Mt Ida FANEUIL BROOK Charles River Beacon Hill LAUNDRY BROOK Institution Hill Chestnut Hill Aspinwall Hill Fisher Hill BROOKLINE Corey Hill MUDDY RIVER Parker Hill NEWTON Walnut Hill BOSTON Bussey Hill STONY BROOK WELLESLEY NEEDHAM Base map developed by using MassGIS (Massachusetts Executive Office of Environmental Affairs) DTMs and Topogrid (ArcInfo 7.1) Massachusetts State Plane Projection NAD 83; 1:5, MILES KILOMETERS ALTITUDE, IN FEET 0 to to to to to to 249 EXPLANATION 250 to to to 379 SURFACE WATER BASIN BOUNDARY Figure 6. Topography of the lower Charles River watershed, Massachusetts. White labels give the names of selected drumlins.
 Massachusetts State Plane Projection NAD 83; 1:5,000 0 1 2 MILES 0 1 2 KILOMETERS ALTITUDE, IN FEET 0 to 29 30 to 69 70 to 119 120 to 159 160 to 199 200 to 249 EXPLANATION 250 to 289 290 to 329")
20 14 Water Resources and the Urban Environment, Lower Charles River Watershed, Massachusetts, o 15' 71 o 10' 71 o 05' 71 o ARLINGTON MEDFORD EVERETT REVERE 42 o 22'30" WALTHAM Northern border fault BELMONT CAMBRIDGE SOMERVILLE Mystic River CHELSEA WATERTOWN Charles River Boston Harbor fault 42 o 20' NEWTON BROOKLINE Muddy River Stony Brook fault BOSTON 42 o 17'30" NEEDHAM Mount Hope fault Mount Hope fault Neponset fault Neponset River DEDHAM Blue Hill fault 42 o 15' QUINCY MILTON WESTWOOD U.S. Geological Survey Bedrock Geologic Map of Massachusetts digital data Modified from Zen and others, MILES 0 5 KILOMETERS EXPLANATION DIABASE DIKES AND SILLS UNDIFFERENTIATED IGNEOUS ROCKS ROXBURY CONGLOMERATE WITH INTERBEDDED VOLCANICS FAULT CULVERTED STREAM SEGMENT OPEN-CHANNEL STREAM SEGMENT BRAINTREE AND WEYMOUTH SLATE CAMBRIDGE SLATE Figure 7. Simplified bedrock geology of the lower Charles River watershed, Massachusetts. Modified from Zen and others (1983), Skehan (2001), and Goldsmith (1991).

21 Landscape History o 08' 71 o 04' 71 o 12' 42 o 22' LAUNDRY BROOK FANEUIL BROOK Charles River 42 o 20' Cold Spring Brook MUDDY RIVER Jamaica Pond EXPLANATION GLACIAL TILL GLACIAL OUTWASH STREAM AND LAKE DEPOSITS WINDBLOWN SAND AND SILT ARTIFICIAL FILL AND DISTURBED URBAN LAND 42 o 18' STONY BROOK SURFACE WATER BOUNDARY OF MAJOR TRIBUTARY WATERSHEDS 42 o 16' Base coverages from MassGIS, 1:5,000, soil coverages digitized from National Resource Conservation Service soil maps Massachusetts State Plane Projection NAD MILES KILOMETERS Figure 8. Surficial deposits of the lower Charles River watershed, Massachusetts. Original extents of estuarine mud deposits, salt-marsh peat, and underlying glacial-marine clays not shown; these deposits are now completely covered by artificial fill in the study area.
22 CHARLESTOWN EAST CAMBRIDGE MASSACHUSETTS INSTITUTE OF TECHNOLOGY Charles River Mill West Cove Cove BEACON HILL SHAWMUT PENINSULA COPPS HILL Town Cove Boston Harbor LOGAN AIRPORT GRAVELLY POINT South Cove River Muddy River Back Bay BOSTON NECK Stony Brook South Bay SOUTH BOSTON (DORCHESTER NECK) EXPLANATION 1630 SHORELINE 0 1 MILE 0 1 KILOMETER Franklin Park Figure 9. The estimated 1630 Boston shoreline, overlying a 1999 orthophotograph of Boston and surrounding areas. The 1630 shoreline is reproduced from Seasholes (2003); orthophotograph is courtesy of the Massachusetts Geographic Information System.
23 Water Resources 17 Water Resources The ground-water and surface-water resources of the lower Charles River watershed are many and diverse. Although urbanization has affected all of these resources, in some cases quite profoundly, public appreciation for the benefits that these resources provide has grown substantially in recent years. Surface-Water Resources The surface-water resources of the watershed comprise the mainstem Charles River, its tributary streams, and numerous ponds, reservoirs, and wetlands in the tributary watersheds (fig. 5). In the following sections, the basic characteristics of these resources are described. Streams In addition to the Charles River, 17 named streams occupy the lower Charles River watershed (table 1). However, Muddy River and the upstream reaches of Stony Brook are the only two streams in the lower watershed identified on maps that are widely available today, such as the U.S. Geological Survey Boston South topographic quadrangle map (U.S. Geological Survey, 1987), or the Massachusetts Geographic Information System s electronic hydrography coverages (Massachusetts Geographic Information System, 2004). Information about the remaining streams and their watersheds may be found on historic maps or the storm-drain atlases of the lower Charles River municipalities. These drain atlases typically retain the original names of major culverted streams. This section of the report describes the stream and watershed characteristics of the Charles River mainstem, and the four largest tributaries in the lower watershed: Stony Brook, Muddy River, Laundry Brook, and Faneuil Brook. Charles River The Charles River drains a 268-mi 2 area upstream of the Watertown Dam, and has an estimated mean annual streamflow at the dam of about 400 cubic feet per second (ft 3 /s; Zarriello and Barlow, 2002). The Charles River watershed upstream of Watertown is relatively flat, contains extensive areas of riparian wetland, and has 19 artificially impounded sections along the mainstem river alone. These factors combine to give the upper watershed an unusually high storage capacity, which in turn moderates the effects of large storms on the flow of the mainstem river. These effects were noted by J.R. Freeman over a century ago: This investigation proves beyond a doubt that the Charles River is a very uncommon river, for this part of the country, in the slowness and moderation of its rise and the long duration of its run-off (Freeman, 1903, p. 53). The lower Charles River was originally an estuary that extended over 9 miles inland from Boston Harbor to rapids at Watertown. In 1908, a dam was constructed near the mouth of the estuary between Boston and East Cambridge (fig. 1), converting the estuary into a freshwater basin. The dam was constructed mainly to remediate water-quality and public health problems in the estuary, and as part of a larger effort to transform the shoreline of the lower river into a water park (Freeman, 1903; Haglund, 2003). The Boston Museum of Science now occupies the site of the original dam (fig. 1). Downstream of the Watertown Dam, the lower Charles River watershed is a 40-mi 2 urbanized area containing portions of Boston, Cambridge, Brookline, Watertown, and Newton. Only 36.6 mi 2 of this area drains directly to the river; the remaining areas in Cambridge and the northern Back Bay of Boston (fig. 1) are drained by combined sewers that convey both wastewater and stormwater runoff. (At present, the combined sewers discharge to Charles River only under extreme storm conditions.) The surficial deposits of the lower Charles River watershed are dominated by glacial till (48 percent by area), followed by disturbed urban land (35 percent), and glacial outwash (16 percent) (Zarriello and Barlow, 2002). Land use varies greatly across the watershed (fig. 10). The most highly urbanized areas (dominantly multifamily residential and commercial) are in Boston and Cambridge, and less densely developed areas (single-family residential) are more common in Newton, Brookline, and Watertown. Urban open space and forest occur throughout the watershed. Together, these two land-cover types represent 19 percent of the watershed area, unusually high for a densely developed urban region. Stony Brook Stony Brook is the largest tributary to the lower Charles River, draining 8,393 acres (13.1 mi 2 ) in the Roxbury, Jamaica Plain, Roslindale, Hyde Park, and West Roxbury sections of Boston, and a small section of Brookline (figs. 1 and 5; table 1). The stream originates in the Stony Brook Reservation, a State forest in West
24 18 Water Resources and the Urban Environment, Lower Charles River Watershed, Massachusetts, Table 1. Named tributaries of the lower Charles River, Massachusetts. [Direct tributaries: discharge directly to the lower Charles River; Upland tributaries: discharge to direct tributaries; Reference: indicates the source of each stream name; Outlet identifier: refers to numbered stream outlet on figure 12] Direct tributaries and upland tributaries (indented) Outlet identifier Drainage area (acres) Reference Stony Brook 58 8,393 U.S. Geological Survey (1987) Bussey Brook Boston Water and Sewer Commission (1997) Canterbury Brook Boston Water and Sewer Commission (1997) Goldsmith Brook Boston Water and Sewer Commission (1997) Muddy River 56 4,005 U.S. Geological Survey (1987) Village Brook Town of Brookline (2004) Village Bk., S. Branch Town of Brookline (2004) Tannery Brook Town of Brookline (2004) Laundry Brook 2 3,038 U.S. Geological Survey (1890) Hammond Brook City of Newton (1929) Cold Spring Brook U.S. Geological Survey (1890) Edmands Brook City of Newton (1929) Faneuil Brook 21 1,151 Smith and others (1972) Sawins Pond Brook Smith and others (1972) Smelt Brook Sidney (1852) Shepard Brook Smith and others (1972) Hyde Brook Smith and others (1972) 1 Downstream section of Smelt Brook is called Salt Creek by Smith and others (1972). Roxbury (fig. 10). The brook flows southeast through an open channel for its first mile, and then flows northward to the Charles River through a 7.5-mi-long, horseshoe-shaped brick conduit. As previously discussed, the stream valley follows a roughly north-south fault in the underlying Roxbury conglomerate (fig. 7). Since colonial times, this valley has provided a southwest transportation corridor into Boston. The first railroad from Boston to Providence, Rhode Island, was built along Stony Brook in the 1830s. As the largest freshwater stream near the original town of Boston (Boston did not adopt a city form of government until 1822), Stony Brook also supported a variety of manufacturing industries (Freeman, 1903). Three tributaries, Bussey Brook, Canterbury Brook, and Goldsmith Brook, join the mainstem from the east and the west (figs. 3 and 5). The surficial deposits of the watershed are dominated by glacial till (62 percent by area), followed by artificial fill and disturbed urban land (23 percent) (fig. 8). Much of the artificial fill was emplaced during the culverting of Stony Brook in the late 19th and early 20th centuries (fig. 11). This massive public works project was undertaken largely to protect the public from sewage-associated disease (Freeman, 1903). It also removed the stream from public view, and created a large area of new land for urban development. The disturbed urban land in the valleys of Stony Brook and its tributaries (fig. 8) is one result of this large project. During the late 19th century, efforts were made to preserve open space for public use in the Stony Brook watershed. One hundred years after these lands were set aside, protected open space and forest still compose
25 Water Resources o 08' Harvard University 71 o 04' 42 o 22' 71 o 12' Mt. Auburn and Cambridge Cemeteries Massachusetts Institute of Technology Edmands Park Boston College Medical area and schools Boston University Back Bay Fens 42 o 20' Newton Cemetery Medical area, museums, and schools Cold Spring Park Hammond Pond Reservation Larz Anderson Park EXPLANATION LAND USE Single-family residential Multifamily residential Urban open space Commercial Forest Open water Transportation Spectator recreation Industrial Waste disposal Wetland Cemetery Institutional 42 o 18' 42 o 16' Stony Brook Reservation Arnold Arboretum Forest Hills Cemetery Mt. Hope Cemetery Franklin Park Boston Nature Center and Wildlife Sanctuary BASIN BOUNDARY Land use was reclassified from MassGIS, 1991, Massachusetts State Plane Projection NAD 83, 1:25,000, Massachusetts Executive Office of Environmental Affairs MILES KILOMETERS Figure 10. Land-use types in the lower Charles River watershed, Massachusetts, Selected institutions and urban open-space areas are indicated (Zarriello and Barlow, 2002).
26 20 Water Resources and the Urban Environment, Lower Charles River Watershed, Massachusetts, Sanitary sewer incorporated into the right haunch of culvert Courtesy of Boston Water and Sewer Commission Figure 11. The culverting of Stony Brook at Forest Hills, about percent of the overall watershed area, more than any other land-use type in this watershed, which is the largest tributary watershed of the lower Charles River. Some of the major parks and protected areas in the watershed include the Stony Brook Reservation, Franklin Park, the Arnold Arboretum, the Boston Nature Center and Wildlife Sanctuary of the Massachusetts Audubon Society, and two large public cemeteries (Forest Hills and Mt. Hope Cemeteries; fig. 10). Franklin Park, created by landscape architect Frederick Law Olmsted, is the southernmost section of Boston s Emerald Necklace of parks and parkways (Zaitzevsky, 1982). The Necklace begins at Franklin Park, extends northward along the Arborway to Jamaica Pond, and then extends down the Muddy River corridor to the Charles River. Streamflow in Stony Brook is highly variable, in contrast to the mainstem Charles River. Dry-weather streamflows average about 10 ft 3 /s, and peak flows during major rainstorms can reach 1,000 ft 3 /s. (See figure 5 for locations of stream-gaging stations) During large rainstorms, flows in the Stony Brook conduit typically exceed flows in the mainstem Charles River at Watertown (Zarriello and Barlow, 2002). Muddy River Muddy River drains 4,005 acres (6.3 mi 2 ), almost exclusively in Brookline (fig. 1, table 1). The river originates in Jamaica Pond, a kettle pond set in glacial outwash at the southeastern edge of the watershed
27 Water Resources 21 (figs. 5 and 8). Muddy River was originally a lowgradient tidal creek over most of its length. For a portion of its course, the stream coincides with the Muddy River fault (fig. 7). The constructed parklands of the Emerald Necklace now border the river along its entire 3.5-mi length. The two tributaries of Muddy River, Village Brook and Tannery Brook, are now completely culverted (fig. 5). Village Brook, which joins the river at a wide reach known as Leverett Pond, originates 5 mi to the west of Muddy River, near the campus of Boston College in Newton, and drains about two thirds of Muddy River s total watershed. Tannery Brook, a much smaller stream than Village Brook, enters the river several hundred feet north of Village Brook. The distribution of surficial deposits in the Muddy River watershed is similar to that of the Stony Brook watershed. The Muddy River watershed, however, has more single-family residential land use and slightly less open space and forest than the Stony Brook watershed. Dry-weather flows (typically about 3 to 5 ft 3 /s) and water levels in Muddy River are affected by dam operations at the mouth of the Charles River. As with Stony Brook, streamflow is flashy and highly responsive to rainfall. During Water Year 2000 (October 1, 1999 to September 30, 2000), the USGS measured peak flows up to 230 ft 3 /s. The Muddy River commonly floods during large rainstorms, in part because of channel constrictions where the stream enters a culvert upstream of the Back Bay Fens (fig. 5) (Breault and others, 1998; City of Boston/Town of Brookline, 2003). Laundry Brook Laundry Brook drains a 3,038-acre (4.7 mi 2 ) watershed located almost completely in Newton, immediately west of Brookline and the Brighton section of Boston (fig. 1; table 1). The average slope of the watershed (5.4 percent) is less than both the Stony Brook and Muddy River watersheds (6.5 and 7.2 percent, respectively), which reflects the large portion of watershed area (33 percent) underlain by sand-and-gravel outwash plains (Zarriello and Barlow, 2002). Cold Spring Brook, a headwater tributary, drains a large outwash area in the southwestern portion of the watershed. The brook owes its name to the relatively large volume of ground-water discharge it receives from the surrounding outwash. In New England, ground-water discharge is typically colder in summer and warmer in winter than the ambient air temperature. A second named tributary, Hammond Brook, is the outlet stream of Hammond Pond in the southeastern portion of the watershed. Edmands Brook, a small tributary, flows through forested parkland in the north-central part of the watershed. Consistent with its suburban setting, the Laundry Brook watershed is dominated by single-familyresidential land use (fig. 10). However, average lot sizes in the single-family areas are small (about 0.25 to 0.33 acres) compared to lot sizes in the newer suburbs at the fringe of the Boston metropolitan region. The stream network of the Laundry Brook watershed, like that of the Bussey Brook and Canterbury Brook small watersheds of the Stony Brook system, is also distinctive. Stream channels in the Laundry Brook watershed typically flow in open channels through parks and playgrounds, disappear into conduits as they enter residential areas, and then reappear once again at the next park downstream. Ponds such as Bullough s Pond (fig. 5) form integral parts of the stream network (Muir, 2002). Streamflow in Laundry Brook ranged from 0.10 to 216 ft 3 /s during Water Year 2000 (Zarriello and Barlow, 2002). Upstream regulation of the Bullough s Pond dam affects streamflows at the mouth of Laundry Brook. Before large rainstorms, the city of Newton typically draws down the pond to prevent flooding of adjacent properties. Faneuil Brook Faneuil Brook has the smallest watershed area, (1,151 acres or 1.8 mi 2 ), and the steepest average slope (8.9 percent) of all four major watersheds contributing to the lower Charles River (Zarriello and Barlow, 2002). The stream originates at Chandler Pond in the Brighton section of Boston (figs. 1 and 5). Altitudes in portions of the watershed south of the pond exceed 240 ft above sea level (fig. 6), making it one of the highest areas in the lower Charles River watershed. Consistent with its relatively rugged topography, the watershed s surficial deposits contain more till (76 percent) and less sand and gravel outwash (8 percent) than any of the other major watersheds (fig. 8). Faneuil Brook flows through a culvert for its entire length of about 6,000 ft. Land use in the basin is mostly single-family residential (53 percent), with substantial urban open space and forest (24 percent) (fig 10). Streamflows in Faneuil Brook were highly variable during Water Year Dry-weather flows averaged a few tenths of a cubic foot per second, and peak flows
28 22 Water Resources and the Urban Environment, Lower Charles River Watershed, Massachusetts, in wet weather reached 179 ft 3 /s (Zarriello and Barlow, 2002). The steep slope and surficial geology of the watershed contribute to the high variability in flow. Other Streams In addition to the four major watersheds, numerous smaller streams drain directly to the lower Charles River through the storm drain networks of the five municipalities in the watershed. These smaller streams, and their associated watershed areas are even less known to the public than the four major watersheds. However, they affect the hydrologic functioning and water quality of the mainstem Charles River, and it is important, therefore, to document their locations, characteristics, and principal outlets (fig. 12; table 2). Ponds, Reservoirs, and Wetlands Although urban development has greatly altered the lower Charles River watershed, a number of ponds and wetlands have survived. These features mitigate urban flooding by providing storage for stormwater runoff, and provide essential habitat for waterfowl, fish, and other aquatic species. Most of the constructed reservoirs in the lower watershed are no longer used for public-water supply, but are nevertheless of historic interest. Because most of the ponds, reservoirs, and wetlands are surrounded by public lands, they also have important recreational and aesthetic value for the surrounding communities. The lower Charles River watershed contains 14 ponds at least 1 acre in size (table 3; fig. 5). Jamaica Pond, a 67-acre kettle pond at the source of the Muddy River, is the largest natural freshwater body in the watershed. Other relatively large natural ponds include Hammond Pond and Bullough s Pond in the Laundry Brook watershed, Chandler Pond (the source of Faneuil Brook), and Turtle Pond (the source of Stony Brook). Many of the parks and other open-space areas in the watershed contain additional named and unnamed ponds. Turtle Pond was known historically as Muddy Pond (figs. 3, 4). The Stony Brook State Reservation in the Stony Brook headwaters contains at least seven unnamed ponds. Additional ponds are in Boston s Arnold Arboretum; in Franklin Park; in the Mt. Auburn, Mt. Hope, and Forest Hills cemeteries; and on the grounds of the former Boston State Hospital (now occupied by the Boston Nature Center of the Massachusetts Audubon Society). In Brookline, the Larz Anderson and Amory Street Parks also contain small ponds. The Frog Pond on Boston Common, now highly altered, has been used by the public since the 1600s (Kaye, 1976). It is presently maintained by the city of Boston for public wading and skating. In addition to natural ponds, the lower Charles River watershed contains several historically significant reservoirs. The oldest is Brookline Reservoir (table 3; fig. 5), a storage reservoir constructed in the 1840s to receive and distribute imported water from Lake Cochituate, Boston s first city-wide public-water supply (Nesson, 1983). The largest reservoir is the Chestnut Hill Reservoir, near Boston College on the Newton-Brighton boundary. This storage reservoir was constructed in the 1870s as part of the Sudbury Reservoir system, developed when Lake Cochituate proved insufficient for Boston s rapidly growing population (Nesson, 1983). A companion reservoir, immediately west of Chestnut Hill Reservoir (fig. 4), was abandoned and filled. It is now overlain by a portion of the Boston College campus. Numerous additional small storage reservoirs, such as the Fisher Hill Reservoir in Brookline (fig. 5), were built in the late 19th century to supply water, by gravity, to surrounding residential areas. Although not a watersupply reservoir, a constructed water body of historical importance, Swan Pond, was constructed in the 1830s in the newly created Boston Public Garden (Seasholes, 2003). Boston s well-known swan boats have used the pond for over 125 years. Construction of the Faneuil Brook conduit, also known as the Faneuil Valley conduit, Brighton, about Courtesy of the Boston Water and Sewer Commission
29 Water Resources o 12' 71 o 08' 71 o 04' 42 o 23' 42 o 22' 42 o 21' Watertown Dam Hyde Brook Sawin's Pond Brook FANEUIL BROOK Shepard Brook a Smelt Brook (Salt Creek) a Combined Sewer Area a a Charles River 62 Museum of Science Combined Sewer Area New Charles River Dam Boston Harbor 42 o 20' LAUNDRY BROOK MUDDY RIVER STONY BROOK Information from Boston Water and Sewer Commission, City of Cambridge Department of Public Works, City of Newton MIS Department, City of Watertown Department of Public Works, Massachusetts State Plane Projection, NAD MILES 1 KILOMETER EXPLANATION BOUNDARY OF MAJOR TRIBUTARY WATERSHED OR SMALL WATERSHED AREA Major-watershed name in capital letters. Small-watershed names (where known) in lower-case letters. OUTER BOUNDARY OF COMBINED-SEWER AREA 17 WATERSHED OUTLET AND IDENTIFIER Only the principal outlet of each watershed area is numbered. Alphanumeric label shows areas of diffuse drainage (no discrete outlets). STONY BROOK WATERSHED OUTLET BRIDGE 60 COMBINED SEWER OVERFLOW AND IDENTIFIER Tributary areas not shown Figure 12. Major tributary watersheds and small watershed areas of the lower Charles River, Massachusetts. Four of the small watershed areas are named in table 1 (modified from Zarriello and Barlow, 2002).
30 24 Water Resources and the Urban Environment, Lower Charles River Watershed, Massachusetts, Table 2. Characteristics of watersheds that drain directly to the lower Charles River, Massachusetts. Continued [See figure 12 for locations of major tributary watersheds, small watershed areas, and outlets. Information on major tributary watersheds is stated in bold type. In some cases, small watershed areas have more than one outlet; only the principal outlet is identified. Data for combined-sewer overflow (CSO) watershed areas are not shown; sewer separation is now occurring in much of the combined-sewer area. CAM, city of Cambridge CSO; MWR, Massachusetts Water Resources Authority CSO. Land-use types: HD, high-density single-family residential; MD, medium-density single-family residential; F, forest; UO, urban open space; C, commercial; T, transportation; R, spectator or participant recreation; I, industrial; MF, multifamily residential; ---, not applicable] Major tributary watershed or small watershed area Principal outlet identifier Drainage area (acres) Dominant land uses Laundry Brook 2 3,038 HD, MD, F Watertown West local drainage HD, UO, C Watertown Square Drain HD, UO Newton West local drainage 9 71 HD, C Hyde Brook HD, UO (1999) Newton East local drainage HD, T, R Watertown Central local drainage HD, I Watertown East local drainage T, R Brighton local drainage HD, T, C Faneuil Brook 21 1,151 HD, MF, C Sawin s Pond Brook HD, I Shepard Brook I, MF, UO Soldier s Field Local Drainage 27a 169 R, T Mt. Auburn Cemetery local drainage UO, T CSO (CAM 005) Sparks Street local drainage MD, UO, HD CSO (CAM 007) Harvard Square local drainage MF, UO, C CSO (CAM 009) Harvard Street north local drainage HD, UO Harvard Business School local drainage 37a 72 UO, MF, C CSO (CAM 011) North Putnam Avenue local drainage 41c 132 HD, T Western Avenue local drainage HD, T, C Cambridge Street local drainage T, C, I
31 Water Resources 25 Table 2. Characteristics of watersheds that drain directly to the lower Charles River, Massachusetts. Continued [See figure 12 for locations of major tributary watersheds, small watershed areas, and outlets. Information on major tributary watersheds is stated in bold type. In some cases, small watershed areas have more than one outlet; only the principal outlet is identified. Data for combined-sewer overflow (CSO) watershed areas are not shown; sewer separation is now occurring in much of the combined-sewer area. CAM, city of Cambridge CSO; MWR, Massachusetts Water Resources Authority CSO. Land-use types: HD, high-density single-family residential; MD, medium-density single-family residential; F, forest; UO, urban open space; C, commercial; T, transportation; R, spectator or participant recreation; I, industrial; MF, multifamily residential; ---, not applicable] Major tributary watershed or small watershed area Principal outlet identifier Drainage area (acres) Riverside local drainage MF, C Smelt Creek MF, HD, C Magazine Beach local drainage MF, R, UO CSO (MWR 201; Cottage Farm) Dominant land uses Halls Pond Drain C, HD, MF, UO (1999) St. Mary s Street Drain HD, C Boston University local drainage 49a 81 MF, UO, C Cambridgeport local drainage MF, C, UO Muddy River Conduit C, MF, UO Bay State Road local drainage C, T MIT West local drainage C, MF, UO Muddy River 56 4,005 HD, MF, UO Stony Brook 58 8,393 HD, MF, UO, F MIT East local drainage C, UO, T CSO (MWR 018) CSO (MWR 019) CSO (MWR 020) CSO (MWR 021; Closed) CSO (MWR 022; Closed) CSO (CAM 017) Lechmere local drainage C, MF
32 26 Water Resources and the Urban Environment, Lower Charles River Watershed, Massachusetts, Over the past 375 years, many of the original freshwater wetlands and ponds of the lower Charles River watershed have been drained or filled. Comparison between the 1890 and 1987 USGS topographic quadrangle maps (U.S. Geological Survey, 1890; 1987) provides examples of significant inland fill activity over this 94-year period. For example, much of a 65-acre wetland adjacent to Canterbury Brook in the Stony Brook watershed (figs. 4 and 5) was filled to create land for Boston State Hospital. A comparably sized wetland between the Roslindale and Forest Hills portions of the Stony Brook valley (fig. 4) was also filled during this period. Strongs Pond in Brighton, an 8-acre pond formerly adjacent to Chandler Pond (fig. 4), was filled to create Gallagher Park. The three largest remaining wetlands in the watershed occupy protected open-space areas (1) next to Hammond Pond (13.5 acres of wetland), (2) in the headwaters of Stony Brook (about 10 acres), and (3) in the headwaters of Cold Spring Brook (about 2.7 acres; fig. 5). Although the history of landmaking in Boston s tidelands has been documented in detail (Seasholes, 2003), the original character and extent of freshwater resources in the Boston region, and their subsequent history of alteration, remain to be fully described. Ground-Water Resources The first settler on the Shawmut Peninsula, the Reverend William Blaxton, built his house in 1625 on the western slope of Beacon Hill (fig. 2) near a freshwater spring (Whitehill, 1968). This spring, which discharged from a permeable sand layer underlying Beacon Hill (Kaye, 1976), must have provided an ample water supply, for in 1630, Blaxton invited John Winthrop and his band of colonists to abandon Charlestown and its limited, brackish water supply for the improved living conditions on the south side of the Charles River. Winthrop and his colonists accepted the invitation, settled the Shawmut Peninsula, and established the town of Boston. Additional springs were located and wells were dug for private and public use; these groundwater supplies met Boston s needs for about the next 150 years. By the late 1700s, however, the paving of upland ground-water recharge areas on the peninsula had reduced the available water supply, and contamination from privies and livestock had compromised water quality to the point where public health was at risk. Consequently, Boston residents were forced to import drinking water from the mainland to meet their needs. Courtesy of the Boston Water and Sewer Commission Stony Brook weir at Hyde Park.
33 Water Resources 27 Table 3. Ponds, reservoirs, and wetlands of the lower Charles River watershed, Massachusetts. [See figure 5 and U.S. Geological Survey (1987) for locations of water bodies. Water-body areas from 1:25,000 MassGIS hydrography data layer (Massachusetts Geographic Information System, 2004)] Name City or town Major watershed Waterbody type Water-body area (acres) Jamaica Pond Boston Muddy River pond 66.7 Hammond Pond Newton Laundry Brook pond 22.4 Chandler Pond Boston Faneuil Brook pond 11.4 Leverett Pond, in Muddy River Brookline/Boston Muddy River pond 9.0 Bulloughs Pond Newton Laundry Brook pond 6.9 Turtle Pond, Stony Brook Reservation Boston Stony Brook pond 6.6 Scarboro Pond, Franklin Park Boston Stony Brook pond 6.1 Unnamed pond, Forest Hills Cemetery Boston Stony Brook pond 2.6 Sargent Pond Brookline Muddy River pond 2.4 Ward Pond, in Muddy River Boston Muddy River pond 2.3 Unnamed pond, Stony Brook Reservoir Boston Stony Brook (headwaters) pond 1.9 Unnamed pond, Mt. Hope Cemetery Boston Stony Brook pond 1.4 Unnamed pond, Arnold Arboretum Boston Stony Brook pond 1.0 Halls Pond, Amory Street Park Brookline Halls Pond Drain pond 1.0 Chestnut Hill Reservoir Boston Muddy River reservoir 82.7 Brookline Reservoir Brookline Muddy River reservoir 21.1 Fisher Hill Reservoir Brookline Muddy River reservoir 2.2 Hammond Pond wetland Newton Laundry Brook wetland 13.5 Stony Brook headwater wetlands Boston Stony Brook (headwaters) wetland 10.1 Cold Spring Brook wetland Newton Laundry Brook wetland 2.7 Although ground water has not been a major source of drinking water in Boston since the mid-19th century, ground-water levels in the city remain a major concern. In the Back Bay and other filled areas, many of the building foundations were built upon wooden pilings driven into the underlying estuarine muds and Boston Blue Clay. However, the sewers, storm drains, and subway tunnels constructed in the fill since the buildings were built have generally leaked, lowering the average elevation of the water table in the filled areas. The lowered water table, in turn, has exposed some of the wood pilings to air, causing dry rot and threatening the integrity and safety of numerous buildings (Cotton and Delaney, 1975; Aldrich and Lambrechts, 1986; Seasholes, 2003). The potential hazard posed by lowered ground-water levels was recognized as early as 1878, when seven observation wells were installed by the Commonwealth of Massachusetts in the newly filled Back Bay lands to measure ground-water levels before and after the completion of Boston s first metropolitan sewagecollection system (Cotton and Delaney, 1975; Aldrich and Lambrechts, 1986). This small observationwell network has been greatly expanded over the decades. During the 1930s, the federal Works Projects Administration added about 600 wells to the network and monitored water levels for several years; in the early 1970s, the USGS located, tested, and measured water levels in a subset of these wells. An atlas was subse-
34 28 Water Resources and the Urban Environment, Lower Charles River Watershed, Massachusetts, quently published showing spatial and temporal trends in ground-water levels on the Boston (Shawmut) Peninsula (Cotton and Delaney, 1975). Private and public organizations continue to monitor and correct the problems associated with lowered ground-water levels in the city (Greenberger, 2003). Water and the Urban Environment Over the past 375 years, human activity has profoundly altered the landscape, water resources, and hydrologic processes of the lower Charles River watershed. From 1840 to 1910, the population of the city of Boston dramatically increased (fig. 13), and large areas of the watershed formerly occupied by small farms became urbanized. The development of new watersupply sources, sewage-disposal practices, and publicwater infrastructure during this period helped to set a pattern for later developments in the region and throughout the United States. In this section, the hydrologic effects of urbanization are considered in relation to the glaciated landscape of the lower Charles River watershed. The history of Boston s water-supply and sewagedisposal infrastructure is also briefly reviewed. POPULATION 900, , , , , , , , , Courtesy of the Boston Water and Sewer Commission YEAR Figure 13. Population of Boston, Massachusetts, 1790 to 2000 (U.S. Census data; does not include metropolitan area). Extensive freshwater wetland near Canterbury Brook, Mattapan, about This wetland was largely filled during the 20th century.
35 Water and the Urban Environment 29 Hydrologic Effects of Urbanization Important components of the water cycle in the lower Charles River watershed include precipitation (rain and snow), surface runoff, ground-water recharge and discharge, evaporation from soils and surface waters, and transpiration by plants (referred to collectively as evapotranspiration). Annual precipitation in the lower Charles River watershed averages about 42 in. (Zarriello and Barlow, 2002), and is evenly distributed throughout the year (an average of 3.5 in/mo; fig. 14A). Evapotranspiration, by contrast, displays a distinctive annual cycle in the Boston region, driven by the annual cycle in mean temperature and the growing season of trees and other plants (figs. 14A, B). Annually about 15 in. (35 percent) of the precipitation that falls on the watershed is lost to evapotranspiration, leaving an average of about 27 in. for surface runoff and ground-water recharge (fig. 14C; Zarriello and Barlow, 2002; Randall, 1996). Of this total, 10 in. typically becomes surface runoff (23 percent of precipitation), and the remaining 17 in. recharges the groundwater-flow system (42 percent of precipitation; Zarriello and Barlow, 2002). The relative amount of runoff in relation to recharge in any given area of the watershed depends upon the characteristics of the natural and constructed landscape. Factors Controlling Runoff and Recharge The most important natural factors controlling runoff from various areas of the watershed are land-surface slope and the permeability of the geologic deposits (or soils) exposed at the surface. In the absence of urban development, areas with steep slopes underlain by relatively impermeable glacial deposits (such as in the Faneuil Brook watershed in Brighton) generate relatively high volumes of runoff per unit area and lesser amounts of ground-water recharge. By contrast, flat areas underlain by coarse sand and gravel deposits (such as the upper Laundry Brook watershed in Newton) generate relatively less runoff and more recharge. Urban development has significantly altered the natural balance between runoff and recharge in the lower Charles River watershed. Construction of buildings, streets, and parking lots has increased the fraction of impervious area in the watershed, causing much larger runoff volumes and increasing the frequency and severity of floods in downstream areas. The combined effects of these natural and human factors are illustrated in figure 15, which shows the flow response of the Charles River and selected tributary watersheds to a moderately large, 1.7-in. rainstorm in July Flow is plotted in relation to time over the 13-hour duration of the storm. All three of the tributary watersheds in figure 15 respond relatively quickly to the storm, although the magnitude of the flow peaks and the declines in flow after the storm differ greatly. The most impervious of the watersheds (a multifamily residential watershed in Cambridge with an effective impervious cover of 73 percent) shows the highest values of runoff per unit area and the most rapid declines in runoff after the storm. The remaining two watersheds (Faneuil Brook and Laundry Brook) have much lower percentages of effective impervious cover (each less than 15 percent). Differences in runoff behavior between these two less urbanized basins are likely caused by differences in surficial geology (fig. 8) and basin slope (fig. 6). Faneuil Brook, which drains a steep basin underlain largely by till, responds to the storm quickly and has a higher peak runoff rate than Laundry Brook, which drains a flatter basin underlain by a significant area of sand and gravel. The mainstem Charles River at Watertown, by contrast, generates much less runoff per unit area than the other watersheds, and the decline in flow after the storm is much slower. This behavior is due to the relatively small percentage of impervious area in the Charles River watershed as a whole, and the large storage capacity provided by upstream wetlands and impoundments. These watershed features buffer the response of the river to individual storms, and limit flooding in downstream areas, as observed by J.R. Freeman over a century ago (Freeman, 1903). The same landscape features that promote surfacewater runoff and flooding in urban areas tend to reduce or eliminate ground-water recharge. For example, when the upland areas of the Shawmut Peninsula were covered with buildings and cobblestone streets in the late 1700s and early 1800s, flow from springs declined and wells went dry, forcing Boston to look to the mainland for water supply. Stream base flow (the sustained flow of streams between storms) is derived largely from groundwater discharge; urbanization has likely reduced both ground-water recharge and discharge in all of the major tributary watersheds of the lower Charles River.
36 30 Water Resources and the Urban Environment, Lower Charles River Watershed, Massachusetts, TEMPERATURE, IN DEGREES FAHRENHEIT INCHES PER MONTH A. B. Precipitation Temperature Evaporation from surface-water bodies JAN. FEB. MAR. APR. MAY JUNE JULY AUG. SEPT. OCT. NOV. DEC. JAN. FEB. MAR. APR. MAY JUNE JULY AUG. SEPT. OCT. NOV. DEC. C. Precipitation 42 Evapotranspiration 15 (Inches per year) Groundwater recharge Water table 17 Surface Runoff 10 Lower Charles River Figure 14. A, Average monthly precipitation and evaporation from surface-water bodies in the lower Charles River watershed; B, average monthly temperature, city of Boston; C, average annual rainfall, simulated runoff, simulated evapotranspiration, and simulated recharge in the lower Charles River watershed. All data and model simulations from Zarriello and Barlow (2002), based on the period.
37 Water and the Urban Environment 31 RAINFALL, IN INCHES RAINFALL (15-MINUTE INCREMENTS) A. 0 7/27 0:00 7/27 12:00 7/28 0:00 7/28 12:00 CUBIC FEET PER SECOND PER SQUARE MILE (ft 3 /s/mi 2 ) B. Peak Flow: 268 (ft 3 /s/mi 2 ) at 7:30 am on 7/27 Multifamily watershed Faneuil Brook C. Laundry Brook Faneuil Brook Multifamily watershed D. Laundry Brook Faneuil Brook Multifamily watershed E. Laundry Brook Faneuil Brook SURFICIAL DEPOSITS, IN PERCENT COVER Till Sand & Gravel Disturbed Urban AVERAGE SLOPE, IN PERCENT IMPERVIOUS SURFACE, PERCENT COVER Multifamily watershed 10 Laundry Brook Charles River 0 7/27 0:00 7/27 12:00 7/28 0:00 7/28 12:00 DATE AND TIME Figure 15. A, Rainfall measured in 15-minute increments at the Watertown Dam during a storm, July 27 28, 2000; B, streamflow per unit watershed area during this storm at stream-gaging stations in the multifamily, Faneuil Brook, Laundry Brook, and Charles River at Watertown Dam watersheds; C, surficial deposits; D, average slope; and E, impervious surface area in the Laundry Brook, Faneuil Brook, and multifamily watersheds. See figure 5 for locations of stream-gaging stations and gaged watersheds (based on data from Zarriello and Barlow, 2002).
38 32 Water Resources and the Urban Environment, Lower Charles River Watershed, Massachusetts, Runoff Quality The quality of runoff has also been affected by urbanization in the lower Charles River watershed. Runoff from the watershed typically contains a variety of contaminants, including fecal bacteria, phosphorus and other nutrients, and lead and other metals (fig. 16). Fecal bacteria pose risks to the health of swimmers and boaters, phosphorus and other dissolved nutrients promote excessive algal growth, and dissolved metals can be toxic to fish and other aquatic species. Although some of these contaminants, especially bacteria, may originate from illicit sewage connections to storm drains, the majority of the contaminants derive from the buildup of particulate matter on streets, parking lots, roofs, and other impervious surfaces during dry weather, and from their subsequent removal by rainstorms. Long periods of dry weather before rainstorms tend to result in high contaminant concentrations in runoff (Breault and others, 2002). Water Supply and Sewage Disposal Although many components of the water cycle are affected by human activity in a highly urbanized watershed like that of the lower Charles River, the strictly anthropogenic flow components of this cycle are those flows that would not exist in the absence of a human population. These flows include local withdrawals for a variety of uses, local wastewater return flows, imports of water from remote sources, and exports of wastewater to remote receiving waters. The character and magnitude of anthropogenic flows in the lower Charles River watershed have changed greatly in the past 375 years. The Colonial Era From 1625 to the late 1700s, water supply and wastewater disposal in the watershed were strictly local. Springs and dug wells were the principal form of water supply in Boston, and privies were the preferred mode of human waste disposal. As in most early American cities, Courtesy of the Boston Water and Sewer Commission A newly constructed brick conduit, Boston, about 1905.
39 Water and the Urban Environment 33 A. STREAM-GAGING STATION B. STREAM-GAGING STATION C. STREAM-GAGING STATION Fecal Coliform Bacteria Charles River at Watertown Laundry Brook Faneuil Brook Muddy River Stony Brook Charles River at Watertown Laundry Brook Faneuil Brook Muddy River Stony Brook 100 1,000 10, ,000 1,000,000 Total Phosphorus Total Lead Charles River at Watertown Laundry Brook Faneuil Brook Muddy River Stony Brook 25th Percentile 10th Percentile COLONY-FORMING UNITS PER 100 MILLILITERS MILLIGRAMS PER LITER th Percentile 75th Percentile Mean Median MICROGRAMS PER LITER EXPLANATION MEDIAN VALUE OF STORMWATER RUNOFF IN 23 U.S. CITIES (Breault and others, 2002) Figure 16. Quality of runoff in the Charles River at Watertown, and in major tributary streams of the lower Charles River watershed during wet-weather events, 2000: A, fecal coliform; B, total phosphorus; C, total recoverable lead. Samples collected at stream-gaging stations shown in figure 5 (Breault and others, 2002). Boston s privy vaults would be emptied by hand, often at night, and the nightsoil would be disposed of locally or conveyed to farms in the surrounding countryside (Tarr, 1996). In the 18th century, Boston was one of the first American cities with cobblestone-paved streets drained by an underground storm drain network (Bridenbaugh, 1971; Spirn, 1984). Paved streets with underground drainage systems were major sanitary innovations at the time. Kitchen and household wastewater, but not human wastes, could be legally disposed of in these drains, which discharged to the tidal flats of the Charles River (Back Bay) and Boston Harbor (Seasholes, 2003). Public-Water Supply in the Modern Era As the quantity and quality of local ground-water supplies began to decline in Boston, the search began for external water supplies. A private-water company was formed in 1795 to convey water from Jamaica Pond to Boston through a network of hollow-log pipes (Spirn, 1984). In the mid-1840s, Boston s first public-water supply, Lake Cochituate, was developed in Natick about 10 mi west of the city in the Sudbury River watershed. John Jarvis, the engineer who designed New York City s Croton Reservoir several years earlier, oversaw construction of the Lake Cochituate system (Nesson, 1983). An aqueduct was built to convey the water from Natick to the Brookline Reservoir (figs. 3 and 5); water was then distributed from this reservoir to all parts of the city, through a 60-mi network of iron pipe (Rawson, 2004). On October 28, 1848, a public celebration of the new water system was held on the Boston Common (fig. 17), complete with public orations and a gushing fountain at the Frog Pond (Spirn, 1984, Rawson, 2004). Over the ensuing decades, the rapidly growing city developed additional supplies in the Sudbury River watershed. By the turn of the 20th century, a Metropolitan Water Board was established to construct larger reservoirs in the southern Nashua River watershed (Wachusett Reservoir) and eventually the Chicopee River watershed (Quabbin Reservoir) in west-central Massachusetts (Nesson, 1983; Elkind, 1998; and Massachusetts Water Resources Authority, 2004c.)
40 34 Water Resources and the Urban Environment, Lower Charles River Watershed, Massachusetts, Public-Sewage Collection and Disposal in the Modern Era In both Boston and New York City, the advent of a reliable public-water supply in the 1840s coincided with, and probably spurred, the introduction of water closets to private homes. With a reliable public-water supply, water carriage of human wastes became practical, and sewage-collection systems in the modern sense began in Boston (Tarr, 1996; Melosi, 2000). However, Boston s first modern sewer system, the Main Drainage Works, would not be completed until 1884, some 36 years after the water supply was introduced (Clarke, 1888). In the interim, sewage was sent directly to the Charles River, Boston Harbor, and their tidal flats through so-called common sewers and street drains contrary to previously established regulations. In some parts of Boston, specially designed pipes were introduced to facilitate water carriage of human wastes (fig. 11 shows one such design). By the 1870s, about 24 common sewers discharged a combination of sewage and stormwater directly to the Charles River (City of Boston, 1878). The replacement of privy vaults by common sewers probably benefited public health, but with adverse consequences for the health and aesthetic quality of the Charles River and nearshore areas of Boston Harbor. By the late 1870s, the main body of Back Bay east of Gravelly Point had been filled, leaving a relatively small area of tidal water and mudflats in westernmost Back Bay, at the mouth of Stony Brook and Muddy River. Because of rapid population growth in these two watersheds, sewage flows to Stony Brook and Muddy River had greatly increased, and the waters and mudflats of western Back Bay became grossly polluted. Prevailing winds carried sewage odors to the fashionable new Back Bay residential districts to the east, provoking the following observation from the Boston Board of Health: Courtesy of the Boston Athenaeum Figure 17. The Boston Water Celebration on Boston Common, October 25, The fountain in the background was located in the Frog Pond.
41 Water and the Urban Environment 35 Large areas have been at once, and frequently, enveloped in an atmosphere of stench so strong as to arouse the sleeping, terrify the weak, and nauseate and exasperate nearly everybody It visits the rich and poor alike. It fills the sick chamber and the office. It travels in a belt halfway across the city, and at that distance seems to have lost none of its potency (City of Boston, 1878). The germ theory of disease was not yet widely accepted; miasmas and foul odors were considered to be disease agents as well as aesthetic nuisances (Duffy, 1992). Consequently, the sewage odors emanating from western Back Bay and other parts of the city were treated as serious public health threats. Between the late 1870s and 1910, several large public works projects were undertaken to address the sewage problems of the lower Charles River watershed. Typically, sanitary improvement was only one of several justifications provided for these public undertakings. Three of the most significant sanitary projects of this period were: (1) the construction of the first citywide sewer system (the Main Drainage Works); (2) the construction of the Back Bay Fens; and (3) the damming of the lower Charles River. The Main Drainage Works The Main Drainage Works was one of the first large sewer systems built in the United States. It was specifically designed to limit the pollution of tidal flats adjacent to densely populated areas of the Boston Harbor and lower Charles River watersheds by conveying flows to a remote lagoon-and-outfall facility at Moon Island, an uninhabited Boston Harbor island (fig. 18). The system employed a network of interceptor conduits that were generally parallel to the shorelines of the receiving water bodies (the Charles River and Boston Harbor). The interceptors received the combined sewage and stormwater from sewers that had previously discharged directly to the city s tidal flats and waters (old sewer outlets shown on fig. 18). At selected points along their routes, often coinciding with the old sewer outlets, the interceptors were designed to overflow into receiving waters under storm conditions. These points would become known as combined-sewer overflows or CSOs (fig. 19). The interceptor sewers of the 1884 system were an important technological advance over the previous interim system of common sewers, and reduced the total volume of sewage entering the lower Charles River. A North System was subsequently added, with an outfall at Deer Island. These two systems would later be expanded and consolidated into the Metropolitan Sewerage System, completed about The primary source for information on the original system is Clarke (1888); recent descriptions of Boston s subsequent wastewater infrastructure are provided by Seasholes (2003) and the Massachusetts Water Resources Authority (2004a). The Back Bay Fens Sanitary Improvement By the late 1870s, sewage odors from the western section of Back Bay were considered a major public-health threat. This heavily polluted area, however, was not conducive to what has been dubbed the usual Boston fix for water pollution (Seasholes, 2003): simply filling the offending water body. Remediation of this area, a dynamic zone of flowing water at the mouths of Stony Brook and Muddy River (fig. 20), required a more innovative approach. Such an approach was proposed by Frederick Law Olmsted, the landscape architect who codesigned New York City s Central Park and later designed Franklin Park and the remainder of the Boston Park System. His proposal for a Sanitary Improvement of the Back Bay was adopted by the city of Boston in 1879 (Freeman, 1903; Seasholes, 2003). The plan called for filling 86 percent of the 190-acre section of Back Bay west of Gravelly Point, and excavating a narrow, deep, winding saltwater basin to take its place (fig. 20). The level of the saltwater basin was to be maintained at an altitude of about 2.4 ft above mean sea level by a tide gate at its mouth, which prevented exposure of the offensive mud flats at low tide. Additionally, the entire dry-weather flow of Stony Brook was to be rerouted directly to the Charles River through a conduit. The polluted Stony Brook was designed to overflow into the constructed saltwater basin only during major floods. Some 20 acres
42 36 Water Resources and the Urban Environment, Lower Charles River Watershed, Massachusetts, Old sewer outlets Figure 18. The Main Drainage Works sewage-collection system, 1884, Boston, Massachusetts, (modified from Clarke, 1888).
43 Water and the Urban Environment 37
44 38 Water Resources and the Urban Environment, Lower Charles River Watershed, Massachusetts, DRY-WEATHER CONDITION TO RIVER OR HARBOR (no flow) WEIR UNTREATED SEWAGE INTERCEPTOR SEWER TO WASTEWATER TREATMENT PLANT WET-WEATHER CONDITION TO RIVER OR HARBOR (CSO discharge) WEIR STORMWATER MIXED WITH UNTREATED SEWAGE INTERCEPTOR SEWER TO WASTEWATER TREATMENT PLANT Figure 19. Schematic of combined-sewer overflow (CSO) under dry- and wet-weather conditions (modified from Breault and others, 2002). of land adjacent to the saltwater basin were also set aside as a low-lying brackish marsh to provide additional flood storage for Stony Brook during storms. The entire flow of the Muddy River (wet and dry weather) was to be diverted into a conduit under the present-day Brookline Avenue to the Charles River (figs. 7 and 20). The history of the Back Bay Fens since its completion in 1894 is complex and colorful. Although this innovative sanitary improvement does not function as originally intended in part because the subsequent damming of the Charles River eliminated all tidal exchange living conditions in the surrounding areas were greatly improved by the project. Major institutions, including the Museum of Fine Arts, the Gardner Museum, Symphony Hall, Fenway Park, and numerous colleges and universities were established in this new section of the city. For detailed accounts of the Fens, its history, and current efforts to restore its parklands and waterways, see Freeman (1903), Zaitzevsky (1982), Spirn (1984), Seasholes (2003), Haglund (2003), City of Boston/Town of Brookline (2003), and the National Park Service (2004b). The 1908 Charles River Dam The construction of a dam at the mouth of the Charles River was first proposed in the mid-1800s, and was the subject of intense debate for two decades before its eventual completion in 1908 (Haglund, 2003). Dam proponents viewed it as a vital part of a larger program to improve the entire lower Charles River and its shoreline for public use. This larger effort included the acquisition of land for public parks and parkways, and the elimination of pollution sources along the shoreline including a large slaughterhouse in Brighton. The two main reasons given for building the dam were to create an attractive freshwater basin that could provide recreation for boaters and serve as the focus for a metropolitan water park, and to ameliorate sewage
45 Water and the Urban Environment 39 Figure 20. The confluence of Stony Brook, Muddy River, and the Charles River, as it existed in the early 19th century, and the subsequently constructed area of the Back Bay Fens, about The tidal waters west of Gravelly Point had become severely polluted with sewage by the 1870s. The Smelt Brook shown above is presently within Boston s combined-sewer drainage area, and therefore is not depicted in figures 1 or 5 (Freeman, 1903).
46 40 Water Resources and the Urban Environment, Lower Charles River Watershed, Massachusetts, problems that continued to degrade the river and tidal flats bordering upon Cambridge and Boston residential areas (fig. 21). Dam opponents argued that the proposed dam would increase sedimentation rates in Boston Harbor, and further degrade water quality in the river. Privately, opponents on the Boston side of the river were concerned that their property values would be negatively affected by the public park that was proposed to border the new freshwater basin (Haglund, 2003). To address these objections, the Commonwealth established a committee, chaired by MIT President Henry S. Pritchett, which sponsored coordinated studies of the geology, hydrology, chemistry, biology, and epidemiology of the estuary (Pritchett and others, 1903). The studies were conducted under the direction of John R. Freeman, an MIT-trained engineer (Haglund, 2003). Sewage pollution was the primary focus of these studies. Although the Main Drainage Works and the subsequent Metropolitan Sewerage System (still under construction in 1903) had reduced direct discharges of sewage to the tidal flats of the Charles River, combined-sewer overflows were occurring with increasing frequency. The increased frequency was attributed largely to increased dry-weather flows of sanitary sewage from the steadily growing population in the service area. Stormwaterrunoff volumes also were steadily increasing because of the expansion of impervious area in the contributing watersheds. It was suggested that the interceptor sewers may have been undersized, for economic reasons, when originally constructed: The cost of making the main drainage and metropolitan sewers of anywhere near the capacity of the old combined common sewers and storm drains would have been absolutely prohibitive. Economy forbade making these long and costly conduits to Moon Island and to Deer Island more than a little larger than was required for the sewage proper, the household and factory wash water carrying waste. Today, speaking generally, these main interceptors are found near their lower ends only sufficiently large to carry about two or three times the mean dry-weather flow; and this...flow is much smaller than the flow in the sewers during the forenoon of Monday or washing day in March or April when house drainage flow is heaviest and the ground water flow is large (Freeman, 1903, p. 146). After evaluation of all other alternatives, including complete sewer separation in Boston and Cambridge, and dredging the mudflats of the entire estuary to a level below mean low water, the creation of a freshwater basin was considered to be the most feasible approach to sanitary problems in the river. A new freshwater basin, modeled after the Alster Basin of Hamburg, Germany, would provide, in Freeman s words, a magnificent opportunity for wholesome recreation and the enjoyment of a more beautiful landscape (Freeman, 1903, p. 108). The dam proposal was approved by the legislature, and construction proceeded. The dam was completed by 1908; the park overlying the dam and several ancillary projects were completed by One of these projects was the Boston Marginal Conduit, located below the present Storrow Drive. The conduit still conveys the combined sewage of northern Back Bay (fig. 1) to a CSO-treatment facility downstream of the 1908 dam. Recent History The physical infrastructure of the freshwater basin has been upgraded in recent decades to address new challenges (Breault, Barlow and others, 2000; Haglund, 2003). In 1978, the U.S. Army Corps of Engineers built a second dam about 2,500 ft downstream of the original dam to control floods and improve the passage of anadromous fish. Pumps in the new dam are designed to maintain a constant water level in the freshwater basin of about 2.4 ft above mean sea level. The pumps are capable of maintaining a constant basin water level when the level of Boston Harbor exceeds that of the basin, and upstream flood waters would otherwise inundate the adjacent parklands, parkways, and residential areas of Cambridge and the northern Back Bay. Such flooding occurred during two large hurricanes in the 1950s (U.S. Army Corps of Engineers, 1968). The sewage-collection and treatment systems of the watershed have recently undergone a period of major reconstruction. By the 1980s, the Metropolitan Sewerage System, although enlarged and improved from the system of 75 years earlier, had become overburdened by the demands of a greatly enlarged metropolitan population (Massachusetts Water Resources Authority, 2004a). In 1985, a Federal court directed the Commonwealth of Massachusetts to rebuild the region s sewage-treatment and other wastewater infrastructure to meet the requirements of the Federal Clean Water Act. In response, a multibillion-dollar construction project was undertaken under the direction of a newly created Massachusetts Water Resources Authority. By 1997, the new treatment facility at Deer Island was completed. In 2000, a 9.5-mi-long, deep-rock outfall
47 Water and the Urban Environment 41 Figure 21. The seawall and tidal flats on the Boston side of the lower Charles River, northern Back Bay, about Figure The (Freeman, seawall 1903). on the View Boston is toward side of the the east, lower along Charles the present River, northern course of Back Storrow Bay, Drive. about The tidal flats of the Charles River were frequently polluted by sewage during periods of lower-than-average tide (neap-tide periods), adversely affecting the adjacent residences of northern Back Bay. tunnel was finished. The tunnel now conveys treated wastewater effluent from the Deer Island treatment facility, below Boston Harbor, to Massachsuetts Bay (Massachusetts Water Resources Authority, 2004a). The cleanup of Boston Harbor has been the most prominent aspect of this reconstruction effort. However, the challenges of urban runoff, combinedsewer overflows, fish passage, and parkland restoration along the lower Charles River and other Boston Harbor tributaries have not been neglected during this process. In fact, the Charles River is now receiving a degree of public attention, appreciation, and investment not seen in over a century. Summary The Charles River follows a winding, 83-mi course from its source in east-central Massachusetts to its mouth at Boston Harbor. The lower Charles River, the 9.5-mi reach downstream of the original head of tide at Watertown, was once a productive tidal estuary with abundant fish and shellfish stocks. For over 4,000 years before the early 1600s, the lower watershed supported a large Native American community. In the 1630s, English colonists established several towns in the watershed, including Boston, Cambridge, Watertown, Brookline (originally Muddy River Hamlet), and Roxbury. The largest of these towns was Boston, located on a neck of land known as the Shawmut Peninsula at the mouth of the Charles River. Soon after its founding, Boston become a major seaport, and later played a critical role in the American Revolution and the subsequent economic, political, and cultural development of the Nation. The purpose of this report is to enhance public awareness of the physical and hydrologic setting of the lower Charles River watershed, its diverse water resources, and the main ways in which urbanization has affected its hydrologic functioning. The report was prepared in cooperation with the U.S. Environmental Protection Agency (USEPA), Region I, and the Massachusetts Department of Environmental Protection, as part of the USEPA s Clean Charles 2005 Initiative.
48 42 Water Resources and the Urban Environment, Lower Charles River Watershed, Massachusetts, The landscape of the lower Charles River watershed has been profoundly affected by 375 years of urbanization. Upland areas of the watershed are underlain by conglomerate and other rocks resistant to erosion; lowland areas near the Charles River are underlain by more easily eroded slates. All of the tidelands of the original Charles River estuary about 1,500 acres of mud flats and salt marshes in lowlands adjacent to the river have been filled. Fill material was mainly obtained by excavating glacial deposits till, sand, and gravel from the watershed and surrounding areas. The fill projects were undertaken to create new land for public and private use, and in many cases to provide temporary relief from sewage contamination of shallow tidal-water bodies. The Back Bay, with a total area of about 740 acres, was the largest area to be filled adjacent to the lower Charles River. The water resources of the lower Charles River watershed consist of the mainstem river itself, 17 tributaries, 13 named ponds and reservoirs, numerous unnamed ponds and wetlands, and the ground-waterflow system. As with the surrounding landscape, human activity has greatly altered these resources. The first dam on the mainstem river was constructed in 1638, at the head of tide in Watertown, to provide power for a grist mill. The mouth of the river at Boston was dammed in the early 20th century to create a freshwater basin for public boating and recreation. The tributaries of the lower Charles River have been almost completely culverted, except for the uppermost reach of Stony Brook in West Roxbury and Muddy River (the core of Boston s Emerald Necklace parkland corridor). Stony Brook is the largest tributary in the watershed, and Muddy River is the second largest, as measured by drainage area. The remaining 15 tributaries of the lower Charles River are generally unknown to the public; the largest of these streams are Laundry Brook in Newton (partially culverted) and Faneuil Brook in Brighton (completely culverted). The ponds, wetlands, and reservoirs of the watershed provide essential habitat for wildlife, and also provide recreational benefits to the surrounding communities. Jamaica Pond, the source of the Muddy River, is the largest natural freshwater body in the watershed. Other sizable ponds include Hammond Pond in Newton and Chandler Pond in Brighton. The largest surviving wetland is adjacent to Hammond Pond; the majority of the original freshwater wetlands in the watershed have been drained or filled. Chestnut Hill Reservoir in Newton and Brookline Reservoir in Brookline are the two largest reservoirs in the watershed, although neither is now used for public water supply. For the first 150 years of Boston s history, ground water was the principal source of water for domestic use and the principal sink for human wastes. Ground-water resources are no longer used in the lower Charles River watershed for either purpose. Urbanization has affected the hydrology and environmental quality of the lower Charles River watershed in many ways. Street paving and storm-drain construction began in Boston in the 1700s, and likely enhanced public health by improving local drainage in upland areas of the city. The spread of impervious cover, however, especially after the advent of the automobile in the early 20th century, led to higher storm flows in the major tributaries, and lower base flows during dry-weather periods. As a result, lowland areas of the city, especially adjacent to Muddy River and Stony Brook, were frequently flooded during large storms. Urbanization also affected the quality of storm runoff. High concentrations of fecal bacteria, nutrients, metals, and other contaminants in runoff, as well as illicit sewage connections to the storm-drain system, substantially impaired the river ecosystem and precluded human contact recreation. Although local ground-water sources met the water-supply needs of the human population during the first 150 years of European settlement, the need for new sources in Boston became pressing by the mid- 19th century. Accordingly, a reservoir was developed in 1848, 10 miles west of the city, and a water-distribution system was constructed to convey the water to Boston. A citywide sewage-collection and disposal system was not built until Both the water-supply and sewage-collection systems were expanded in several phases over the next century, and eventually were enlarged to serve the entire metropolitan area. Over the past 15 years, the metropolitan sewage-collection and -treatment system has undergone a major reconstruction. Consequently, the water quality of Boston Harbor, the Charles River, and other rivers in the greater Boston region has substantially improved. Further improvements in the quality of the Charles River and its tributaries are expected to result from continued efforts to eliminate illicit sewage discharges and improve stormwater management in the watershed.
49 Summary 43 Courtesy of the Boston Water and Sewer Commission The Back Bay Fens and surrounding area, Boston, late 1990s. The view is toward the north. Acknowledgments The authors thank the following municipal agencies for providing geographic information for this project: Boston Water and Sewer Commission (BWSC), Brookline Information Technologies Department, Cambridge Management Information Systems (MIS) Department, Cambridge Department of Public Works, Newton MIS Department, and Watertown Department of Public Works. The authors also thank the Massachusetts Water Resources Authority (MWRA) and Metcalf & Eddy, Inc., for additional geographic information. We thank Amy Schofield and John Sullivan of BWSC for permission to reproduce historic photographs. For permission to reproduce other historic materials, we thank the Boston Athenaeum and the David Rumsey Historical Map Collection. Phillip Zarriello and Robert Breault of USGS supplied hydrologic advice and critique. Matthew Cooke, Bruce Taggart, Wayne Sonntag, Leslie DeSimone, and Dorothy Tepper of USGS reviewed the manuscript, and Christine Mendelsohn of USGS prepared the final illustrations and layout. Finally, we thank William Walsh-Rogalski of the U.S. Environmental Protection Agency for his editorial comments, cooperation and support throughout the project. References Cited Aldrich, H.L. and Lambrechts, J.R., 1986, Back Bay Boston, Part II Groundwater levels: Civil Engineering Practice, v. 1, no. 2, p Boston Water and Sewer Commission, 1997, Stony Brook sewer system study: prepared by Camp, Dresser, and McKee, variously paginated. Breault, R.F., Weiskel, P.K., and McCobb, T.D., 1998, Channel morphology and streambed-sediment quality in the Muddy River, Boston and Brookline, Massachusetts, October 1997: U.S. Geological Survey Water-Resources Investigations Report , 1 pl. (1:12,500).
50 44 Water Resources and the Urban Environment, Lower Charles River Watershed, Massachusetts, Breault, R.F., Barlow, L.K., Reisig, K.D., and Parker, G.W., 2000, Spatial distribution, temporal variability, and chemistry of the salt wedge in the lower Charles River, Massachusetts, June 1998 to July 1999: U.S. Geological Survey Water-Resources Investigations Report , 1 pl. (1:12,500). Breault, R.F., Reisig, K.R., Barlow, L.K., and Weiskel, P.K., 2000, Distribution and potential for adverse biological effects of inorganic elements and organic compounds in bottom sediment, lower Charles River, Massachusetts: U.S. Geological Survey Water-Resources Investigations Report , 70 p. Breault, R.F., Sorenson, J.R. and Weiskel, P.K., 2002, Streamflow, water quality, and contaminant loads in the lower Charles River watershed, Massachusetts, : U.S. Geological Survey Water-Resources Investigations Report , 139 p. Bridenbaugh, C., 1971, Cities in the wilderness The first century of urban life in America, : London, Oxford University Press, 242 p. Charles River Conservancy, 2004, Renewing the Charles River parklands: accessed February 26, 2004, at charlesriverconservancy.org/. Charles River Watershed Association, 1999, Charles River watershed integrated monitoring, modeling and management project, phase II final report, February, 1999, 151 p. Charles River Watershed Association, 2004a, History of the Charles River: accessed February 1, 2004 at Charles River Watershed Association, 2004b, Baseline waterquality monitoring program: accessed February 25, 2004 at City of Boston, 1878, Sixth annual report of the Board of Health, May 1, 1878, City Document no. 68, p. 3. City of Boston/Town of Brookline, 2003, Final environmental impact report phase I Muddy River flood control, water quality, habitat enhancement, and historic preservation project, v. 1, Main Report (EOEA #11865): prepared by Camp, Dresser, and McKee, Inc., variously paginated. City of Newton, 1929, Drain Atlas (revised 1979): City of Newton, MA, Department of Public Works, 9 sheets. Clarke, E.C., 1888, Main Drainage Works of the City of Boston, 2d edition: Boston, MA, Rockwell and Churchill, City Printers, 52 p. Decema, E.B. and Dincauze, D.F., 1998, The Boston Back Bay fish weirs: in Hidden dimensions The cultural significance of wetland archaeology, K. Bernick, ed.: Vancouver, BC, University of British Columbia Press, p Duffy, J., 1992, The sanitarians A history of American public health: Urbana, IL, University of Illinois Press, 330 p. Eliot, C.W., and Morgan, K.N., 2000, Charles Eliot, landscape architect: Amherst, MA, University of Massachusetts Press, 770 p. Elkind, S.S., 1998, Bay cities and water politics The battle for resources in Boston and Oakland: Lawrence, KS, University Press of Kansas, 288 p. Freeman, J.R., 1903, Report of the Chief Engineer, in Prichett, H.S. and others, 1903, Report of the Committee on the Charles River Dam Commonwealth of Massachusetts, Resolves of 1901, Chapter 105: Boston, MA, Wright & Potter Printing Co., 579 p. French, J.A., ed., 1986, Boston s water resource development Past, present, and future: American Society of Civil Engineers, 51 p. Goldsmith, R., 1991, Structural and metamorphic history of eastern Massachusetts: U.S. Geological Survey Professional Paper 1366-H, p. H1-H63. Greenberger, S.S., 2003, Some have that sinking feeling: Boston Globe, July 9, 2003, p. B1. Haglund, K., 2003, Inventing the Charles River: Cambridge, MA, MIT Press, 493 p. Kaye, C.A., 1976, The geology and early history of the Boston area of Massachusetts, a bicentennial approach: U.S. Geological Survey Bulletin 1476, 78 p. Kennedy, L.W., 1994, Planning the city upon a hill Boston since 1630: Amherst, MA: University of Massachusetts Press, 328 p. Krieger, A., and Cobb, D., with Turner, A., eds., 1999, Mapping Boston: Cambridge, MA, MIT Press, 278 p. Ladd, C.C., Young, G.A., Kraemer, S.R. and Burke, D.M. 1999, Engineering properties of Boston Blue Clay from special testing program, Proceedings: Special geotechnical testing Central Artery/Tunnel project in Boston, Massachusetts, GSP 91, GeoCongress 98, American Society of Civil Engineers National Convention, Boston, Mass., p Cotton, J.E., and Delaney, D.F., 1975, Ground-water levels on Boston Peninsula, Massachusetts: U.S. Geological Survey Hydrologic Investigations Atlas HA-513, 4 pl.
51 References Cited 45 Massachusetts Geographic Information System, 2004, Hydrography Data Layer, 1:25,000 scale (revised October 2004): accessed November 26, 2004, at ma.us/mgis/hd/htm Massachusetts Water Resources Authority, 1994, Baseline water-quality assessment Master planning and CSO facility planning document, August, 1994, variously paginated. Massachusetts Water Resources Authority, 2004a, A history of the sewer system: accessed January 16, 2004 at mwra.state.ma.us/. Massachusetts Water Resources Authority, 2004b, Boston Harbor and tributary rivers water quality report: accessed February 23, 2004 at html/bhreport.htm Massachusetts Water Resources Authority, 2004c, Water System History: accessed January 16, 2004 at mwra.state.ma.us/04water/html/hist1.htm Melosi, M.V., 2000, The sanitary city Urban infrastructure in America from colonial times to the present: Baltimore, MD, Johns Hopkins University Press, 600 p. Muir, D., 2002, Reflections in Bullough s Pond Economy and ecosystem in New England: Hanover, NH, University Press of New England, 324. p. National Park Service, 2004a, The Boston Harbor Islands National Recreation Area, Massachusetts: accessed November 23, 2004, at National Park Service, 2004b, The Frederick Law Olmsted National Historic Site, Brookline, Massachusetts: accessed February 11, 2004, at Nesson, F.L., 1983, Great waters A history of Boston s water supply: Hanover, NH, University Press of New England, 136 p. Page, T.H., 1776, A plan of the town of Boston and its environs, with the lines, batteries, and encampments of the British and American armies, 1776, by Sir Thomas Hyde Page. Accessed Feb. 9, 2005 from the Library of Congress online Map Collection, at query/d?gmd:3:./temp/~ammem_gk0a::. Pritchett, H.S., Mansfield, S.M., and Dana, R.H., 1903, Report of the Committee on the Charles River Dam: Commonwealth of Massachusetts, Resolves of 1901, Chapter 105: Boston, MA, Wright & Potter Printing Co, 579 p. Randall, A.D., 1996, Mean annual runoff, precipitation, and evapotranspiration in the glaciated northeastern United States, : U.S. Geological Survey Open-File Report , 2 pls. Rawson, M., 2004, The nature of water Reform and the antebellum crusade for municipal water in Boston: Environmental History v. 9, no 3, p Rosen, P.S., Brennikmeyer, B.M, and Maybury, L.M., 1993, Holocene evolution of the Boston Inner Harbor, Massachusetts: Journal of Coastal Research, v. 9, no. 2, p Seasholes, N.S., 2003, Gaining ground A history of landmaking in Boston: Cambridge, MA, MIT Press, 533 p. Skehan, J.W., 1979, Puddingstone, drumlins, and ancient volcanoes A geologic field guide along historic trails of greater Boston: Dedham, MA, WesStone Press, 63 p. Skehan, J.W., 2001, Roadside geology of Massachusetts: Missoula, MT, Mountain Press Publishing Co., 379 p. Sidney, F.G., 1852, Map of the city and vicinity of Boston, Massachusetts from original surveys by F.G. Sidney, C.E.: Boston, Mass., J.B. Shields Publishers: accessed January 16, 2004 at Smith, J.D., Harrington, J.J., Heiler, B.F., and Radiloff, H., 1972, Combined sewer overflows to the Charles River Basin Report to the Massachusetts Water Resources Commission, Division of Water Pollution Control, variously paginated. Spirn, A.W., 1984, The granite garden Urban nature and human design: New York, NY, Basic Books, 334 p. Tarr, J.A., 1996, The search for the ultimate sink Urban pollution in historical perspective: Akron, OH, University of Akron Press, 419 p. Town of Brookline, 2004, Drainage Areas Map: accessed February 25, 2004, at maplib/basmap8x11.pdf U.S. Army Corps of Engineers, 1968, Interim report on the Charles River, Massachusetts, for flood control and navigation: Department of the Army, New England Division, Corps of Engineers, Waltham, MA, variously paginated. U.S. Environmental Protection Agency, 2004, Charles River water-quality monitoring: accessed February 23, 2004, at
52 46 Water Resources and the Urban Environment, Lower Charles River Watershed, Massachusetts, U.S. Geological Survey, 1890, Boston, Massachusetts, 15- minute 1:62,500 topographic map, surveyed in : 1 sheet. U.S. Geological Survey, 1987, Boston South, Massachusetts, 1:25,000-scale metric topographic map, 1 sheet. Whitehill, W.M., 1968, Boston A topographical history (2d ed.): Cambridge, MA, the Belknap Press of Harvard University Press, Cambridge, MA, 299 p. Zaitzevsky, C., 1982, Frederick Law Olmsted and the Boston park system: Cambridge, MA, Belknap Press of Harvard University Press, 262 p. Zarriello, P.J. and Barlow, L.K., 2002, Measured and simulated runoff to the lower Charles River, Massachusetts, October 1999 September 2000, U.S. Geological Survey Water-Resources Investigations Report , 89 p. Zarriello, P.J., Breault, R.F., and Weiskel, P.K., 2003, Potential effects of structural controls and street sweeping on stormwater loads to the lower Charles River, Massachusetts: U.S. Geological Survey Water-Resources Investigations Report , 48 p. Zen, E-an, Goldsmith, G.R., Ratcliffe, N.L., Robinson, P., and Stanley, R.S., 1983, Bedrock geologic map of Massachusetts: U.S. Geological Survey, Monograph series, 3 map sheets, 1:250,000. Drawings of cross sections of culverted streams, Boston, about Courtesy of Boston Water and Sewer Commission
53
Muddy River Restoration Project Project Description
 Muddy River Restoration Project Project Description Since the fall of 1996, the Muddy River has flooded three times, causing damage to residents, businesses institutions and the public transit system in
Tax Exempt Property in Boston
 Tax Exempt Property in Boston Analysis of Types, Uses, and Issues THOMAS M. MENINO, MAYOR CITY OF BOSTON Boston Redevelopment Authority Mark Maloney, Director Clarence J. Jones, Chairman Consuelo Gonzales
The Muddy River: A Century of Change
 The Muddy River: A Century of Change Tom Brady, Brookline Conservation Administrator, Tree Warden, Town Arborist 617-730-2088 or [email protected] Muddy River Flood Damage Reduction and Environmental
4. Environmental Impacts Assessment and Remediation Targets
 4. Environmental Impacts Assessment and Remediation Targets 4.1 Environmental Impacts Significant additional development in the Alder Creek watershed is not anticipated at this time; however, there are
4.2 Buena Vista Creek Watershed
 Buena Vista Creek Watershed 4.2 Buena Vista Creek Watershed Watershed Overview The Buena Vista Creek Watershed is the fourth-largest system within the Carlsbad Hydrologic Unit. The watershed extends approximately
The River Ribble is one of the longest rivers in the North West of England
 River Ribble The River Ribble is one of the longest rivers in the North West of England Did you know? The tidal limit of the Ribble is 11 miles inland (above Preston); The River Ribble is home to a variety
BLACK/HARMONY/FAREWELL CREEK WATERSHED EXISTING CONDITIONS REPORT CHAPTER 12 - STORMWATER MANAGEMENT
 Harmony Creek subwatershed Harmony Creek subwatershed BLACK/HARMONY/FAREWELL CREEK WATERSHED EXISTING CONDITIONS REPORT CHAPTER 12 - STORMWATER MANAGEMENT April 2011 TABLE OF CONTENTS 1.0 INTRODUCTION...
AN INITIATIVE TO IMPROVE
 L OW E R C A R M E L R I V E R A N D L AG O O N F L O O D P L A I N R E S TO R AT I O N A N D E N H A N C E M E N T P R O J E C T AN INITIATIVE TO IMPROVE FLOOD PROTECTION RESTORE AND PROTECT RIPARIAN
COMPREHENSIVE PLAN SECTION B, ELEMENT 4 WATER RESOURCES. April 20, 2010 EXHIBIT 1
 COMPREHENSIVE PLAN SECTION B, ELEMENT 4 WATER RESOURCES April 20, 2010 EXHIBIT 1 ELEMENT 4 WATER RESOURCES TABLE OF CONTENTS 4.1 INTRODUCTION 4.2 GOALS AND POLICIES 4.2.A General Goals and Policies 1 4.2.B
Muddy River Restoration Project Maintenance and Management Oversight Committee 68 Harvard Street Brookline, Massachusetts 02447 www.muddyrivermmoc.
 Muddy River Restoration Project Maintenance and Management Oversight Committee 68 Harvard Street Brookline, Massachusetts 02447 www.muddyrivermmoc.org FEDERAL FUNDING OF ENVIRONMENTAL RESTORATION IN PHASE
CLACKAMAS COUNTY ZONING AND DEVELOPMENT ORDINANCE
 1008 STORM DRAINAGE (3/24/05) 1008.01 PURPOSE To minimize the amount of stormwater runoff resulting from development utilizing nonstructural controls where possible, maintain and improve water quality,
Shooks Run Drainage Study Basic Terminology
 Shooks Run Drainage Study Basic Terminology PREPARED FOR: PREPARED BY: City of Colorado Springs CH2M DATE: April 9, 2015 Introduction This document is intended to provide an introduction to Colorado Springs
Flash Flood Science. Chapter 2. What Is in This Chapter? Flash Flood Processes
 Chapter 2 Flash Flood Science A flash flood is generally defined as a rapid onset flood of short duration with a relatively high peak discharge (World Meteorological Organization). The American Meteorological
City of Cambridge Climate Protection Action Committee. Recommendations for Adaptation to Climate Change. Purpose
 City of Cambridge Climate Protection Action Committee Recommendations for Adaptation to Climate Change Purpose The Climate Protection Action Committee (CPAC) is an advisory body to the City Manager on
Development of an Impervious-Surface Database for the Little Blackwater River Watershed, Dorchester County, Maryland
 Development of an Impervious-Surface Database for the Little Blackwater River Watershed, Dorchester County, Maryland By Lesley E. Milheim, John W. Jones, and Roger A. Barlow Open-File Report 2007 1308
Detention Ponds. Detention Ponds. Detention Ponds. Detention Ponds. Detention Ponds. Detention Ponds. CIVL 1112 Detention Ponds - Part 1 1/12
 CIVL 1112 - Part 1 1/12 The water cycle, also known as the hydrologic cycle, describes the continuous movement of water on, above and below the surface of the Earth. The water cycle, also known as the
Lower Raritan Watershed Management Area Stormwater & Flooding Subcommittee Strategy Worksheet LRSW-S3C1
 Strategy Name: Reduce Existing Potential for Flood Damages LRSW-S3C1. Develop and implement a program to: Minimize flood damages through the use of structural measures. Minimize flood damages through the
Travel Time. Computation of travel time and time of concentration. Factors affecting time of concentration. Surface roughness
 3 Chapter 3 of Concentration and Travel Time Time of Concentration and Travel Time Travel time ( T t ) is the time it takes water to travel from one location to another in a watershed. T t is a component
Environmental Case Study Decatur, Georgia, DeKalb County A Suburban Creek Resists Channelization
 Introduction A visual examination of Doolittle Creek in a highly developed suburban county in Georgia yielded telltale signs of a creek whose original streambed had been altered. Examination of official
Land Disturbance, Erosion Control and Stormwater Management Checklist. Walworth County Land Conservation Department
 Land Disturbance, Erosion Control and Stormwater Management Checklist Walworth County Land Conservation Department The following checklist is designed to assist the applicant in complying with the Walworth
WONDERFUL, WATERFUL WETLANDS
 WONDERFUL, WATERFUL WETLANDS OBJECTIVES The student will do the following: 1. List characteristics of wetlands. SUBJECTS: Science, Language Arts TIME: 60 minutes 2. Describe the functions of a wetland.
RESTORATION AND ENHANCEMENT OF SOUTHERN CALIFORNIA LAGOONS
 RESTORATION AND ENHANCEMENT OF SOUTHERN CALIFORNIA LAGOONS by Hany Elwany, Ph.D. Scripps Institution of Oceanography Headwaters to Oceans Conference 25 October 2003 CE Ref #03-22 San Diego County Lagoons
Briefing Paper on Lower Galveston Bay and Bayou Watersheds Lower Bay I: Armand Bayou to Moses Lake and Adjacent Bay Waters
 Briefing Paper on Lower Galveston Bay and Bayou Watersheds Lower Bay I: Armand Bayou to Moses Lake and Adjacent Bay Waters Jim Lester, PhD. and Lisa Gonzalez Houston Advanced Research Center Galveston
How To Plan A Buffer Zone
 Backyard Buffers Protecting Habitat and Water Quality What is a buffer? A buffer (also called a riparian buffer area or zone) is the strip of natural vegetation along the bank of a stream, lake or other
Earth Science. River Systems and Landforms GEOGRAPHY 1710. The Hydrologic Cycle. Introduction. Running Water. Chapter 14.
 Earth Science GEOGRAPHY 1710 River Systems and Landforms DAVID R. SALLEE Robert W. Christopherson Charlie Thomsen Chapter 14 Introduction Rivers and streams are dynamic systems that continually adjust
Background Information: The Mamquam River Floodplain Restoration Project
 Background Information: The Mamquam River Floodplain Restoration Project The Mamquam River Floodplain Restoration project is being undertaken in partnership with the Squamish River Watershed Society, Fisheries
URBAN DRAINAGE CRITERIA
 URBAN DRAINAGE CRITERIA I. Introduction This division contains guidelines for drainage system design and establishes a policy for recognized and established engineering design of storm drain facilities
LYNDE CREEK WATERSHED EXISTING CONDITIONS REPORT CHAPTER 12 - STORMWATER MANAGEMENT
 Whitby CLOCA Whitby CLOCA LYNDE CREEK WATERSHED EXISTING CONDITIONS REPORT CHAPTER 12 - STORMWATER MANAGEMENT June 2008 TABLE OF CONTENTS 1.0 INTRODUCTION... 3 2.0 STUDY AREA AND SCOPE... 4 3.0 METHODOLOGY...
DOÑA ANA COUNTY DESIGN STORM CRITERIA GUIDELINES FOR COMMERCIAL AND RESIDENTIAL SITES. Run-off Analysis Methods
 DOÑA ANA COUNTY DESIGN STORM CRITERIA GUIDELINES FOR COMMERCIAL AND RESIDENTIAL SITES Run-off Analysis Methods This document sets forth the minimum design, technical criteria and specifications for the
CITY UTILITIES DESIGN STANDARDS MANUAL
 CITY UTILITIES DESIGN STANDARDS MANUAL Book 2 (SW) SW9 June 2015 SW9.01 Purpose This Chapter provides information for the design of open channels for the conveyance of stormwater in the City of Fort Wayne.
A HYDROLOGIC NETWORK SUPPORTING SPATIALLY REFERENCED REGRESSION MODELING IN THE CHESAPEAKE BAY WATERSHED
 A HYDROLOGIC NETWORK SUPPORTING SPATIALLY REFERENCED REGRESSION MODELING IN THE CHESAPEAKE BAY WATERSHED JOHN W. BRAKEBILL 1* AND STEPHEN D. PRESTON 2 1 U.S. Geological Survey, Baltimore, MD, USA; 2 U.S.
Rhode Island NRCS received approximately $2.4 million in ARRA funds to implement four floodplain easement projects.
 American Recovery and Reinvestment Act (ARRA) Emergency Watershed Protection Program Floodplain Easements Rhode Island Natural Resources Conservation Service Rhode Island NRCS received approximately $2.4
The Hydrologic Cycle. precipitation evaporation condensation transpiration infiltration surface runoff transport groundwater water table.
 The Hydrologic Cycle Page 1 of 1 Name Directions: The hydrologic cycle consists of the processes that change and move water through the earth s system. Use the terms below to label the hydrologic cycle.
Risk Analysis, GIS and Arc Schematics: California Delta Levees
 Page 1 of 7 Author: David T. Hansen Risk Analysis, GIS and Arc Schematics: California Delta Levees Presented by David T. Hansen at the ESRI User Conference, 2008, San Diego California, August 6, 2008 Abstract
30-DAY PUBLIC NOTICE CHELSEA RIVER, EAST BOSTON MASSACHUSETTS EMERGENCY STREAMBANK PROTECTION PROJECT
 PUBLIC NOTICE Engineering/Planning 696 Virginia Road Concord, MA 01742 Date: 10 November, 2015 Comment Period Ends: 10 December, 2015 In Reply, Refer To: Robert Russo Or by e-mail: [email protected]
TENNESSEE GAS PIPELINE COMPANY, L.L.C.
 TENNESSEE GAS PIPELINE COMPANY, L.L.C. HYDROLOGIC & HYDRAULIC CALCULATIONS FOR WATERBODIES CROSSED BY CONNECTICUT PIPELINE EXPANSION PROJECT CONNECTICUT LOOP Submitted by: Tennessee Gas Pipeline Company,
3. The submittal shall include a proposed scope of work to confirm the provided project description;
 QIN Shoreline Master Program Project Summary The Shoreline Master Program (SMP) development process for the Quinault Indian Nation (QIN) includes the completion of inventory and analysis report with corresponding
CHAPTER 2 HYDRAULICS OF SEWERS
 CHAPTER 2 HYDRAULICS OF SEWERS SANITARY SEWERS The hydraulic design procedure for sewers requires: 1. Determination of Sewer System Type 2. Determination of Design Flow 3. Selection of Pipe Size 4. Determination
SLOPE AND TOPOGRAPHY
 SLOPE AND TOPOGRAPHY What are Slope and Topography? Slope and topography describe the shape and relief of the land. Topography is a measurement of elevation, and slope is the percent change in that elevation
Drainage Analysis for the McKownville Area
 Drainage Analysis for the McKownville Area Town of Guilderland Albany County, New York Prepared by: DELAWARE ENGINEERING, P.C. 28 Madison Avenue Extension Albany, New York 12203 June 2010 Town of Guilderland
Flood Risk Management
 Flood Risk Management Value of Flood Risk Management Every year floods sweep through communities across the United States taking lives, destroying property, shutting down businesses, harming the environment
Flood Risk Management
 Flood Risk Management Value of Flood Risk Management Value to Individuals and Communities Every year floods sweep through communities across the United States taking lives, destroying property, shutting
SUSTAINABLE URBAN DRAINAGE SYSTEMS
 overflow can lead into a permeable conveyance system to increase further the benefit and reduce the need for pipe systems. Pollutant removal rates have been shown to be high, with some pollutants being
Stream Channel Cross Sections for a Reach of the Boise River in Ada County, Idaho
 U.S. Department of the Interior U.S. Geological Survey In cooperation with Federal Emergency Management Agency, City of Boise, City of Garden City, City of Eagle, and Ada County Stream Channel Cross Sections
The Basics of Chapter 105 Waterways and Wetlands Permitting in PA
 The Basics of Chapter 105 Waterways and Wetlands Permitting in PA April 17, 2013 Goal To develop a basic understanding of PA Department of Environmental Protection (DEP) and US Army Corps of Engineers
FINAL PLAN OF REMEDIAL ACTION
 FINAL PLAN OF REMEDIAL ACTION 1000 FRENCH STREET SITE Wilmington, Delaware DE 1115 June 1999 Department of Natural Resources and Environmental Control Division of Air and Waste Management Site Investigation
MEMORANDUM. Further discussion regarding the Community s solid waste facility is described further in this memorandum.
 MEMORANDUM File: Sanikiluaq Improvement of the Existing Wastewater Treatment Facility To: Government of Nunavut Department of Community and Government Services Attention: Mr. Grigor Hope,, Project Officer
1.7.0 Floodplain Modification Criteria
 1.7.0 Floodplain Modification Criteria 1.7.1 Introduction These guidelines set out standards for evaluating and processing proposed modifications of the 100- year floodplain with the following objectives:
Comments on: Middlesex School East Fields Athletics Drainage Calculations Samiotes Consultants, Inc., 16 November 2004
 Comments on: Middlesex School East Fields Athletics Drainage Calculations Samiotes Consultants, Inc., 16 November 2004 submitted to Massachusetts Department of Environmental Protection by William W. Walker,
Challenges. Estimated Damages from 100-Year Flood
 Suffield Suffield is a rural community located along the Massachusetts border. It encompasses about 42.2 square miles and has a population of about 15,735. Suffield s terrain rises from an elevation of
FLOOD RISK AND SURFACE WATER DRAINAGE ASSESSMENT HILLHOUSE RESTORATION SITE, OFF JAMESON ROAD, THORNTON CLEVELEYS ON BEHALF OF NPL ESTATES
 FLOOD RISK AND SURFACE WATER DRAINAGE ASSESSMENT HILLHOUSE RESTORATION SITE, OFF JAMESON ROAD, THORNTON CLEVELEYS ON BEHALF OF NPL ESTATES Integra Consulting Engineers Limited NS / 2543 Fountain House
Catchment Scale Processes and River Restoration. Dr Jenny Mant [email protected]. The River Restoration Centre therrc.co.uk
 Catchment Scale Processes and River Restoration Dr Jenny Mant [email protected] The River Restoration Centre therrc.co.uk 3 Main Catchment Elements Hydrology Energy associated with the flow of water affects
Outlet stabilization structure
 Overview of Sedimentation and Erosion Control Practices Practice no. 6.41 Outlet stabilization structure Erosion at the outlet of channels, culverts, and other structures is common, and can cause structural
Interim Technical Guidelines for the Development of Environmental Management Plans for Underground Infrastructure Revised - July 2013.
 Interim Technical Guidelines for the Development of Environmental Management Plans for Underground Infrastructure Revised - July 2013 Rationale Underground infrastructure may be at risk from valley, streambank
5.14 Floodplains and Drainage/Hydrology
 I-70 East Final EIS 5.14 Floodplains and Drainage/Hydrology 5.14 Floodplains and Drainage/Hydrology This section discusses floodplain and drainage/hydrology resources and explains why they are important
WILLOCHRA BASIN GROUNDWATER STATUS REPORT 2009-10
 WILLOCHRA BASIN GROUNDWATER STATUS REPORT 2009-10 SUMMARY 2009-10 The Willochra Basin is situated in the southern Flinders Ranges in the Mid-North of South Australia, approximately 50 km east of Port Augusta
GLOSSARY OF TERMS CHAPTER 11 WORD DEFINITION SOURCE. Leopold
 CHAPTER 11 GLOSSARY OF TERMS Active Channel The channel that contains the discharge Leopold where channel maintenance is most effective, sediment are actively transported and deposited, and that are capable
A Developer s Guide: Watershed-Wise Development
 A Developer s Guide: Watershed-Wise Development Environmental Protection What is a watershed? It does not matter how far away you build from a creek, lake, or the ocean, you are in a watershed. Another
Policy & Management Applications of Blue Carbon. fact SHEET
 Policy & Management Applications of Blue Carbon fact SHEET Policy & Management Applications of Blue Carbon Coastal Blue Carbon - An Important Wetland Ecosystem Service Coastal Blue Carbon refers to the
 Coldwater Heritage Partnership Implementation Grant Final Report Morrison Run Watershed Restoration Project Western Pennsylvania Conservancy Project Summary The goal of the Morrison Run Watershed Restoration
Floodplain Connectivity in Restoration Design
 Floodplain Connectivity in Restoration Design 2015 Symposium on Restoration in a Contaminated Environment: Lessons Learned and Challenges in Moving Forward Part II April 2015 Karin Boyd Applied Geomorphology,
Ground-Water-Level Monitoring and the Importance of Long-Term Water-Level Data U.S. Geological Survey Circular 1217
 Ground-Water-Level Monitoring and the Importance of Long-Term Water-Level Data U.S. Geological Survey Circular 1217 by Charles J. Taylor William M. Alley Denver, Colorado 2001 U.S. DEPARTMENT OF THE INTERIOR
APPENDIX F. RESIDENTIAL WATER QUALITY PLAN: ALLOWABLE BMP OPTIONS
 APPENDIX F. RESIDENTIAL WATER QUALITY PLAN: ALLOWABLE BMP OPTIONS The following section provides descriptions, advantages, limitations, and schematics of allowable best management practices (BMPs) for
Appendix A. Lists of Accomplishments and Project Costs. UMRWD 10 Year Plan Update. Appendix A UPPER MINNESOTA RIVER WATERSHED DISTRICT
 UPPER MINNESOTA RIVER WATERSHED DISTRICT Lists of Accomplishments and Project Costs 10 Year Plan Update UMRWD 10 Year Plan Update Page A 1 UMRWD LIST OF ACCOMPLISHMENTS Since its inception in 1967, the
March 2008. Prepared by: Irvine Ranch Water District. 15600 Sand Canyon Avenue. Irvine, CA 92618. Contact: Natalie Likens (949) 453-5633
 453-5633") ADDENDUM TO THE MICHELSON WATER RECLAMATION PLANT PHASE 2 & 3 CAPACITY EXPANSION PROJECT FEBRUARY 2006 FINAL ENVIRONMENTAL IMPACT REPORT AND THE SAN JOAQUIN FRESHWATER MARSH ENHANCEMENT PLAN REVISED SEPTEMBER
ADDENDUM TO THE MICHELSON WATER RECLAMATION PLANT PHASE 2 & 3 CAPACITY EXPANSION PROJECT FEBRUARY 2006 FINAL ENVIRONMENTAL IMPACT REPORT AND THE SAN JOAQUIN FRESHWATER MARSH ENHANCEMENT PLAN REVISED SEPTEMBER
Climate, Vegetation, and Landforms
 Climate, Vegetation, and Landforms Definitions Climate is the average weather of a place over many years Geographers discuss five broad types of climates Moderate, dry, tropical, continental, polar Vegetation:
3.4 DRAINAGE PLAN. 3.4.1 Characteristics of Existing Drainages. 3.4.2 Master Drainage System. Section 3: Development Plan BUTTERFIELD SPECIFIC PLAN
 3.4 DRAINAGE PLAN This section describes the existing onsite drainage characteristics and improvements proposed within this Specific Plan. Following this description, drainage plan development standards
Greater Los Angeles County Region
 Attachment 6 Greater Los Angeles County Region IRWM Implementation Grant Proposal Monitoring, Assessment, and Attachment 6 consists of the following items: Monitoring, Assessment, and. The purpose of this
SECTION 3.2 CLIMATE AND PRECIPITATION
 SECTION 3.2 CLIMATE AND PRECIPITATION Ulster County Climate Data A preliminary analysis of the Preserve s weather data shows that the average temperature has risen about two degrees over the past 114 years.
NYCIDA PROJECT COST/BENEFIT ANALYSIS June 5, 2014
 NYCIDA PROJECT COST/BENEFIT ANALYSIS June 5, 2014 APPLICANT Skyline Restoration Inc. CGI Northeast, Inc. Spring Scaffolding LLC Metropolitan Northeast LLC 11-20 37 th Avenue Long Island City, NY 11101
Estimating Potential Reduction Flood Benefits of Restored Wetlands
 Estimating Potential Reduction Flood Benefits of Restored Wetlands Kenneth W. Potter University of Wisconsin Introduction Throughout the summer of 1993 a recurring question was the impact of wetland drainage
Guidelines for. Permeable Pavement
 What is permeable pavement? Guidelines for Permeable Pavement When rainwater falls on conventional pavement, such as concrete, it accumulates and then flows across and off of this impervious surface as
Chehalis River Basin Flood Damage Reduction 2013-2015 Capital Budget Approved by Legislature in June 2013
 Chehalis River Basin Flood Damage Reduction 2013-2015 Capital Budget Approved by Legislature in June 2013 1. Design alternatives for large capital flood projects (basinlevel water retention and Interstate
Clean Water Services. Ecosystems Services Case Study: Tualatin River, Washington
 Viewed broadly, the concept of ecosystem services describes the many resources and services provided by nature. Typically, traditional planning and development practices do not adequately represent the
Chapter 3 CULVERTS. Description. Importance to Maintenance & Water Quality. Culvert Profile
 Chapter 3 CULVERTS Description A culvert is a closed conduit used to convey water from one area to another, usually from one side of a road to the other side. Importance to Maintenance & Water Quality
Rocky EEP Preliminary Findings Report Summary February 2005
 This is a DRAFT summary of the NC Ecosystem Enhancement Upper Rocky River Local Watershed Plan Preliminary Findings Report. The original, 157 page document can be found here: www.ncsu.edu/weco/rocky. The
INFORMATION SHEET ORDER NO. R5-2011-XXXX TRIANGLE ROCK PRODUCTS, INC. FLORIN ROAD AGGREGATE PLANT SACRAMENTO COUNTY
 ORDER NO. R5-2011-XXXX INFORMATION SHEET Background Triangle Rock, Inc. (Discharger) submitted a Report of Waste Discharge (RWD) on 23 August 2010. The Discharger is expanding the mining operations at
Community Workshop 5. Overarching Goals for Machado Lake Ecosystem and Wilmington Drain Multi-Use Projects
 City of Los Angeles Department of Public Works Bureau of Engineering Machado Lake Ecosystem Rehabilitation Project & Wilmington Drain Multi-Use Project Community Workshop 5 February 24, 2009 In association
Environmental Engineering, University of Seoul, Jennong-dong, Dongdaemun-gu, Seoul, Korea.
 WATER QUALITY MANAGEMENT FOR ECOLOGICAL RESTORATION IN ANYANG STREAM Yu, M.J., Cho, Y.M. 2, Lee, S.K. 3 Environmental Engineering, University of Seoul, Jennong-dong, Dongdaemun-gu, Seoul, Korea. 2 Department
Tookany Creek Flood Damage Reduction Feasibility Study Section 205 Continuing Authorities Program
 Tookany Creek Flood Damage Reduction Feasibility Study Section 205 Continuing Authorities Program Field Inspection Notes 27 29 September 2012 Introduction The U.S. Army Corps of Engineers (Corps), in
Flood Plain Reclamation to Enhance Resiliency Conserving Land in Urban New Jersey
 Flood Plain Reclamation to Enhance Resiliency Conserving Land in Urban New Jersey Rutgers Cooperative Extension Water Resources Program Christopher C. Obropta, Ph.D., P.E. Email: [email protected]
ROSE CREEK WATERSHED HYDROLOGIC, HYDRAULIC, SEDIMENT TRANSPORT, AND GEOMORPHIC ANALYSES TASK 1 EXISTING DATA AND INFORMATION SUMMARY REPORT BACKGROUND
 ROSE CREEK WATERSHED HYDROLOGIC, HYDRAULIC, SEDIMENT TRANSPORT, AND GEOMORPHIC ANALYSES TASK 1 EXISTING DATA AND INFORMATION SUMMARY REPORT BACKGROUND The Rose Creek Watershed (RCW) consists of three planning
Addendum. Use Attainability Analysis for Site Specific Selenium Criteria: Alkali Creek. February 23, 2009
 Addendum Use Attainability Analysis for Site Specific Selenium Criteria: Alkali Creek February 23, 2009 Prepared by MWH Americas, Inc. Prepared for EnCana Oil and Gas (USA) Inc. Page 2 Responses to Comments
San Francisco Bay Area Wetlands Restoration Program Design Review Group. Project Summary Outline
 San Francisco Bay Area Wetlands Restoration Program Design Review Group Project Summary Outline The project proponent desiring to have a project considered by the Design Review Group (DRG) shall provide
Prattsville Berm Removal Project. 1.0 Project Location
 Prattsville Berm Removal Project 1.0 Project Location The project site is located between the New York State Route 23 Bridge over the Schoharie Creek and the Schoharie Reservoir. The restoration plan encompassed
Why Watersheds? An introduction to the whys and hows of water resource protection. Center for Watershed Protection
 Why Watersheds? An introduction to the whys and hows of water resource protection In This Presentation Why Watersheds Matter What Is a Watershed Impacts of Impervious Cover What Your Community Can Do What
Storm Water Runoff. Managing. A Self-Assessment Guide for Wisconsin Businesses. Storm water runoff is coming. This guide provides businesses
 Managing Storm Water Runoff A Self-Assessment Guide for Wisconsin Businesses Storm water runoff is coming under increasing scrutiny as both a source of pollutants to our lakes and streams, and as a cause
Index. protection. excavated drop inlet protection (Temporary) 6.50.1 6.51.1. Block and gravel inlet Protection (Temporary) 6.52.1
 6.50.1 6.51.1. Block and gravel inlet Protection (Temporary) 6.52.1") 6 Index inlet protection excavated drop inlet protection (Temporary) 6.50.1 HARDWARE CLOTH AND GRAVEL INLET PROTECTION Block and gravel inlet Protection (Temporary) sod drop inlet protection ROCK DOUGHNUT
6 Index inlet protection excavated drop inlet protection (Temporary) 6.50.1 HARDWARE CLOTH AND GRAVEL INLET PROTECTION Block and gravel inlet Protection (Temporary) sod drop inlet protection ROCK DOUGHNUT
Natural Resource-Based Planning*
 Natural Resource-Based Planning* Planning, when done well, is among the most powerful tools available to communities. A solid plan, based on good natural resource information, guides rational land-use
Michigan Wetlands. Department of Environmental Quality
 Department of Environmental Quality Wetlands are a significant component of Michigan s landscape, covering roughly 5.5 million acres, or 15 percent of the land area of the state. This represents about
Restoring Ecosystems. Ecosystem Restoration Services
 Restoring Ecosystems Ecosystem Restoration Services 2 Ecosystem Restoration Services AECOM s integrated approach sciencebased planning, with innovative design and execution delivers sustainable and cost-effective
Floodplain Development Land Use Review
 COMMUNITY DEVELOPMENT DEPARTMENT Planning Division P.O. Box 490 333 Broadalbin Street SW Albany, OR 97321 Phone 541-917-7550 Fax 541-791-0150 www.cityofalbany.net Floodplain Development Land Use Review
A. General Information
 Important: When filling out forms on the computer, use only the tab key to move your cursor - do not use the return key. Massachusetts Department of Environmental Protection WPA Form 3 Notice of Intent
RIPRAP From Massachusetts Erosion and Sediment Control Guidelines for Urban and Suburban Areas http://www.mass.gov/dep/water/laws/policies.
 RIPRAP From Massachusetts Erosion and Sediment Control Guidelines for Urban and Suburban Areas http://www.mass.gov/dep/water/laws/policies.htm#storm Definition: A permanent, erosion-resistant ground cover