COMPARISON OF REGULATORY DESIGN CONCENTRATIONS. AERMOD vs ISCST3, CTDMPLUS, ISC-PRIME
|
|
|
- Logan Sullivan
- 10 years ago
- Views:
Transcription
1 COMPARISON OF REGULATORY DESIGN CONCENTRATIONS AERMOD vs ISCST3, CTDMPLUS, ISC-PRIME

2 EPA-454/R June 2003 COMPARISON OF REGULATORY DESIGN CONCENTRATIONS AERMOD vs ISCST3, CTDMPLUS, ISC-PRIME Staff Report U.S. Environmental Protection Agency Office of Air Quality Planning and Standards Emissions Monitoring and Analysis Division Research Triangle Park, North Carolina

3 Disclaimer This report has been reviewed by the Office of Air Qualtiy Planning and Standards, U.S. Environmental Protection Agency, and has been approved for publication. Mention of trade names or commercial products does not constitute endorsement or recommendation for use. Acknowledgments The Agency wishes to acknowledge AERMIC (the American Meteorological Society/Environmental Protection Agency Regulatory Model Improvement Committee), members of which have given a considerable amount of time, energy and dedication over the last 10 years to develop the AERMOD air dispersion modeling system: W.D. Peters, U.S. Environmental Protection Agency, OAQPS, EMAD,AQMG A. Venkatram, College of Engineering, University of California at Riverside J. C. Weil, Cooperative Institute for Research in Environmental Sciences, University of Colorado R. B. Wilson, U.S. Environmental Protection Agency, Region X R. J. Paine, ENSR Corporation S.G. Perry 1, Atmospheric Sciences Modeling Division, Air Resources Laboratory, EPA/ NOAA R. F. Lee, Consultant, Meteorologist A. J. Cimorelli, U.S. Environmental Protection Agency, Region III In addition, Mr. Roger Brode of MACTEC Federal Programs, Inc. (formerly known as Pacific Environmental Services Inc) has provided considerable talent and support to the AERMOD project and has conducted many analyses over the last several years to test and develop this new air dispersion model. 1 On assignment to the Atmospheric Research and Exposure Assessment Laboratory, U.S. Environmental Protection Agency.

4 TABLE OF CONTENTS 1. INTRODUCTION METEOROLOGICAL DATA BASES MODEL OPTIONS AND SOURCE DEFINITIONS MODELING RESULTS DISCUSSION OF RESULTS GENERAL CONCLUSIONS COMPUTER RUN TIMES APPENDIX A SIDE BY SIDE COMPARISON OF MODEL FEATURES: AERMOD VS ISCST APPENDIX B FIGURES FOR DESCRIBING COMPLEX TERRAIN APPENDIX C LOCATION OF SOURCE AND RECEPTORS FOR THE COMPLEX TERRAIN ANALYSIS APPENDIX D FLAT AND SIMPLE TERRAIN MODELING RESULTS APPENDIX E COMPLEX TERRAIN MODELING RESULTS

5 1. INTRODUCTION 1.1 Background information. This report is a final version of an earlier consequence analysis 2, which was released to support the proposal of AERMOD (the American Meteorological Society/Environmental Protection Agency Regulatory Model Improvement Committee s Dispersion Model, version 99351) in a Federal Register notice 3 on April 21, At that time, the EPA also proposed an additional model, ISC-PRIME ( Industrial Source Complex -Short Term Model[Version 3] - Plume RIse Model Enhancements), designed to be used in cases where building downwash was significant; AERMOD was to be used for air pollution source scenarios where downwash was not an issue. To support the ISC-PRIME proposal, there was a separate but similar buildingdownwash-consequence analysis completed which compared ISC-PRIME to ISCST3 4 (Industrial Source Complex -Short Term Model--Version 3). Responding to the overwhelming reaction from the commenters on the proposal, the Agency decided to incorporate PRIME algorithms into AERMOD and thereby eliminate the use of the ISC-PRIME model. The final results in this report consider both downwash and non-downwash source scenarios since AERMOD now provides the state of the science for modeling both types of source scenarios. Thus, this report is designed to supercede the two earlier consequence analyses. This analysis is based on the lastest version of AERMOD, version , which includes the PRIME algorithms and the proposed version of AERMOD (99351). The ISC-PRIME results are based on version 99020; the ISCST3 results are based on version (for the downwash analysis) and version (for the point, area and volume sources) which are the same versions of the models used in the earlier consequence analyses. The introduction includes the following additional sections: a description and purpose of a consequence analysis; a description of the 3 components to this study; and, a brief description of the air dispersion models of interest - AERMOD (including a list of AERMOD changes since the proposal), ISCST3, ISC-PRIME, and, CTDMPLUS (the Complex Terrain Dispersion Model- Plus). 1.2 What is a consequence analysis? The purpose of this report, often called a consequence analysis, is to give the user community a sense of how regulatory design concentrations from a new air dispersion model compare to those from an established model via a series of representative examples. After the release of a new model for regulatory applications, the user community will want to know: What does this mean to my modeling projects?. This analysis is designed to answer that question by 2 Peters,W.D. et al, Comparison of Regulatory Design Concentrations: AERMOD versus ISCST3 and CTDMPlus, draft document, April 1999, available on the EPA website: 3 Federal Register notice, 65FR21506, April 21, Paine, R.J. and Lew, F., Consequence Analysis for Adoption of PRIME: an Advanced Building Downwash Model, August 24, 1998, available on the EPA website: 5 Available on the EPA website: 4
, designed to be used in cases where")
6 showing the effects of the new model as compared to the existing regulatory model which it replaces. For this study, the new model is AERMOD with the PRIME algorithms. The existing regulatory models used in this report are ISCST3, ISC-PRIME, and CTDMPLUS. This consequence analysis does not substitute for detailed comparative evaluations or sensitivity analyses, but rather, provides to the modeler some simple comparisons of regulatory design concentration estimates from these air quality models for an extensive number of typical source scenarios. 1.3 The three components of this study. There are three parts to this study: the flat and simple terrain component; the building downwash component; and, the complex terrain component. The building downwash component has been added to the original report since AERMOD now contains the PRIME building downwash feature and will be used for sources near buildings. All of the study components use source scenarios and meteorological data sets which remain unchanged from the earlier consequence analyses. The flat and simple terrain consequence analysis is based on comparative runs made using a composite of standard data sets. These data sets include a range of point sources with varying stack parameters, area and volume sources, and two point sources in simple terrain 6. All source scenarios are evaluated with two meteorological data sets representing different climatic regimes in the U.S. For building downwash, a series of point sources with varying stack heights and different building configurations are included in the data sets. Only one of the meteorological data sets used in the previous description is used in this part of the analysis. For the complex terrain, the study includes a number of stack heights, buoyancy regimes, distances from source to hill, and hill types along with its own meteorological data base (one site). After applying the model to all of the above source scenarios, the consequence analysis is summarized by tabulating the important regulatory (design) concentrations for the new model against those predicted by the existing regulatory models. Often, the concentrations of regulatory interest are the high and the high-second-highest concentrations for 1-hour, 3-hour, 24-hour, and annual averages, and they are used in this study. The choice of averaging times is based on the earlier consequence analyses, although this choice is not consistent across all three components of this study. 1.4 A Brief Description of AERMOD 7. A committee, AERMIC (the American Meteorological Society/Environmental Protection Agency Regulatory Model Improvement Committee), was formed to introduce state-of-the-art modeling concepts into the EPA s local-scale air quality models. AERMIC's focus was on a new platform for regulatory steady-state plume modeling; this platform would include air dispersion 6 Simple terrain includes receptors with elevations below the top of the stack and at elevations above or below the stack base. Intermediate terrain includes receptors with elevations above stack top and below the plume centerline. Complex terrain includes receptors with elevations above the top of the stack. 7 User s Guide for the AMS/EPA Regulatory Model - AERMOD, US EPA, Office of Air Quality Planning and Standards, Research Triangle Park, NC 27711, Report No EPA-454/B , July Available on the EPA website: 5

7 fundamentally based on planetary boundary layer turbulence structure, scaling and concepts. AERMOD is designed to treat both surface and elevated sources in simple and complex terrain. Special features of AERMOD include its ability to treat the vertical inhomogeneity of the planetary boundary layer, special treatment of surface releases, irregularly-shaped area sources, a three-plume model for the convective boundary layer, and limitation of vertical mixing in the stable boundary layer. A treatment of dispersion in the presence of intermediate and complex terrain is used that improves on that treatment currently in use in ISCST3 and other models, yet without the complexity of a model such as CTDMPLUS. AERMOD incorporates, with a new simple approach, current concepts about flow and dispersion in complex terrain. Where appropriate, the plume is modeled as either impacting and/or following the terrain. This approach is designed to be physically realistic and simple to implement while avoiding the need to distinguish among simple, intermediate and complex terrain, as is required by present regulatory models. As a result, AERMOD removes the need for defining complex terrain regimes; all terrain is handled in a consistent and continuous manner that is simple while still considering the dividing streamline concept in stably-stratified conditions. AERMOD is actually a modeling system with three separate components: AERMOD (AERMIC Dispersion Model), AERMAP (AERMOD Terrain Preprocessor), and AERMET (AERMOD Meteorological Preprocessor). AERMET is the meteorological preprocessor for AERMOD. Input data can come from hourly cloud cover observations, surface meteorological observations and twice-a-day upper air soundings. Output includes surface meteorological observations and parameters and vertical profiles of several atmosheric parameters. AERMAP is a terrain preprocessor designed to simplify and standardize the input of terrain data for AERMOD. Input data include receptor terrain elevation data. The terrain data may be in the form of digital terrain data that is available from the U.S. Geological Survey. For each receptor, the output includes a location and height scale, which is an elevation used for the computation of air flow around hills. Additional information about AERMOD can be found in other documents. The model evaluation paper 8 compares both AERMOD (proposed and current versions), CTDMPLUS, ISCST3's and ISC-PRIME s model predictions against measured ambient concentrations. The Model Formulation Document 9 provides a detailed explanation of the science behind the model. 8 USEPA, AERMOD: Latest features and Evaluation Results. Office of Air Quality Planning and Standards, Research Triangle Park, NC 27711, EPA Report No. EPA-454/R July Available on the EPA website: 9 USEPA, AERMOD: Description of Model Formulation (Version 02222), Office of Air Quality Planning and Standards, Research Triangle Park, NC 27711, EPA Report No. EPA-454/R , October Available on the EPA website: 6

8 The AERMOD, AERMET and AERMAP User s Guides 7,10,11 inform the user community about the various options and features of the model and its preprocessors. 1.5 Changes made to AERMOD since the proposal A summary of the changes made to the AERMOD in response to comments include the following: * adding the PRIME algorithms to the model (response to public comments); * modifying the complex terrain algorithms to make AERMOD less sensitive to the selection of the domain of the study area (response to public comments); * modifying the urban dispersion for low-level emission sources, such as area sources, to produce a more realistic urban dispersion and, as a part of this change, changing the minimum layer depth used to calculate the effective dispersion parameters for all dispersion settings (scientific formulation correction which was requested by beta testers); and making an adjustment to the friction velocity and the Monin-Obukhov length for urban stable cases (improved scientific formulation); * upgrading AERMOD to include all the newest features that exist in the latest version of ISC such as FORTRAN 90 compliance and allocatable arrays, EVENTS processing and the TOXICS option (response to public comments). In doing the follow-up quality control checking of the model and the source code, the need for additional changes were identified and the following changes have been made: * adding meander to: 1) the stable and unstable urban and 2) the rural unstable dispersion settings (only the rural, stable dispersion setting considered meander in the earlier version of AERMOD - this change provides a consistent treatment of air dispersion in all dispersion settings); * making some changes to the basic meander algorithms (improved scientific formulation); * making a correction to avoid elevated concentrations for terrain below stack base from the virtual image source (response to public comments about spurious results in complex terrain); and, * repairing miscellaneous coding errors. A more detailed list of corrections are given in the model evaluation paper Overview of ISCST USEPA, User s Guide for the AERMOD Meteorological Preprocessor (AERMET), US EPA, Office of Air Quality Planning and Standards, Research Triangle Park, NC 27711, EPA Report No EPA-454/B , July Available on the EPA website: 11 USEPA, User s Guide for the AERMOD Terrain Preprocessor (AERMAP), US EPA, Office of Air Quality Planning and Standards, Research Triangle Park, NC 27711, EPA Report No EPA-454/B , August Available on the EPA website: 12 USEPA, User s Guide for the Industrial Source Complex (ISC3) Dispersion Models, Office of Air Quality Planning and Standards, Research Triangle Park, NC 27711, Report No. EPA-454/B a, September Available on the EPA website: 7

9 ISCST3 is especially designed to support the EPA's regulatory modeling programs. This model is a steady-state Gaussian dispersion model with a number of options available to the user. These options include the use of stack-tip downwash, buoyancy-induced dispersion, final plume rise (except for sources with building downwash), a routine for processing averages when calm winds occur, and default values for wind profile exponents and for the vertical potential temperature gradients. The Short Term model also incorporates COMPLEX1 screening model dispersion algorithms for receptors in complex terrain. The user may select either rural or urban dispersion parameters, depending on the characteristics of the source location. A more detailed side-by-side explanation and comparison of features between ISCST3 and AERMOD is given in Appendix A. 1.7 Overview of PRIME. PRIME was developed by the Electric Power Research Institute to provide new and improved plume rise and building downwash algorithms. The PRIME set of algorithms was incorporated into ISCST3 and the new model was called ISC-PRIME. The improved algorithms provided the following new features:. consideration of the location of the stack in relationship to the building;. consideration of the streamline deflection over the building;. inclusion of plume rise affected by the velocity deficit in the wake or vertical wind speed shear;. a linkage between plume material captured by the near wake and far wake concentrations;. elimination of discontinuities at the interface between the two downwash algorithms;. provision of wind direction effects for squat buildings;. elimination of the large concentrations predicted by ISCST3 during light wind speed, stable conditions that are not supported by observations. A further, more detailed, description of the model 13 and the evaluation results 14 are available. 1.8 A Brief Description of CTDMPLUS 15. CTDMPLUS is a refined Gaussian plume dispersion model designed to estimate hourly concentrations of plume material from elevated point sources at receptors on or near isolated terrain features. This model can assess stable and neutral atmospheric conditions as well as daytime, unstable conditions. Its use of meteorological data and terrain information is different from other regulatory models in that considerable detail for both types of input data is required and is supplied by preprocessors specifically designed for CTDMPLUS. 13 L.L. Schulman, D.G. Strimaitis, J.S. Scire, Development and Evaluation of the PRIME Plume Rise and Building Downwash Model, Jounrnal of Air and Waste Management Association, 50: , March R.J. Paine, F. Lew, Results of of the Independent Evaluation of ISCST3 and ISC-PRIME, Electric Research Institute, EPRI TR , November Available at 15 User s Guide to the Complex Terrain Dispersion Model Plus Algorithm for Unstable Situations, US EPA, Atmospheric Research and Exposure Assessment Laboratory, Research Triangle Park, NC 27711, Report No. EPA/600/8-89/041, March Available on the EPA website: 8

10 In modeling stable to neutral conditions, a central feature of CTDMPLUS is its use of a critical dividing-streamline height to separate the flow in the vicinity of a hill into two separate layers. Flow in the upper layer has sufficient kinetic energy to pass over the top of the hill, while the streamlines in the lower layer are constrained to flow in a horizontal plane around the hill. In modeling unstable or convective conditions, the model relies on a probability density function (PDF) description of the vertical velocities to estimate the vertical distribution of pollutants. Hourly profiles of wind and temperature measurements are used by CTDMPLUS to compute plume rise, plume penetration, convective scaling parameters. In stable/neutral conditions, the profiles of turbulence data are used to compute dispersion parameter values at plume height. The model calculates on an hourly basis how the plume trajectory is deformed by each hill. The computed concentration at each receptor is then derived from the receptor position on the hill and the resultant plume position and shape. 9

11 2. METEOROLOGICAL DATA BASES 2.1 Flat and Simple Terrain. One year of hourly data for two sites were retrieved and processed. The two sites selected for this study are Pittsburgh, PA (WBAN [Weather Bureau-Air Force-Navy] station No ), representative of an urban eastern site; and Oklahoma City, OK (WBAN station No ), representative of a southwestern plains site. The 1964 data are used at the Pittsburgh site and 1984 data are used at the Oklahoma City site. ISCST3 meteorological data were preprocessed by PCRAMMET and AERMOD meteorological data were preprocessed by AERMET AERMET Overview. AERMET 10 provides a general purpose meteorological preprocessor for organizing available meteorological data into a format suitable for use by AERMOD. National Weather Service (NWS) hourly surface observations and twice-daily upper air soundings, plus site-specific data from a meteorological measurement program can be processed in AERMET. There are three stages to processing the data. The first stage extracts meteorological data from archive data files and processes the data through various quality assessment checks. The second stage merges all data available for 24-hour periods (NWS and site-specific data) and stores these data together in a single file. The third stage reads the merged meteorological data and estimates the necessary parameters for use by AERMOD. Two files are written for AERMOD: 1) a file of hourly boundary layer parameter estimates; and, 2) a file of multiple-level observations (profiles) of wind speed and direction, temperature, and standard deviation of the fluctuating horizontal and vertical components of the wind. Input data used in this part of the study include: 1) hourly specification of wind speed; 2) hourly specification of wind direction; 3) hourly ambient temperature; 4) hourly solar radiation 16 ; 5) hourly cloud cover values; 6) a quantification of surface characteristics (surface roughness, albedo, Bowen ratio); and 7) twice-daily upper air soundings 17. Output includes hourly values for mixing heights and Monin-Obukhov lengths, surface friction velocity, convective velocity scale, and profiles of wind speed and direction, temperature and turbulence. Table 2-1 lists the albedo, Bowen ratio, and surface roughness that are assumed for this analysis. Table 2-1 lists only the rural settings for the meteorological data. The urban analysis is accomplished by setting the urban mode and urban source option in AERMOD and using the rural meteorological data for the model inputs.. 16 Solar and Meteorological Surface Observation Network , Version 1.0, US Department of Commerce, National Climatic Data Center, Asheville, NC / US Department of Energy, National Renewable Energy Laboratory, Golden CO, September Radiosonde Data of North America , Version 1.0, Forecast Systems Laboratory, Boulder, CO and National Climatic Data Center, Asheville, NC, August

12 Table 2-1. Albedo, Bowen Ratio, and Surface Roughness length assumed for AERMET preprocessor. Site Option Albedo Bowen Ratio Surface roughness (meters) Pittsburgh Rural Oklahoma City Rural PCRAMMET Overview. The PCRAMMET 18 model requires the twice-daily mixing heights and NWS surface observations. Prior to being made available, the data were checked for blank fields (missing data) and filled by accepted procedures. A modification was made to the data sets by setting the minimum mixing heights to 10 meters. This change was made to avoid spuriously high or low concentrations for the short stacks. Only the meteorological data used for the ISCST3 analysis was affected. For ISCST3, the minimum input data requirements to the PCRAMMET are the twice-daily mixing heights and hourly surface observations of wind speed, wind direction, dry bulb temperature, opaque cloud cover and ceiling height. The operations performed by the PCRAMMET include: 1) calculation of hourly values for atmospheric stability from meteorological surface observations; and, 2) interpolation of twice-daily-mixing heights to hourly values. A brief description of the meteorological data for the two sites is given in Table 2-2. Table 2-2. Missing soundings and calm wind conditions by site and year. Site Year Anemometer height (feet) Hours/ year Missing Soundings 0000 GMT GMT Calm wind conditions Pittsburgh Oklahoma City PCRAMMET User s Guide, US EPA, Office of Air Quality Planning and Standards, RTP, NC 27711, EPA-454/B , October Available from EPA's world-wide-web site at 19 GMT = Greenwich Mean Time 11

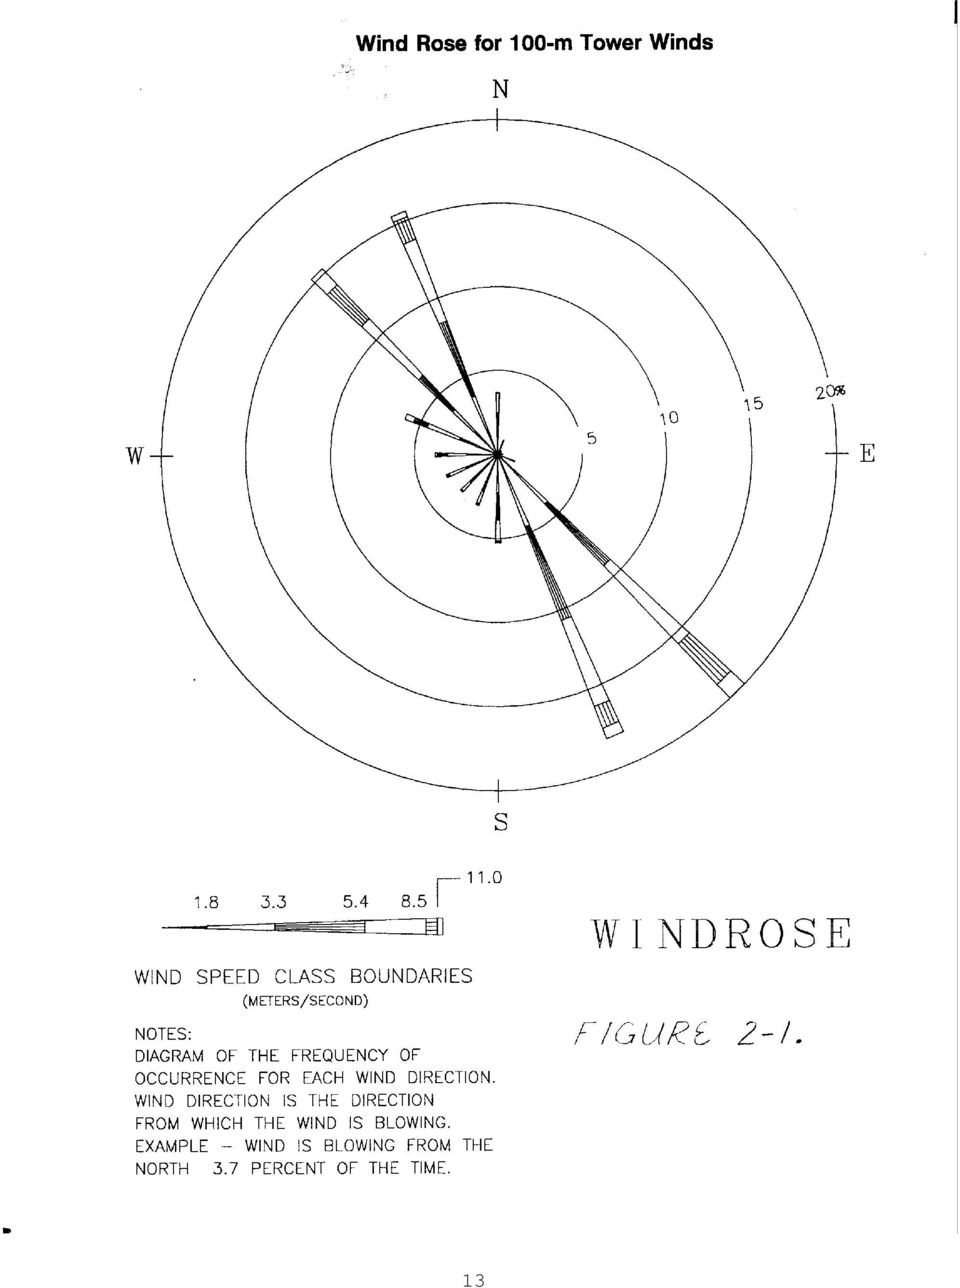
13 2.2 Building Downwash. Only the meteorological data from Pittsburgh (1964), as described in the preceding section, is used in the building downwash scenarios. No modifications were made to the data because there are no short stacks, (i.e. less than 20 meters) in this part of the analysis. 2.3 Complex Terrain. The meteorological data base used in the complex terrain portion of this study is taken from a project where site-specific data were collected 20. A 100-m tower, instrumented at 10, 50, and 100 meters and sodar equipment were used to gather the meteorological data. The sodar data was collected at 50-meter intervals, and the meter sodar data were used with the tower data to construct the meteorological profiles. The use of sodar turbulence data is limited to vertical turbulence values only. All of the tower and sodar levels are used in AERMOD and CTDMPLUS runs. Only the 100-m tower data (wind speed and wind direction) are used in ISCST3 runs (see Figure 2-1 for the 100 meter wind rose). The atmospheric turbulence and dispersion for ISCST3 are addressed by applying atmospheric stability classifications which are estimated by the solar radiation/delta-t (SRDT) stability scheme 21. To confine the differences between CTDMPLUS and AERMOD to differences in the dispersion algorithms, the METPRO 22 output used for CTDMPLUS (including the boundary layer parameters) is reformatted in a mode compatible with AERMOD meteorological data requirements. However, the predicted concentrations are not sensitive to these boundary layer values because profiled meteorological data are available at several levels straddling the stack release heights. 20 The data came from an unnamed source. 21 An Evaluation of A Solar Radiation/Delta-T Method for EstimatingPasquill-Gifford (P-G) Stability Categories", EPA-454/R , October User s Guide to the CTDM Meteorological Preprocessor Program, EPA-600/ , Available on the EPA website: 12

14 13
15 3. MODEL OPTIONS AND SOURCE DEFINITIONS 3.1 Modeling Options for Flat, Simple and Complex Terrain. The regulatory dispersion model used in this study for the flat and simple terrain is the ISCST3 model. The model was run in the regulatory mode which uses the option settings as described in Table 3-1. Table 3-1 also shows the parallel settings or options used for AERMOD setup. Table 3-1. Model Options Used in Consequence Analysis. ISCST3 AERMOD * Use stack tip downwash * Use stack tip downwash * Use buoyancy-induced dispersion * Use buoyancy-induced dispersion (not an option) * Do not use gradual plume rise (gradual plume rise is used in complex terrain) * Use gradual plume rise (not an option) * Use the calms-processing routines * Use the calms-processing routines(not an option) * Use default wind profile exponents * Calculate wind profiles (not an option) * Use default vertical potential temperature gradients * Calculate vertical potential temperature gradients (not an option) The results reported in these 2 components of the study are the high and the highest secondhigh concentrations averaged over 1-hr, 3-hr and 24-hr short term averages and the high annual average. 3.2 Source Characteristics for Flat, Simple Terrain. Ten source types are processed for the flat terrain part of this study: seven point sources, one area source and two volume sources. Source characteristics for each source type are presented in Table 3-2. The very buoyant 35 meter stack source and the 200 meter stack source in Table 3-2 are used in the simple terrain part of this study. All these sources are evaluated using: 1) both the rural and urban settings; and 2) both sets of meteorological data. Thus, there are 48 scenarios [(10 flat terrain sources + 2 simple terrain sources) x 2 land use settings (rural, urban) x 2 meteorological sites] and 7 different maximum concentration values for a total of 336 cases. 14
 * Do not use gradual plume rise (gradual plume rise")
16 Table 3-2. Source characteristics for flat and simple terrain. Point sources Stack height (m) X,Y location & base elevation (m) Emission rate (gs -1 ) Exit velocity (ms -1 ) Stack diameter (m) Temperature (K) 5 0, 0, Ambient 10 0, 0, Ambient 20 0, 0, Ambient 35 (moderately buoyant) 35 (very buoyant) 23 * 0, 0, , 0, , 0, * 0, 0, Area source Area (m 2 ) Length of side (m) Emission rate (gs -1 m -2 ) Height of emission release (m) 1,000, Volume sources Emission rate (gs -1 ) Height of emision release (m) Length of side divided by 4.3 (m) Vertical dimension divided by 4.3 (m) * These sources are also used for the simple terrain part of the consequence analysis. 15
 Length of side (m) Emission rate (gs -1 m -2 ) Height of emission release (m) 1,000,000 1000 0.0001 0.")
17 3.3 Source Characteristics for Complex Terrain. The complex terrain analysis examines a combination of four hills, two stack heights, two buoyancies, and two source-hill distances. The four hills are: 1) Piedmont, a hill near Keyser, WV; 2) Montour Ridge - Crosswind, near Sunbury, PA; 3) Montour Ridge - Alongwind; and 4) Cinder Cone Butte, located near Boise, ID. Except for "Montour Crosswind", the sources are located to the west of the hill centers, at distances of about 1 kilometer for the "close-in" case and about 10 kilometers for the "far-out" case (See Appendix B for the figures describing the hills). For "Montour Crosswind", the sources are located to the north of the east-west oriented ridge. The meteorological data base used in this study features a high percentage of winds from the northwest quadrant (see Figure 2-1). Therefore, the modeling results reflect a large number of cases of plume transport from the hypothetical sources to these hills. The source parameters for the complex terrain analysis are provided in Table 3-3. Although there are 32 possible combinations of hill/source/source-hill distances ( 4 hills x 2 stack heights x 2 buoyancies x 2 source hill distances), the plume never significantly impacts the Cinder Cone Butte hill in 4 of the cases and are not included in the analysis. Thus, the results are reported for a total of 28 complex terrain cases. 3.4 Source Characteristics for Building Downwash. A series of hypothetical scenarios involving single point sources and rectangularly shaped buildings were chosen in an earlier work and these configurations are retained for this study. ISCST3, ISC-PRIME and AERMOD are applied to each scenario. The test cases include the following situations: * a stack adjacent to a building structure, and also four building heights away from the northeast corner of the building; * stack height to building height ratios of 1.0 and 2.0; * squat, supersquat, and tall building shapes; and, * urban and rural settings. A no-building set of cases is also used for "control" runs. Not counting the no-building cases, there are 20 source/building scenarios and three averaging times to provide a total of 60 cases in this component of the study. The selection of this set of source configurations and averaging times matches that of the earlier consequence analysis. The stack parameters are listed in Table 3.4. One year of meteorological data (Pittsburgh, 1964) is employed in this analysis. The results for the highest second-highest 3-hour and 24-hour concentrations, as well as the highest annual concentration are tabulated for each run. The analysis also includes the model predictions for the highest 1 hour cavity concentration. 16
. For \"Montour Crosswind\", the sources are located to the north of the east-west oriented ridge.")
18 Table 3-3. Complex Terrain Source Configurations. Stack height - Buoyancy Emission rate (g/s) Stack Height (m) Stack Gas Temperature (K) Exit Velocity (m/s) Stack Diameter (m) Low/Low Low/High High/Low High/High Table 3-4. Source characteristics for building downwash analysis - point sources. Stack height (m) Emission rate (gs -1 ) Exit velocity (ms -1 ) Stack diameter (m) Temperature (K) Receptor Configuration for Flat and Simple Terrain A gridded polar array of receptors is used in the flat terrain portion of the analysis. For the point sources, there are 36 radials (beginning at 10 degrees from north and spaced every 10 degrees). The distance of the concentric rings are: 125m, 250m, 400m, 800m, 2000m, 4000m, 8000m, and 16000m. The volume and the area source polar grid is also set up for 10 degree radials but uses concentric ring distances of 125m, 250m, 400m, 800m, and 2000m. A gridded polar array of receptors is used for the point sources in simple terrain settings. There are 36 radials (beginning at 10 degrees from north and spaced every 10 degrees). The distance of the concentric rings were: 800m, 2000m, 4000m, 7000m, and 15000m. The elevations for the receptors are plotted (with isopleths) in Figures 3-1 (35 meter stack) and 3-2 (200 meter stack). 17

19 3.6 Receptor Configuration for Building Downwash. A cartesian receptor grid extending out to 10 kilometers is used in the building downwash analysis. The receptor density varies, with 50-m spacing for the first 500 meters, 100 m spacing out to 1000 m, 200 m spacing out to 2000 m and 1000 m spacing out to m. This spacing matches that used in the original ISC-PRIME consequence analysis. 3.7 The Complex Terrain Receptor Locations. The Figures in Appendix B show the contours of the hills used in the analysis. AERMOD, ISCST3, and CTDMPLUS are run with the full year of data described above for 28 combinations of sources, and source-hill distances (1 and 10 kilometers). The CCB and Montour longwind/crosswind setting includes a total of 140 receptors; the Piedmont Hill setting uses a total of 144 receptors; and, the Cinder Cone Butte setting uses 140 receptors. Appendix C contains the input files used to run AERMOD and provides the location and elevations of all the receptor locations for all runs. In all cases, each model estimates concentrations on single hills downwind from the source. 18

20 Figure 3-1 Elevation in Feet Around the 35 Meter Stack Meters (m) 0 Stack Meters (m) Note: 25 ft. contours Stack base = 797 feet, stack top = 911 feet 19

21 15000 Figure 3-2 Elevation in Feet Around the 200 Meter Stack Meters (m) 0 Stack Meters (m) Note: 100 ft. contours Stack base = 797 feet, stack top = 1453 feet. 20
22 4. MODELING RESULTS The results from the three components of the study are given in this section. The three components are for the flat and simple terrain, the building downwash and the complex terrain scenarios. The results compare the new (AERMOD version 02222) versus the old model s (ISCST3 or ISC-PRIME) predicted maximum concentrations. The relationship between the current version of AERMOD versus the old model is the focal point of this study. Generally, the modeling community is not concerned about the magnitude of the concentration predictions, but is interested in those situations where the new model predicts higher or lower concentrations than the old model. Thus, the parameter of choice to present the consequences of the new model is the concentration ratio. The concentration ratio can be calculated by dividing the current version of AERMOD s maximum predicted concentration by the old model s corresponding maximum concentration. The concentration ratio parameter is convenient because a ratio greater than 1 occurs when the new model predicts maximum concentrations higher than the old model and, conversely, concentration ratios less than 1 occur when the new model predicts lower maximum concentrations. As additional information for those who are interested in the model changes since the proposal, the results include concentration ratios which are based on the earlier consequence analyses 2. That is, the concentration ratios between the current version of the AERMOD versus the proposed version of AERMOD (version 99351) are provided. Often, this second set of concentration ratios is redundant, but they directly help readers who are familiar with the original consequence analysis and who want to study the changes to the consequences subsequent to the Federal Register proposal The Flat and Simple Terrain Results. The results for the flat and simple terrain part of this study are found in Appendix D. The high and the highest second high (H2H) concentrations for the 1, 3, 24 hour and annual averaging times are provided for the ISCST3 model (column 2) and, in parallel, the concentration ratios are provided for the proposed and the current version of AERMOD (columns 3 and 4). The third column reproduces information presented in the earlier consequence analysis, that is, the ratio of maximum concentrations comparing the proposed version of AERMOD to ISCST3. The last column of numbers presents the ratio of the air quality concentrations as predicted by the current versus the proposed version of AERMOD. Although redundant, this last column helps the reader to quickly determine the changes in the consequence analysis since the April 1999 report. Each modeling scenario is defined by a code and the code key is provided at the bottom of each page for convenience. Because of the amount of data and complexity of the tables in Appendix D, a series of tables are presented to summarize the statistics of the relationship between the predicted concentrations from AERMOD and ISCST3. Tables 4-1, 4-2 and 4-3 have identical structures. There are 4 columns of numbers providing a distribution of concentration ratios. The second column provides a distribution, an average and the maximum and minimum value of the concentration ratios, for the proposed version of AERMOD versus ISCST3, as reported in Appendix D. Again, this is a 21
23 reference point back to the earlier consequence analysis. The third column shows the new concentration ratios based on the current version of AERMOD (02222) and ISCST3. The last column is redundant but directly supplies information about the magnitude of the changes between the earlier and the current version of the new air dispersion model since those ratios compare the new version of AERMOD to the proposed version of AERMOD. Table 4-1 provides the results for all the modeling scenarios, while Tables 4-2 and Tables 4-3 break out the results by the rural and urban settings. For example, to further explain the summary tables, refer to the third column in Table 4-1. According to the number in the second row, there are 5 cases where the current version of AERMOD predicts a maximum concentration that is a factor of 3 greater than ISCST s prediction. The third row, column 3 indicates that there are 25 cases where AERMOD s predictions are a factor of 2 greater than ISCST3 s. The fifth row indicates the total number of cases (336) in this component of the study. The fourth row and the sixth row values are the most significant. These entries provide the number of cases where the AERMOD (version 02222) maximum concentrations are higher than ISCST3's (116) or lower than ISCST3's maximum concentrations (220). In the seventh row, there are 46 cases where AERMOD concentrations are less than ½ of the ISCST3 s maximum concentrations. The average concentration ratio in row 10, the highest ratio in row 11 and the lowest ratio are based on all 336 cases. Table 4-1. Summary statistics based on the ratio of AERMOD predicted concentration to ISCST3 predicted concentrations for flat and simple terrain (see Appendix D) over all averaging times and all source types and both rural and urban settings AER/ 02222AER/ 02222AER/ ISC ISC 99351AER no. of ratios > no. of ratios > no. of ratios > no. of ratios > Total No no. of ratios < no. of ratios < no. of ratios < no. of ratios < average high low
24 Table 4-2. Summary statistics based on the ratio of AERMOD predicted concentration to ISCST3 predicted concentrations for flat and simple terrain (see Appendix D) over all averaging times and all source types - FOR THE RURAL SETTING ONLY. RURAL RESULTS 99351AER/ 02222AER/ 02222AER/ number of ratios > > > > total < < < < max min average Table 4-3. Summary statistics based on the ratio of AERMOD predicted concentration to ISCST3 predicted concentrations for flat and simple terrain (see Appendix D) over all averaging times and all source types - FOR THE URBAN SETTING ONLY. URBAN RESULTS 99351AER/ 02222AER/ 02222AER/ number of ratios > > > > total < < < < max min average
25 4.2 The Building Downwash Results. As mentioned in the introduction, this section was not in the April 1999 AERMOD consequence analysis since AERMOD was not proposed as the model of choice for building downwash analyses. Because PRIME has now been incorporated into AERMOD, the AERMOD consequence analysis now contains comparisons of the building downwash models. The results, which are patterned after the earlier ISC-PRIME consequence analysis 4, are given in Table 4-4. Table 4-4 has four sets of columns. The first set of three columns are the scenario descriptions. The second set of 4 columns include: the maximum annual concentrations from ISCST3; the ISC-PRIME to ISCST3 annual concentration ratios (which were reported in the earlier ISC-PRIME consequence analysis); the AERMOD (with PRIME) to ISCST3 annual concentration ratios; and the AERMOD to ISC-PRIME annual concentration ratios (which are redundant). The third set of four columns are for the high-second-high 24 hour concentration rations, using the column structure as for the annual results. The fourth set of four columns are for the high-secondhigh 3 hour concentration ratios. Table 4-5 presents the summary statistics for the building downwash analysis, that is, the maximum, minimum and average concentration ratios for each of the three averaging times and over all the averaging times. Table 4-4 makes note of those source/building scenarios where building downwash is significant. This criterion is based on cavity concentrations. Many source scenarios do not produce an estimated cavity concentration (e.g. the 100 meter stack separated from the tall building in a rural setting); but, those that do are marked as significant downwash sources (e.g. the 35 meter stack next to the squat building in a rural setting). There are two examples where both models generate a cavity concentration output, but the estimated cavity concentrations are very small (the 100 meter stack next to the squat building in the urban and rural settings). Table 4-6 presents the summary statistics of the maximum concentration ratios only for those cases where there is significant building downwash. In addition to the downwind concentrations, cavity concentrations are calculated and Table 4-7 presents the results for each source/building scenario. The maximum cavity concentrations from ISC-PRIME and AERMOD (with PRIME) are given respectively in columns 4 and 5 and the concentration ratios are seen in column 6. ISCST3 does not contain an algorithm to estimate the cavity concentration and could not be included in this table. The summary statistics for the maximum 1 hour cavity concentration ratios are given in Table
26 Table 4-4. Building downwash results. ANNUAL RATIOS 24 H2H RATIOS 3 H2H RATIOS Case Dispersion Stack ISC ISCP/ AERMOD/ AERMOD/ ISC ISCP/ AERMOD/ AERMOD/ ISC ISCP/ AERMOD/ AERMOD/ (M) ISC3 ISC3 ISCP ISC3 ISC3 ISCP ISC3 ISC3 ISCP No building (reference) Urban No building (reference) Rural No building (reference) Urban No building (reference) Rural Squat Building -Stack adjacent to NE of building Hb=34; 60x120m * Urban Hb=34; 60x120m * Rural Hb=50; 60x120m Urban Hb=50; 60x120m Rural Squat Building -Stack at distance 4*Hb to NE of building Hb=34; 60x120m Urban Hb=34; 60x120m Rural Hb=50; 60x120m Urban Hb=50; 60x120m Rural Tall Building -Stack adjacent to NE of building Hb=34; 30x30m * Urban Hb=34; 30x30m * Rural Hb=50; 30x30m Urban Hb=50; 30x30m Rural Tall Building -Stack at distance 4*Hb to NE of building Hb=34; 30x30m Urban Hb=34; 30x30m Rural Hb=50; 30x30m Urban Hb=50; 30x30m Rural Super Squat Building -Stack adjacent to NE of building Hb=34; 180x180m * Urban Hb=34; 180x180m * Rural Super Squat Building -Stack at distance 4*Hb to NE of building Hb=34; 180x180m Urban Hb=34; 180x180m Rural * Significant downwash source 25
27 Table 4-5. Summary of the building downwash analysis. ALL AVERAGING TIMES ANNUAL RATIOS 24 H2H RATIOS 3 H2H RATIOS ISCP/ AERMOD/ AERMOD/ ISCP/ AERMOD/ AERMOD/ ISCP/ AERMOD/ AERMOD/ ISCP/ AERMOD/ AERMOD/ ISC3 ISC3 ISCP ISC3 ISC3 ISCP ISC3 ISC3 ISCP ISC3 ISC3 ISCP ave max min No cases Table 4-6. Summary of results for those sources with significant downwash. ANNUAL RATIOS 24 H2H RATIOS 3 H2H RATIOS ALL AVERAGING TIMES ISCP/ AERMOD/ AERMOD/ ISCP/ AERMOD/ AERMOD/ ISCP/ AERMOD/ AERMOD/ ISCP/ AERMOD/ AERMOD/ ISC3 ISC3 ISCP ISC3 ISC3 ISCP ISC3 ISC3 ISCP ISC3 ISC3 ISCP ave max min No cases
28 Table 4-7. Results of the PRIME cavity max hourly concentrations (ug/m3) in ISC-PRIME and AERMOD (version 02222). Summary statistics of the AERMOD to ISC-PRIME ratios are included. MAX 1 HR CAVITY CONC Case Dispersion Stack AERMOD/ (M) ISCP AERMOD ISCP No building Urban 35 No building Rural 35 No building Urban 100 No building Rural 100 Squat Building -Stack adjacent to NE of building Hb=34; 60x120m Urban Hb=34; 60x120m Rural Hb=50; 60x120m Urban * 0.08* N/A Hb=50; 60x120m Rural 100 0* 0.08* N/A Squat Building -Stack at distance 4*Hb to NE of building Hb=34; 60x120m Urban 35 Hb=34; 60x120m Rural 35 Hb=50; 60x120m Urban 100 Hb=50; 60x120m Rural 100 Tall Building -Stack adjacent to NE of building Hb=34; 30x30m Urban Hb=34; 30x30m Rural Hb=50; 30x30m Urban 100 Hb=50; 30x30m Rural 100 Tall Building -Stack at distance 4*Hb to NE of building Hb=34; 30x30m Urban 35 Hb=34; 30x30m Rural 35 Hb=50; 30x30m Urban 100 Hb=50; 30x30m Rural 100 Super Squat Building -Stack adjacent to NE of building Hb=34; 180x180m Urban Hb=34; 180x180m Rural Super Squat Building -Stack at distance 4*Hb to NE of building Hb=34; 180x180m Urban 35 Hb=34; 180x180m Rural 35 * considered insignificant 27
29 Table 4-8. Summary of the building downwash 1 hour cavity concentration ratios. AERMOD/ ISCP ave 1.12 max 1.41 min 0.87 No cases The Complex Terrain Results. The complex terrain results which compare AERMOD to ISCST3 24 and to CTDMPLUS, are presented in Appendix E. The Appendix E table includes the highest second high ratios along with the highest annual concentrations. A summary of the complex terrain results are provided below in Table 4-9. Table 4-9 provides a distribution of AERMOD to other model concentration ratios. There were no cases where AERMOD predicted higher concentrations than either ISC or CTDMPLUS. As seen before, the last column in Table 4-9 provides data, presented in the earlier consequence analysis, as a convenient reference for the reader. Table 4-9. Summary statistics based on the ratio of AERMOD predicted regulatory design concentration to ISCST3(COMPLEX1) and CTDMPlus predicted-regulatory-design concentrations for complex terrain (see Appendix E) AER/ 02222AER/ 02222AER/ ISC3 CTDM AER NO OF RATIOS> NO OF RATIOS> NO OF RATIOS> NO OF RATIOS> TOTAL NO NO OF RATIOS< NO OF RATIOS< NO OF RATIOS< NO OF RATIOS< AVERAGE MAX MIN In complex terrain, the COMPLEX1 portion of the ISCST3 model is playing a significant role. For receptors with elevations above the plume height, the COMPLEX1 concentration estimates are used. In intermediate terrain, the highest estimates from the ISCST3" simple terrain model and the COMPLEX1 model are used. 28
30 5. DISCUSSION OF RESULTS 5.1 Discussion of Flat and Simple Terrain Results The current version of AERMOD (02222). With all the flat and simple terrain results viewed as a whole, the current version of AERMOD produces maximum concentrations that are similar to ISCST3's predicted concentrations. The reported average of 0.96 ( Table 4-1, row 10 column 3) indicates that AERMOD predicts concentrations only about 4% lower than ISCST3. This average is taken over all source types, stack heights, settings and concentration averaging times. However, as expected when a new model is developed, there are differences between the old and the new air dispersion model predictions. Although about 80% of the AERMOD concentrations are within a factor of 2 (high or low) from the ISCST3 concentrations Table 4-1, column 3 also indicates that, for certain situations, the proposed AERMOD predictions are higher or lower than ISCST3 predictions by a factor of 3 or more. Upon studying column 4 in the detailed Appendix D listing, one can find that the most significant differences between the 2 models are found in the following scenarios: 1. in the rural, low level stacks (AERMOD is lower); 2. in the long-term concentrations for the rural, taller stacks (AERMOD is higher); 3. in the short-term, urban short stacks and urban area sources (AERMOD is lower); and, 4. in all of the regulatory concentrations for urban very tall stacks in simple terrain (AERMOD is lower). These results are consistent across the 2 meteorological data bases. Because the 2 air dispersion models are significantly different from one another (see Appendix A for side-byside comparison), such variation in the model differences is expected Impacts of the changes to AERMOD. Changes made to AERMOD produced changes to the consequence analysis. Column 2 in Table 4-1 shows that, over all source types, settings, and averaging times, the proposed version of AERMOD predicts an average concentration ratio of 1.14 or about 14% higher than ISCST3 (compared to 0.96 or about 4% lower based on the current version of AERMOD). Thus, there is about a 16% 25 reduction in the overall average of concentration ratios. Table 4-1 column 3 also indicates that the differences in the AERMOD predictions are not as extreme as seen in the earlier consequence analysis. The number of cases where the AERMOD to ISCST3 ratios are greater than a factor of 2 drops from 43 out of a total of 336 (proposed version) to 25 (current version). The number of cases where the concentration ratios are greater than 3 drops from 12 to 5. On the other side of the distribution where AERMOD predictions are less than ISCST3's predictions, the distribution of cases where the AERMOD to 25 The 16% = ( ) / 1.14 x
31 ISCST3 concentration ratios are less than one-half, less than one-third and less than one-fourth remains almost the same as those from the April 1999 analysis. Reviewing the urban and rural breakout tables (Tables 4-2, 4-3), one sees that the largest changes occur in the urban setting while the rural distribution and averages do not change significantly. In the urban setting results in Appendix D, the most significant changes are found in the following scenarios: 1. in the short-term concentrations for area sources (a decrease in concentrations due to the proper urbanization of the dispersions parameters); 2. in the short-term concentrations for low stacks (a decrease in concentrations due to the addition of meander for both stable and unstable settings); and, 3. in the overall urban category when comparing the averages in Table 4-3, row 11, columns 3 and 4 (a decrease due to the addition of stable and unstable urban meander). In the rural setting, less significant changes are seen and those changes are found: 1. in the short-term concentration for low stacks (an increase due to the changing of the minimum layer depth used to calculate the effective dispersion parameters- a secondary effect from fixing the urban dispersion problem); and, 2. in the overall results (a slight overall reduction in concentration predictions due to the addition of meander in the rural, stable setting) Model Evaluation Study support. Differences between models leads to the next topic for discussion - how do these models perform when compared to measured data? Do the differences represent an improvement in model predictions? The model evaluation study (MES) 8 provides AERMOD s (including the proposed version and the current version) and ISCST3's predictions and compares them to ambient air quality data. Of the 5 available flat terrain data bases in the MES, there is one MES site with a low-level release in a flat rural setting. In this scenario, the current version of AERMOD s (version 02222) short-term concentration predictions (the Robust Highest Concentrations 26 [RHCs]) are about ½ of the ISCST3 estimates, with the AERMOD estimates more closely matching the observed values. The MES also includes 3 rural, tall stack scenarios in flat or simple terrain locations which shows AERMOD predicting long-term concentrations (RHCs that are almost twice as high as the ISCST3 predictions. In all 3 cases, AERMOD predictions are closer to the measured values. The MES does not have any data bases which are representative of the shorter stacks in urban settings. The one urban data set (tall stack) in the MES is based on a limited monitoring study. The urban one-hour RHC for AERMOD is about 20% lower than the ISCST3 with AERMOD predictions closer to the measured concentrations. The MES supports the 26 W.M. Cox, J.A. Tikvart, A Statistical Procedure for Determining the Best Performing Air Quality Simulation Model, Atmospheric Environment, Vol.24A, No 9, pp ,
32 AERMOD concentration predictions over those provided by the ISCST3 model, i.e., AERMOD s performance is better than ISCST3's performance when compared to monitored concentrations. Also, the MES indicates a slight performance improvement when comparing the current version of AERMOD (version 02222) to the proposed version of AERMOD. The most notable differences are in the short term concentrations with a tall stack in the urban area and with a tall stack in moderate hilly terrain in a rural area. In both settings, the current version of AERMOD predicts lower RHCs than the proposed version (which is consistent with this study) and predicts concentrations that are closer to the measured values. 5.2 Discussion of Building Downwash Results. The discussion in this section does not include the proposed version of AERMOD. The proposed version of AERMOD (99351) does not include the PRIME algorithms and does not play a role in the building downwash analysis. For this component of the consequence analysis, the current version of AERMOD (02222) is the new model, ISC-PRIME is the proposed model, and ISCST3 is the currently approved model AERMOD versus ISCST3. Table 4-4 presents the results of the downwash analysis and Table 4-5 presents a summary of the results. The summary table indicates that AERMOD (with PRIME) produces somewhat lower maximum concentration estimates, on average, than ISCST3. The AERMOD to ISCST3 ratios in column 12 displays an average concentration ratio of 0.82; that is, on average over all 60 cases (10 source types, 2 settings and 3 averaging times), AERMOD predicts concentrations that are about 18% lower than ISCST3's predictions. However, the range of the concentration ratios is more significant; AERMOD predicted concentrations that are up to a factor of 4 higher and up to a factor of 10 lower than ISCST3. The situation where AERMOD s predicts maximum concentrations much lower than the ISCST concentrations is found in several cases. For example, the 35 meter stack separated from the building for all averaging times in urban and rural settings for all 3 building types (total of 18 cases in Table 4-4) indicate lower AERMOD predictions. Because the downwash algorithms in ISCST3 ignore the separation between stacks and buildings and is designed to be environmentally conservative 27, relatively smaller AERMOD concentrations are expected for the shorter stacks. This scenario with stack/building separation was chosen originally to highlight the differences in the ISCST3 and PRIME models, thus, significant differences are expected. The vast majority of the remaining cases have AERMOD concentrations that are within a factor of 2 of the ISCST3 concentrations. There are situations where AERMOD is higher than ISCST3. For example, in the annual concentration estimates for the rural setting, tall and squat building with a 100 meter stack (both adjacent to the building and separated from the building), the AERMOD maximum concentrations are larger than the ISCST3 estimates. In these cases, building downwash is not important to the 27 ISCST3 assumes that the stack is located in the center of the building which maximizes the impacts of the building wake on the plume dispersion. Generally, this assumption will predict the highest concentrations. 31
33 calculation of maximum annual concentration estimates, so the difference between AERMOD and ISCST3 concentration estimates are attributable only to the differences in the dispersion algorithms within the two models. The insignificance of building downwash for these cases is seen: 1) by the lack of a calculated cavity concentration (Table 4-7); and, by comparing the ISCST3 maximum concentrations to the matching non-downwash case for 100 meter stack in the rural setting (Table 4-4). The maximum annual concentrations and the concentration ratios for the downwash cases remains basically unchanged from the corresponding No building case. There is a second set of statistics prepared for those sources where cavity concentrations are calculated, that is, building downwash is a known significant factor in the dispersion of the plume (Table 4-6). These sources are marked in Table 4-4. The summary results in column 12, Table 4-6, show that the AERMOD maximum concentration predictions are, on average, about the same as those produced by ISCST3 (average concentration ratio of 1.01). The concentration ratios range from a maximum of 1.87 to a minimum of In all these significant downwash cases in Table 4-4, the stack is close to the building and the discrepancies between the 2 models are due only to the differences in the downwash algorithms AERMOD versus ISC-PRIME. Table 4-5 provides the summary information about the comparison between AERMOD and ISC-PRIME. Because PRIME is in both models, the expectation is that the 2 models should be in reasonable agreement. On average over the 60 cases, the ratio of AERMOD to ISC-PRIME maximum concentration predictions was 1.12 (AERMOD predictions are about 12% higher than ISC-PRIME predictions), which is rather good agreement. However, the maximum concentration ratio (3.46) and the minimum concentration ratio ( 0.28) are of initial concern. When studying the concentration values in Table 4-4 for those cases with the highest differences (rural case with 100 meter stack separated from a tall building) and lowest differences (urban case with 100 meter stack near a tall building), one can see that there are similar differences between the two models in the no-building scenario (rows 3 and 4). Thus, these extreme cases, which are not significant downwash cases, are mostly explained by the differences in the dispersion algorithms. For those cases where building downwash was more important, the two models should be in closer agreement, because the PRIME algorithms are in both models and should be dominating the dispersion calculations. Although there are differences in the way that PRIME interacts with the two dispersion models (the numerical plume rise, the plume capture criteria and blending of the disturbed plume with the surrounding undisturbed atmosphere), there are a number of tests to check AERMOD with the PRIME insertion. The first test involves the cavity concentrations which should be similar between the two models. Tables 4-7 and 4-8 indicate that this is so. In Table 4-8, for the 6 cases with significant maximum 1 hour cavity concentrations estimates, the average AERMOD/ISC-PRIME concentration ratio is 1.12 with the concentration ratio ranging from a maximum of 1.41 to a minimum of These cavity concentration differences are attributable to the differences in the plume rise equations. There are two cases where a very small cavity concentration is calculated by 32
34 both models, but these results not included in the previously mentioned statistics. These two cases include the 100 meter stack with a squat building in the rural and urban setting. The second related test reviews the AERMOD versus ISC-PRIME maximum concentration results for all averaging times for those cases with significant downwash (Table 4-6). The average AERMOD/ISC-PRIME concentration ratio is 1.03 with a maximum value of 1.29 and a minimum value of 0.79 (column 13). As expected in these cases with a definite cavity, the two models agree very closely (plus or minus 30%). The third test of model consistently compares those cases where building downwash is not significant enough to produce concentrations different from the reference ( No-building ) case (the first 4 rows in Table 4-4). In this test, both models should predict maximum concentrations that are essentially the same as those predicted by the model in the corresponding No building scenario. Table 4-4 indicates there are three source scenarios (all averaging times) where the building has little or no effects on the ISC-PRIME maximum concentrations: rural, urban 100 meter stacks separated from a squat building; and rural, urban 100 meter stacks near and separated from a tall building. In all these cases, AERMOD produces a matching result in that the building had almost no effect on the estimated maximum concentrations. Conversely, there are cases where AERMOD shows no change from the no-building to the with building scenario and ISC-PRIME modeling results predict some impact from the building. Examples of this result are seen in the 3 hour averaging columns: the urban and rural 100 meter stack near and separated from a tall building; the urban and rural 35 meter stack separated from the tall building; and, the urban 100 meter stack separated from the tall building. This difference in the two models is expected because of the critical angle of plume rise used for calculating the amount of pollution that is caught in the wake of the building. AERMOD development work suggested a change in this area and a different critical angle was implemented in the AERMOD Model Evaluation Study support. The original model evaluation reports 13,14, in general, support the addition of PRIME to the ISCST3 model. The reports conclude that the PRIME had a statistically better performance result for each data base in the independent evaluation. Although these results support the implementation of PRIME into the regulatory models, none of the evaluation databases have examples of stacks significantly separated from the building. So the model differences cannot be confirmed for this scenario. Although the AERMOD and ISC-PRIME maximum concentration estimates are in general agreement, there are differences. Some variations are expected because of the way that PRIME is integrated into AERMOD. When reviewing the model evaluation results 8, one finds that the AERMOD performance is slightly better than ISC-PRIME. There are four cases of slight degradation of performance, four cases of similar performance and, five cases with improved performance. Of the five cases with improved performance, there is one case with a rather dramatic performance improvement. 33
35 5.3 Discussion of Complex Terrain Results The current version of AERMOD (02222). The current version of AERMOD (02222) consistently produced lower or significantly lower regulatory design concentrations estimates than those generated from the ISCST3 (Table 4-9). This result was expected since that portion of the ISCST3 model that deals with complex terrain,complex1, is used for screening purposes and has been designed to be conservative 28. The average AERMOD/ISCST3 concentration ratio, overall scenarios and averaging times, is 0.24 (column 2, row 10). Thus, AERMOD produced maximum concentrations that were, over all all cases, a factor of 4 lower than the ISCST3 predictions. The concentration ratios ranged from 0.07 to In well over half of the cases (119 of the 196 cases), AERMOD produced maximum concentrations that were a factor of 4 lower than the ISCST3 estimates. There were no cases where AERMOD predicted maximum concentrations higher than ISCST3. When examining Appendix E, the differences between the 2 models tended to increase with averaging time, i.e. the largest differences were seen in the maximum annual averages. Also, Table 4-9 and Appendix E contain the results for the AERMOD/CTDMPLUS comparison. As expected, the models agreed more closely, since CTDMPLUS, which is not a screening model like COMPLEX1, is a more refined, site-specific complex terrain model. Table 4-9 indicates that the average AERMOD/CTDMPLUS ratio over all cases was 0.75 with a range of 0.14 (lowest value) to 2.13 (highest value). Table 4-9 indicates that AERMOD predicted maximum concentrations that were larger than CTDMPLUS in about 20% of cases (40 out of 196) Impacts of the changes to AERMOD. In the complex terrain scenarios, changes to the complex terrain algorithms do not produce much of a change to the consequence analysis. Some minor changes were made to the algorithm to make the model s concentration predictions less sensitive to the domain selection. The critical value of hill height scale was not changed in the input files. Thus, significant changes from the earlier consequence analysis are not expected. Table 4-9 column 4 summarizes the numerical changes to the concentration ratios of the current version of AERMOD to the proposed version of AERMOD. The average concentration ratio over all 196 cases is 1.01 which implies that the changes did not bias the model towards higher or lower concentration estimates. The range of concentration ratios of new versus the old version of AERMOD was 0.61 to The one high value of 2.67 was due to changes in the meander algorithm and was not a repercussion of the complex terrain changes. Although not shown in the summary table, about 94 % of the concentration ratios were within a factor of plus or minus 30% Model evaluation study support. As mentioned above, the differences between AERMOD and ISCST3 tend to increase with averaging time, i.e. the largest differences are seen in the maximum annual averages. These results are confirmed by the complex terrain model evaluation results. AERMOD consistently predicts lower maximum concentrations than ISCST3 28 That is, the model is designed to overestimate or produce concentration estimates which are larger than concentrations that one would measure. 34
36 with the largest variations occurring in the annual averages. AERMOD provides much better performance in the complex terrain data bases. AERMOD does not consistently predict lower maximum concentrations than CTDMPLUS s estimates, as is seen in the comparisons. There are cases where AERMOD is higher and lower than the site-specific complex terrain model. These results are consistent with the model evaluation results as AERMOD produces RHCs higher and lower than CTDMPLUS. However, in all but one of the 10 evaluation cases, AERMOD outperforms CTDMPLUS. The model evaluation results indicate that the current version of the model performs slightly better than the proposed version. In all of the 10 complex terrain database cases, the change to the performance is no greater than 9%. 35
37 6. GENERAL CONCLUSIONS The following general conclusions are made. 1) For non-downwash settings in flat and simple terrain, the current version of AERMOD (version 02222): a) on average, tends to predict maximum concentrations that are similar to ISCST3; b), on average, tends to predict concentrations closer to ISCST3 than the proposed version of AERMOD; and, c) predicts maximum concentrations which are not as extreme in their differences from ISCST3 as those seen when applying the proposed version of AERMOD; and, on average, tends to predict urban maximum concentrations that are lower than the proposed version of AERMOD. 2) Where building downwash is a significant factor in the air dispersion analysis, the current version of AERMOD predicts maximum concentrations and maximum cavity concentrations that are very similar to ISC-PRIME. 3) In general, the consequences from using the current version of AERMOD instead of ISCST3 in complex terrain are significant, the current version of AERMOD produces much lower maximum concentrations than the screening technique in ISCST3. Also, the current version of AERMOD produced results that are essentially unchanged from the results reported using the proposed version of AERMOD. When compared to CTDMPLUS, AERMOD tends to predict somewhat lower maximum concentrations with examples of AERMOD predictions being higher and lower than the CTDMPLUS predictions. 4) Where data are available, the model evaluation results support the differences identified in this report when comparing the proposed version of AERMOD to ISCST3 and when comparing the current version of AERMOD to the proposed version of AERMOD.. The model evaluation report indicates that the current version of AERMOD outperforms all the other four models ( ISCST3, ISC-PRIME, CDTMPLUS and the proposed version of AERMOD). 5) Because of the stability of AERMOD model throughout the consequence analysis and because the model evaluation study supports AERMOD (02222) when significant differences occur between the current version of AERMOD and ISCST3 or the earlier version of AERMOD, it is appropriate for the Agency to adopt the current version of AERMOD (02222) as a regulatory model and is a suitable replacement for ISCST3 for many regulatory applications. 36
38 7. COMPUTER RUN TIMES As an additional feature to the consequence analysis, ISCST3 and AERMOD models were compiled and run on a typical personal computer. The purpose of this exercise was to provide the user community with a sense of the potential changes in the amount of time to run typical source configurations on their computer systems. The results are tabulated below in Table 7-1. The computer used to complete this table was a Pentium 2.4 Gigahertz computer with 256 megabytes of random access memory. Each source run evaluated 180 receptors in a polar grid (36 radials with 5 ring distances). One full year (8784 hours) of meteorological data was used for each run. Table 7-1. Computer Run Times for Typical Source Configurations. Source Type AERMOD ISCST3 AER/ISC RATIO Point source 20.1 seconds 2.34 seconds 8.5 Point source w/ downwash Volume source Area source
39 APPENDIX A SIDE BY SIDE COMPARISON AERMOD VERSUS ISCST3 38
40 Feature ISCST3 AERMOD (version 02222) Comments Types of sources Point, area, and Same as ISCST3 Models are comparable modeled volume sources Plume Rise Uses Briggs equations with stack-top wind speed and vertical temperature gradient In stable conditions, uses Briggs equations with winds and temperature gradient at stack top and half-way to final plume rise; in convective conditions, plume rise is superposed on the displacements by random convective AERMOD is better because in stable conditions it factors in wind and temperature changes above stack top, and in unstable conditions it accounts for convective updrafts and downdrafts velocities Meteorological Data Input One level of data accepted An arbitrarily large number of data levels can be accommodated AERMOD can adapt multiple levels of data to various stack and plume height Profiling Meteorological Data Only wind speed is profiled AERMOD creates profiles of wind, temperature, and turbulence, using AERMOD is much improved over ISCST3 in this area all available measurement levels Use of Meteorological Data in Plume Dispersion Stack-top variables for all downwind distances Variables measured throughout the plume depth (averaged from plume centerline to 2.15 sigma-z below centerline; changes with downwind AERMOD treatment is far more advanced than that of ISCST3; accounts for meteorological data throughout the plume depth distance) Plume Dispersion: General Treatment Gaussian treatment in horizontal and vertical Gaussian treatment in horizontal and in vertical for stable conditions; non-gaussian probability density function in vertical for unstable conditions AERMOD s unstable treatment of vertical dispersion is a more accurate portrayal of actual conditions 39
41 Feature ISCST3 AERMOD (version 02222) Comments Urban Treatment Urban option either Population is specified, so AERMOD provides variable urban on or off; no other treatment can consider a variety of treatment as a function of city specification urban conditions; sources can population, and can selectively available; all individually be modeled rural or model sources as rural or urban sources must be urban modeled either rural or urban Characterization of Choice of rural or Selection by direction and month of AERMOD provides the user with Modeling Domain urban roughness length, albedo, and Bowen considerably more options in Surface ratio, providing user flexibility the selection of the surface Characteristics to vary surface characteristics characteristics Boundary Layer Wind speed, mixing Friction velocity, Monin-Obukhov AERMOD provides parameters Parameters height, and stability length, convective velocity scale, required for use with up-todate class mechanical and convective mixing planetary boundary layer height, sensible heat flux (PBL) parameterizations; ISCST3 does not Mixed Layer Height Holzworth scheme; uses interpolation based upon maximum afternoon mixing height Has convective and mechanical mixed layer height; convective height based upon hourly accumulation of sensible heat flux AERMOD s formulation is significantly more advanced than that of ISCST3, includes a mechanical component, and in using hourly input data, provides a more realistic sequence of the diurnal mixing height changes 40
42 Feature ISCST3 AERMOD (version 02222) Comments Terrain Depiction Plume Dispersion: Plume Growth Rates Elevation at each receptor point Based upon 6 discrete stability classes only; dispersion curves (Pasquill- Gifford) are based upon surface release experiments (e.g., Prairie Grass) Controlling hill elevation and point elevation at each receptor, obtained from special terrain preprocessor (AERMAP) that uses digital elevation model (DEM) data Uses profiles of vertical and horizontal turbulence (from measurements and/or PBL theory); variable with height; uses continuous growth functions rather than a discrete (stability-based) formulation AERMOD s terrain pre-processor provides information for advanced critical dividing streamline height algorithms and uses digital data to obtain receptor elevations Use of turbulence-based plume growth with height dependence rather than that based upon stability class provides AERMOD with a substantial advancement over the ISCST3 treatment Plume Interaction with Mixing Lid: convective conditions If plume centerline is above lid, a zero ground-level concentration is assumed Three plume components are considered: a direct plume that is advected to the ground in a downdraft, an indirect plume caught in an updraft that reaches the lid and eventually is brought to the ground, and a plume that penetrates the mixing lid and disperses more slowly in the stable layer aloft (and which can re-enter The AERMOD treatment avoids potential underpredictions suffered by ISCST3 due to its all or nothing treatment of the plume; AERMOD s use of convective updrafts and downdrafts in a probability density function approach is a significant advancement over ISCST3 41
43 Feature ISCST3 AERMOD (version 02222) Comments the mixed layer and disperse to the ground) Plume Interaction The mixing lid is A mechanically mixed layer near the AERMOD s use of a mechanically with Mixing Lid: ignored (assumed to ground is considered. Plume mixed layer is an advancement stable conditions be infinitely high) reflection from an elevated lid is over the very simplistic ISCST3 considered. approach Building Downwash Combination of Huber- New PRIME downwash algorithm AERMOD benefits from the Snyder and Scire- installed technological advances offered Schulman algorithms; by the PRIME model many discontinuities This page left intentionally blank. 42
44 APPENDIX B FIGURES FOR DESCRIBING COMPLEX TERRAIN
45 44
46 * TERRAIN INFORMATION HILL NAMED PIEDMONT HILL TOP: feet Figure B-1 displays both actual and transformed contours for the Piedmont hill. The transformed contours were used in the modeling analysis. There are 2 sets of 13 contours; the dotted lines are the actual contours and the solid lines are the transformed or modeled contours. The elevations for the 13 contours are listed below: feet The actual receptor locations are listed in the AERMOD control files which are listed in Appendix C. 45
47 46
48 * TERRAIN INFORMATION HILL NAMED MONTOUR HILL TOP: meters Figure B-2 displays both actual and transformed contours for the Montour Ridge. The transformed contours were used in the modeling analysis. There are 2 sets of 8 contours; the dotted lines are the actual contours and the solid lines are the transformed or modeled contours. The elevations for the 8 contours are listed below: meters The actual receptor locations are listed in the AERMOD control files which are listed in Appendix C. 47
49
50 TERRAIN INFORMATION HILL NAMED CINDER CONE BUTTE (CCB) HILL TOP: meters Figure B-3 displays both actual and transformed contours for CCB. The transformed contours were used in the modeling analysis. There are 2 sets of 11 contours; the dotted lines are the actual contours and the solid lines are the transformed or modeled contours. The elevations for the 11 contours are listed below: 0.0 meters The actual receptor locations are listed in the AERMOD control files which are listed in Appendix C.
51 APPENDIX C LOCATION OF SOURCE AND RECEPTORS FOR THE COMPLEX TERRAIN ANALYSIS 50
52 ** Cinder Cone Butte ** Low Stack Height: 30 meters ** High Buoyancy Case: 6-m diameter, 30 m/s Exit Vel, 500 K ** Close to Hill: 1 km away ** Meteorology from 100-m Tower and Sodar ** Cinder Cone Butte ** Low Stack Height: 30 meters ** High Buoyancy Case: 6-m diameter, 30 m/s Exit Vel, 500 K ** Close to Hill: 1 km away ** Meteorology from 100-m Tower and Sodar ** CO STARTING TITLEONE Cinder Cone Butte: Source 1 km away TITLETWO 30-m Stack Height; High Buoyancy Case MODELOPT CONC MSGPRO AVERTIME Period POLLUTID SO2 RUNORNOT RUN ERRORFIL ERRORS.OUT TERRHGTS ELEV CO FINISHED SO STARTING ELEVUNIT FEET LOCATION STACK1 POINT ** Point Source QS HS TS VS DS ** Parameters: SRCPARAM STACK SRCGROUP ALL SO FINISHED RE STARTING RE ELEVUNIT FEET ** X (meters) y(meters) z (feet) RE DISCCART RE DISCCART RE DISCCART RE DISCCART RE DISCCART RE DISCCART RE DISCCART
53 ** Cinder Cone Butte ** Low Stack Height: 30 meters ** High Buoyancy Case: 6-m diameter, 30 m/s Exit Vel, 500 K ** Close to Hill: 1 km away ** Meteorology from 100-m Tower and Sodar RE DISCCART RE DISCCART RE DISCCART RE DISCCART RE DISCCART RE DISCCART RE DISCCART RE DISCCART RE DISCCART RE DISCCART RE DISCCART RE DISCCART RE DISCCART RE DISCCART RE DISCCART RE DISCCART RE DISCCART RE DISCCART RE DISCCART RE DISCCART RE DISCCART RE DISCCART RE DISCCART RE DISCCART RE DISCCART RE DISCCART RE DISCCART RE DISCCART RE DISCCART RE DISCCART RE DISCCART RE DISCCART RE DISCCART RE DISCCART RE DISCCART RE DISCCART RE DISCCART
54 ** Cinder Cone Butte ** Low Stack Height: 30 meters ** High Buoyancy Case: 6-m diameter, 30 m/s Exit Vel, 500 K ** Close to Hill: 1 km away ** Meteorology from 100-m Tower and Sodar RE DISCCART RE DISCCART RE DISCCART RE DISCCART RE DISCCART RE DISCCART RE DISCCART RE DISCCART RE DISCCART RE DISCCART RE DISCCART RE DISCCART RE DISCCART RE DISCCART RE DISCCART RE DISCCART RE DISCCART RE DISCCART RE DISCCART RE DISCCART RE DISCCART RE DISCCART RE DISCCART RE DISCCART RE DISCCART RE DISCCART RE DISCCART RE DISCCART RE DISCCART RE DISCCART RE DISCCART RE DISCCART RE DISCCART RE DISCCART RE DISCCART RE DISCCART RE DISCCART
55 ** Cinder Cone Butte ** Low Stack Height: 30 meters ** High Buoyancy Case: 6-m diameter, 30 m/s Exit Vel, 500 K ** Close to Hill: 1 km away ** Meteorology from 100-m Tower and Sodar RE DISCCART RE DISCCART RE DISCCART RE DISCCART RE DISCCART RE DISCCART RE DISCCART RE DISCCART RE DISCCART RE DISCCART RE DISCCART RE DISCCART RE DISCCART RE DISCCART RE DISCCART RE DISCCART RE DISCCART RE DISCCART RE DISCCART RE DISCCART RE DISCCART RE DISCCART RE DISCCART RE DISCCART RE DISCCART RE DISCCART RE DISCCART RE DISCCART RE DISCCART RE DISCCART RE DISCCART RE DISCCART RE DISCCART RE DISCCART RE DISCCART RE DISCCART RE DISCCART
56 ** Cinder Cone Butte ** Low Stack Height: 30 meters ** High Buoyancy Case: 6-m diameter, 30 m/s Exit Vel, 500 K ** Close to Hill: 1 km away ** Meteorology from 100-m Tower and Sodar RE DISCCART RE DISCCART RE DISCCART RE DISCCART RE DISCCART RE DISCCART RE DISCCART RE DISCCART RE DISCCART RE DISCCART RE DISCCART RE DISCCART RE DISCCART RE DISCCART RE DISCCART RE DISCCART RE DISCCART RE DISCCART RE DISCCART RE DISCCART RE DISCCART RE DISCCART RE FINISHED ME STARTING SURFFILE SURFACE FREE PROFFILE PROFILE FREE SURFDATA Tower/Sodar UAIRDATA Tower/Sodar SITEDATA Tower/Sodar ME FINISHED OU STARTING RECTABLE ALLAVE FIRST-SECOND OU FINISHED 55
57 ** Montour Alongwind Hill ** High Stack Height: 150 meters ** Low Buoyancy Case: 2-m diameter, 10 m/s Exit Vel, 400 K ** Close to Hill: 1 km away ** Meteorology from 100-m Tower and Sodar ** Montour Alongwind Hill ** High Stack Height: 150 meters ** Low Buoyancy Case: 2-m diameter, 10 m/s Exit Vel, 400 K ** Close to Hill: 1 km away ** Meteorology from 100-m Tower and Sodar ** CO STARTING TITLEONE Montour Alongwind Hill: Source 1 km away TITLETWO 150-m Stack Height; Low Buoyancy Case MODELOPT CONC MSGPRO AVERTIME Period POLLUTID SO2 RUNORNOT RUN ERRORFIL ERRORS.OUT ** TERRHGTS ELEV CO FINISHED SO STARTING ELEVUNIT FEET LOCATION STACK1 POINT ** Point Source QS HS TS VS DS ** Parameters: SRCPARAM STACK SRCGROUP ALL SO FINISHED RE STARTING RE ELEVUNIT FEET RE DISCCART RE DISCCART RE DISCCART RE DISCCART RE DISCCART RE DISCCART RE DISCCART RE DISCCART
58 ** Montour Alongwind Hill ** High Stack Height: 150 meters ** Low Buoyancy Case: 2-m diameter, 10 m/s Exit Vel, 400 K ** Close to Hill: 1 km away ** Meteorology from 100-m Tower and Sodar RE DISCCART RE DISCCART RE DISCCART RE DISCCART RE DISCCART RE DISCCART RE DISCCART RE DISCCART RE DISCCART RE DISCCART RE DISCCART RE DISCCART RE DISCCART RE DISCCART RE DISCCART RE DISCCART RE DISCCART RE DISCCART RE DISCCART RE DISCCART RE DISCCART RE DISCCART RE DISCCART RE DISCCART RE DISCCART RE DISCCART RE DISCCART RE DISCCART RE DISCCART RE DISCCART RE DISCCART RE DISCCART RE DISCCART RE DISCCART RE DISCCART RE DISCCART RE DISCCART
59 ** Montour Alongwind Hill ** High Stack Height: 150 meters ** Low Buoyancy Case: 2-m diameter, 10 m/s Exit Vel, 400 K ** Close to Hill: 1 km away ** Meteorology from 100-m Tower and Sodar RE DISCCART RE DISCCART RE DISCCART RE DISCCART RE DISCCART RE DISCCART RE DISCCART RE DISCCART RE DISCCART RE DISCCART RE DISCCART RE DISCCART RE DISCCART RE DISCCART RE DISCCART RE FINISHED ME STARTING SURFFILE SURFACE FREE PROFFILE PROFILE FREE SURFDATA Tower/Sodar UAIRDATA Tower/Sodar SITEDATA Tower/Sodar PROFBASE 0 ME FINISHED OU STARTING RECTABLE ALLAVE FIRST-SECOND OU FINISHED 58
60 ** Montour Crosswind Hill ** High Stack Height: 150 meters ** Low Buoyancy Case: 2-m diameter, 10 m/s Exit Vel, 400 K ** Close to Hill: 1 km away ** Meteorology from 100-m Tower and Sodar ** Montour Crosswind Hill ** High Stack Height: 150 meters ** Low Buoyancy Case: 2-m diameter, 10 m/s Exit Vel, 400 K ** Close to Hill: 1 km away ** Meteorology from 100-m Tower and Sodar ** CO STARTING TITLEONE Montour Crosswind Hill: Source 1 km away TITLETWO 150-m Stack Height; Low Buoyancy Case MODELOPT CONC MSGPRO AVERTIME Period POLLUTID SO2 RUNORNOT RUN ERRORFIL ERRORS.OUT ** TERRHGTS ELEV CO FINISHED SO STARTING ELEVUNIT FEET LOCATION STACK1 POINT ** Point Source QS HS TS VS DS ** Parameters: SRCPARAM STACK SRCGROUP ALL SO FINISHED RE STARTING RE ELEVUNIT FEET RE DISCCART RE DISCCART RE DISCCART RE DISCCART RE DISCCART RE DISCCART RE DISCCART RE DISCCART
61 ** Montour Crosswind Hill ** High Stack Height: 150 meters ** Low Buoyancy Case: 2-m diameter, 10 m/s Exit Vel, 400 K ** Close to Hill: 1 km away ** Meteorology from 100-m Tower and Sodar RE DISCCART RE DISCCART RE DISCCART RE DISCCART RE DISCCART RE DISCCART RE DISCCART RE DISCCART RE DISCCART RE DISCCART RE DISCCART RE DISCCART RE DISCCART RE DISCCART RE DISCCART RE DISCCART RE DISCCART RE DISCCART RE DISCCART RE DISCCART RE DISCCART RE DISCCART RE DISCCART RE DISCCART RE DISCCART RE DISCCART RE DISCCART RE DISCCART RE DISCCART RE DISCCART RE DISCCART RE DISCCART RE DISCCART RE DISCCART RE DISCCART RE DISCCART RE DISCCART
62 ** Montour Crosswind Hill ** High Stack Height: 150 meters ** Low Buoyancy Case: 2-m diameter, 10 m/s Exit Vel, 400 K ** Close to Hill: 1 km away ** Meteorology from 100-m Tower and Sodar RE DISCCART RE DISCCART RE DISCCART RE DISCCART RE DISCCART RE DISCCART RE DISCCART RE DISCCART RE DISCCART RE DISCCART RE DISCCART RE DISCCART RE DISCCART RE DISCCART RE DISCCART RE FINISHED ME STARTING SURFFILE SURFACE FREE PROFFILE PROFILE FREE SURFDATA Tower/Sodar UAIRDATA Tower/Sodar SITEDATA Tower/Sodar PROFBASE 0 ME FINISHED OU STARTING RECTABLE ALLAVE FIRST-SECOND OU FINISHED 61
63 ** Piedmont Hill ** High Stack Height: 150 meters ** Low Buoyancy Case: 2-m diameter, 10 m/s Exit Vel, 400 K ** Close to Hill: 1 km away ** Meteorology from 100-m Tower and Sodar ** Piedmont Hill ** High Stack Height: 150 meters ** Low Buoyancy Case: 2-m diameter, 10 m/s Exit Vel, 400 K ** Close to Hill: 1 km away ** Meteorology from 100-m Tower and Sodar ** CO STARTING TITLEONE Piedmont Hill: Source 1 km away TITLETWO 150-m Stack Height; Low Buoyancy Case MODELOPT CONC MSGPRO AVERTIME Period POLLUTID SO2 RUNORNOT RUN ERRORFIL ERRORS.OUT ** TERRHGTS ELEV CO FINISHED SO STARTING ELEVUNIT FEET LOCATION STACK1 POINT ** Point Source QS HS TS VS DS ** Parameters: SRCPARAM STACK SRCGROUP ALL SO FINISHED RE STARTING RE ELEVUNIT FEET RE DISCCART RE DISCCART RE DISCCART RE DISCCART RE DISCCART RE DISCCART RE DISCCART RE DISCCART
64 ** Piedmont Hill ** High Stack Height: 150 meters ** Low Buoyancy Case: 2-m diameter, 10 m/s Exit Vel, 400 K ** Close to Hill: 1 km away ** Meteorology from 100-m Tower and Sodar RE DISCCART RE DISCCART RE DISCCART RE DISCCART RE DISCCART RE DISCCART RE DISCCART RE DISCCART RE DISCCART RE DISCCART RE DISCCART RE DISCCART RE DISCCART RE DISCCART RE DISCCART RE DISCCART RE DISCCART RE DISCCART RE DISCCART RE DISCCART RE DISCCART RE DISCCART RE DISCCART RE DISCCART RE DISCCART RE DISCCART RE DISCCART RE DISCCART RE DISCCART RE DISCCART RE DISCCART RE DISCCART RE DISCCART RE DISCCART RE DISCCART RE DISCCART RE DISCCART
65 ** Piedmont Hill ** High Stack Height: 150 meters ** Low Buoyancy Case: 2-m diameter, 10 m/s Exit Vel, 400 K ** Close to Hill: 1 km away ** Meteorology from 100-m Tower and Sodar RE DISCCART RE DISCCART RE DISCCART RE DISCCART RE DISCCART RE DISCCART RE DISCCART RE DISCCART RE DISCCART RE DISCCART RE DISCCART RE DISCCART RE DISCCART RE DISCCART RE DISCCART RE DISCCART RE DISCCART RE DISCCART RE DISCCART RE DISCCART RE DISCCART RE DISCCART RE DISCCART RE DISCCART RE DISCCART RE DISCCART RE DISCCART RE DISCCART RE DISCCART RE DISCCART RE DISCCART RE DISCCART RE DISCCART RE DISCCART RE DISCCART RE DISCCART RE DISCCART
66 ** Piedmont Hill ** High Stack Height: 150 meters ** Low Buoyancy Case: 2-m diameter, 10 m/s Exit Vel, 400 K ** Close to Hill: 1 km away ** Meteorology from 100-m Tower and Sodar RE DISCCART RE DISCCART RE DISCCART RE DISCCART RE DISCCART RE DISCCART RE DISCCART RE DISCCART RE DISCCART RE DISCCART RE DISCCART RE DISCCART RE DISCCART RE DISCCART RE FINISHED ME STARTING SURFFILE SURFACE FREE PROFFILE PROFILE FREE SURFDATA Tower/Sodar UAIRDATA Tower/Sodar SITEDATA Tower/Sodar PROFBASE 0 ME FINISHED OU STARTING RECTABLE ALLAVE FIRST-SECOND OU FINISHED 65
67 APPENDIX D FLAT AND SIMPLE TERRAIN MODELING RESULTS -- LISTING OF REGULATORY DESIGN CONCENTRATIONS 66
68 Appendix D. Results of the flat and simple terrain analysis. The ISC3 concentrations are in ug/m3 and the last 3 columns are concentration ratios. R05NDNBO ISC AER/ 02222AER/ 02222AER/ 1 Hour H1H 1.477E Hour H2H 1.477E Hour H1H 9.403E Hour H2H 6.626E Hour H1H 1.678E Hour H2H 1.355E Annual 1.537E R05NDNBP ISC AER/ 02222AER/ 02222AER/ 1 Hour H1H 2.215E Hour H2H 1.477E Hour H1H 8.294E Hour H2H 6.729E Hour H1H 3.350E Hour H2H 1.503E Annual 9.266E R10NDNBO ISC AER/ 02222AER/ 02222AER/ 1 Hour H1H 8.679E Hour H2H 8.679E Hour H1H 5.524E Hour H2H 3.918E Hour H1H 1.018E Hour H2H 8.792E Annual 1.147E R10NDNBP ISC AER/ 02222AER/ 02222AER/ 1 Hour H1H 1.283E Hour H2H 8.679E Hour H1H 4.871E Hour H2H 3.966E Hour H1H 2.044E Hour H2H 9.117E Annual 7.044E The first letter indicates urban (U) or rural (R) settings: the number indicates the stack height (meters): the next set of letters - VOL, volume source; ARE, area source; ND, no downwash; NB, no building; M, moderately buoyant; B, bouyant plume; F, flat terrain; T, simple terrain: the last letter indicates the met data site - O, Oklahoma City; P, Pittsburgh 67
69 Appendix D. Results of the flat and simple terrain analysis. The ISC3 concentrations are in ug/m3 and the last 3 columns are concentration ratios. R20NDNBO ISC AER/ 02222AER/ 02222AER/ 1 Hour H1H 7.518E Hour H2H 5.041E Hour H1H 3.027E Hour H2H 1.975E Hour H1H 8.005E Hour H2H 5.218E Annual 8.692E R20NDNBP ISC AER/ 02222AER/ 02222AER/ 1 Hour H1H 7.595E Hour H2H 4.889E Hour H1H 3.242E Hour H2H 2.192E Hour H1H 7.737E Hour H2H 6.170E Annual 6.952E R35MFO ISC AER/ 02222AER/ 02222AER/ 1 Hour H1H 1.394E Hour H2H 1.257E Hour H1H 1.091E Hour H2H 9.733E Hour H1H 3.291E Hour H2H 3.022E Annual 4.046E R35MFP ISC AER/ 02222AER/ 02222AER/ 1 Hour H1H 1.394E Hour H2H 1.267E Hour H1H 9.518E Hour H2H 7.229E Hour H1H 3.393E Hour H2H 2.322E Annual 2.781E The first letter indicates urban (U) or rural (R) settings: the number indicates the stack height (meters): the next set of letters - VOL, volume source; ARE, area source; ND, no downwash; NB, no building; M, moderately buoyant; B, bouyant plume; F, flat terrain; T, simple terrain: the last letter indicates the met data site - O, Oklahoma City; P, Pittsburgh 68
70 Appendix D. Results of the flat and simple terrain analysis. The ISC3 concentrations are in ug/m3 and the last 3 columns are concentration ratios. R35BFO ISC AER/ 02222AER/ 02222AER/ 1 Hour H1H 2.651E Hour H2H 2.551E Hour H1H 1.832E Hour H2H 1.807E Hour H1H 8.005E Hour H2H 6.871E Annual 8.103E R35BFP ISC AER/ 02222AER/ 02222AER/ 1 Hour H1H 2.626E Hour H2H 2.608E Hour H1H 1.951E Hour H2H 1.394E Hour H1H 6.414E Hour H2H 5.184E Annual 5.464E R100FO ISC AER/ 02222AER/ 02222AER/ 1 Hour H1H 6.150E Hour H2H 5.391E Hour H1H 3.820E Hour H2H 2.791E Hour H1H 6.271E Hour H2H 5.537E Annual 6.320E R100FP ISC AER/ 02222AER/ 02222AER/ 1 Hour H1H 5.296E Hour H2H 5.003E Hour H1H 2.751E Hour H2H 1.826E Hour H1H 7.965E Hour H2H 4.170E Annual 4.000E The first letter indicates urban (U) or rural (R) settings: the number indicates the stack height (meters): the next set of letters - VOL, volume source; ARE, area source; ND, no downwash; NB, no building; M, moderately buoyant; B, bouyant plume; F, flat terrain; T, simple terrain: the last letter indicates the met data site - O, Oklahoma City; P, Pittsburgh 69
71 Appendix D. Results of the flat and simple terrain analysis. The ISC3 concentrations are in ug/m3 and the last 3 columns are concentration ratios. R200FO ISC AER/ 02222AER/ 02222AER/ 1 Hour H1H 3.441E Hour H2H 2.074E Hour H1H 1.335E Hour H2H 1.043E Hour H1H 2.594E Hour H2H 1.907E Annual 1.480E R200FP ISC AER/ 02222AER/ 02222AER/ 1 Hour H1H 3.479E Hour H2H 3.131E Hour H1H 1.160E Hour H2H 1.098E Hour H1H 3.174E Hour H2H 1.714E Annual 8.200E R35TO ISC AER/ 02222AER/ 02222AER/ 1 Hour H1H 2.863E Hour H2H 2.522E Hour H1H 1.606E Hour H2H 1.471E Hour H1H 5.868E Hour H2H 5.074E Annual 6.466E R35TP ISC AER/ 02222AER/ 02222AER/ 1 Hour H1H 2.984E Hour H2H 2.835E Hour H1H 2.087E Hour H2H 1.668E Hour H1H 6.858E Hour H2H 5.750E Annual 6.193E The first letter indicates urban (U) or rural (R) settings: the number indicates the stack height (meters): the next set of letters - VOL, volume source; ARE, area source; ND, no downwash; NB, no building; M, moderately buoyant; B, bouyant plume; F, flat terrain; T, simple terrain: the last letter indicates the met data site - O, Oklahoma City; P, Pittsburgh 70
72 Appendix D. Results of the flat and simple terrain analysis. The ISC3 concentrations are in ug/m3 and the last 3 columns are concentration ratios. R200TO ISC AER/ 02222AER/ 02222AER/ 1 Hour H1H 3.441E Hour H2H 2.226E Hour H1H 1.723E Hour H2H 1.446E Hour H1H 5.957E Hour H2H 3.802E Annual 5.140E R200TP ISC AER/ 02222AER/ 02222AER/ 1 Hour H1H 3.479E Hour H2H 3.130E Hour H1H 1.512E Hour H2H 1.299E Hour H1H 4.775E Hour H2H 4.005E Annual 3.440E R10VOLFO ISC AER/ 02222AER/ 02222AER/ 1 Hour H1H 6.407E Hour H2H 4.611E Hour H1H 3.675E Hour H2H 3.094E Hour H1H 1.342E Hour H2H 1.102E Annual 2.496E R10VOLFP ISC AER/ 02222AER/ 02222AER/ 1 Hour H1H 8.044E Hour H2H 8.004E Hour H1H 4.150E Hour H2H 3.422E Hour H1H 1.719E Hour H2H 1.191E Annual 1.656E The first letter indicates urban (U) or rural (R) settings: the number indicates the stack height (meters): the next set of letters - VOL, volume source; ARE, area source; ND, no downwash; NB, no building; M, moderately buoyant; B, bouyant plume; F, flat terrain; T, simple terrain: the last letter indicates the met data site - O, Oklahoma City; P, Pittsburgh 71
73 Appendix D. Results of the flat and simple terrain analysis. The ISC3 concentrations are in ug/m3 and the last 3 columns are concentration ratios. R35VOLFO ISC AER/ 02222AER/ 02222AER/ 1 Hour H1H 1.347E Hour H2H 8.979E Hour H1H 6.060E Hour H2H 4.795E Hour H1H 2.022E Hour H2H 1.728E Annual 4.123E R35VOLFP ISC AER/ 02222AER/ 02222AER/ 1 Hour H1H 1.457E Hour H2H 1.024E Hour H1H 6.079E Hour H2H 5.010E Hour H1H 2.178E Hour H2H 1.807E Annual 2.988E RAREFO ISC AER/ 02222AER/ 02222AER/ 1 Hour H1H 1.374E Hour H2H 1.374E Hour H1H 1.317E Hour H2H 1.218E Hour H1H 6.654E Hour H2H 5.904E Annual 2.573E RAREFP ISC AER/ 02222AER/ 02222AER/ 1 Hour H1H 2.047E Hour H2H 1.983E Hour H1H 1.532E Hour H2H 1.257E Hour H1H 7.766E Hour H2H 7.353E Annual 3.044E The first letter indicates urban (U) or rural (R) settings: the number indicates the stack height (meters): the next set of letters - VOL, volume source; ARE, area source; ND, no downwash; NB, no building; M, moderately buoyant; B, bouyant plume; F, flat terrain; T, simple terrain: the last letter indicates the met data site - O, Oklahoma City; P, Pittsburgh 72
74 Appendix D. Results of the flat and simple terrain analysis. The ISC3 concentrations are in ug/m3 and the last 3 columns are concentration ratios. U05NDNBO ISC AER/ 02222AER/ 02222AER/ 1 Hour H1H 1.668E Hour H2H 1.668E Hour H1H 1.284E Hour H2H 9.909E Hour H1H 3.038E Hour H2H 2.785E Annual 5.129E U05NDNBP ISC AER/ 02222AER/ 02222AER/ 1 Hour H1H 2.498E Hour H2H 1.668E Hour H1H 1.382E Hour H2H 1.106E Hour H1H 5.385E Hour H2H 2.891E Annual 3.033E U10NDNBO ISC AER/ 02222AER/ 02222AER/ 1 Hour H1H 1.588E Hour H2H 1.588E Hour H1H 1.223E Hour H2H 9.443E Hour H1H 2.899E Hour H2H 2.661E Annual 4.942E U10NDNBP ISC AER/ 02222AER/ 02222AER/ 1 Hour H1H 2.375E Hour H2H 1.588E Hour H1H 1.315E Hour H2H 1.053E Hour H1H 5.135E Hour H2H 2.774E Annual 2.923E The first letter indicates urban (U) or rural (R) settings: the number indicates the stack height (meters): the next set of letters - VOL, volume source; ARE, area source; ND, no downwash; NB, no building; M, moderately buoyant; B, bouyant plume; F, flat terrain; T, simple terrain: the last letter indicates the met data site - O, Oklahoma City; P, Pittsburgh 73
75 Appendix D. Results of the flat and simple terrain analysis. The ISC3 concentrations are in ug/m3 and the last 3 columns are concentration ratios. U20NDNBO ISC AER/ 02222AER/ 02222AER/ 1 Hour H1H 5.789E Hour H2H 5.078E Hour H1H 3.907E Hour H2H 3.145E Hour H1H 1.145E Hour H2H 9.885E Annual 2.119E U20NDNBP ISC AER/ 02222AER/ 02222AER/ 1 Hour H1H 7.568E Hour H2H 5.516E Hour H1H 4.189E Hour H2H 3.361E Hour H1H 1.730E Hour H2H 1.089E Annual 1.398E U35MFO ISC AER/ 02222AER/ 02222AER/ 1 Hour H1H 2.222E Hour H2H 1.859E Hour H1H 1.462E Hour H2H 1.403E Hour H1H 8.936E Hour H2H 8.090E Annual 1.415E U35MFP ISC AER/ 02222AER/ 02222AER/ 1 Hour H1H 2.358E Hour H2H 1.859E Hour H1H 1.644E Hour H2H 1.401E Hour H1H 9.331E Hour H2H 7.561E Annual 1.037E The first letter indicates urban (U) or rural (R) settings: the number indicates the stack height (meters): the next set of letters - VOL, volume source; ARE, area source; ND, no downwash; NB, no building; M, moderately buoyant; B, bouyant plume; F, flat terrain; T, simple terrain: the last letter indicates the met data site - O, Oklahoma City; P, Pittsburgh 74
76 Appendix D. Results of the flat and simple terrain analysis. The ISC3 concentrations are in ug/m3 and the last 3 columns are concentration ratios. U35BFO ISC AER/ 02222AER/ 02222AER/ 1 Hour H1H 6.987E Hour H2H 5.931E Hour H1H 4.513E Hour H2H 3.648E Hour H1H 2.849E Hour H2H 2.716E Annual 3.748E U35BFP ISC AER/ 02222AER/ 02222AER/ 1 Hour H1H 5.718E Hour H2H 4.429E Hour H1H 3.615E Hour H2H 3.473E Hour H1H 2.171E Hour H2H 1.927E Annual 2.568E U100FO ISC AER/ 02222AER/ 02222AER/ 1 Hour H1H 8.344E Hour H2H 7.354E Hour H1H 5.392E Hour H2H 4.886E Hour H1H 3.015E Hour H2H 2.984E Annual 4.082E U100FP ISC AER/ 02222AER/ 02222AER/ 1 Hour H1H 8.015E Hour H2H 7.214E Hour H1H 5.665E Hour H2H 4.963E Hour H1H 2.329E Hour H2H 2.022E Annual 2.602E The first letter indicates urban (U) or rural (R) settings: the number indicates the stack height (meters): the next set of letters - VOL, volume source; ARE, area source; ND, no downwash; NB, no building; M, moderately buoyant; B, bouyant plume; F, flat terrain; T, simple terrain: the last letter indicates the met data site - O, Oklahoma City; P, Pittsburgh 75
77 Appendix D. Results of the flat and simple terrain analysis. The ISC3 concentrations are in ug/m3 and the last 3 columns are concentration ratios. U200FO ISC AER/ 02222AER/ 02222AER/ 1 Hour H1H 3.134E Hour H2H 2.972E Hour H1H 2.152E Hour H2H 1.978E Hour H1H 1.107E Hour H2H 9.360E Annual 1.276E U200FP ISC AER/ 02222AER/ 02222AER/ 1 Hour H1H 3.104E Hour H2H 2.726E Hour H1H 2.028E Hour H2H 1.941E Hour H1H 8.419E Hour H2H 6.496E Annual 8.800E U35TO ISC AER/ 02222AER/ 02222AER/ 1 Hour H1H 4.808E Hour H2H 4.364E Hour H1H 3.433E Hour H2H 2.541E Hour H1H 1.271E Hour H2H 1.107E Annual 1.826E U35TP ISC AER/ 02222AER/ 02222AER/ 1 Hour H1H 6.314E Hour H2H 4.922E Hour H1H 3.071E Hour H2H 2.784E Hour H1H 1.516E Hour H2H 1.333E Annual 2.224E The first letter indicates urban (U) or rural (R) settings: the number indicates the stack height (meters): the next set of letters - VOL, volume source; ARE, area source; ND, no downwash; NB, no building; M, moderately buoyant; B, bouyant plume; F, flat terrain; T, simple terrain: the last letter indicates the met data site - O, Oklahoma City; P, Pittsburgh 76
78 Appendix D. Results of the flat and simple terrain analysis. The ISC3 concentrations are in ug/m3 and the last 3 columns are concentration ratios. U200TO ISC AER/ 02222AER/ 02222AER/ 1 Hour H1H 7.411E Hour H2H 6.340E Hour H1H 5.143E Hour H2H 4.184E Hour H1H 1.332E Hour H2H 1.160E Annual 1.855E U200TP ISC AER/ 02222AER/ 02222AER/ 1 Hour H1H 7.576E Hour H2H 7.495E Hour H1H 4.611E Hour H2H 4.378E Hour H1H 1.884E Hour H2H 1.631E Annual 1.673E U10VOLFO ISC AER/ 02222AER/ 02222AER/ 1 Hour H1H 2.722E Hour H2H 2.722E Hour H1H 2.225E Hour H2H 2.007E Hour H1H 8.807E Hour H2H 7.552E Annual 1.775E U10VOLFP ISC AER/ 02222AER/ 02222AER/ 1 Hour H1H 4.076E Hour H2H 3.631E Hour H1H 2.595E Hour H2H 2.219E Hour H1H 1.102E Hour H2H 7.792E Annual 1.106E The first letter indicates urban (U) or rural (R) settings: the number indicates the stack height (meters): the next set of letters - VOL, volume source; ARE, area source; ND, no downwash; NB, no building; M, moderately buoyant; B, bouyant plume; F, flat terrain; T, simple terrain: the last letter indicates the met data site - O, Oklahoma City; P, Pittsburgh 77
79 Appendix D. Results of the flat and simple terrain analysis. The ISC3 concentrations are in ug/m3 and the last 3 columns are concentration ratios. U35VOLFO ISC AER/ 02222AER/ 02222AER/ 1 Hour H1H 1.079E Hour H2H 8.430E Hour H1H 5.600E Hour H2H 5.198E Hour H1H 2.736E Hour H2H 2.149E Annual 5.942E U35VOLFP ISC AER/ 02222AER/ 02222AER/ 1 Hour H1H 1.079E Hour H2H 9.609E Hour H1H 6.187E Hour H2H 5.280E Hour H1H 2.839E Hour H2H 2.302E Annual 4.048E UAREFO ISC AER/ 02222AER/ 02222AER/ 1 Hour H1H 4.902E Hour H2H 4.902E Hour H1H 4.787E Hour H2H 4.411E Hour H1H 2.651E Hour H2H 2.276E Annual 1.095E UAREFP ISC AER/ 02222AER/ 02222AER/ 1 Hour H1H 7.322E Hour H2H 7.202E Hour H1H 5.631E Hour H2H 4.691E Hour H1H 3.005E Hour H2H 2.882E Annual 1.287E The first letter indicates urban (U) or rural (R) settings: the number indicates the stack height (meters): the next set of letters - VOL, volume source; ARE, area source; ND, no downwash; NB, no building; M, moderately buoyant; B, bouyant plume; F, flat terrain; T, simple terrain: the last letter indicates the met data site - O, Oklahoma City; P, Pittsburgh 78
80 APPENDIX E COMPLEX TERRAIN MODELING RESULTS: LISTING OF REGULATORY DESIGN CONCENTRATIONS (UG/M3) 79
81 Appendix E. Complex terrain results. The ISC3 concentrations are in ug/m3 and the last 3 columns are concentration ratios. PHLLC 02222AER/ 02222AER/ 02222AER/ ISC3 ISC3 CTDM AER 1 Hour H1H Hour H2H Hour H1H Hour H2H Hour H1H Hour H2H Annual MCLLC 02222AER/ 02222AER/ 02222AER/ ISC3 ISC3 CTDM AER 1 Hour H1H Hour H2H Hour H1H Hour H2H Hour H1H Hour H2H Annual MALLC 02222AER/ 02222AER/ 02222AER/ ISC3 ISC3 CTDM AER 1 Hour H1H Hour H2H Hour H1H Hour H2H Hour H1H Hour H2H Annual CCLLC 02222AER/ 02222AER/ 02222AER/ ISC3 ISC3 CTDM AER 1 Hour H1H Hour H2H Hour H1H Hour H2H Hour H1H Hour H2H Annual The code for each scenario evaluated is as follows: The first 2 letters refer to the name of the hill: PH = Piedmont, MC = Montour Crosswind, MA = Montour Alongwind, CC = Cinder Cone Butte. The 3rd letter refers to the stack height: L = 30 meters, H = 150m. The fourth letter refers to the buoyancy: L = low, H = high. The fifth letter stands for the distance between the source and the hill: C = close or 1 kilometer, F = far or 10 km. 80
82 Appendix E. Complex terrain results. The ISC3 concentrations are in ug/m3 and the last 3 columns are concentration ratios. PHLLF 02222AER/ 02222AER/ 02222AER/ ISC3 ISC3 CTDM AER 1 Hour H1H Hour H2H Hour H1H Hour H2H Hour H1H Hour H2H Annual MCLLF 02222AER/ 02222AER/ 02222AER/ ISC3 ISC3 CTDM AER 1 Hour H1H Hour H2H Hour H1H Hour H2H Hour H1H Hour H2H Annual MALLF 02222AER/ 02222AER/ 02222AER/ ISC3 ISC3 CTDM AER 1 Hour H1H Hour H2H Hour H1H Hour H2H Hour H1H Hour H2H Annual CCLLF 02222AER/ 02222AER/ 02222AER/ ISC3 ISC3 CTDM AER 1 Hour H1H Hour H2H Hour H1H Hour H2H Hour H1H Hour H2H Annual The code for each scenario evaluated is as follows: The first 2 letters refer to the name of the hill: PH = Piedmont, MC = Montour Crosswind, MA = Montour Alongwind, CC = Cinder Cone Butte. The 3rd letter refers to the stack height: L = 30 meters, H = 150m. The fourth letter refers to the buoyancy: L = low, H = high. The fifth letter stands for the distance between the source and the hill: C = close or 1 kilometer, F = far or 10 km. 81
83 Appendix E. Complex terrain results. The ISC3 concentrations are in ug/m3 and the last 3 columns are concentration ratios. PHLHC 02222AER/ 02222AER/ 02222AER/ ISC3 ISC3 CTDM AER 1 Hour H1H Hour H2H Hour H1H Hour H2H Hour H1H Hour H2H Annual MCLHC 02222AER/ 02222AER/ 02222AER/ ISC3 ISC3 CTDM AER 1 Hour H1H Hour H2H Hour H1H Hour H2H Hour H1H Hour H2H Annual MALHC 02222AER/ 02222AER/ 02222AER/ ISC3 ISC3 CTDM AER 1 Hour H1H Hour H2H Hour H1H Hour H2H Hour H1H Hour H2H Annual CCLHC 02222AER/ 02222AER/ 02222AER/ ISC3 ISC3 CTDM AER 1 Hour H1H Hour H2H Hour H1H Hour H2H Hour H1H Hour H2H Annual The code for each scenario evaluated is as follows: The first 2 letters refer to the name of the hill: PH = Piedmont, MC = Montour Crosswind, MA = Montour Alongwind, CC = Cinder Cone Butte. The 3rd letter refers to the stack height: L = 30 meters, H = 150m. The fourth letter refers to the buoyancy: L = low, H = high. The fifth letter stands for the distance between the source and the hill: C = close or 1 kilometer, F = far or 10 km. 82
84 Appendix E. Complex terrain results. The ISC3 concentrations are in ug/m3 and the last 3 columns are concentration ratios. PHLHF 02222AER/ 02222AER/ 02222AER/ ISC3 ISC3 CTDM AER 1 Hour H1H Hour H2H Hour H1H Hour H2H Hour H1H Hour H2H Annual MCLHF 02222AER/ 02222AER/ 02222AER/ ISC3 ISC3 CTDM AER 1 Hour H1H Hour H2H Hour H1H Hour H2H Hour H1H Hour H2H Annual MALHF 02222AER/ 02222AER/ 02222AER/ ISC3 ISC3 CTDM AER 1 Hour H1H Hour H2H Hour H1H Hour H2H Hour H1H Hour H2H Annual CCLHF 02222AER/ 02222AER/ 02222AER/ ISC3 ISC3 CTDM AER 1 Hour H1H Hour H2H Hour H1H Hour H2H Hour H1H Hour H2H Annual The code for each scenario evaluated is as follows: The first 2 letters refer to the name of the hill: PH = Piedmont, MC = Montour Crosswind, MA = Montour Alongwind, CC = Cinder Cone Butte. The 3rd letter refers to the stack height: L = 30 meters, H = 150m. The fourth letter refers to the buoyancy: L = low, H = high. The fifth letter stands for the distance between the source and the hill: C = close or 1 kilometer, F = far or 10 km. 83
85 Appendix E. Complex terrain results. The ISC3 concentrations are in ug/m3 and the last 3 columns are concentration ratios. PHHLC 02222AER/ 02222AER/ 02222AER/ ISC3 ISC3 CTDM AER 1 Hour H1H Hour H2H Hour H1H Hour H2H Hour H1H Hour H2H Annual MCHLC 02222AER/ 02222AER/ 02222AER/ ISC3 ISC3 CTDM AER 1 Hour H1H Hour H2H Hour H1H Hour H2H Hour H1H Hour H2H Annual MAHLC 02222AER/ 02222AER/ 02222AER/ ISC3 ISC3 CTDM AER 1 Hour H1H Hour H2H Hour H1H Hour H2H Hour H1H Hour H2H Annual PHHLF 02222AER/ 02222AER/ 02222AER/ ISC3 ISC3 CTDM AER 1 Hour H1H Hour H2H Hour H1H Hour H2H Hour H1H Hour H2H Annual The code for each scenario evaluated is as follows: The first 2 letters refer to the name of the hill: PH = Piedmont, MC = Montour Crosswind, MA = Montour Alongwind, CC = Cinder Cone Butte. The 3rd letter refers to the stack height: L = 30 meters, H = 150m. The fourth letter refers to the buoyancy: L = low, H = high. The fifth letter stands for the distance between the source and the hill: C = close or 1 kilometer, F = far or 10 km. 84
86 Appendix E. Complex terrain results. The ISC3 concentrations are in ug/m3 and the last 3 columns are concentration ratios. MCHLF 02222AER/ 02222AER/ 02222AER/ ISC3 ISC3 CTDM AER 1 Hour H1H Hour H2H Hour H1H Hour H2H Hour H1H Hour H2H Annual MAHLF 02222AER/ 02222AER/ 02222AER/ ISC3 ISC3 CTDM AER 1 Hour H1H Hour H2H Hour H1H Hour H2H Hour H1H Hour H2H Annual PHHHC 02222AER/ 02222AER/ 02222AER/ ISC3 ISC3 CTDM AER 1 Hour H1H Hour H2H Hour H1H Hour H2H Hour H1H Hour H2H Annual MCHHC 02222AER/ 02222AER/ 02222AER/ ISC3 ISC3 CTDM AER 1 Hour H1H Hour H2H Hour H1H Hour H2H Hour H1H Hour H2H Annual The code for each scenario evaluated is as follows: The first 2 letters refer to the name of the hill: PH = Piedmont, MC = Montour Crosswind, MA = Montour Alongwind, CC = Cinder Cone Butte. The 3rd letter refers to the stack height: L = 30 meters, H = 150m. The fourth letter refers to the buoyancy: L = low, H = high. The fifth letter stands for the distance between the source and the hill: C = close or 1 kilometer, F = far or 10 km. 85
87 Appendix E. Complex terrain results. The ISC3 concentrations are in ug/m3 and the last 3 columns are concentration ratios. MAHHC 02222AER/ 02222AER/ 02222AER/ ISC3 ISC3 CTDM AER 1 Hour H1H Hour H2H Hour H1H Hour H2H Hour H1H Hour H2H Annual PHHHF 02222AER/ 02222AER/ 02222AER/ ISC3 ISC3 CTDM AER 1 Hour H1H Hour H2H Hour H1H Hour H2H Hour H1H Hour H2H Annual MCHHF 02222AER/ 02222AER/ 02222AER/ ISC3 ISC3 CTDM AER 1 Hour H1H Hour H2H Hour H1H Hour H2H Hour H1H Hour H2H Annual MAHHF 02222AER/ 02222AER/ 02222AER/ ISC3 ISC3 CTDM AER 1 Hour H1H Hour H2H Hour H1H Hour H2H Hour H1H Hour H2H Annual The code for each scenario evaluated is as follows: The first 2 letters refer to the name of the hill: PH = Piedmont, MC = Montour Crosswind, MA = Montour Alongwind, CC = Cinder Cone Butte. The 3rd letter refers to the stack height: L = 30 meters, H = 150m. The fourth letter refers to the buoyancy: L = low, H = high. The fifth letter stands for the distance between the source and the hill: C = close or 1 kilometer, F = far or 10 km. 86
88 TECHNICAL REPORT DATA (Please read Instructions on reverse before completing) 1. REPORT NO RECIPIENT'S ACCESSION NO. EPA-454/R TITLE AND SUBTITLE Comparison of Regulatory Design Concentrations: AERMOD vs. ISCST3, CTDMPLUS, ISC-PRIME 5. REORT DATE June PERFORMING ORGANIZATION CODE 7. AUTHOR(S) 8. PERFORMING ORGANIZATION REPORT NO. 9. PERFORMING ORGANIZATION NAME AND ADDRESS See below. 12. SPONSORING AGENCY NAME AND ADDRESS U.S. Environmental Protection Agency Office of Air Quality Planning and Standards Emissions Monitoring and Analysis Division Research Triangle Park, NC PROGRAM ELEMENT NO. 11. CONTRACT/GRANT NO. 13. TYPE OF REPORT AND PERIOD COVERED Final technical report. 14. SPONSORING AGENCY CODE EPA/200/ SUPPLEMENTARY NOTES 16. ABSTRACT This report is a consequence analysis for the implementation of a new air dispersion model. A consequence analysis is designed to give the user community a sense of how regulatory design concentrations from the new model compare to those from an established model via a series of representative examples. For this study, the new model is AERMOD with the PRIME algorithms. The existing regulatory models used in this report are ISCST3, ISC-PRIME, and CTDMPLUS. This analysis shows, for an extensive number of typical source scenarios, the effects of the new model as compared to the existing regulatory model which it replaces. Overall, except for complex terrain, the models produce rather similar results, although there are significant differences for individual source types and settings. As expected in complex terrain, AERMOD typically produces concentrations that are lower than ISCST3. The model evaluation results, where available, support the differences seen between the models. 17. KEY WORDS AND DOCUMENT ANALYSIS a. DESCRIPTORS b. IDENTIFIERS/OPEN ENDED TERMS c. COSATI Field/Group consequence analysis, regulatory design concentrations, AERMOD, ISCST3, CTDMPLUS, PRIM E,ISC-PRIM Air Pollution models 18. DISTRIBUTION STATEMENT Release Unlimited 19. SECURITY CLASS (Report) Unclassified 21. No of pages SECURITY CLASS (Page) Unclassified 22. PRICE EPA Form (Rev. 4-77) PREVIOUS EDITION IS OBSOLETE
89 United States Office of Air Quality Planning and Standards Publication No. EPA-454/R Environmental Protection Emissions Monitoring and Analysis Division June 2003 Agency Research Triangle Park, NC 88
IMPLEMENTATION AND EVALUATION OF BULK RICHARDSON NUMBER SCHEME IN AERMOD
 FINAL REPORT IMPLEMENTATION AND EVALUATION OF BULK RICHARDSON NUMBER SCHEME IN AERMOD EPA Contract No. 68D4 Work Assignment No. -4 Prepared for Warren D. Peters (D43-) Emissions, Monitoring, and Analysis
AERMOD: DESCRIPTION OF MODEL FORMULATION
 AERMOD: DESCRIPTION OF MODEL FORMULATION EPA-454/R-03-004 September 004 AERMOD: DESCRIPTION OF MODEL FORMULATION By: Alan J. Cimorelli, U. S. Environmental Protection Agency, Region 3 Steven G. Perry 1,
PCRAMMET USER'S GUIDE
 EPA-454/B-96-001 (Revised June 1999) (Electronic copy only) PCRAMMET USER'S GUIDE U.S. ENVIRONMENTAL PROTECTION AGENCY Office of Air Quality Planning and Standards Emissions, Monitoring, and Analysis Division
Deposition Velocity Estimation with the GENII v2 Software
 Deposition Velocity Estimation with the GENII v2 Software N. J. Schira D. R. Armstrong D. C. Thoman E. A. R. Henley URS Safety Management Solutions 2131 S. Centennial Ave Aiken, SC 29803 [email protected]
Supporting document to NORSOK Standard C-004, Edition 2, May 2013, Section 5.4 Hot air flow
 1 of 9 Supporting document to NORSOK Standard C-004, Edition 2, May 2013, Section 5.4 Hot air flow A method utilizing Computational Fluid Dynamics (CFD) codes for determination of acceptable risk level
Problem Statement In order to satisfy production and storage requirements, small and medium-scale industrial
 Problem Statement In order to satisfy production and storage requirements, small and medium-scale industrial facilities commonly occupy spaces with ceilings ranging between twenty and thirty feet in height.
VOLATILITY AND DEVIATION OF DISTRIBUTED SOLAR
 VOLATILITY AND DEVIATION OF DISTRIBUTED SOLAR Andrew Goldstein Yale University 68 High Street New Haven, CT 06511 [email protected] Alexander Thornton Shawn Kerrigan Locus Energy 657 Mission St.
(1) 2 TEST SETUP. Table 1 Summary of models used for calculating roughness parameters Model Published z 0 / H d/h
 2 TEST SETUP. Table 1 Summary of models used for calculating roughness parameters Model Published z 0 / H d/h") Estimation of Surface Roughness using CFD Simulation Daniel Abdi a, Girma T. Bitsuamlak b a Research Assistant, Department of Civil and Environmental Engineering, FIU, Miami, FL, USA, [email protected]
Estimation of Surface Roughness using CFD Simulation Daniel Abdi a, Girma T. Bitsuamlak b a Research Assistant, Department of Civil and Environmental Engineering, FIU, Miami, FL, USA, [email protected]
39th International Physics Olympiad - Hanoi - Vietnam - 2008. Theoretical Problem No. 3
 CHANGE OF AIR TEMPERATURE WITH ALTITUDE, ATMOSPHERIC STABILITY AND AIR POLLUTION Vertical motion of air governs many atmospheric processes, such as the formation of clouds and precipitation and the dispersal
User s Guide. R-LINE Model Version 1.2. A Research LINE source model for near-surface releases
 User s Guide for R-LINE Model Version 1.2 A Research LINE source model for near-surface releases Prepared by: Michelle G. Snyder and David K. Heist Atmospheric Exposure Research Branch Atmospheric Modeling
Project Title: Quantifying Uncertainties of High-Resolution WRF Modeling on Downslope Wind Forecasts in the Las Vegas Valley
 University: Florida Institute of Technology Name of University Researcher Preparing Report: Sen Chiao NWS Office: Las Vegas Name of NWS Researcher Preparing Report: Stanley Czyzyk Type of Project (Partners
REDUCING UNCERTAINTY IN SOLAR ENERGY ESTIMATES
 REDUCING UNCERTAINTY IN SOLAR ENERGY ESTIMATES Mitigating Energy Risk through On-Site Monitoring Marie Schnitzer, Vice President of Consulting Services Christopher Thuman, Senior Meteorologist Peter Johnson,
WIND SHEAR, ROUGHNESS CLASSES AND TURBINE ENERGY PRODUCTION
 WIND SHEAR, ROUGHNESS CLASSES AND TURBINE ENERGY PRODUCTION M. Ragheb 4//15 INTRODUCTION At a height of about 1 kilometer the wind is barely affected by the surface of the Earth. In the lower atmospheric
Mixing Heights & Smoke Dispersion. Casey Sullivan Meteorologist/Forecaster National Weather Service Chicago
 Mixing Heights & Smoke Dispersion Casey Sullivan Meteorologist/Forecaster National Weather Service Chicago Brief Introduction Fire Weather Program Manager Liaison between the NWS Chicago office and local
Atmospheric Stability & Cloud Development
 Atmospheric Stability & Cloud Development Stable situations a small change is resisted and the system returns to its previous state Neutral situations a small change is neither resisted nor enlarged Unstable
SO 2 NAAQS Designations Modeling Technical Assistance Document
 SO 2 NAAQS Designations Modeling Technical Assistance Document U.S. EPA Office of Air and Radiation Office of Air Quality Planning and Standards Air Quality Assessment Division December 2013 DRAFT Executive
Model Virginia Map Accuracy Standards Guideline
 Commonwealth of Virginia Model Virginia Map Accuracy Standards Guideline Virginia Information Technologies Agency (VITA) Publication Version Control Publication Version Control: It is the user's responsibility
EFFECTS OF COMPLEX WIND REGIMES ON TURBINE PERFORMANCE
 EFFECTS OF COMPLEX WIND REGIMES ON TURBINE PERFORMANCE Elisabeth Rareshide, Andrew Tindal 1, Clint Johnson, AnneMarie Graves, Erin Simpson, James Bleeg, Tracey Harris, Danny Schoborg Garrad Hassan America,
P3.8 INTEGRATING A DOPPLER SODAR WITH NUCLEAR POWER PLANT METEOROLOGICAL DATA. Thomas E. Bellinger
 P3.8 INTEGRATING A DOPPLER SODAR WITH NUCLEAR POWER PLANT METEOROLOGICAL DATA Thomas E. Bellinger Illinois Emergency Management Agency Springfield, Illinois 1. INTRODUCTION A Doppler sodar owned by the
DATA VALIDATION, PROCESSING, AND REPORTING
 DATA VALIDATION, PROCESSING, AND REPORTING After the field data are collected and transferred to your office computing environment, the next steps are to validate and process data, and generate reports.
Stability and Cloud Development. Stability in the atmosphere AT350. Why did this cloud form, whereas the sky was clear 4 hours ago?
 Stability and Cloud Development AT350 Why did this cloud form, whereas the sky was clear 4 hours ago? Stability in the atmosphere An Initial Perturbation Stable Unstable Neutral If an air parcel is displaced
Virtual Met Mast verification report:
 Virtual Met Mast verification report: June 2013 1 Authors: Alasdair Skea Karen Walter Dr Clive Wilson Leo Hume-Wright 2 Table of contents Executive summary... 4 1. Introduction... 6 2. Verification process...
Developing Continuous SCM/CRM Forcing Using NWP Products Constrained by ARM Observations
 Developing Continuous SCM/CRM Forcing Using NWP Products Constrained by ARM Observations S. C. Xie, R. T. Cederwall, and J. J. Yio Lawrence Livermore National Laboratory Livermore, California M. H. Zhang
Sandia National Laboratories New Mexico Wind Resource Assessment Lee Ranch
 Sandia National Laboratories New Mexico Wind Resource Assessment Lee Ranch Data Summary and Transmittal for September December 2002 & Annual Analysis for January December 2002 Prepared for: Sandia National
This chapter discusses: 1. Definitions and causes of stable and unstable atmospheric air. 2. Processes that cause instability and cloud development
 Stability & Cloud Development This chapter discusses: 1. Definitions and causes of stable and unstable atmospheric air 2. Processes that cause instability and cloud development Stability & Movement A rock,
Seasonal & Daily Temperatures. Seasons & Sun's Distance. Solstice & Equinox. Seasons & Solar Intensity
 Seasonal & Daily Temperatures Seasons & Sun's Distance The role of Earth's tilt, revolution, & rotation in causing spatial, seasonal, & daily temperature variations Please read Chapter 3 in Ahrens Figure
Risk Management Procedure For The Derivation and Use Of Soil Exposure Point Concentrations For Unrestricted Use Determinations
 Risk Management Procedure For The Derivation and Use Of Soil Exposure Point Concentrations For Unrestricted Use Determinations Hazardous Materials and Waste Management Division (303) 692-3300 First Edition
An Introduction to Point Pattern Analysis using CrimeStat
 Introduction An Introduction to Point Pattern Analysis using CrimeStat Luc Anselin Spatial Analysis Laboratory Department of Agricultural and Consumer Economics University of Illinois, Urbana-Champaign
Including thermal effects in CFD simulations
 Including thermal effects in CFD simulations Catherine Meissner, Arne Reidar Gravdahl, Birthe Steensen [email protected], [email protected] Fjordgaten 15, N-125 Tonsberg hone: +47 8 1800 Norway Fax:
CFD SIMULATIONS OF WAKE EFFECTS AT THE ALPHA VENTUS OFFSHORE WIND FARM
 CFD SIMULATIONS OF WAKE EFFECTS AT THE ALPHA VENTUS OFFSHORE WIND FARM Annette Westerhellweg, Thomas Neumann DEWI GmbH, Ebertstr. 96, 26382 Wilhelmshaven, Germany Phone: +49 (0)4421 4808-828 Fax: +49 (0)4421
Hydraulic Jumps and Non-uniform Open Channel Flow, Course #507. Presented by: PDH Enterprises, LLC PO Box 942 Morrisville, NC 27560 www.pdhsite.
 Hydraulic Jumps and Non-uniform Open Channel Flow, Course #507 Presented by: PDH Enterprises, LLC PO Box 942 Morrisville, NC 27560 www.pdhsite.com Many examples of open channel flow can be approximated
Forecaster comments to the ORTECH Report
 Forecaster comments to the ORTECH Report The Alberta Forecasting Pilot Project was truly a pioneering and landmark effort in the assessment of wind power production forecast performance in North America.
Coupling micro-scale CFD simulations to meso-scale models
 Coupling micro-scale CFD simulations to meso-scale models IB Fischer CFD+engineering GmbH Fabien Farella Michael Ehlen Achim Fischer Vortex Factoria de Càlculs SL Gil Lizcano Outline Introduction O.F.Wind
Create a folder on your network drive called DEM. This is where data for the first part of this lesson will be stored.
 In this lesson you will create a Digital Elevation Model (DEM). A DEM is a gridded array of elevations. In its raw form it is an ASCII, or text, file. First, you will interpolate elevations on a topographic
CFD SIMULATION OF SDHW STORAGE TANK WITH AND WITHOUT HEATER
 International Journal of Advancements in Research & Technology, Volume 1, Issue2, July-2012 1 CFD SIMULATION OF SDHW STORAGE TANK WITH AND WITHOUT HEATER ABSTRACT (1) Mr. Mainak Bhaumik M.E. (Thermal Engg.)
John F. Cotton College of Architecture & Environmental Design California Polytechnic State University San Luis Obispo, California JOHN F.
 SO L I DMO D E L I N GAS A TO O LFO RCO N S T RU C T I N SO G LA REN V E LO PE S by John F. Cotton College of Architecture & Environmental Design California Polytechnic State University San Luis Obispo,
2013 Code_Saturne User Group Meeting. EDF R&D Chatou, France. 9 th April 2013
 2013 Code_Saturne User Group Meeting EDF R&D Chatou, France 9 th April 2013 Thermal Comfort in Train Passenger Cars Contact For further information please contact: Brian ANGEL Director RENUDA France [email protected]
O.F.Wind Wind Site Assessment Simulation in complex terrain based on OpenFOAM. Darmstadt, 27.06.2012
 O.F.Wind Wind Site Assessment Simulation in complex terrain based on OpenFOAM Darmstadt, 27.06.2012 Michael Ehlen IB Fischer CFD+engineering GmbH Lipowskystr. 12 81373 München Tel. 089/74118743 Fax 089/74118749
4.4 GRAPHICAL AND ANALYTICAL SOFTWARE VISUALIZATION TOOLS FOR EVALUATING METEOROLOGICAL AND AIR QUALITY MODEL PERFORMANCE
 4.4 GRAPHICAL AND ANALYTICAL SOFTWARE VISUALIZATION TOOLS FOR EVALUATING METEOROLOGICAL AND AIR QUALITY MODEL PERFORMANCE Irene Lee * Exponent Inc., Natick, Massachusetts 1. INTRODUCTION A critical part
Trace Layer Import for Printed Circuit Boards Under Icepak
 Tutorial 13. Trace Layer Import for Printed Circuit Boards Under Icepak Introduction: A printed circuit board (PCB) is generally a multi-layered board made of dielectric material and several layers of
Urban heat islands and summertime convective thunderstorms in Atlanta: three case studies
 Atmospheric Environment 34 (2000) 507}516 Urban heat islands and summertime convective thunderstorms in Atlanta: three case studies Robert Bornstein*, Qinglu Lin Department of Meteorology, San Jose State
Abstract. 1 Introduction. 2 Sampling locations
 Air Pollution XV 363 Ambient air quality monitoring in southern Kuwait A. A. Ramadan, A. Khan & S. Al-Hajraf Coastal and Air Pollution Department, Institute for Scientific Research, Kuwait Abstract Ambient
How To Find Out If The Winds From The Oak Ridge Site Are Calm
 EVALUATING THE WIND DATA FROM THE AUTOMATED SURFACE OBSERVING SYSTEM IN OAK RIDGE, TENNESSEE - IS KOQT THE CALMEST SITE IN THE US? Thomas E. Bellinger, CCM Y-12 National Security Complex Oak Ridge, Tennessee
As a minimum, the report must include the following sections in the given sequence:
 5.2 Limits for Wind Generators and Transformer Substations In cases where the noise impact at a Point of Reception is composed of combined contributions due to the Transformer Substation as well as the
Power output of offshore wind farms in relation to atmospheric stability Laurens Alblas BSc
 Power output of offshore wind farms in relation to atmospheric stability Laurens Alblas BSc Photo: Vestas Wind Systems A/S 1 1. Introduction Background Atmospheric stability is known to influence wind
MacroFlo Opening Types User Guide <Virtual Environment> 6.0
 MacroFlo Opening Types User Guide 6.0 Page 1 of 18 Contents 1. Introduction...4 2. What Are Opening Types?...5 3. MacroFlo Opening Types Manager Interface...5 3.1. Add... 5 3.2. Reference
2.0 BASIC CONCEPTS OF OPEN CHANNEL FLOW MEASUREMENT
 2.0 BASIC CONCEPTS OF OPEN CHANNEL FLOW MEASUREMENT Open channel flow is defined as flow in any channel where the liquid flows with a free surface. Open channel flow is not under pressure; gravity is the
A Response Surface Model to Predict Flammable Gas Cloud Volume in Offshore Modules. Tatiele Dalfior Ferreira Sávio Souza Venâncio Vianna
 A Response Surface Model to Predict Flammable Gas Cloud Volume in Offshore Modules Tatiele Dalfior Ferreira Sávio Souza Venâncio Vianna PRESENTATION TOPICS Research Group Overview; Problem Description;
AMS 2009 Summer Community Meeting Renewable Energy Topic
 AMS 2009 Summer Community Meeting Renewable Energy Topic The 2009 American Meteorological Society s Summer Community Meeting addressed the roles of academia, industry and government in supporting the development
How To Model An Ac Cloud
 Development of an Elevated Mixed Layer Model for Parameterizing Altocumulus Cloud Layers S. Liu and S. K. Krueger Department of Meteorology University of Utah, Salt Lake City, Utah Introduction Altocumulus
6.4 THE SIERRA ROTORS PROJECT, OBSERVATIONS OF MOUNTAIN WAVES. William O. J. Brown 1 *, Stephen A. Cohn 1, Vanda Grubiši 2, and Brian Billings 2
 6.4 THE SIERRA ROTORS PROJECT, OBSERVATIONS OF MOUNTAIN WAVES William O. J. Brown 1 *, Stephen A. Cohn 1, Vanda Grubiši 2, and Brian Billings 2 1 National Center for Atmospheric Research, Boulder, Colorado.
Eco Pelmet Modelling and Assessment. CFD Based Study. Report Number 610.14351-R1D1. 13 January 2015
 EcoPelmet Pty Ltd c/- Geoff Hesford Engineering 45 Market Street FREMANTLE WA 6160 Version: Page 2 PREPARED BY: ABN 29 001 584 612 2 Lincoln Street Lane Cove NSW 2066 Australia (PO Box 176 Lane Cove NSW
Preliminary Estimate Distribution of Exide s Lead Emissions in Soil
 Preliminary Estimate Distribution of Exide s Lead Emissions in Soil Department of Toxic Substances Control Kate Burger, P.G., Ph.D Senior Engineering Geologist Clean-up August 13,2015 1 Preface Goal: Assess
Adjustment of Anemometer Readings for Energy Production Estimates WINDPOWER June 2008 Houston, Texas
 Adjustment of Anemometer Readings for Energy Production Estimates WINDPOWER June 2008 Houston, Texas Matthew Filippelli, Julien Bouget, Michael Brower, and Dan Bernadett AWS Truewind, LLC 463 New Karner
This week. CENG 732 Computer Animation. Challenges in Human Modeling. Basic Arm Model
 CENG 732 Computer Animation Spring 2006-2007 Week 8 Modeling and Animating Articulated Figures: Modeling the Arm, Walking, Facial Animation This week Modeling the arm Different joint structures Walking
How To Use The Csi Ebpp Calculator
 CSI EPBB Design Factor Calculator User Guide 1. Guide Overview This User Guide is intended to provide background on the California Solar Initiative (CSI) Expected Performance Based Buydown (EPBB) Design
Successful Implementation of an Alternative Co-located Transfer Standard Audit Approach: Continuous Deployment of CTS Wind Sensors on a Tall Tower
 Successful Implementation of an Alternative Co-located Transfer Standard Audit Approach: Continuous Deployment of CTS Wind Sensors on a Tall Tower Kirk Stopenhagen Vorticity Consulting LLC Redmond, WA
The Wind Integration National Dataset (WIND) toolkit
 toolkit") The Wind Integration National Dataset (WIND) toolkit EWEA Wind Power Forecasting Workshop, Rotterdam December 3, 2013 Caroline Draxl NREL/PR-5000-60977 NREL is a national laboratory of the U.S. Department
The Wind Integration National Dataset (WIND) toolkit EWEA Wind Power Forecasting Workshop, Rotterdam December 3, 2013 Caroline Draxl NREL/PR-5000-60977 NREL is a national laboratory of the U.S. Department
Atomic Force Microscope and Magnetic Force Microscope Background Information
 Atomic Force Microscope and Magnetic Force Microscope Background Information Lego Building Instructions There are several places to find the building instructions for building the Lego models of atomic
Improving Low-Cloud Simulation with an Upgraded Multiscale Modeling Framework
 Improving Low-Cloud Simulation with an Upgraded Multiscale Modeling Framework Kuan-Man Xu and Anning Cheng NASA Langley Research Center Hampton, Virginia Motivation and outline of this talk From Teixeira
NUMERICAL ANALYSIS OF THE EFFECTS OF WIND ON BUILDING STRUCTURES
 Vol. XX 2012 No. 4 28 34 J. ŠIMIČEK O. HUBOVÁ NUMERICAL ANALYSIS OF THE EFFECTS OF WIND ON BUILDING STRUCTURES Jozef ŠIMIČEK email: [email protected] Research field: Statics and Dynamics Fluids mechanics
11.6 EVALUATING SODAR PERFORMANCE AND DATA QUALITY IN SUBARCTIC WESTERN ALASKA. Cyrena-Marie Druse * McVehil-Monnett Associates
 11.6 EVALUATING PERFORMANCE AND DATA QUALITY IN SUBARCTIC WESTERN ALASKA Cyrena-Marie Druse * McVehil-Monnett Associates 1. INTRODUCTION In September 28, a Sonic Detection and Ranging () antenna and two
Safe Operating Procedure
 Safe Operating Procedure (Revised 11/11) OPACITY OF EMISSIONS FROM COMBUSTION SOURCES (For assistance, please contact EHS at (402) 472-4925, or visit our web site at http://ehs.unl.edu/) The University
APPLICATION OF TRANSIENT WELLBORE SIMULATOR TO EVALUATE DELIVERABILITY CURVE ON HYPOTHETICAL WELL-X
 PROCEEDINGS, Thirty-Third Workshop on Geothermal Reservoir Engineering Stanford University, Stanford, California, January 8-30, 008 SGP-TR-185 APPLICATION OF TRANSIENT WELLBORE SIMULATOR TO EVALUATE DELIVERABILITY
Composite Surfaces Tutorial
 Composite Surfaces Tutorial 4-1 Composite Surfaces Tutorial This tutorial will use the same model as the Materials & Loading Tutorial (with some modifications), to demonstrate how to perform a circular
Wind resources map of Spain at mesoscale. Methodology and validation
 Wind resources map of Spain at mesoscale. Methodology and validation Martín Gastón Edurne Pascal Laura Frías Ignacio Martí Uxue Irigoyen Elena Cantero Sergio Lozano Yolanda Loureiro e-mail:[email protected]
AN EFFECT OF GRID QUALITY ON THE RESULTS OF NUMERICAL SIMULATIONS OF THE FLUID FLOW FIELD IN AN AGITATED VESSEL
 14 th European Conference on Mixing Warszawa, 10-13 September 2012 AN EFFECT OF GRID QUALITY ON THE RESULTS OF NUMERICAL SIMULATIONS OF THE FLUID FLOW FIELD IN AN AGITATED VESSEL Joanna Karcz, Lukasz Kacperski
Techniques to Improve Measurement Accuracy in Power Plant Reported Emissions
 Techniques to Improve Measurement Accuracy in Power Plant Reported Emissions Carlos E. Romero Nenad Sarunac Senior Research Engineer Principal Research Engineer Energy Research Center Energy Research Center
Chapter 4 Atmospheric Pressure and Wind
 Chapter 4 Atmospheric Pressure and Wind Understanding Weather and Climate Aguado and Burt Pressure Pressure amount of force exerted per unit of surface area. Pressure always decreases vertically with height
USING SIMULATED WIND DATA FROM A MESOSCALE MODEL IN MCP. M. Taylor J. Freedman K. Waight M. Brower
 USING SIMULATED WIND DATA FROM A MESOSCALE MODEL IN MCP M. Taylor J. Freedman K. Waight M. Brower Page 2 ABSTRACT Since field measurement campaigns for proposed wind projects typically last no more than
The Behaviour Of Vertical Jet Fires Under Sonic And Subsonic Regimes
 The Behaviour Of Vertical Jet Fires Under Sonic And Subsonic Regimes Palacios A. and Casal J. Centre for Technological Risk Studies (CERTEC), Department of Chemical Engineering, Universitat Politècnica
How do Scientists Forecast Thunderstorms?
 How do Scientists Forecast Thunderstorms? Objective In the summer, over the Great Plains, weather predictions often call for afternoon thunderstorms. While most of us use weather forecasts to help pick
Fundamentals of Climate Change (PCC 587): Water Vapor
: Water Vapor") Fundamentals of Climate Change (PCC 587): Water Vapor DARGAN M. W. FRIERSON UNIVERSITY OF WASHINGTON, DEPARTMENT OF ATMOSPHERIC SCIENCES DAY 2: 9/30/13 Water Water is a remarkable molecule Water vapor
Fundamentals of Climate Change (PCC 587): Water Vapor DARGAN M. W. FRIERSON UNIVERSITY OF WASHINGTON, DEPARTMENT OF ATMOSPHERIC SCIENCES DAY 2: 9/30/13 Water Water is a remarkable molecule Water vapor
Iterative calculation of the heat transfer coefficient
 Iterative calculation of the heat transfer coefficient D.Roncati Progettazione Ottica Roncati, via Panfilio, 17 44121 Ferrara Aim The plate temperature of a cooling heat sink is an important parameter
CHAPTER 4: OFFSITE CONSEQUENCE ANALYSIS
 CHAPTER 4: OFFSITE CONSEQUENCE ANALYSIS RMP OFFSITE CONSEQUENCE ANALYSIS GUIDANCE This chapter is intended for people who plan to do their own air dispersion modeling. If you plan to do your own modeling,
WMO 7 International Workshop on Volcanic Ash, Anchorage, AK
 An algorithm for automated cloud pattern recognition and mass eruption rate estimation from umbrella cloud or downwind plume observed via satellite imagery 1 WMO 7 International Workshop on Volcanic Ash,
Abaqus/CFD Sample Problems. Abaqus 6.10
 Abaqus/CFD Sample Problems Abaqus 6.10 Contents 1. Oscillatory Laminar Plane Poiseuille Flow 2. Flow in Shear Driven Cavities 3. Buoyancy Driven Flow in Cavities 4. Turbulent Flow in a Rectangular Channel
ATTACHMENT B California Energy Commission Air Quality Self-Certification Checklist for Simple-Cycle Gas Turbine Generation Units
 ATTACHMENT B California Energy Commission Air Quality Self-Certification Checklist for Simple-Cycle Gas Turbine Generation Units License Application for: [ X ] New Emissions Unit(s) at a New Stationary
Slope Density. Appendix F F-1 STATEMENT OF PURPOSE DISCUSSION OF SLOPE
 Appendix F Slope Density F-1 STATEMENT OF PURPOSE This document has been prepared with the intent of acquainting the general reader with the slope-density approach to determining the intensity of residential
Using Cloud-Resolving Model Simulations of Deep Convection to Inform Cloud Parameterizations in Large-Scale Models
 Using Cloud-Resolving Model Simulations of Deep Convection to Inform Cloud Parameterizations in Large-Scale Models S. A. Klein National Oceanic and Atmospheric Administration Geophysical Fluid Dynamics
The ADREA-HF CFD code An overview
 The ADREA-HF CFD code An overview Dr. A.G. Venetsanos Environmental Research Laboratory (EREL) National Centre for Scientific Research Demokritos, Greece [email protected] Slide 2 Computational
User Guide. The Business Energy Dashboard
 User Guide The Business Energy Dashboard 1 More Ways to Understand and Control Your Energy Use At FPL, we re investing in smart grid technologies as part of our commitment to building a smarter, more reliable
CFD Modelling and Real-time testing of the Wave Surface Glider (WSG) Robot
 Robot") 21st International Congress on Modelling and Simulation, Gold Coast, Australia, 29 Nov to 4 Dec 2015 www.mssanz.org.au/modsim2015 CFD Modelling and Real-time testing of the Wave Surface Glider (WSG) Robot
21st International Congress on Modelling and Simulation, Gold Coast, Australia, 29 Nov to 4 Dec 2015 www.mssanz.org.au/modsim2015 CFD Modelling and Real-time testing of the Wave Surface Glider (WSG) Robot
Natural Convection. Buoyancy force
 Natural Convection In natural convection, the fluid motion occurs by natural means such as buoyancy. Since the fluid velocity associated with natural convection is relatively low, the heat transfer coefficient
Convective Clouds. Convective clouds 1
 Convective clouds 1 Convective Clouds Introduction Convective clouds are formed in vertical motions that result from the instability of the atmosphere. This instability can be caused by: a. heating at
Solar Input Data for PV Energy Modeling
 June 2012 Solar Input Data for PV Energy Modeling Marie Schnitzer, Christopher Thuman, Peter Johnson Albany New York, USA Barcelona Spain Bangalore India Company Snapshot Established in 1983; nearly 30