SQL Server 2016 BI Any Data, Anytime, Anywhere. Phua Chiu Kiang PCK CONSULTING MVP (Data Platform)
|
|
|
- Horatio Underwood
- 9 years ago
- Views:
Transcription
1 SQL Server 2016 BI Any Data, Anytime, Anywhere Phua Chiu Kiang PCK CONSULTING MVP (Data Platform)

2 SQL Server 2016 Pin paginated report items to Power BI dashboards Visualization Mobile and paginated reports Modeling Power BI Tabular Multidimensional Access on-premises data ON-PREMISES CLOUD


3 ANALYZE & AUTHOR DELIVER CONSUME ANALYTICAL REPORTS CLOUD Microsoft Excel Power BI Power BI Web Portal Power BI Desktop POWER BI REPORTS Microsoft Excel ONE SET OF MOBILE APPS Power BI Desktop Mobile reports Paginated reports Windows App MOBILE REPORTS SQL Server Mobile Report Publisher PAGINATED REPORTS ON-PREMISES SQL Server Reporting Services PIN PAGINATED REPORT ITEMS Android App ios App SQL Server Report Builder Power BI Desktop Mobile reports Web portal Report Designer in SQL Server Data Tools Paginated reports EMBED SharePoint

4 ANALYZE & AUTHOR MOBILE REPORTS SQL Server Mobile Report Publisher PAGINATED REPORTS SQL Server Report Builder SQL Server Reporting Services Native mode DELIVER SQL Server 2016 Reporting Services Mobile Reports now a component of SSRS CONSUME ONE SET OF MOBILE APPS Windows Phone App Android App ios App Web portal (paginated and mobile reports) Report Designer in SQL Server Data Tools SQL Server Reporting Services SharePoint integrated mode Pin paginated report items to Power BI dashboards SharePoint

5 SQL Server 2016 Modern reports Mobile reports Enhanced analysis Rich tools Hybrid BI SharePoint 2016 support

6 Reporting Services

7 SQL Server Reporting Services Paginated reports Design beautiful documents using updated tools and new features Mobile reports Create responsive, interactive reports optimized for mobile devices New web portal Consume both types of reports in one web portal using modern browsers


8 Modern paginated reports Modern chart and gauge styles Updated Report Builder look-and-feel Visual Studio 2015 support Plugin-free printing


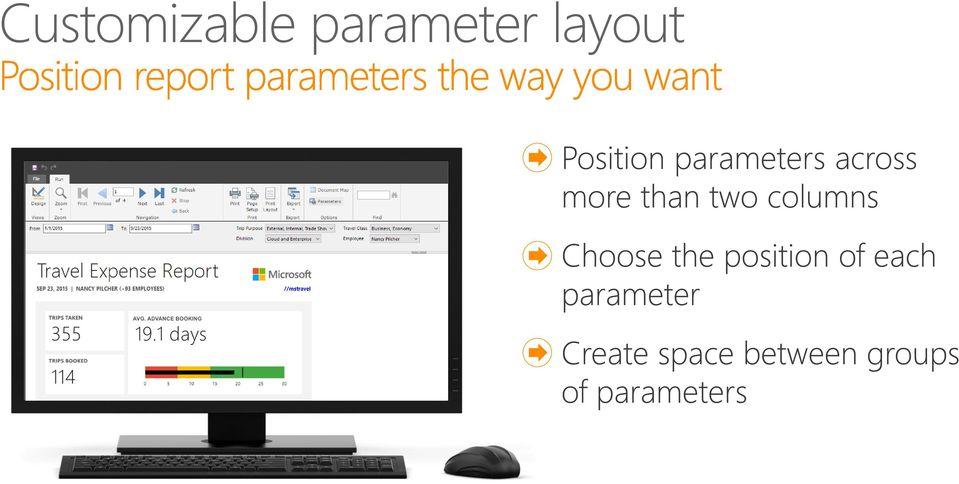
9 Customizable parameter layout

10 Export to PowerPoint Generate slides including all report content in seconds Move and resize individual objects Export manually, schedule for delivery, or generate programmatically

11 Pin report items to Power BI dashboards Monitor the most important metrics and trends in one place Pin charts, gauges, maps, and images as tiles to Power BI dashboards


12 Pin report items to Power BI dashboards Monitor the most important metrics and trends in one place Pin charts, gauges, maps, and images as tiles to Power BI dashboards

13 Demo SSRS Paginated Reports


14 Create interactive mobile reports Responsive experiences for phones and tablets

15 Consume mobile reports Native apps for all major mobile platforms One mobile app for Power BI and SSRS mobile reports Native mobile experience optimized for touch Keep data up-to-date with real-time query or scheduled data refresh Interact with mobile reports even when disconnected

16 New, modern web portal for reports

17 Demo Mobile Reports

 Processing and rendering REPORT DELIVERY DESTINATIONS Report Builder Mobile Report Publisher Scheduling and delivery Email SharePoint File share Power BI Visual Studio")
18 REPORT VIEWING (PCs, mobile) REPORT SERVER DATA SOURCES Web browsers Web portal SQL Server SQL Server Analysis Services Power BI Mobile Oracle Teradata Web APIs Custom apps/lob ODBC, OLE DB More/custom REPORT DESIGN (PCs) Processing and rendering REPORT DELIVERY DESTINATIONS Report Builder Mobile Report Publisher Scheduling and delivery SharePoint File share Power BI Visual Studio Report server database Custom

19

20 SQL Server Analysis Services 2016 Increase adoption Easily create models IT pro BI consumers Faster time to insight Share insights faster Business analyst

21 Analysis Services as the BI semantic model Easily abstract business problems to gain insights One semantic model - two ways to build: Tabular models Multidimensional models Tables and relationships Fast by design with in-memory Easy to get started and simple Dimensions and measure groups Highly scalable and mature Feature rich and complex
22 SQL Server Analysis Services CLIENT TOOLS BI SEMANTIC MODEL Queries Data model Business logic Data access Use SQL Server data tools for Visual Studio to create BI semantic models DATA SOURCES

23 Direct access without moving data DAX Query MDX Query

24 Improved diagram view layout
25 Multidimensional model enhancements Multidimensional cube Visualize and explore existing models with Power BI and Power BI Desktop Drill-through multi-selection support with Excel 2016
26 Dev / Ops in SQL Server 2016 People, process and the right tools DEV OPS Simplified setup experience with single SQL Server Data Tools for Visual Studio 2015 Check for corruption issues on database or individual objects with DBCC support for Analysis Services Diagnose problems with xevents, a lightweigh tracing and performance monitoring system in SQL Server Management Studio
27
28 Microsoft Power BI for Office 365 Self-service BI with the familiarity of Office and the power of the cloud One billion Office users 1 in 4 enterprise customers on Office 365 Discover Analyze Visualize Share Find Q&A Mobile Scalable Manageable Trusted
29 Power BI Designer A powerful and dedicated report authoring tool
30 Demo Power BI Hybrid Solutions
31 Connect to on-premises data from Power BI Access on-premises data any way you like: Scheduled refresh Live connection Cloud On-premises Connect to on-premises SQL Server Analysis Services models: Tabular and multidimensional
32 Power BI gateway for personal use Cloud On-premises Keep data in Power BI up to date using scheduled refresh Anyone can refresh no IT dependency Support for a large number of data sources Easy to use with a desktop-based lightweight one-click installer
33 Power BI Gateway for enterprise deployments Cloud On-premises Centralized way to refresh on-premises data in Power BI Control access to data sources Monitor gateways and data COMING SOON sources Live, interactive query with on-premises data sources
34

35 Enhancements for SharePoint BI Edit mode for PowerPivot workbooks Support for Excel 2016 workbooks Scheduled data refresh for Power Query connections New chart types, HTML5 rendering, plugin-free printing, export to PPT, and updated Report Builder
36 Learn more about SQL Server 2016 BI Visit the Data Platform Insider blog to learn more about the Microsoft BI reporting roadmap Read more on the Reporting Services blog Read more on the Analysis Services blog Download the latest SQL Server 2016 CTP Enable Hybrid BI with Power BI gateways
37
Choosing the right Mobile BI tool: SSRS vs Power BI vs Datazen
 Choosing the right Mobile BI tool: SSRS vs Power BI vs Datazen Andrea Martorana Tusa @bruco441 [email protected] Sponsors Organizers getlatestversion.it Speaker @bruco441 Analyst/Developer
Microsoft Services Exceed your business with Microsoft SharePoint Server 2010
 Microsoft Services Exceed your business with Microsoft SharePoint Server 2010 Business Intelligence Suite Alexandre Mendeiros, SQL Server Premier Field Engineer January 2012 Agenda Microsoft Business Intelligence
Business Intelligence in SharePoint 2013
 Business Intelligence in SharePoint 2013 Empowering users to change their world Jason Himmelstein, MVP Senior Technical Director, SharePoint @sharepointlhorn http://www.sharepointlonghorn.com Gold Sponsor
Using Microsoft Business Intelligence Dashboards and Reports in the Federal Government
 Using Microsoft Business Intelligence Dashboards and Reports in the Federal Government A White Paper on Leveraging Existing Investments in Microsoft Technology for Analytics and Reporting June 2013 Dev
Implementing Data Models and Reports with Microsoft SQL Server 2012 MOC 10778
 Implementing Data Models and Reports with Microsoft SQL Server 2012 MOC 10778 Course Outline Module 1: Introduction to Business Intelligence and Data Modeling This module provides an introduction to Business
Power BI as a Self-Service BI Platform:
 Power BI as a Self-Service BI Platform: Architecture, Use Cases, Strengths & Shortcomings SQL Saturday Atlanta 5/16/2015 Melissa Coates Solution Architect, BlueGranite Blog: sqlchick.com Twitter: @sqlchick
Ad Hoc Analysis of Big Data Visualization
 Ad Hoc Analysis of Big Data Visualization Dean Yao Director of Marketing Greg Harris Systems Engineer Follow us @Jinfonet #BigDataWebinar JReport Highlights Advanced, Embedded Data Visualization Platform:
Microsoft Visio 2010 Business Intelligence
 Microsoft Visio 2010 Business Intelligence St. Louis SharePoint User Group Candy Parisi Microsoft Visio Solution Specialist April 10, 2012 Agenda Microsoft Business Intelligence Overview Visio Business
Big Data Visualization and Dashboards
 Big Data Visualization and Dashboards Boney Pandya Marketing Manager Greg Harris Systems Engineer Follow us @Jinfonet #BigDataWebinar JReport Highlights Advanced, Embedded Data Visualization Platform:
Bring your data to life with Microsoft Power BI. Peter Myers Bitwise Solutions
 Bring your data to life with Microsoft Power BI Peter Myers Bitwise Solutions Presenter introduction Peter Myers Independent BI Expert, Bitwise Solutions BBus, SQL Server MCSE, Data Platform MVP (since
How To Choose A Microsoft Biz (Windows) For Business
 For Business") Data Visualization Choices SQL Saturday #198, Vancouver, BC Paul Turley Mentor, SolidQ SQL Server MVP Presenter Introduction Mentor BI Solution Architect Microsoft certified consultant & trainer Author
Data Visualization Choices SQL Saturday #198, Vancouver, BC Paul Turley Mentor, SolidQ SQL Server MVP Presenter Introduction Mentor BI Solution Architect Microsoft certified consultant & trainer Author
SQL Server 2012 Business Intelligence Boot Camp
 SQL Server 2012 Business Intelligence Boot Camp Length: 5 Days Technology: Microsoft SQL Server 2012 Delivery Method: Instructor-led (classroom) About this Course Data warehousing is a solution organizations
Izenda & SQL Server Reporting Services
 Izenda & SQL Server Reporting Services Comparing an IT-Centric Reporting Tool and a Self-Service Embedded BI Platform vv Izenda & SQL Server Reporting Services The reporting tools that come with the relational
Embedded Analytics & Big Data Visualization in Any App
 Embedded Analytics & Big Data Visualization in Any App Boney Pandya Marketing Manager Greg Harris Systems Engineer Follow us @Jinfonet Our Mission Simplify the Complexity of Reporting and Visualization
Power BI Dashboarding. Alberto Ferrari SQLBI. www.sqlbi.com
 Media Partners Power BI Dashboarding Alberto Ferrari SQLBI www.sqlbi.com Alberto Ferrari BI Expert and Consultant Founder of www.sqlbi.com Problem Solving Complex Project Assistance Data Warehouse Assessments
SharePoint BI. Grace Ahn, Design Architect at AOS
 SharePoint BI Grace Ahn, Design Architect at AOS 1 SharePoint Saturday St. Louis 2015 Session Evaluations Schedule and evaluate each session you attend via our mobile app that can be used across devices
The Homebuilder Intelligence Suite
 The Homebuilder Intelligence Suite informxl is a comprehensive reporting suite providing builders with better data insight for more intelligent and informed decisions. Summary to detail, desktop to mobile,
Business Intelligence in Excel 2013 Excel, PowerPivot and Power View. Stéphane Fréchette Friday April 26, 2013
 Business Intelligence in Excel 2013 Excel, PowerPivot and Power View Stéphane Fréchette Friday April 26, 2013 Who am I? My name is Stéphane Fréchette I m a Database & Business Intelligence Professional
Embedding Customized Data Visualization and Analysis
 Embedding Customized Data Visualization and Analysis Boney Pandya Marketing Manager Leo Zhao Systems Engineer Follow us @Jinfonet JReport Highlights Advanced, Embedded Data Visualization Platform: High
Geo Analysis, Visualization and Performance with JReport 13
 Geo Analysis, Visualization and Performance with JReport 13 Boney Pandya Marketing Manager Leo Zhao Systems Engineer Follow us @Jinfonet JReport Highlights Advanced, Embedded Data Visualization Platform:
Data Visualization Choices
 Data Visualization Choices What, When, and How? Paul Turley Mentor, SolidQ SQL Server MVP April 10-12 Chicago, IL Please silence cell phones April 10-12 Chicago, IL Presenter Introduction Mentor BI Solution
Deploy. Friction-free self-service BI solutions for everyone Scalable analytics on a modern architecture
 Friction-free self-service BI solutions for everyone Scalable analytics on a modern architecture Apps and data source extensions with APIs Future white label, embed or integrate Power BI Deploy Intelligent
Big Data Visualization with JReport
 Big Data Visualization with JReport Dean Yao Director of Marketing Greg Harris Systems Engineer Next Generation BI Visualization JReport is an advanced BI visualization platform: Faster, scalable reports,
Business Intelligence Using SharePoint 2013 and Office365
 Business Intelligence Using SharePoint 2013 and Office365 Firdouz Hussain Shaik Trigent Software Introduction Many successful companies have been investing large sums of money in business intelligence
Insights for SharePoint 2013 INTRODUCTION TO THE BI TOOLS
 Insights for SharePoint 2013 INTRODUCTION TO THE BI TOOLS Webinar Topics Intro to BI Tools What is SharePoint? What is Business Intelligence? Evolution of Business Intelligence Common Challenges of BI
How To Extend An Enterprise Bio Solution
 Course 20467C: Designing Self-Service Business Intelligence and Big Data Solutions Module 1: Introduction to Self-Service Business Intelligence This module introduces self-service BI. Extending Enterprise
Visualizing PI System Data with Dashboards and Reports
 Visualizing PI System Data with Dashboards and Reports Presented by Brandon Perry OSIsoft Experience COLLECT HISTORIZE FIND ANALYZE DELIVER VISUALIZE What s New with Visualization in PI System 2010? Excel
PBI365: Data Analytics and Reporting with Power BI
 POWER BI FOR BUSINESS ANALYSTS AND POWER USERS 3 DAYS PBI365: Data Analytics and Reporting with Power BI AUDIENCE FORMAT COURSE DESCRIPTION Business Analysts, Statisticians and Data Scientists Instructor-led
Big Data Analytics with PowerPivot and Power View
 Big Data Analytics with PowerPivot and Power View Peter Myers Global Sponsors: Presenter Introduction Peter Myers BI Expert BBus,MCSE, MCT, SQL Server MVP 15 years of experience designing, developing and
The Brave New World of Power BI and Hybrid Cloud
 The Brave New World of Power BI and Hybrid Cloud [email protected] 27 th August 2015 Agenda Intro Session Goals Short History Lesson Overview of Power BI Components + Demos Transitioning and Future
Implementing Data Models and Reports with Microsoft SQL Server
 Course 20466C: Implementing Data Models and Reports with Microsoft SQL Server Course Details Course Outline Module 1: Introduction to Business Intelligence and Data Modeling As a SQL Server database professional,
Designing Self-Service Business Intelligence and Big Data Solutions
 This five-day instructor-led course teaches students how to implement self-service Business Intelligence (BI) and Big Data analysis solutions using the Microsoft data platform. The course discusses the
SBI2013: Building BI Solutions using Excel and SharePoint 2013
 UNDERSTANDING MICROSOFT'S BI TOOLSET 3 DAYS SBI2013: Building BI Solutions using Excel and AUDIENCE FORMAT COURSE DESCRIPTION Business Analysts and Excel Power Users Instructor-led training with hands-on
Analyze This! Get Better Insight with Power BI for Office 365
 11:15 12:15 Analyze This! Get Better Insight with Power BI for Office 365 Jeff Fenn, BI & Development Practice Manager FMT Consultants Agenda Agile BI Self-Service BI in Excel Power BI for Office 365 Infrastructure
DEMYSTIFYING THE CLOUD
 DEMYSTIFYING THE CLOUD GETTING THE MOST OUT OF OFFICE 365 & WINDOWS AZURE Pete Lee Michael Lee Aaron Saposnik Rachael Narel Agenda SWC Introduction Cloud Definition & Market Overview Solutions and Demos
SAP BusinessObjects BI Clients
 SAP BusinessObjects BI Clients April 2015 Customer Use this title slide only with an image BI Use Cases High Level View Agility Data Discovery Analyze and visualize data from multiple sources Data analysis
Business Benefits From Microsoft SQL Server Business Intelligence Solutions How Can Business Intelligence Help You? PTR Associates Limited
 Business Benefits From Microsoft SQL Server Business Intelligence Solutions How Can Business Intelligence Help You? www.ptr.co.uk Business Benefits From Microsoft SQL Server Business Intelligence (September
MicroStrategy Course Catalog
 MicroStrategy Course Catalog 1 microstrategy.com/education 3 MicroStrategy course matrix 4 MicroStrategy 9 8 MicroStrategy 10 table of contents MicroStrategy course matrix MICROSTRATEGY 9 MICROSTRATEGY
How SAP Business Intelligence Solutions provide real-time insight into your organization
 How SAP Business Intelligence Solutions provide real-time insight into your organization 28 Oct 2015 Agenda 1) What is Business Intelligence (BI) 2) SAP BusinessObjects Features Overview 3) Demo & Report
LEARNING SOLUTIONS website milner.com/learning email [email protected] phone 800 875 5042
 Course 20467A: Designing Business Intelligence Solutions with Microsoft SQL Server 2012 Length: 5 Days Published: December 21, 2012 Language(s): English Audience(s): IT Professionals Overview Level: 300
Melissa Coates. Tools & Techniques for Implementing Corporate and Self-Service BI. Triad SQL BI User Group 6/25/2013. BI Architect, Intellinet
 Tools & Techniques for Implementing Corporate and Self-Service BI Triad SQL BI User Group 6/25/2013 Melissa Coates BI Architect, Intellinet Blog: sqlchick.com Twitter: @sqlchick About Melissa Business
Common Situations. Departments choosing best in class solutions for their specific needs. Lack of coordinated BI strategy across the enterprise
 Common Situations Lack of coordinated BI strategy across the enterprise Departments choosing best in class solutions for their specific needs Acquisitions of companies using different BI tools 2 3-5 BI
The Right BI Tool for the Job in a non- SAP Applica9on Environment
 September 9 11, 2013 Anaheim, California The Right BI Tool for the Job in a non- SAP Applica9on Environment Speaker Name(s): Ty Miller Full Spectrum Business Intelligence Self Service Dashboards and Apps
The Webcast will begin at 1:00pm EST. www.gig-werks.com
 Power Business Intelligence for SharePoint Online and Office 365 The Webcast will begin at 1:00pm EST Today s Presentation: Introduction & About Gig Werks Gig Werks Experience with SharePoint & Business
Power BI overview. Josh Condie Partner Technology Strategist, TS2 Microsoft SMB&D
 Power BI overview Josh Condie Partner Technology Strategist, TS2 Microsoft SMB&D Unlock insights on any data Power BI overview Turning data into a business advantage The world of data is changing A powerful
Managing the PowerPivot for SharePoint Environment
 Managing the PowerPivot for SharePoint Environment Melissa Coates Blog: sqlchick.com Twitter: @sqlchick SharePoint Saturday 3/16/2013 About Melissa Business Intelligence & Data Warehousing Developer Architect
Reporting Fundamentals for Programmers
 Reporting Fundamentals for Programmers FOR MICROSOFT DYNAMICS AX 2012 R3 Atlanta I Denver I San Francisco I St. Louis I Toronto Key Data 3 Look and Feel 3 Audience 3 Prerequisites 4 Students 4 Environment
Course 20467: Designing Self-Service Business Intelligence and Big Data Solutions
 Course 20467: Designing Self-Service Business Intelligence and Big Data Solutions Type:Course Audience(s):IT Professionals Technology:Microsoft SQL Server Level:300 This Revision:C Delivery method: Instructor-led
ArcGIS Platform. An Integrated System. Portal
 Platform An Integrated System Portal An Integrated Web GIS Platform Knowledge Workers Executive Access Public Engagement Work Anywhere Enterprise Integration Providing Mapping, Analysis, Data Management,
Microsoft Power BI. Nov 21, 2015
 Nov 21, 2015 Microsoft Power BI Biray Giray Practice Lead - Enterprise Architecture, Collaboration, ECM, Information Architecture and Governance getalbert.ca [email protected] Michael McKiernan
Maximising value through business insight. Business Intelligence White Paper
 Maximising value through business insight Business Intelligence White Paper October 2015 CONTENTS Reports were tedious. Earlier it would take days for manual collation. Now all this is available at the
[email protected] João Diogo Almeida Premier Field Engineer Microsoft Corporation
 [email protected] João Diogo Almeida Premier Field Engineer Microsoft Corporation Reporting Services Overview SSRS Architecture SSRS Configuration Reporting Services Authoring Report Builder Report
DASHBOARDS. How to Choose Which Microsoft BI Tool? SQL Saturday Jacksonville 4/27/2013. Melissa Coates Blog: www.sqlchick.com Twitter: @sqlchick
 DASHBOARDS How to Choose Which Microsoft BI Tool? SQL Saturday Jacksonville 4/27/2013 Melissa Coates Blog: www.sqlchick.com Twitter: @sqlchick About Melissa Business Intelligence developer based in Charlotte,
Please contact Cyber and Technology Training at (410)777-1333/[email protected] for registration and pricing information.
777-1333/technologytraining@aacc.edu for registration and pricing information.") Course Name Start Date End Date Start Time End Time Active Directory Services with Windows Server 8/31/2015 9/4/2015 9:00 AM 5:00 PM Active Directory Services with Windows Server 9/28/2015 10/2/2015 9:00
Course Name Start Date End Date Start Time End Time Active Directory Services with Windows Server 8/31/2015 9/4/2015 9:00 AM 5:00 PM Active Directory Services with Windows Server 9/28/2015 10/2/2015 9:00
MS 20467: Designing Business Intelligence Solutions with Microsoft SQL Server 2012
 MS 20467: Designing Business Intelligence Solutions with Microsoft SQL Server 2012 Description: This five-day instructor-led course teaches students how to design and implement a BI infrastructure. The
Microsoft End to End Business Intelligence Boot Camp
 Microsoft End to End Business Intelligence Boot Camp Längd: 5 Days Kurskod: M55045 Sammanfattning: This five-day instructor-led course is a complete high-level tour of the Microsoft Business Intelligence
Introducing the Reimagined Power BI Platform. Jen Underwood, Microsoft
 Introducing the Reimagined Power BI Platform Jen Underwood, Microsoft Thank You Sponsors Empower users with new insights through familiar tools while balancing the need for IT to monitor and manage user
TF04 - Leveraging SQL Server Business Intelligence Tools
 TF04 - Leveraging SQL Server Business Intelligence Tools PUBLIC INFORMATION Copyright 2014 Rockwell Automation, Inc. All Rights Reserved. Le Roy Howe Commercial Engineering PUBLIC INFORMATION Follow RSTechED
SAP BusinessObjects Business Intelligence 4.1 One Strategy for Enterprise BI. May 2013
 SAP BusinessObjects Business Intelligence 4.1 One Strategy for Enterprise BI May 2013 SAP s Strategic Focus on Business Intelligence Core Self-service Mobile Extreme Social Core for innovation Complete
Microsoft Dynamics NAV
 Microsoft Dynamics NAV Maximising value through business insight Business Intelligence White Paper October 2015 CONTENTS Reports were tedious. Earlier it would take days for manual collation. Now all this
Updating Your Microsoft SQL Server 2008 BI Skills to SQL Server 2008 R2
 Course 10337A: Updating Your Microsoft SQL Server 2008 BI Skills to SQL Server 2008 R2 OVERVIEW About this Course This 3 day ILT course focuses on the new features SQL Server 2008 R2 for BI specialists
<Insert Picture Here> Oracle BI Standard Edition One The Right BI Foundation for the Emerging Enterprise
 Oracle BI Standard Edition One The Right BI Foundation for the Emerging Enterprise Business Intelligence is the #1 Priority the most important technology in 2007 is business intelligence
A Comprehensive Review of Self-Service Data Visualization in MicroStrategy. Vijay Anand January 28, 2014
 A Comprehensive Review of Self-Service Data Visualization in MicroStrategy Vijay Anand January 28, 2014 Speaker Bio Vijay Anand Product Manager Vijay Anand is a Product Manager for Self-Service and High
MOC 55072 Visualizing Data with SharePoint 2013, Report Builder, PowerPivot & PowerView with NO CODE
 To register or for more information call our office (208) 898-9036 or email [email protected] MOC 55072 Visualizing Data with SharePoint 2013, Report Builder, PowerPivot & PowerView with NO
Designing Business Intelligence Solutions with Microsoft SQL Server 2012 Course 20467A; 5 Days
 Lincoln Land Community College Capital City Training Center 130 West Mason Springfield, IL 62702 217-782-7436 www.llcc.edu/cctc Designing Business Intelligence Solutions with Microsoft SQL Server 2012
Business Intelligence mit SAP: Strategie, Neuerungen, Nutzen. Andreas Forster / Solution Advisor June 2013
 Business Intelligence mit SAP: Strategie, Neuerungen, Nutzen Andreas Forster / Solution Advisor June 2013 Agenda SAP Business Intelligence Vision SAP BusinessObjects Suite SAP BusinessObjects BI and SAP
Selecting the Right SAP BusinessObjects BI Client Product based on your business requirements for SAP BW Customers
 Selecting the Right SAP BusinessObjects BI Client Product based on your business requirements for SAP BW Customers Ingo Hilgefort Director Solution Management Disclaimer This presentation outlines our
Implementing Data Models and Reports with Microsoft SQL Server 20466C; 5 Days
 Lincoln Land Community College Capital City Training Center 130 West Mason Springfield, IL 62702 217-782-7436 www.llcc.edu/cctc Implementing Data Models and Reports with Microsoft SQL Server 20466C; 5
Microsoft Dynamics NAV Reporting Options. Derek Lamb May 2010
 Microsoft Dynamics NAV Reporting Options Derek Lamb May 2010 Agenda Positioning of Products Why Business Intelligence? Intergen Offerings Reporting Services Power Pivot ZAP SharePoint 2010 Questions Choosing
NZ BI User Group Auckland 18 September, 2013. Big Data Analytics with PowerPivot and Power View
 NZ BI User Group Auckland 18 September, 2013 Big Data Analytics with PowerPivot and Power View Presenter Introduction Peter Myers BI Expert Bitwise Solutions BBus, SQL Server MCSE, MCT, SQL Server MVP
Business Intelligence with Excel Excel new features for reporting and data analysis
 Business Intelligence with Excel Excel new features for reporting and data analysis Hi Dears, Greetings from EXCELGENIUSES!!! EXCELGENIUSES Invites you to attend Advanced Excel 2013 with Power BI INTEGRATION
Petroleum Web Applications to Support your Business. David Jacob & Vanessa Ramirez Esri Natural Resources Team
 Petroleum Web Applications to Support your Business David Jacob & Vanessa Ramirez Esri Natural Resources Team Agenda Petroleum Web Apps to Support your Business The ArcGIS Location Platform Introduction
Visualizing PI System Data with Dashboards and Reports
 Visualizing PI System Data with Dashboards and Reports Presented by Laurie Dieffenbach Product Manager Experience COLLECT HISTORIZE FIND ANALYZE DELIVER VISUALIZE What s New with Visualization in PI System
SQL Server 2005 Reporting Services (SSRS)
") SQL Server 2005 Reporting Services (SSRS) Author: Alex Payne and Brian Welcker Published: May 2005 Summary: SQL Server 2005 Reporting Services is a key component of SQL Server 2005. Reporting Services
SQL Server 2005 Reporting Services (SSRS) Author: Alex Payne and Brian Welcker Published: May 2005 Summary: SQL Server 2005 Reporting Services is a key component of SQL Server 2005. Reporting Services
T40 - Mobility and Portability with Today s Rockwell Software
 T40 - Mobility and Portability with Today s Rockwell Software PUBLIC PUBLIC - 5058-CO900G 2 Agenda What is Mobile? Why Mobile? Current Solutions What We re Working On Market Trends in Mobility Growth of
MS-10337 - Updating your Microsoft SQL Server 2008 BI Skills to SQL Server 2008 R2
 MS-10337 - Updating your Microsoft SQL Server 2008 BI Skills to SQL Server 2008 R2 Table of Contents Introduction Audience At Course Completion Prerequisites Microsoft Certified Professional Exams Student
CRGroup Whitepaper: Digging through the Data. www.crgroup.com. Reporting Options in Microsoft Dynamics GP
 CRGroup Whitepaper: Digging through the Data Reporting Options in Microsoft Dynamics GP The objective of this paper is to provide greater insight on each of the reporting options available to you within
Building a BI Solution in the Cloud
 Building a BI Solution in the Cloud Stacia Varga, Principal Consultant Email: [email protected] Twitter: @_StaciaV_ 2 SQLSaturday #467 Sponsors Stacia (Misner) Varga Over 30 years of IT experience,
Building Your Company s Data Visualization Strategy
 Building Your Company s Data Visualization Strategy Ian Mayor SAP BI Product Strategy Session 0702 2014 SAP AG or an SAP affiliate company. All rights reserved. Public 1 Legal disclaimer The information
SAP Lumira Cloud: True Self-Service BI Without The Server
 September 9 11, 2013 Anaheim, California SAP Lumira Cloud: True Self-Service BI Without The Server Ashish Morzaria, SAP Christina Obry, SAP Learning Points How to enable self-service BI using Lumira on
GUIDE TO ENTERPRISE OFFICE 365 PLANS
 GUIDE TO ENTERPRISE OFFICE 365 PLANS ALL OFFICE 365 PLANS IN THIS GUIDE INCLUDE THE BELOW: Guaranteed 99.9% uptime, financially backed service level agreement. IT-Level web support & 24/7 phone support
Updating Your SQL Server Skills to Microsoft SQL Server 2014
 Course 10977A: Updating Your SQL Server Skills to Microsoft SQL Server 2014 Course Details Course Outline Module 1: Introduction to SQL Server 2014 This module introduces key features of SQL Server 2014.
Bringing Big Data to People
 Bringing Big Data to People Microsoft s modern data platform SQL Server 2014 Analytics Platform System Microsoft Azure HDInsight Data Platform Everyone should have access to the data they need. Process
Microsoft 20466 - Implementing Data Models and Reports with Microsoft SQL Server
 1800 ULEARN (853 276) www.ddls.com.au Microsoft 20466 - Implementing Data Models and Reports with Microsoft SQL Server Length 5 days Price $4070.00 (inc GST) Version C Overview The focus of this five-day
COURSE SYLLABUS COURSE TITLE:
 1 COURSE SYLLABUS COURSE TITLE: FORMAT: CERTIFICATION EXAMS: 55043AC Microsoft End to End Business Intelligence Boot Camp Instructor-led None This course syllabus should be used to determine whether the
self-service business intelligence synergies with microsoft powerpivot
 self-service business intelligence synergies with microsoft powerpivot AUTHOR Derek Comingore PUBLISHED August 2010 Contents Introduction... 2 Tableau Software Overview... 3 Microsoft PowerPivot Overview...
SAP BusinessObjects BI Clients. January 2016
 SAP BusinessObjects BI Clients January 2016 SAP Analytics and BI Strategy SAP Analytics Strategy SAP Cloud for Analytics Provide new SaaS Analytics capabilities All analytics capabilities in one product
Collaboration. Michael McCabe Information Architect [email protected]. black and white solutions for a grey world
 Collaboration Michael McCabe Information Architect [email protected] black and white solutions for a grey world Slide Deck & Webcast Recording links Questions and Answers We will answer questions at
Extend the value of Microsoft Dynamics ERP with other technology innovations from Microsoft
 Extend the value of Microsoft Dynamics ERP with other technology innovations from Microsoft Combined with these products and technologies, Microsoft Dynamics ERP solutions can help you gain momentum in
Maximizing the Data Exploration Capabilities of Power View. Melissa Coates. SQL Saturday Kalamazoo 11/2/2013. BI Architect, BlueGranite
 Maximizing the Data Exploration Capabilities of Power View SQL Saturday Kalamazoo 11/2/2013 Melissa Coates BI Architect, BlueGranite Blog: sqlchick.com Twitter: @sqlchick Melissa Coates Business Intelligence
An Evaluation of No-Cost Business Intelligence Tools. Claire Walsh. Contact: [email protected] @datanurturer 703-840-8600
 An Evaluation of No-Cost Business Intelligence Tools Contact: Claire Walsh [email protected] @datanurturer 703-840-8600 1 An Evaluation of No-Cost Business Intelligence Tools Business Intelligence
100% NO CODING NO DEVELOPING IMMEDIATE BUSINESS -25% -70% UNLIMITED SCALABILITY DEVELOPMENT TIME SOFTWARE STABILITY
 100% UNLIMITED SCALABILITY TOTAL COST OF OWNERSHIP -25% +50% EFFICENCY INCREASE -70% +65% DEVELOPMENT TIME SOFTWARE STABILITY NO CODING NO DEVELOPING IMMEDIATE BUSINESS FlexyGo Rapid Application Builder
Building a Reporting and Analytics System Connected Enterprise Seminar
 Manufacturing Intelligence, de stuwende kracht om in een Connected Enterprise snel accurate beslissingen te nemen om de bedrijfsprestaties te optimaliseren. Building a Reporting and Analytics System Connected
MOC 20467B: Designing Business Intelligence Solutions with Microsoft SQL Server 2012
 MOC 20467B: Designing Business Intelligence Solutions with Microsoft SQL Server 2012 Course Overview This course provides students with the knowledge and skills to design business intelligence solutions
MicroStrategy Products
 MicroStrategy Products Bringing MicroStrategy Reporting, Analysis, and Monitoring to Microsoft Excel, PowerPoint, and Word With MicroStrategy Office, business users can create and run MicroStrategy reports