Choosing the right Mobile BI tool: SSRS vs Power BI vs Datazen
|
|
|
- Collin Gordon Lyons
- 9 years ago
- Views:
Transcription
1 Choosing the right Mobile BI tool: SSRS vs Power BI vs Datazen Andrea Martorana


2 Sponsors
3 Organizers getlatestversion.it
4 Analyst/Developer working in IT department of Banco Popolare. I deal with all the application involved in Human Resources management. Main skills and tasks: SQL Server, Oracle, Data Warehouse, Reporting, BI, Analysis Services, C#. MCTS SQL Server 2008 Developer. Author on sqlservercentral.com

5 Agenda Mobile Business Intelligence - before Summit 2015 Microsoft's reporting New Age: towards integration SS Reporting Services Datazen Power BI Choosing the right tool Conclusions

6 Mobile Business Intelligence tools Up to PASS Summit 2015, Microsoft's BI stack for mobile reporting was made up of three different tools partially overlapping: - Reporting Services (yes, it can!) - Datazen - Power BI

7 Microsoft's New Age for Reporting During PASS Summit 2015, Microsoft announced its strategy to harmonize reporting content types across platforms and systems. Data is coming at us from every direction. From traditional sources onpremises enterprise applications and databases. From sources developed over the last decade websites, mobile applications, social media and SaaS business applications we are aligning our cloud and on-premises solutions. It is our intent that your reporting technology investments and expertise will transfer across these deployment modalities so you can easily mix and match onpremises and cloud components, and benefit from our unique hybrid scenarios. (Microsoft Business Intelligence our reporting roadmap

8 Microsoft's New Age for Reporting New Microsoft's approach distinguishes four types of reports, based on production technology and delivery method: Paginated Report. Standard report type, with many elements and complex business logic. Built with Report Builder or SSDT (Visual Studio). Interactive Report. Allows dynamic and interactive view. Built with Power BI Desktop. Mobile Report. Specially optimized for mobile devices with simple logic and few elements. Built with Datazen. Analytical reports and charts. Created with Excel directly by end users.

9 Microsoft's New Age for Reporting Unified Mobile BI experience Whether using SQL Server Reporting Services on-premises, Power BI in the cloud, or both as your report delivery solution, we ll have a single mobile application (for each of Windows, ios and Android) for consumption of all report types. At PASS Summit 2015 we demonstrated a single Power BI mobile application delivering a combination of report types from both SQL Server Reporting Services 2016 and the Power BI service. All of your BI content will be at your fingertips from within a single, unified mobile app to deliver insights any way, anywhere and from any device.... (Microsoft Business Intelligence our reporting roadmap

10 Towards Integration From parallel convergences To integration

.")

11 What's new for SSRS 2016 (1) The 2016 release for Reporting Services provides full support for onpremises and mobile reports, hosting contents from SSRS, Datazen, Excel and Power BI (future development). The web site has been totally rivisited allowing users to access both paginated and mobile reports in one centralized location. Datazen Engine will be totally merged into Reporting Services. No more need for a dedicated server to publish its own reports. From Report Manager To modern integrated platform

12 What's new for SSRS 2016 (2) Some other cool features are expected. Microsof aims to bring Reporting Services to new life and modernize it, in order to make SSRS the central repository for on-premises development (versus using Power BI in the cloud). HTML engine was completely rewritten to HTML5, to support every modern browser on every device.
.")
13 What's new for SSRS 2016 (3) Report parameters can be moved anywhere in any order on the design surface.

14 What's new for SSRS 2016 (4) Unique release for SSDT, that includes BI tools, too. Export reports to PowerPoint format Print reports directly from the browser (without installing an ActiveX control).

15 What's new for SSRS 2016 (5) Two new charts: sunburst and treemap

16 What's new for SSRS 2016 (6) Pin charts to Power BI dashboards (currently available as CTP 3).

17 What's new for Power BI In the view of integration, Microsoft announced some improvements in Power BI, to be released on a weekly basis: DirectQuery and live data sources to SQL Server, Azure SQL Database and Azure SQL Data Warehouse, SSAS Enterprise Gateway for on premises direct data connection Power BI mobile app integration to display new SSRS mobile reports as well PowerBI.com dashboard tiles interactivity, to pin entire reports as well as just individual components to them Embedding ranges and charts as well as 3D maps from Excel workbooks into PowerBI.com reports Personalized Visuals developed directly from users Globe Map (not the same as Excel Power Map)


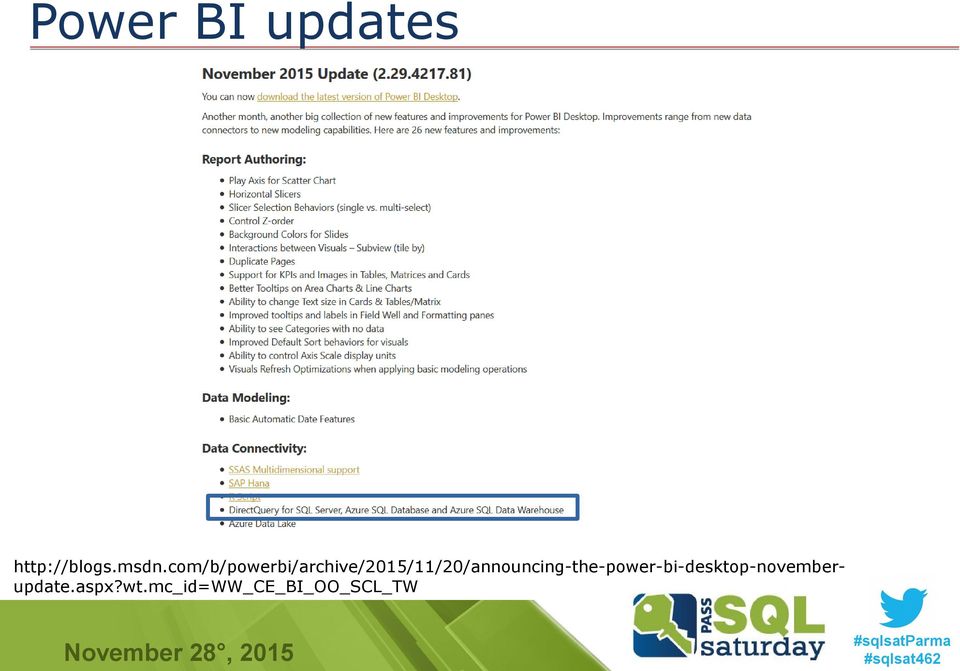
18 Power BI updates Source: Power BI Blog

19 Power BI updates
20 So where does that leave us? The solution is an hybrid approach to mix the needs coming from a big data world where data live in many locations and can be gathered in different ways.

21 So where does that leave us? With the new scenario arriving, how do all the components are positioned? Reporting Services: paginated, on-premises reports with high interactivity and complex business logic. Fitted for local and distribuited Corporate BI Datazen: mobile, on-premises dashboard, with high interactivity and few elements. Fitted for distributed mobile Corporate BI Power BI: hybrid reports and dashboards, integrating data from both on-premises, Internet and cloud data sources. Highly customizabile and advanced data shaping. Fitted for Self Service BI, data analyst, and groups collaboration
22 Mobile BI tools Let's step back to present, to discover and explore how we can design and deliver Mobile BI with existing tools.
23 Reporting Services SQL Server Reporting Services (SSRS) to date has focused on paginated reports and offers class-leading capabilities for that format. It does not (so far) support mobile BI natively, but we can build reports in a way that make them suitable to mobile devices (smartphone and tablets). You create reports using Report Builder and Report Designer in SQL Server Data Tools.
24 Reporting Services architecture
25 Reporting Services How to develop SSRS reports for mobile supports (1/3): Set report dimensions based on screen's device width and height Every report is suited fon one single device
26 Reporting Services How to develop SSRS reports for mobile supports (2/3): Simplicity is the best rule. Less is better than more If necessary, break a single complex report into several separate reports and set navigation Connect to report calling direct URL rather then using Report Manager. Example: Hide toolbars and other infrastructure elements. For instance, to the url you can add rc:toolbar=false Make the data readable without zooming Security and profiling settings are inherited from Report Server
27 Reporting Services How to develop SSRS reports for mobile supports (3/3): Add touch interactivity based on SSRS standard features: Sorting Collapsing and expanding report item with (+) Selecting and setting parameters values by tapping (exploit the Action property of most objects inside the report) Navigating inside the report or among different reports
28 DEMO Reporting Services Smartphone sqlservervmamt.cloudapp.net/reportserver/pages/reportviewer.aspx?%2fsqlsat462%2fiphone&rs:command=render&rc:toolbar=false Tablet sqlservervmamt.cloudapp.net/reportserver/pages/reportviewer.aspx?%2fsqlsat462%2ftablet&rs:command=render&rc:toolbar=false User: SQLSat462 password: SQLSaturday462
29 Reporting Services pro & cons Why use Reporting Service for mobile BI Why not use Reporting Services for mobile BI Low learning path Standard features can be reused Higly customizable. Can add complex business logic Full control on every object (visibility, behavior, action, ecc. Reports must be adapted to mobile. Must develop as many reports as many devices and sizes. Every change must be replicated many times Tricky navigation tecnique. Reports may be complex to create and mantain Page refresh can be long and tedious Part of Microsoft BI suite. Natively integrated into SQL Server Corporate integrated security and profiling Few data sources available No data modeling allowed Free Need IT professional to set up and develop
30 Datazen Reporting tool focused mainly on develop and delivery for mobile BI. It became available to SQL Server's users on April 2015, since Microsoft acquired the company. With Datazen developers can easily realize reports, dashboards and KPIs and publish immediately on every device included mobile. Product keywords are: quickness and simpleness. It integrates natively with SQL Server databases and Microsoft's security infrastucture.
31 Datazen features Datazen key features are: Unified dashboards designer for any visualization Build rich interactive visualizations KPI repository Native apps for all mobile platforms (Windows, ios, Android) Direct browser access via HTML5 rendering Team collaboration Custom branding Native connection to cloud & enterprise data sources (SQL Server, Analysis Services, Azure, ODBC, ) Advanced and integrated security Server side data caching for performance improvement Client side data caching for offline access Last but not least It's free! At least if you use SQL Server Enterprise Edition with Software Assurance
32 Datazen architecture Datazen is based on a client-server architecture. Datazen Enterprise Server is the core application. It is installed on a Windows Server, is integrated with the existing security infrastructure and connected to all relevant data sources. (
33 Datazen delivery model Dashboards are built locally on developer's pc and published on the server using the Datazen Publisher app. Contents are accessed via the mobile clients and web browsers which connect to Datazen Server securely and don't need direct access to the rest of the IT environment. (
34 DEMO Datazen Download the app! Connect to server: datazenvmamt.cloudapp.net Username : SQLSat462 pwd: SQLSaturday462 Via browser go to the url: Username: SQLSat462 pwd: SQLSaturday462
35 Datazen pro & cons Why use Datazen for mobile BI It is made to this. Fits natively for every device Why not use Datazen for mobile BI Simple business logic No objects behavior personalization Rapid dashboards creation and development Simple navigation Needs a app to be executed Easy delivery method Windows 7 Publisher with bugs Many data sources available Corporate security and profiling. Active Directory authentication Free for users with SQL Server Enterprise release Low learning path Need IT professional to set up and configure Server Core application No data manipulation allowed. Query must be prepared in advance Little volumes of data
36 Power BI Power BI is the new cloud-based business analytics service that helps create live operational dashboards from onpremises and cloud data in one central location that you can access across a range of devices. With Power BI, users can easily retrieve data from different data sources; explore, analyze, combine e model data, create reports or dashboards to share with others.
37 Power BI features Power BI combines several components. Some were already released as add-in for Microsoft Excel: Power Query: connect to data sources and easily shape and transform data Power Pivot: in memory data blending and modelling tool Power View: data visualization Power Map: 3D Geo-spatial data visualization Besides the above, other components are present to build the complete infrastucture: Power Q&A: engine for answering to questions put in natural language Power BI Desktop. Authoring tool for local development Personal & Enterprise Gateway, to connect to on-premises data Mobile Apps (for Windows phone, ios, Android).
38 Power BI features A plethora of data sources available. Retrieve data from on-line, onpremises or cloud-based sources and services No dependency on IT to retrieve and process data Graphic interfaces to model and analyze data, set relationships, add measures and calculated columns. Tailored to self-service BI Need a enterprise account (no [email protected]!) Data Catalog, to share and reuse queries between users Groups, content packs, and other collaborative features Visuals custom gallery, made directly by users and freely available Q&A in natural language Delivery model: mobile apps for Windows phone, Android, ios. Online web site REST API to access and consume objects Two license options: Free (with some limitations) and Pro
39 Power BI features How many Connectors can you count? 46 (til now...)
40 Power BI features Visualize your data, your way using custom visuals in Power BI The Power BI visuals gallery: a community site (visuals.powerbi.com) that allows creators to upload new Power BI visuals and for users to browse, select and download those visuals. Power BI developer tools: With our developer tools every web developer can code, test and package new visuals directly in the Power BI service to be loaded to the gallery.
41 Power BI features Mobile app landscape mode Just released! Landscape mode allows users to view and navigate dashboards in the same way as they do in the Power BI web app.
42 Power BI architecture Three basic objects type: Datasets: collection of data (tables). All tables of in a dataset can be completed with relationships, measures, calculated columns, etc. Reports: visualization tools arranged on a page Dashboards: collections of tiles pinned from reports.
43 Power BI architecture
44 Power BI updates Direct Query November new Usually, in Power BI Desktop, when you connect to a data source, data are imported into the Power BI Desktop. For some data sources, an alternative approach is available: connect directly to the data source using DirectQuery. Direct Query queries directly you underlying data without import them. The following data sources are currently supported: - SQL Server - Azure SQL Database Azure SQL Data Warehouse SAP HANA (preview)
45 Power BI prices Free vs Pro subscription
46 DEMO Power BI Have you got an account?
47 Power BI pro & cons Why use Power BI for mobile BI Fits perfectely on every device Lots of data sources both on-premises and on-line Advanced data modeling and manipulation (Power Query, M language) Simple report and dashboards creation and development User custom visuals Easy delivery method Why not use Power BI for mobile BI Cloud service No easy manual settings for groups collaboration and content packs creation No real time access to data (partially resolved). It needs a Gateway anymore Needs a app and a login to be executed Cost (9,99$ month/user) Suitable for expert users to perform Self Service Analysis. No need for IT professionals. Developer API
48 Conclusions: choosing the right tool There isn't one tool that fulfils every requirement. The choice depends on your expectations, your needs and your organization's infrastructure. If you are... A company that needs to distribute reports and analytics to a medium number of users, with complex business logic and drill down capabilities. A company that needs to distribute summary reports and dashboards to a small number of users with some metrics clearly visible. Then you should use... Then you should use... A company, an individual, a small group of users who need to compare data from many sources, analyze data, manipulate data, build custom visualizations of data, share them with other user and draw a synthesis from data. Then you should use...
49 Conclusions: what is best for... IT (low) requirements Keep data on-premises Data sources and connections availability Data volumes > records Security, authentication and profiling Querying transforming and formatting data Retrieving data from multiple sources even on the web Report authoring easiness and quickness Delivery model and mobile fruiction Off line access
50 Conclusions: what is the best for... Navigability and drill-down KPI repository Self service analytics and data discovery Mapping Customization and branding Collaborative features; groups, sharing... Subscriptions Cost
51 Resources /microsoft-business-intelligence-our-reporting-roadmap.aspx 8/sql-server-2016-community-technology-preview-3-0-is-available. aspx orting-services-charts-to-power-bi-dashboards-with-sql-server ctp-3-0.aspx eports-in-sql-2016-an-faq-on-what-it-means-for-you/ -of-reporting-services-the-maturing-of-power-bi/
52 Q&A Questions?
53 THANKS!
SQL Server 2016 BI Any Data, Anytime, Anywhere. Phua Chiu Kiang PCK CONSULTING MVP (Data Platform)
") SQL Server 2016 BI Any Data, Anytime, Anywhere Phua Chiu Kiang PCK CONSULTING MVP (Data Platform) SQL Server 2016 Pin paginated report items to Power BI dashboards Visualization Mobile and paginated reports
SQL Server 2016 BI Any Data, Anytime, Anywhere Phua Chiu Kiang PCK CONSULTING MVP (Data Platform) SQL Server 2016 Pin paginated report items to Power BI dashboards Visualization Mobile and paginated reports
Building a BI Solution in the Cloud
 Building a BI Solution in the Cloud Stacia Varga, Principal Consultant Email: [email protected] Twitter: @_StaciaV_ 2 SQLSaturday #467 Sponsors Stacia (Misner) Varga Over 30 years of IT experience,
The Brave New World of Power BI and Hybrid Cloud
 The Brave New World of Power BI and Hybrid Cloud [email protected] 27 th August 2015 Agenda Intro Session Goals Short History Lesson Overview of Power BI Components + Demos Transitioning and Future
Power BI as a Self-Service BI Platform:
 Power BI as a Self-Service BI Platform: Architecture, Use Cases, Strengths & Shortcomings SQL Saturday Atlanta 5/16/2015 Melissa Coates Solution Architect, BlueGranite Blog: sqlchick.com Twitter: @sqlchick
Power BI Dashboarding. Alberto Ferrari SQLBI. www.sqlbi.com
 Media Partners Power BI Dashboarding Alberto Ferrari SQLBI www.sqlbi.com Alberto Ferrari BI Expert and Consultant Founder of www.sqlbi.com Problem Solving Complex Project Assistance Data Warehouse Assessments
Bring your data to life with Microsoft Power BI. Peter Myers Bitwise Solutions
 Bring your data to life with Microsoft Power BI Peter Myers Bitwise Solutions Presenter introduction Peter Myers Independent BI Expert, Bitwise Solutions BBus, SQL Server MCSE, Data Platform MVP (since
Deploy. Friction-free self-service BI solutions for everyone Scalable analytics on a modern architecture
 Friction-free self-service BI solutions for everyone Scalable analytics on a modern architecture Apps and data source extensions with APIs Future white label, embed or integrate Power BI Deploy Intelligent
PBI365: Data Analytics and Reporting with Power BI
 POWER BI FOR BUSINESS ANALYSTS AND POWER USERS 3 DAYS PBI365: Data Analytics and Reporting with Power BI AUDIENCE FORMAT COURSE DESCRIPTION Business Analysts, Statisticians and Data Scientists Instructor-led
SBI2013: Building BI Solutions using Excel and SharePoint 2013
 UNDERSTANDING MICROSOFT'S BI TOOLSET 3 DAYS SBI2013: Building BI Solutions using Excel and AUDIENCE FORMAT COURSE DESCRIPTION Business Analysts and Excel Power Users Instructor-led training with hands-on
SharePoint BI. Grace Ahn, Design Architect at AOS
 SharePoint BI Grace Ahn, Design Architect at AOS 1 SharePoint Saturday St. Louis 2015 Session Evaluations Schedule and evaluate each session you attend via our mobile app that can be used across devices
SQL Server 2012 Business Intelligence Boot Camp
 SQL Server 2012 Business Intelligence Boot Camp Length: 5 Days Technology: Microsoft SQL Server 2012 Delivery Method: Instructor-led (classroom) About this Course Data warehousing is a solution organizations
Business Intelligence in SharePoint 2013
 Business Intelligence in SharePoint 2013 Empowering users to change their world Jason Himmelstein, MVP Senior Technical Director, SharePoint @sharepointlhorn http://www.sharepointlonghorn.com Gold Sponsor
Microsoft Power BI. Nov 21, 2015
 Nov 21, 2015 Microsoft Power BI Biray Giray Practice Lead - Enterprise Architecture, Collaboration, ECM, Information Architecture and Governance getalbert.ca [email protected] Michael McKiernan
(55042A) SharePoint 2013 Business Intelligence
 SharePoint 2013 Business Intelligence") (55042A) SharePoint 2013 Business Intelligence OBJECTIVE This three-day instructor-led course provides students with the necessary knowledge to work with all the associated SharePoint business intelligence
(55042A) SharePoint 2013 Business Intelligence OBJECTIVE This three-day instructor-led course provides students with the necessary knowledge to work with all the associated SharePoint business intelligence
The Homebuilder Intelligence Suite
 The Homebuilder Intelligence Suite informxl is a comprehensive reporting suite providing builders with better data insight for more intelligent and informed decisions. Summary to detail, desktop to mobile,
Analyze This! Get Better Insight with Power BI for Office 365
 11:15 12:15 Analyze This! Get Better Insight with Power BI for Office 365 Jeff Fenn, BI & Development Practice Manager FMT Consultants Agenda Agile BI Self-Service BI in Excel Power BI for Office 365 Infrastructure
Implementing Data Models and Reports with Microsoft SQL Server 2012 MOC 10778
 Implementing Data Models and Reports with Microsoft SQL Server 2012 MOC 10778 Course Outline Module 1: Introduction to Business Intelligence and Data Modeling This module provides an introduction to Business
Izenda & SQL Server Reporting Services
 Izenda & SQL Server Reporting Services Comparing an IT-Centric Reporting Tool and a Self-Service Embedded BI Platform vv Izenda & SQL Server Reporting Services The reporting tools that come with the relational
Harnessing the Power of the Microsoft Cloud for Deep Data Analytics
 1 Harnessing the Power of the Microsoft Cloud for Deep Data Analytics Today's Focus How you can operate your business more efficiently and effectively by tapping into Cloud based data analytics solutions
Course: SharePoint 2013 Business Intelligence
 Course: SharePoint 2013 Business Intelligence Course Length: 3 days Course Code: M55042 Description This three-day instructor-led course provides students with the necessary knowledge to work with all
SharePoint 2013 Business Intelligence
 Course 55042A: SharePoint 2013 Business Intelligence Course Details Course Outline Module 1: Course Overview This module explains how the class will be structured and introduces course materials and additional
Implementing Business Intelligence at Indiana University Using Microsoft BI Tools
 HEUG Alliance 2013 Implementing Business Intelligence at Indiana University Using Microsoft BI Tools Session 31537 Presenters: Richard Shepherd BI Initiative Co-Lead Cory Retherford Lead Business Intelligence
Sisense. Product Highlights. www.sisense.com
 Sisense Product Highlights Introduction Sisense is a business intelligence solution that simplifies analytics for complex data by offering an end-to-end platform that lets users easily prepare and analyze
Maximizing the Data Exploration Capabilities of Power View. Melissa Coates. SQL Saturday Kalamazoo 11/2/2013. BI Architect, BlueGranite
 Maximizing the Data Exploration Capabilities of Power View SQL Saturday Kalamazoo 11/2/2013 Melissa Coates BI Architect, BlueGranite Blog: sqlchick.com Twitter: @sqlchick Melissa Coates Business Intelligence
SharePoint 2013 Business Intelligence Course 55042; 3 Days
 Lincoln Land Community College Capital City Training Center 130 West Mason Springfield, IL 62702 217-782-7436 www.llcc.edu/cctc SharePoint 2013 Business Intelligence Course 55042; 3 Days Course Description
Microsoft Dynamics NAV Reporting Options. Derek Lamb May 2010
 Microsoft Dynamics NAV Reporting Options Derek Lamb May 2010 Agenda Positioning of Products Why Business Intelligence? Intergen Offerings Reporting Services Power Pivot ZAP SharePoint 2010 Questions Choosing
Business Benefits From Microsoft SQL Server Business Intelligence Solutions How Can Business Intelligence Help You? PTR Associates Limited
 Business Benefits From Microsoft SQL Server Business Intelligence Solutions How Can Business Intelligence Help You? www.ptr.co.uk Business Benefits From Microsoft SQL Server Business Intelligence (September
SAP BusinessObjects BI Clients. January 2016
 SAP BusinessObjects BI Clients January 2016 SAP Analytics and BI Strategy SAP Analytics Strategy SAP Cloud for Analytics Provide new SaaS Analytics capabilities All analytics capabilities in one product
MicroStrategy Course Catalog
 MicroStrategy Course Catalog 1 microstrategy.com/education 3 MicroStrategy course matrix 4 MicroStrategy 9 8 MicroStrategy 10 table of contents MicroStrategy course matrix MICROSTRATEGY 9 MICROSTRATEGY
SAP BusinessObjects BI Clients
 SAP BusinessObjects BI Clients April 2015 Customer Use this title slide only with an image BI Use Cases High Level View Agility Data Discovery Analyze and visualize data from multiple sources Data analysis
Microsoft Services Exceed your business with Microsoft SharePoint Server 2010
 Microsoft Services Exceed your business with Microsoft SharePoint Server 2010 Business Intelligence Suite Alexandre Mendeiros, SQL Server Premier Field Engineer January 2012 Agenda Microsoft Business Intelligence
Building Dashboards for Real Business Results. Cindi Howson BIScorecard December 11, 2012
 Building Dashboards for Real Business Results Cindi Howson BIScorecard December 11, 2012 Sponsor 2 Speakers Cindi Howson Founder, BIScorecard Mark Gamble Director of Technical Marketing, Actuate Cindi
uncommon thinking ORACLE BUSINESS INTELLIGENCE ENTERPRISE EDITION ONSITE TRAINING OUTLINES
 OBIEE 11G: CREATE ANALYSIS AND DASHBOARDS: 11.1.1.7 DURATION: 4 DAYS Course Description: This course provides step-by-step instructions for creating analyses and dashboards, which compose business intelligence
The focus of this course is on the SharePoint 2013 business intelligence platform and not on the SQL business intelligence services.
 Course Page - Page 1 of 11 SharePoint 2013 Business Intelligence M-55042 Length: 3 days Price: $1,795.00 Course Description This three-day instructor-led course provides students with the necessary knowledge
Using Microsoft Business Intelligence Dashboards and Reports in the Federal Government
 Using Microsoft Business Intelligence Dashboards and Reports in the Federal Government A White Paper on Leveraging Existing Investments in Microsoft Technology for Analytics and Reporting June 2013 Dev
Insights for SharePoint 2013 INTRODUCTION TO THE BI TOOLS
 Insights for SharePoint 2013 INTRODUCTION TO THE BI TOOLS Webinar Topics Intro to BI Tools What is SharePoint? What is Business Intelligence? Evolution of Business Intelligence Common Challenges of BI
Creating Power BI solutions using Power BI Desktop
 Creating Power BI solutions using Power BI Desktop Presented by Ted Pattison About Ted Pattison and Critical Path Training Ted Pattison 25 years as an author, technical trainer & conference speaker Specializing
OpenText Information Hub (ihub) 3.1 and 3.1.1
 3.1 and 3.1.1") OpenText Information Hub (ihub) 3.1 and 3.1.1 OpenText Information Hub (ihub) 3.1.1 meets the growing demand for analytics-powered applications that deliver data and empower employees and customers to
OpenText Information Hub (ihub) 3.1 and 3.1.1 OpenText Information Hub (ihub) 3.1.1 meets the growing demand for analytics-powered applications that deliver data and empower employees and customers to
MOC 20467B: Designing Business Intelligence Solutions with Microsoft SQL Server 2012
 MOC 20467B: Designing Business Intelligence Solutions with Microsoft SQL Server 2012 Course Overview This course provides students with the knowledge and skills to design business intelligence solutions
MS-10337 - Updating your Microsoft SQL Server 2008 BI Skills to SQL Server 2008 R2
 MS-10337 - Updating your Microsoft SQL Server 2008 BI Skills to SQL Server 2008 R2 Table of Contents Introduction Audience At Course Completion Prerequisites Microsoft Certified Professional Exams Student
Portal for ArcGIS. Satish Sankaran Robert Kircher
 Portal for ArcGIS Satish Sankaran Robert Kircher ArcGIS A Complete GIS Data Management Planning & Analysis Field Mobility Operational Awareness Constituent Engagement End to End Integration Collect, Organize,
The Webcast will begin at 1:00pm EST. www.gig-werks.com
 Power Business Intelligence for SharePoint Online and Office 365 The Webcast will begin at 1:00pm EST Today s Presentation: Introduction & About Gig Werks Gig Werks Experience with SharePoint & Business
SQL in the Cloud: Is it Game Changing? V P P r o f e s s i o n a l S e r v i c e s
 SQL in the Cloud: Is it Game Changing? Kevin Carter V P P r o f e s s i o n a l S e r v i c e s AGENDA Azure SQL Power BI Azure SQL History Lesson Exchange in the Cloud 50 million 10% 15% Estimated total
Microsoft Business Intelligence
 Microsoft Business Intelligence P L A T F O R M O V E R V I E W M A R C H 1 8 TH, 2 0 0 9 C H U C K R U S S E L L S E N I O R P A R T N E R C O L L E C T I V E I N T E L L I G E N C E I N C. C R U S S
BI Architecture with SQL 2012 & SharePoint 2010
 BI Architecture with SQL 2012 & SharePoint 2010 Rod Colledge, Principal BI Consultant, StrataDB Global Sponsors: About Rod Colledge Technical Director (Business Intelligence) at StrataDB Based in Brisbane,
Big Data Visualization and Dashboards
 Big Data Visualization and Dashboards Boney Pandya Marketing Manager Greg Harris Systems Engineer Follow us @Jinfonet #BigDataWebinar JReport Highlights Advanced, Embedded Data Visualization Platform:
Microsoft Visio 2010 Business Intelligence
 Microsoft Visio 2010 Business Intelligence St. Louis SharePoint User Group Candy Parisi Microsoft Visio Solution Specialist April 10, 2012 Agenda Microsoft Business Intelligence Overview Visio Business
Managing the PowerPivot for SharePoint Environment
 Managing the PowerPivot for SharePoint Environment Melissa Coates Blog: sqlchick.com Twitter: @sqlchick SharePoint Saturday 3/16/2013 About Melissa Business Intelligence & Data Warehousing Developer Architect
Power BI overview. Josh Condie Partner Technology Strategist, TS2 Microsoft SMB&D
 Power BI overview Josh Condie Partner Technology Strategist, TS2 Microsoft SMB&D Unlock insights on any data Power BI overview Turning data into a business advantage The world of data is changing A powerful
Consuming Real Time Analytics and KPI powered by leveraging SAP Lumira and SAP Smart Business in Fiori SESSION CODE: 0611 Draft!!!
 Consuming Real Time Analytics and KPI powered by leveraging SAP Lumira and SAP Smart Business in Fiori SESSION CODE: 0611 Draft!!! Michael Sung SAP Consuming Real Time Analytics and KPI powered by leveraging
Building Dynamics CRM 2015 Dashboards with Power BI
 Fr Building Dynamics CRM 2015 Dashboards with Power BI is a hands-on guide to building and configuring powerful Dynamics CRM dashboards. This book will provide you with the skills you need to learn how
COURSE SYLLABUS COURSE TITLE:
 1 COURSE SYLLABUS COURSE TITLE: FORMAT: CERTIFICATION EXAMS: 55043AC Microsoft End to End Business Intelligence Boot Camp Instructor-led None This course syllabus should be used to determine whether the
Ad Hoc Analysis of Big Data Visualization
 Ad Hoc Analysis of Big Data Visualization Dean Yao Director of Marketing Greg Harris Systems Engineer Follow us @Jinfonet #BigDataWebinar JReport Highlights Advanced, Embedded Data Visualization Platform:
55042: SharePoint 2013 Business Intelligence
 CÔNG TY CỔ PHẦN TRƯỜNG CNTT TÂN ĐỨC TAN DUC INFORMATION TECHNOLOGY SCHOOL JSC LEARN MORE WITH LESS! 55042: SharePoint 2013 Business Intelligence Length: 3 Days Audience(s): IT Professionals,Developers
Updating Your Microsoft SQL Server 2008 BI Skills to SQL Server 2008 R2
 Course 10337A: Updating Your Microsoft SQL Server 2008 BI Skills to SQL Server 2008 R2 OVERVIEW About this Course This 3 day ILT course focuses on the new features SQL Server 2008 R2 for BI specialists
SharePoint 2013 PerformancePoint Services
 3 Riverchase Office Plaza Hoover, Alabama 35244 Phone: 205.989.4944 Fax: 855.317.2187 E-Mail: [email protected] Web: www.discoveritt.com Course 55057A: SharePoint 2013 PerformancePoint Services
Embedded Analytics & Big Data Visualization in Any App
 Embedded Analytics & Big Data Visualization in Any App Boney Pandya Marketing Manager Greg Harris Systems Engineer Follow us @Jinfonet Our Mission Simplify the Complexity of Reporting and Visualization
SharePoint 2013 PerformancePoint Services Course 55057; 3 Days
 Lincoln Land Community College Capital City Training Center 130 West Mason Springfield, IL 62702 217-782-7436 www.llcc.edu/cctc SharePoint 2013 PerformancePoint Services Course 55057; 3 Days Course Description
How SAP Business Intelligence Solutions provide real-time insight into your organization
 How SAP Business Intelligence Solutions provide real-time insight into your organization 28 Oct 2015 Agenda 1) What is Business Intelligence (BI) 2) SAP BusinessObjects Features Overview 3) Demo & Report
Microsoft Training and Certification Guide. Current as of March 16, 2015
 Microsoft Training and Certification Guide Current as of March 16, 2015 Welcome to the Microsoft Training and Certification Guide. This guide is intended to provide a quick, comprehensive view of our training
How Microsoft IT India s Test Organization Enabled Efficient Business Intelligence
 How Microsoft IT India s Test Organization Enabled Efficient Business Intelligence December 2013 The following content may no longer reflect Microsoft s current position or infrastructure. This content
Dashboard Overview. Bernd Schneider. Technical Solution Professional BI Microsoft Switzerland [email protected]
 Dashboard Overview Bernd Schneider Technical Solution Professional BI Microsoft Switzerland [email protected] Techdays Bern (8./9. April) http://www.techdays.ch + * Including Microsoft Office
DEMYSTIFYING THE CLOUD
 DEMYSTIFYING THE CLOUD GETTING THE MOST OUT OF OFFICE 365 & WINDOWS AZURE Pete Lee Michael Lee Aaron Saposnik Rachael Narel Agenda SWC Introduction Cloud Definition & Market Overview Solutions and Demos
Oracle BI 11g R1: Create Analyses and Dashboards
 Oracle University Contact Us: Local: 1800 103 4775 Intl: +91 80 67863102 Oracle BI 11g R1: Create Analyses and Dashboards Duration: 5 Days What you will learn This Oracle BI 11g R1: Create Analyses and
The Right BI Tool for the Job in a non- SAP Applica9on Environment
 September 9 11, 2013 Anaheim, California The Right BI Tool for the Job in a non- SAP Applica9on Environment Speaker Name(s): Ty Miller Full Spectrum Business Intelligence Self Service Dashboards and Apps
Course MS55003A Microsoft SharePoint 2010 Business Intelligence Services
 3 Riverchase Office Plaza Hoover, Alabama 35244 Phone: 205.989.4944 Fax: 855.317.2187 E-Mail: [email protected] Web: www.discoveritt.com Course MS55003A Microsoft SharePoint 2010 Business Intelligence
Data Visualization Choices
 Data Visualization Choices What, When, and How? Paul Turley Mentor, SolidQ SQL Server MVP April 10-12 Chicago, IL Please silence cell phones April 10-12 Chicago, IL Presenter Introduction Mentor BI Solution
How To Choose A Microsoft Biz (Windows) For Business
 For Business") Data Visualization Choices SQL Saturday #198, Vancouver, BC Paul Turley Mentor, SolidQ SQL Server MVP Presenter Introduction Mentor BI Solution Architect Microsoft certified consultant & trainer Author
Data Visualization Choices SQL Saturday #198, Vancouver, BC Paul Turley Mentor, SolidQ SQL Server MVP Presenter Introduction Mentor BI Solution Architect Microsoft certified consultant & trainer Author
By Makesh Kannaiyan [email protected] 8/27/2011 1
 Integration between SAP BusinessObjects and Netweaver By Makesh Kannaiyan [email protected] 8/27/2011 1 Agenda Evolution of BO Business Intelligence suite Integration Integration after 4.0 release
<Insert Picture Here> Extending Hyperion BI with the Oracle BI Server
 Extending Hyperion BI with the Oracle BI Server Mark Ostroff Sr. BI Solutions Consultant Agenda Hyperion BI versus Hyperion BI with OBI Server Benefits of using Hyperion BI with the
Microsoft Training and Certification Guide. Current as of December 31, 2013
 Microsoft Training and Certification Guide Current as of December 31, 2013 Welcome to the Microsoft Training and Certification Guide. This device is intended to provide a quick, comprehensive view of our
Sugar Professional. Approvals + + + + Competitor tracking + + + + Territory management + + + + Third-party sales methodologies + + + +
 Professional Corporate Enterprise Ultimate List price / user / month $35 $45 $60 $150 List price / user / year (contractual term) $420 $540 $720 $1,800 Application or user limits no limits no limits no
Microsoft 55042 - SharePoint 2013 Business Intelligence
 1800 ULEARN (853 276) www.ddls.com.au Microsoft 55042 - SharePoint 2013 Business Intelligence Length 3 days Price $2629.00 (inc GST) Version A Overview This three-day instructor-led course provides students
Building a Reporting and Analytics System Connected Enterprise Seminar
 Manufacturing Intelligence, de stuwende kracht om in een Connected Enterprise snel accurate beslissingen te nemen om de bedrijfsprestaties te optimaliseren. Building a Reporting and Analytics System Connected
Implementing Data Models and Reports with Microsoft SQL Server
 Course 20466C: Implementing Data Models and Reports with Microsoft SQL Server Course Details Course Outline Module 1: Introduction to Business Intelligence and Data Modeling As a SQL Server database professional,
Session 805 -End-to-End SAP Lumira: Desktop to On-Premise, Cloud, and Mobile
 September 9 11, 2013 Anaheim, California Session 805 -End-to-End SAP Lumira: Desktop to On-Premise, Cloud, and Mobile Ashish C. Morzaria, SAP Disclaimer This presentation outlines our general product direction
The Clear Path to Business Intelligence
 SAP Solution in Detail SAP Solutions for Small Businesses and Midsize Companies SAP Crystal Solutions The Clear Path to Business Intelligence Table of Contents 3 Quick Facts 4 Optimize Decisions with SAP
Office 365 SharePoint Online
 Office 365 SharePoint Online May 8, 2012 Statera Consultants: Erin Giffin Thomas Baer Agenda Overview of SharePoint Online capabilities Demo User Experience Admin Experience Online vs. OnPrem Hybrid Scenario
Business Intelligence Using SharePoint 2013 and Office365
 Business Intelligence Using SharePoint 2013 and Office365 Firdouz Hussain Shaik Trigent Software Introduction Many successful companies have been investing large sums of money in business intelligence
A Look at Self Service BI with SAP Lumira Natasha Kishinevsky Dunn Solutions Group SESSION CODE: 1405
 A Look at Self Service BI with SAP Lumira Natasha Kishinevsky Dunn Solutions Group SESSION CODE: 1405 LEARNING POINTS How a business user analyzes data with Lumira Introduction to the SAP BI Lumira Connector
Microsoft End to End Business Intelligence Boot Camp
 Microsoft End to End Business Intelligence Boot Camp Längd: 5 Days Kurskod: M55045 Sammanfattning: This five-day instructor-led course is a complete high-level tour of the Microsoft Business Intelligence
Sugar Professional. Approvals + + + + Competitor tracking + + + + Territory management + + + + Third-party sales methodologies + + + +
 Professional Corporate Enterprise Ultimate List price / user / month $35 $45 $60 $100 List price / user / year (contractual term) $420 $540 $720 $1,200 Application or user limits no limits no limits no
Embedding Customized Data Visualization and Analysis
 Embedding Customized Data Visualization and Analysis Boney Pandya Marketing Manager Leo Zhao Systems Engineer Follow us @Jinfonet JReport Highlights Advanced, Embedded Data Visualization Platform: High
CRGroup Whitepaper: Digging through the Data. www.crgroup.com. Reporting Options in Microsoft Dynamics GP
 CRGroup Whitepaper: Digging through the Data Reporting Options in Microsoft Dynamics GP The objective of this paper is to provide greater insight on each of the reporting options available to you within
Creating Dashboards for Microsoft Project Server 2010
 Creating Dashboards for Microsoft Project Server 2010 Authors: Blaise Novakovic, Jean-Francois LeSaux, Steven Haden, Microsoft Consulting Services Information in the document, including URL and other Internet
Outlines. Business Intelligence. What Is Business Intelligence? Data mining life cycle
 Outlines Business Intelligence Lecture 15 Why integrate BI into your smart client application? Integrating Mining into your application Integrating into your application What Is Business Intelligence?
Microsoft Power BI for Office 365 Provisioning Guide
 Microsoft Power BI for Office 365 Provisioning Guide This documentation is for preview only, and is subject to change in future releases. 2013 Microsoft Corp. All rights reserved. How to provision Microsoft
Melissa Coates. Tools & Techniques for Implementing Corporate and Self-Service BI. Triad SQL BI User Group 6/25/2013. BI Architect, Intellinet
 Tools & Techniques for Implementing Corporate and Self-Service BI Triad SQL BI User Group 6/25/2013 Melissa Coates BI Architect, Intellinet Blog: sqlchick.com Twitter: @sqlchick About Melissa Business
[email protected] João Diogo Almeida Premier Field Engineer Microsoft Corporation
 [email protected] João Diogo Almeida Premier Field Engineer Microsoft Corporation Reporting Services Overview SSRS Architecture SSRS Configuration Reporting Services Authoring Report Builder Report
Please contact Cyber and Technology Training at (410)777-1333/[email protected] for registration and pricing information.
777-1333/technologytraining@aacc.edu for registration and pricing information.") Course Name Start Date End Date Start Time End Time Active Directory Services with Windows Server 8/31/2015 9/4/2015 9:00 AM 5:00 PM Active Directory Services with Windows Server 9/28/2015 10/2/2015 9:00
Course Name Start Date End Date Start Time End Time Active Directory Services with Windows Server 8/31/2015 9/4/2015 9:00 AM 5:00 PM Active Directory Services with Windows Server 9/28/2015 10/2/2015 9:00
Editions Comparison Chart
 Sugar Professional Sugar Enterprise Sugar Ultimate List price / user / month $35 $60 $150 List price / user / year (contractual term) $420 $720 $1,800 Application or user limits no limits no limits no
BusinessObjects Enterprise InfoView User's Guide
 BusinessObjects Enterprise InfoView User's Guide BusinessObjects Enterprise XI 3.1 Copyright 2009 SAP BusinessObjects. All rights reserved. SAP BusinessObjects and its logos, BusinessObjects, Crystal Reports,
Geo Analysis, Visualization and Performance with JReport 13
 Geo Analysis, Visualization and Performance with JReport 13 Boney Pandya Marketing Manager Leo Zhao Systems Engineer Follow us @Jinfonet JReport Highlights Advanced, Embedded Data Visualization Platform:
Self-Service Business Intelligence
 Self-Service Business Intelligence BRIDGE THE GAP VISUALIZE DATA, DISCOVER TRENDS, SHARE FINDINGS Solgenia Analysis provides users throughout your organization with flexible tools to create and share meaningful
Introducing the Reimagined Power BI Platform. Jen Underwood, Microsoft
 Introducing the Reimagined Power BI Platform Jen Underwood, Microsoft Thank You Sponsors Empower users with new insights through familiar tools while balancing the need for IT to monitor and manage user
Implementing Data Models and Reports with Microsoft SQL Server 20466C; 5 Days
 Lincoln Land Community College Capital City Training Center 130 West Mason Springfield, IL 62702 217-782-7436 www.llcc.edu/cctc Implementing Data Models and Reports with Microsoft SQL Server 20466C; 5
SAP BusinessObjects Business Intelligence Platform Document Version: 4.1 Support Package 5-2014-11-06. Business Intelligence Launch Pad User Guide
 SAP BusinessObjects Business Intelligence Platform Document Version: 4.1 Support Package 5-2014-11-06 Business Intelligence Launch Pad User Guide Table of Contents 1 Document history....7 2 Getting started
Collaboration. Michael McCabe Information Architect [email protected]. black and white solutions for a grey world
 Collaboration Michael McCabe Information Architect [email protected] black and white solutions for a grey world Slide Deck & Webcast Recording links Questions and Answers We will answer questions at
Microsoft Dynamics AX. Reporting and Business Intelligence in Microsoft Dynamics AX
 INSIGHT Microsoft Dynamics AX Reporting and Business Intelligence in Microsoft Dynamics AX White Paper A roadmap for managing business performance with Microsoft Dynamics AX Date: September 2006 http://www.microsoft.com/dynamics/ax/