Information Visualization Multivariate Data Visualization Krešimir Matković
|
|
|
- Elfrieda Rice
- 7 years ago
- Views:
Transcription
1 Information Visualization Multivariate Data Visualization Krešimir Matković Vienna University of Technology, VRVis Research Center, Vienna


2 Multivariable >3D Data Tables have so many variables that orthogonal Visual Structures are not sufficient.

3 Multidimensional Multivariate Data Use of Color & Shape to increase dimensionality Table Lens Scatter plot matrix Chernoff faces Parallel Coordinates Star plot Star coordinates Parallel Sets Mosaic Plot Interaction and Coordinated Multiple Views, Example Application

4 Multidimensional Multivariate Data Conventional approach deals with n-dim. Euclidian spaces Each item is a point in n-dim. Space (n-tuple) Each dimension can be categorical (nominal, ordinal) or numerical Data example, meteorological stations in California Pi x,..., x,..., x i n 1 STATION AVERAGE TEMP PRESSURE ELEVATION

5 Visualizing single dimensions Each dimension (column in the table) can be visualized as 1D data Histogram, Bar Chart, Box-Plot

6 Visualizing pairs of dimensions Pairs of dimensions can be visualized as 2D data Scatter plot Widely used Shows correlation positive, negative, no correlation Shows clusters Multiple points scatter, increase size Can be used to show up to 5 dimensions (color, size, shape)

7 Visualizing pairs of dimensions

8 Visualizing pairs of dimensions

9 Visualizing many dimensions There are 2 geometric dimensions on screen For data sets with >2 dimensions, we must project data down to 2D Come up with visual mapping that locates each dimension into 2D plane A spreadsheet already does that Column -> dimension Row -> record, case, item

10 Table Lens Textual table too large Rao and Card 1994


11 Table Lens
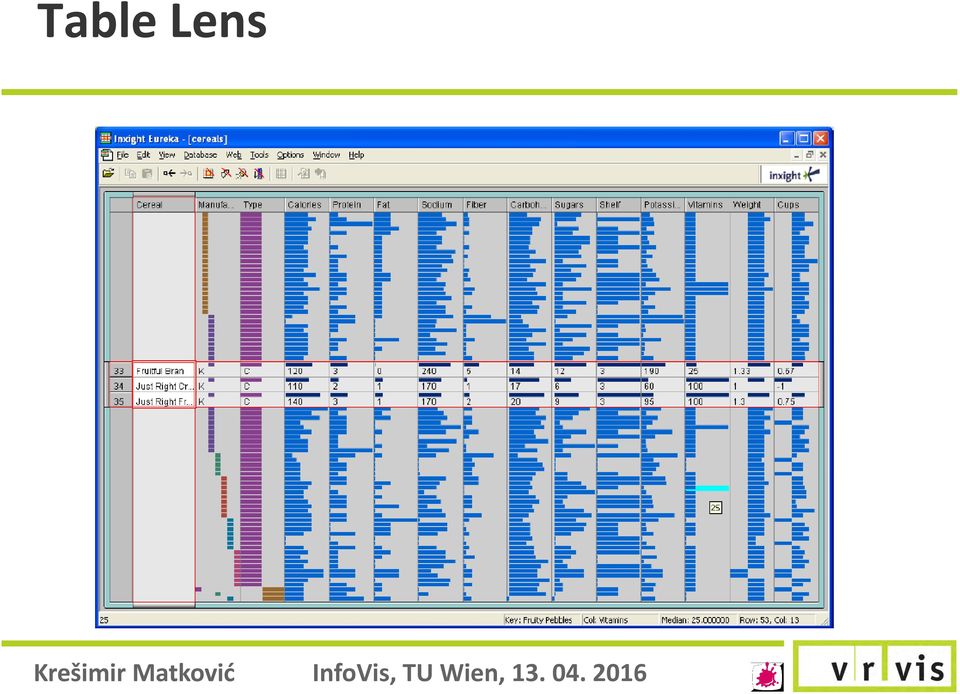

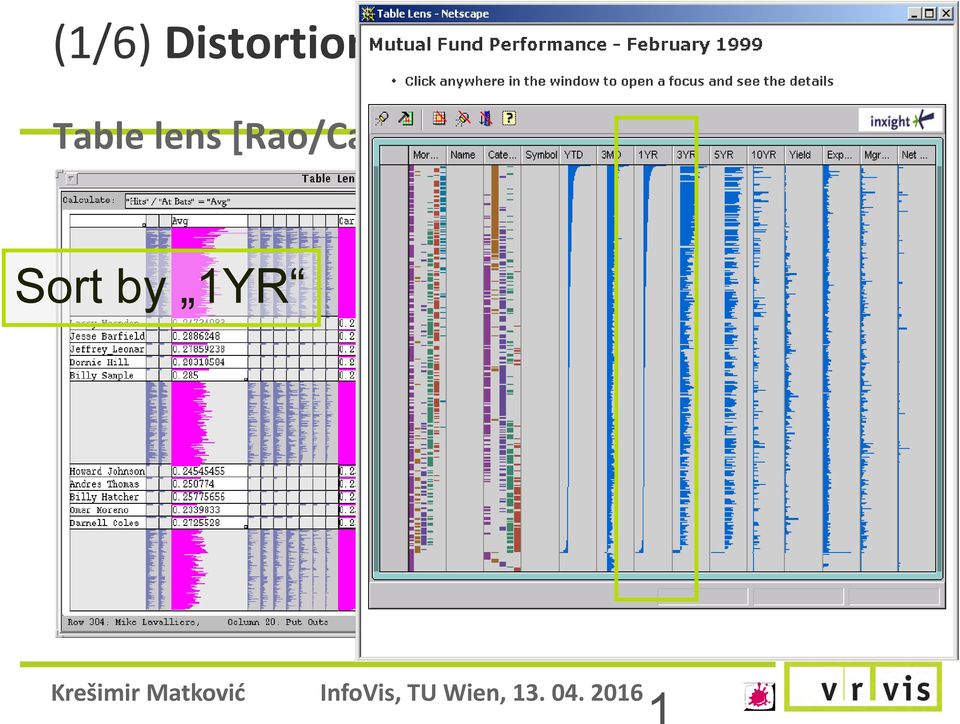
12 (1/6) Distortion-oriented F+C vis. 5 Table lens [Rao/Card 1994] Initial view, no details

13 (1/6) Distortion-oriented F+C vis. 5 Table lens [Rao/Card 1994] Sort by 1YR
14 (1/6) Distortion-oriented F+C vis. 5 Table lens [Rao/Card 1994] Mark good 1YR Sort by 3YR


15 (1/6) Distortion-oriented F+C vis. 5 Table lens [Rao/Card 1994] Mark good 3YR Sort by 5YR Krešimir Matković An InfoVis, Interaction TU Wien, View 2016 on


16 (1/6) Distortion-oriented F+C vis. 5 Table lens [Rao/Card 1994] Open good lines


17 (1/6) Distortion-oriented F+C vis. 5 Table lens [Rao/Card 1994] Open Category

18 Multiplies Idea: use multiple single visualization many bar charts, e.g. Scatterplot matrix Show (all possible) combinations of dimensions as a scatterplot matrix Good overview of corellation for all depicted dimensions Often used in statistics Too small for many dimensions Zoom in usually possible

19 Scatter plot matrix [

20 Chernoff Faces 1 We can easily distinguish various faces Encode different variables in characteristics of human face Decreasing order of perception Area of face Shape of face Length of nose Location of mouth Curve of smile Width of mouth Location, separation, angle, shape and width of eyes Location of pupil Location, angle, width of eyebrows 20

21 Chernoff Faces 2 21
22 Chernoff Faces Example 1 [Joseph G. Spinelli and Yu Zhou] 22
23 Chernoff Faces Example 1 [Joseph G. Spinelli and Yu Zhou] 23
24 Chernoff Faces Example 2 24

25 Chernoff Faces Example 3 Comments? 25
26 Parallel Coordinates Parallel 2D axes Add/Remove data Establish Patterns Examine interactions Useful for recognizing patterns between the axes Skilled user
27 Parallel Coordinates 2 [Inselberg] Encode variables along a horizontal row Vertical line specifies single variable Blue line specifies a case
28 PC Line Point Duality 28
29 PC Line Point Duality 29
30 PC 5D Sphere! 30
31 Parallel Coordinates - Problems If many records overlapping and clutter Reorder dimensions Density Clustering Outlier preserving methods Short demo
32 Parallel Coordinates Outlier Preserving Novotny and Hauser
33 Extended Parallel Coordinates Greyscale, color Histogram information on axes Smooth brushing Angular brushing
34 Extended Parallel Coordinates Greyscale, color Histogram information on axes Smooth brushing Angular brushing
35 Extended Parallel Coordinates Greyscale, color Histogram information on axes Smooth brushing Angular brushing
36 Star Plot, Radar Chart Space out the n dimensions at equal angles around a circle Each spoke encodes a variable s value Data point is now a shape 36
37 Star Coordinates Similar idea as star plot Rather than represent point as shape, just accumulate values along a vector parallel to particular axis Data case then becomes a single point 37
38 Star Coordinates Similar idea as star plot Rather than represent point as shape, just accumulate values along a vector parallel to particular axis Data case then becomes a single point 38
39 Parallel Sets Parallel Coordinates for categorical data Axis replaced with boxes Layout similar to PC Demo! 39
40 Parallel Sets 2 Which class has the highest number of survivors? 40
41 Parallel Sets 3 Which class has the highest number of survivors? 41
42 Linewidth Illusion Playfair s chart from the Commercial and Political Atlas (1786) showing the balance of trade between England and the East Indies. 42
43 Linewidth Illusion Where is the difference highest? 43
44 Common Angle Plot a Possible Solution Heike Hofmann and Marie Vendettuoli, TVCG
45 Mosaic Plot Categorical data Not-suitable views: scatter plot, PC, Box Plot Example data: Titanic dataset Mosaic Plot Relationship between 2 or more categorical dimensions Start with a square of length 1 Divide it according to one category horizontally Divide each sub-block vertically according to another category. 45
46 Mosaic Plot [Steve Simon] [Stasko] 46
47 Mosaic Plot This and following slides on Mosaic plot adopted from Stephen Few: [Stasko] 47
48 Mosaic Plot 48

49 Mosaic Plot 49
50 Mosaic Plot 50
51 Mosaic Plot 51

52 Mosaic Plot 52
53 Mosaic Plot 53
54 Trees Visual Structures that refer to use of connection and enclosure to encode relationships among cases Desirable Features Planarity (no crossing edges) Clarity in reflecting the relationships among the nodes Clean, non-convoluted design Hierarchical relationships should be drawn directional
55 Trees
56 Treevis.net
57 ConeTree [Robertson et al, 1991]
![Tree Maps [Johnson, Shneiderman, 1991] Outline](/docs-images/39/19465174/images/58-0.png "Tree diagram Venn diagram Nested treemap")
58 Tree Maps [Johnson, Shneiderman, 1991] Outline Tree diagram Venn diagram Nested treemap Treemap
59 Tree Map
60 Tree Map
61 Tree Map
62 Tree Map
63 Tree Map
64 Tree Map
65 Networks Used to describe Communication Networks, Telephone Systems, Internet Nodes Unstructured Nominal Ordinal Quantity Links Directed Undirected [Branigan et al, 2001]
66 Networks Problems Visualizing Networks: Positioning of Nodes Managing links so they convey the actual information Handling the scale of graphs with large amounts of nodes Interaction Navigation [London Subway]
67 Dense Pixel Methods - Basic Idea Use pixel to represent one data item Number of pixels (~1M) determines number of items Relies on use of color - color mapping Value ranges are mapped to a fixed color sequence of full color (hue) scale but monotonically decreasing brightness [Butz Course Notes]
68 Horizontal arangement 8 horizontal bars correspond to 8 years Subdivisions between the bars represent 12 months within each year Example analysis results Gold price was very low in the sixth year IBM price fell quickly after the first 1 ½ month US-Dollar exchange rate was highest in the third year [Keim et al. 1995]

69 Query Dependent Arrengement
70 Pixel Bar Chart Overload typical bar chart with more information about individual elements [Keim et al.]
71 Pixel Bar Chart 1 Overload typical bar chart with more information about individual elements [Keim et al.]
72 Pixel Bar Chart 2 Make each pixel within a bar correspond to a data point in that group represented by the bar Can do millions that way Color the pixel to represent the value of one of the data point s variables [Keim et al.]
73 Pixel Bar Chart 2 Product type is x-axis divider Customers ordered by y-axis: dollar amount x-axis: number of visits Color is (a) dollar amount spent, (b) number of visits, (c) sales quantity [Keim et al.]
74 Pixel Bar Chart 3 [Keim et al.]
75 Pixel Bar Chart 4 Mapping specified by 5 tuple <Dx, Dy, Ox, Oy, C> Dx Attribute partitions x axis Dy Attribute partitions y axis Ox Attribute specifies x ordering Oy Attribute specifies y ordering C Attribute specifies color mapping [Keim et al.]
76 Pixel Bar Chart 5 [Keim et al.]
77 Pixel Bar Chart CFD Data [Martin Gasser Hannes Kiraly.]
78 Color Lines View 1 Pixel based techniqur for families of curves Interaction! [Stasko Course Notes]
79 Color Lines View 2 Demo! [Stasko Course Notes]
80 InfoVis Techniques D. Keim proposes a taxonomy of techniques Standard 2D/3D display Bar charts, scatterplots Geometrically transformed display Parallel coordinates Iconic display Needle icons, Chernoff faces Dense pixel display Pixel Bar Chart, Color Lines Stacked display Treemaps, dimensional stacking
81 Thank you! Special thanks for used materials to M.E. Gröller, H. Hauser, and colleagues from VRVis!
Chapter 3 - Multidimensional Information Visualization II
 Chapter 3 - Multidimensional Information Visualization II Concepts for visualizing univariate to hypervariate data Vorlesung Informationsvisualisierung Prof. Dr. Florian Alt, WS 2013/14 Konzept und Folien
Multi-Dimensional Data Visualization. Slides courtesy of Chris North
 Multi-Dimensional Data Visualization Slides courtesy of Chris North What is the Cleveland s ranking for quantitative data among the visual variables: Angle, area, length, position, color Where are we?!
Visualization of Multivariate Data. Dr. Yan Liu Department of Biomedical, Industrial and Human Factors Engineering Wright State University
 Visualization of Multivariate Data Dr. Yan Liu Department of Biomedical, Industrial and Human Factors Engineering Wright State University Introduction Multivariate (Multidimensional) Visualization Visualization
Cours de Visualisation d'information InfoVis Lecture. Multivariate Data Sets
 Cours de Visualisation d'information InfoVis Lecture Multivariate Data Sets Frédéric Vernier Maître de conférence / Lecturer Univ. Paris Sud Inspired from CS 7450 - John Stasko CS 5764 - Chris North Data
Data Visualization. or Graphical Data Presentation. Jerzy Stefanowski Instytut Informatyki
 Data Visualization or Graphical Data Presentation Jerzy Stefanowski Instytut Informatyki Data mining for SE -- 2013 Ack. Inspirations are coming from: G.Piatetsky Schapiro lectures on KDD J.Han on Data
Information Visualization. Ronald Peikert SciVis 2007 - Information Visualization 10-1
 Information Visualization Ronald Peikert SciVis 2007 - Information Visualization 10-1 Overview Techniques for high-dimensional data scatter plots, PCA parallel coordinates link + brush pixel-oriented techniques
Graphical Representation of Multivariate Data
 Graphical Representation of Multivariate Data One difficulty with multivariate data is their visualization, in particular when p > 3. At the very least, we can construct pairwise scatter plots of variables.
Visualization Techniques in Data Mining
 Tecniche di Apprendimento Automatico per Applicazioni di Data Mining Visualization Techniques in Data Mining Prof. Pier Luca Lanzi Laurea in Ingegneria Informatica Politecnico di Milano Polo di Milano
9. Text & Documents. Visualizing and Searching Documents. Dr. Thorsten Büring, 20. Dezember 2007, Vorlesung Wintersemester 2007/08
 9. Text & Documents Visualizing and Searching Documents Dr. Thorsten Büring, 20. Dezember 2007, Vorlesung Wintersemester 2007/08 Slide 1 / 37 Outline Characteristics of text data Detecting patterns SeeSoft
Data Exploration Data Visualization
 Data Exploration Data Visualization What is data exploration? A preliminary exploration of the data to better understand its characteristics. Key motivations of data exploration include Helping to select
Visualization Quick Guide
 Visualization Quick Guide A best practice guide to help you find the right visualization for your data WHAT IS DOMO? Domo is a new form of business intelligence (BI) unlike anything before an executive
Data Mining: Exploring Data. Lecture Notes for Chapter 3. Introduction to Data Mining
 Data Mining: Exploring Data Lecture Notes for Chapter 3 Introduction to Data Mining by Tan, Steinbach, Kumar What is data exploration? A preliminary exploration of the data to better understand its characteristics.
All Visualizations Documentation
 All Visualizations Documentation All Visualizations Documentation 2 Copyright and Trademarks Licensed Materials - Property of IBM. Copyright IBM Corp. 2013 IBM, the IBM logo, and Cognos are trademarks
Visual Data Mining : the case of VITAMIN System and other software
 Visual Data Mining : the case of VITAMIN System and other software Alain MORINEAU a.morineau@noos.fr Data mining is an extension of Exploratory Data Analysis in the sense that both approaches have the
Iris Sample Data Set. Basic Visualization Techniques: Charts, Graphs and Maps. Summary Statistics. Frequency and Mode
 Iris Sample Data Set Basic Visualization Techniques: Charts, Graphs and Maps CS598 Information Visualization Spring 2010 Many of the exploratory data techniques are illustrated with the Iris Plant data
Data Visualization Handbook
 SAP Lumira Data Visualization Handbook www.saplumira.com 1 Table of Content 3 Introduction 20 Ranking 4 Know Your Purpose 23 Part-to-Whole 5 Know Your Data 25 Distribution 9 Crafting Your Message 29 Correlation
What is Visualization? Information Visualization An Overview. Information Visualization. Definitions
 What is Visualization? Information Visualization An Overview Jonathan I. Maletic, Ph.D. Computer Science Kent State University Visualize/Visualization: To form a mental image or vision of [some
Visual Data Mining with Pixel-oriented Visualization Techniques
 Visual Data Mining with Pixel-oriented Visualization Techniques Mihael Ankerst The Boeing Company P.O. Box 3707 MC 7L-70, Seattle, WA 98124 mihael.ankerst@boeing.com Abstract Pixel-oriented visualization
An example. Visualization? An example. Scientific Visualization. This talk. Information Visualization & Visual Analytics. 30 items, 30 x 3 values
 Information Visualization & Visual Analytics Jack van Wijk Technische Universiteit Eindhoven An example y 30 items, 30 x 3 values I-science for Astronomy, October 13-17, 2008 Lorentz center, Leiden x An
Quantitative vs. Categorical Data: A Difference Worth Knowing Stephen Few April 2005
 Quantitative vs. Categorical Data: A Difference Worth Knowing Stephen Few April 2005 When you create a graph, you step through a series of choices, including which type of graph you should use and several
Excel Tutorial. Bio 150B Excel Tutorial 1
 Bio 15B Excel Tutorial 1 Excel Tutorial As part of your laboratory write-ups and reports during this semester you will be required to collect and present data in an appropriate format. To organize and
Clustering & Visualization
 Chapter 5 Clustering & Visualization Clustering in high-dimensional databases is an important problem and there are a number of different clustering paradigms which are applicable to high-dimensional data.
Diagrams and Graphs of Statistical Data
 Diagrams and Graphs of Statistical Data One of the most effective and interesting alternative way in which a statistical data may be presented is through diagrams and graphs. There are several ways in
Data Mining: Exploring Data. Lecture Notes for Chapter 3. Introduction to Data Mining
 Data Mining: Exploring Data Lecture Notes for Chapter 3 Introduction to Data Mining by Tan, Steinbach, Kumar Tan,Steinbach, Kumar Introduction to Data Mining 8/05/2005 1 What is data exploration? A preliminary
Microsoft Excel 2010 Charts and Graphs
 Microsoft Excel 2010 Charts and Graphs Email: training@health.ufl.edu Web Page: http://training.health.ufl.edu Microsoft Excel 2010: Charts and Graphs 2.0 hours Topics include data groupings; creating
Time Series Data Visualization
 Time Series Data Visualization Time Series Data Fundamental chronological component to the data set Random sample of 4000 graphics from 15 of world s newspapers and magazines from 74-80 found that 75%
TIBCO Spotfire Business Author Essentials Quick Reference Guide. Table of contents:
 Table of contents: Access Data for Analysis Data file types Format assumptions Data from Excel Information links Add multiple data tables Create & Interpret Visualizations Table Pie Chart Cross Table Treemap
Visualization Software
 Visualization Software Maneesh Agrawala CS 294-10: Visualization Fall 2007 Assignment 1b: Deconstruction & Redesign Due before class on Sep 12, 2007 1 Assignment 2: Creating Visualizations Use existing
Plotting: Customizing the Graph
 Plotting: Customizing the Graph Data Plots: General Tips Making a Data Plot Active Within a graph layer, only one data plot can be active. A data plot must be set active before you can use the Data Selector
Principles of Data Visualization for Exploratory Data Analysis. Renee M. P. Teate. SYS 6023 Cognitive Systems Engineering April 28, 2015
 Principles of Data Visualization for Exploratory Data Analysis Renee M. P. Teate SYS 6023 Cognitive Systems Engineering April 28, 2015 Introduction Exploratory Data Analysis (EDA) is the phase of analysis
Chapter 3 - Multidimensional Information Visualization II
 Chapter 3 - Multidimensional Information Visualization II Concepts for visualizing univariate to hypervariate data Vorlesung Informationsvisualisierung Prof. Dr. Florian Alt, WS 2013/14 Konzept und Folien
Hierarchical Data Visualization
 Hierarchical Data Visualization 1 Hierarchical Data Hierarchical data emphasize the subordinate or membership relations between data items. Organizational Chart Classifications / Taxonomies (Species and
Data Mining: Exploring Data. Lecture Notes for Chapter 3. Slides by Tan, Steinbach, Kumar adapted by Michael Hahsler
 Data Mining: Exploring Data Lecture Notes for Chapter 3 Slides by Tan, Steinbach, Kumar adapted by Michael Hahsler Topics Exploratory Data Analysis Summary Statistics Visualization What is data exploration?
Microsoft Business Intelligence Visualization Comparisons by Tool
 Microsoft Business Intelligence Visualization Comparisons by Tool Version 3: 10/29/2012 Purpose: Purpose of this document is to provide a quick reference of visualization options available in each tool.
Scientific Graphing in Excel 2010
 Scientific Graphing in Excel 2010 When you start Excel, you will see the screen below. Various parts of the display are labelled in red, with arrows, to define the terms used in the remainder of this overview.
Formulas, Functions and Charts
 Formulas, Functions and Charts :: 167 8 Formulas, Functions and Charts 8.1 INTRODUCTION In this leson you can enter formula and functions and perform mathematical calcualtions. You will also be able to
Choosing a successful structure for your visualization
 IBM Software Business Analytics Visualization Choosing a successful structure for your visualization By Noah Iliinsky, IBM Visualization Expert 2 Choosing a successful structure for your visualization
Visualization methods for patent data
 Visualization methods for patent data Treparel 2013 Dr. Anton Heijs (CTO & Founder) Delft, The Netherlands Introduction Treparel can provide advanced visualizations for patent data. This document describes
3D Interactive Information Visualization: Guidelines from experience and analysis of applications
 3D Interactive Information Visualization: Guidelines from experience and analysis of applications Richard Brath Visible Decisions Inc., 200 Front St. W. #2203, Toronto, Canada, rbrath@vdi.com 1. EXPERT
Criteria for Evaluating Visual EDA Tools
 Criteria for Evaluating Visual EDA Tools Stephen Few, Perceptual Edge Visual Business Intelligence Newsletter April/May/June 2012 We visualize data for various purposes. Specific purposes direct us to
CS171 Visualization. The Visualization Alphabet: Marks and Channels. Alexander Lex alex@seas.harvard.edu. [xkcd]
![CS171 Visualization. The Visualization Alphabet: Marks and Channels. Alexander Lex alex@seas.harvard.edu. [xkcd]](/thumbs/39/19465011.jpg "CS171 Visualization. The Visualization Alphabet: Marks and Channels. Alexander Lex alex@seas.harvard.edu. [xkcd]") CS171 Visualization Alexander Lex alex@seas.harvard.edu The Visualization Alphabet: Marks and Channels [xkcd] This Week Thursday: Task Abstraction, Validation Homework 1 due on Friday! Any more problems
CS171 Visualization Alexander Lex alex@seas.harvard.edu The Visualization Alphabet: Marks and Channels [xkcd] This Week Thursday: Task Abstraction, Validation Homework 1 due on Friday! Any more problems
By LaBRI INRIA Information Visualization Team
 By LaBRI INRIA Information Visualization Team Tulip 2011 version 3.5.0 Tulip is an information visualization framework dedicated to the analysis and visualization of data. Tulip aims to provide the developer
Scatter Plots with Error Bars
 Chapter 165 Scatter Plots with Error Bars Introduction The procedure extends the capability of the basic scatter plot by allowing you to plot the variability in Y and X corresponding to each point. Each
Visualizing Multidimensional Data Through Time Stephen Few July 2005
 Visualizing Multidimensional Data Through Time Stephen Few July 2005 This is the first of three columns that will feature the winners of DM Review's 2005 data visualization competition. I want to extend
The Value of Visualization 2
 The Value of Visualization 2 G Janacek -0.69 1.11-3.1 4.0 GJJ () Visualization 1 / 21 Parallel coordinates Parallel coordinates is a common way of visualising high-dimensional geometry and analysing multivariate
Understanding Data: A Comparison of Information Visualization Tools and Techniques
 Understanding Data: A Comparison of Information Visualization Tools and Techniques Prashanth Vajjhala Abstract - This paper seeks to evaluate data analysis from an information visualization point of view.
Hierarchy and Tree Visualization
 Hierarchy and Tree Visualization Definition Hierarchies An ordering of groups in which larger groups encompass sets of smaller groups. Data repository in which cases are related to subcases Hierarchical
Summarizing and Displaying Categorical Data
 Summarizing and Displaying Categorical Data Categorical data can be summarized in a frequency distribution which counts the number of cases, or frequency, that fall into each category, or a relative frequency
an introduction to VISUALIZING DATA by joel laumans
 an introduction to VISUALIZING DATA by joel laumans an introduction to VISUALIZING DATA iii AN INTRODUCTION TO VISUALIZING DATA by Joel Laumans Table of Contents 1 Introduction 1 Definition Purpose 2 Data
Graph/Network Visualization
 Graph/Network Visualization Data model: graph structures (relations, knowledge) and networks. Applications: Telecommunication systems, Internet and WWW, Retailers distribution networks knowledge representation
Visual Mining of E-Customer Behavior Using Pixel Bar Charts
 Visual Mining of E-Customer Behavior Using Pixel Bar Charts Ming C. Hao, Julian Ladisch*, Umeshwar Dayal, Meichun Hsu, Adrian Krug Hewlett Packard Research Laboratories, Palo Alto, CA. (ming_hao, dayal)@hpl.hp.com;
There are six different windows that can be opened when using SPSS. The following will give a description of each of them.
 SPSS Basics Tutorial 1: SPSS Windows There are six different windows that can be opened when using SPSS. The following will give a description of each of them. The Data Editor The Data Editor is a spreadsheet
Visualizations. Cyclical data. Comparison. What would you like to show? Composition. Simple share of total. Relative and absolute differences matter
 Visualizations Variable width chart Table or tables with embedded charts Bar chart horizontal Circular area chart per item Many categories Cyclical data Non-cyclical data Single or few categories Many
The Eyes Have It: A Task by Data Type Taxonomy for Information Visualizations. Ben Shneiderman, 1996
 The Eyes Have It: A Task by Data Type Taxonomy for Information Visualizations Ben Shneiderman, 1996 Background the growth of computing + graphic user interface 1987 scientific visualization 1989 information
Big Data: Rethinking Text Visualization
 Big Data: Rethinking Text Visualization Dr. Anton Heijs anton.heijs@treparel.com Treparel April 8, 2013 Abstract In this white paper we discuss text visualization approaches and how these are important
The course: An Introduction to Information Visualization Techniques for Exploring Large Database
 The course: An Introduction to Information Visualization Techniques for Exploring Large Database Jing Yang Fall 2006 www.cs.uncc.edu/~jyang13 1 Multi-dimensional Data Visualization 2 1 Parallel Coordinates
Hierarchical Data Visualization. Ai Nakatani IAT 814 February 21, 2007
 Hierarchical Data Visualization Ai Nakatani IAT 814 February 21, 2007 Introduction Hierarchical Data Directory structure Genealogy trees Biological taxonomy Business structure Project structure Challenges
Hierarchical Clustering Analysis
 Hierarchical Clustering Analysis What is Hierarchical Clustering? Hierarchical clustering is used to group similar objects into clusters. In the beginning, each row and/or column is considered a cluster.
Information visualization examples
 Information visualization examples 350102: GenICT II 37 Information visualization examples 350102: GenICT II 38 Information visualization examples 350102: GenICT II 39 Information visualization examples
Connecting Segments for Visual Data Exploration and Interactive Mining of Decision Rules
 Journal of Universal Computer Science, vol. 11, no. 11(2005), 1835-1848 submitted: 1/9/05, accepted: 1/10/05, appeared: 28/11/05 J.UCS Connecting Segments for Visual Data Exploration and Interactive Mining
MicroStrategy Desktop
 MicroStrategy Desktop Quick Start Guide MicroStrategy Desktop is designed to enable business professionals like you to explore data, simply and without needing direct support from IT. 1 Import data from
Basic Understandings
 Activity: TEKS: Exploring Transformations Basic understandings. (5) Tools for geometric thinking. Techniques for working with spatial figures and their properties are essential to understanding underlying
Hypervariate Information Visualization
 Hypervariate Information Visualization Florian Müller Abstract In the last 20 years improvements in the computer sciences made it possible to store large data sets containing a plethora of different data
CHARTS AND GRAPHS INTRODUCTION USING SPSS TO DRAW GRAPHS SPSS GRAPH OPTIONS CAG08
 CHARTS AND GRAPHS INTRODUCTION SPSS and Excel each contain a number of options for producing what are sometimes known as business graphics - i.e. statistical charts and diagrams. This handout explores
Current Standard: Mathematical Concepts and Applications Shape, Space, and Measurement- Primary
 Shape, Space, and Measurement- Primary A student shall apply concepts of shape, space, and measurement to solve problems involving two- and three-dimensional shapes by demonstrating an understanding of:
Visualizing Data. Contents. 1 Visualizing Data. Anthony Tanbakuchi Department of Mathematics Pima Community College. Introductory Statistics Lectures
 Introductory Statistics Lectures Visualizing Data Descriptive Statistics I Department of Mathematics Pima Community College Redistribution of this material is prohibited without written permission of the
COM CO P 5318 Da t Da a t Explora Explor t a ion and Analysis y Chapte Chapt r e 3
 COMP 5318 Data Exploration and Analysis Chapter 3 What is data exploration? A preliminary exploration of the data to better understand its characteristics. Key motivations of data exploration include Helping
Valor Christian High School Mrs. Bogar Biology Graphing Fun with a Paper Towel Lab
 1 Valor Christian High School Mrs. Bogar Biology Graphing Fun with a Paper Towel Lab I m sure you ve wondered about the absorbency of paper towel brands as you ve quickly tried to mop up spilled soda from
MicroStrategy Analytics Express User Guide
 MicroStrategy Analytics Express User Guide Analyzing Data with MicroStrategy Analytics Express Version: 4.0 Document Number: 09770040 CONTENTS 1. Getting Started with MicroStrategy Analytics Express Introduction...
Agenda. TreeMaps. What is a Treemap? Basics
 Agenda TreeMaps What is a Treemap? Treemap Basics Original Treemap Algorithm (Slice-and-dice layout) Issues for Treemaps Cushion Treemaps Squarified Treemaps Ordered Treemaps Quantum Treemaps Other Treemaps
BIG DATA VISUALIZATION. Team Impossible Peter Vilim, Sruthi Mayuram Krithivasan, Matt Burrough, and Ismini Lourentzou
 BIG DATA VISUALIZATION Team Impossible Peter Vilim, Sruthi Mayuram Krithivasan, Matt Burrough, and Ismini Lourentzou Let s begin with a story Let s explore Yahoo s data! Dora the Data Explorer has a new
Bar Graphs and Dot Plots
 CONDENSED L E S S O N 1.1 Bar Graphs and Dot Plots In this lesson you will interpret and create a variety of graphs find some summary values for a data set draw conclusions about a data set based on graphs
Creating Charts in Microsoft Excel A supplement to Chapter 5 of Quantitative Approaches in Business Studies
 Creating Charts in Microsoft Excel A supplement to Chapter 5 of Quantitative Approaches in Business Studies Components of a Chart 1 Chart types 2 Data tables 4 The Chart Wizard 5 Column Charts 7 Line charts
Integration of Cluster Analysis and Visualization Techniques for Visual Data Analysis
 Integration of Cluster Analysis and Visualization Techniques for Visual Data Analysis M. Kreuseler, T. Nocke, H. Schumann, Institute of Computer Graphics University of Rostock, D-18059 Rostock, Germany
Pushing the limit in Visual Data Exploration: Techniques and Applications
 Pushing the limit in Visual Data Exploration: Techniques and Applications Daniel A. Keim 1, Christian Panse 1, Jörn Schneidewind 1, Mike Sips 1, Ming C. Hao 2, and Umeshwar Dayal 2 1 University of Konstanz,
This file contains 2 years of our interlibrary loan transactions downloaded from ILLiad. 70,000+ rows, multiple fields = an ideal file for pivot
 Presented at the Southeastern Library Assessment Conference, October 22, 2013 1 2 3 This file contains 2 years of our interlibrary loan transactions downloaded from ILLiad. 70,000+ rows, multiple fields
Extend Table Lens for High-Dimensional Data Visualization and Classification Mining
 Extend Table Lens for High-Dimensional Data Visualization and Classification Mining CPSC 533c, Information Visualization Course Project, Term 2 2003 Fengdong Du fdu@cs.ubc.ca University of British Columbia
Self-Portrait Steps Images taken from Andrew Loomis Drawing Head & Hands (there are many sites to download this out of print book for free)
") Self-Portrait Steps Images taken from Andrew Loomis Drawing Head & Hands (there are many sites to download this out of print book for free) First of all- put the idea of it doesn t look like me! out of
Self-Portrait Steps Images taken from Andrew Loomis Drawing Head & Hands (there are many sites to download this out of print book for free) First of all- put the idea of it doesn t look like me! out of
CSU, Fresno - Institutional Research, Assessment and Planning - Dmitri Rogulkin
 My presentation is about data visualization. How to use visual graphs and charts in order to explore data, discover meaning and report findings. The goal is to show that visual displays can be very effective
Data Visualization - A Very Rough Guide
 Data Visualization - A Very Rough Guide Ken Brodlie University of Leeds 1 What is This Thing Called Visualization? Visualization Use of computersupported, interactive, visual representations of data to
Describing, Exploring, and Comparing Data
 24 Chapter 2. Describing, Exploring, and Comparing Data Chapter 2. Describing, Exploring, and Comparing Data There are many tools used in Statistics to visualize, summarize, and describe data. This chapter
The North Carolina Health Data Explorer
 1 The North Carolina Health Data Explorer The Health Data Explorer provides access to health data for North Carolina counties in an interactive, user-friendly atlas of maps, tables, and charts. It allows
The Forgotten JMP Visualizations (Plus Some New Views in JMP 9) Sam Gardner, SAS Institute, Lafayette, IN, USA
 Sam Gardner, SAS Institute, Lafayette, IN, USA") Paper 156-2010 The Forgotten JMP Visualizations (Plus Some New Views in JMP 9) Sam Gardner, SAS Institute, Lafayette, IN, USA Abstract JMP has a rich set of visual displays that can help you see the information
Paper 156-2010 The Forgotten JMP Visualizations (Plus Some New Views in JMP 9) Sam Gardner, SAS Institute, Lafayette, IN, USA Abstract JMP has a rich set of visual displays that can help you see the information
Welcome to CorelDRAW, a comprehensive vector-based drawing and graphic-design program for the graphics professional.
 Workspace tour Welcome to CorelDRAW, a comprehensive vector-based drawing and graphic-design program for the graphics professional. In this tutorial, you will become familiar with the terminology and workspace
Lecture 2: Descriptive Statistics and Exploratory Data Analysis
 Lecture 2: Descriptive Statistics and Exploratory Data Analysis Further Thoughts on Experimental Design 16 Individuals (8 each from two populations) with replicates Pop 1 Pop 2 Randomly sample 4 individuals
Visualizing High-density Clusters in Multidimensional Data
 Visualizing High-density Clusters in Multidimensional Data Tran Van Long A thesis submitted in partial fulfilment of the requirements for the degree of Doctor of Philosophy in Computer Science Approved,
Elements of a graph. Click on the links below to jump directly to the relevant section
 Click on the links below to jump directly to the relevant section Elements of a graph Linear equations and their graphs What is slope? Slope and y-intercept in the equation of a line Comparing lines on
Interactive Excel Spreadsheets:
 Interactive Excel Spreadsheets: Constructing Visualization Tools to Enhance Your Learner-centered Math and Science Classroom Scott A. Sinex Department of Physical Sciences and Engineering Prince George
Part 1: Background - Graphing
 Department of Physics and Geology Graphing Astronomy 1401 Equipment Needed Qty Computer with Data Studio Software 1 1.1 Graphing Part 1: Background - Graphing In science it is very important to find and
Algebra 2 Chapter 1 Vocabulary. identity - A statement that equates two equivalent expressions.
 Chapter 1 Vocabulary identity - A statement that equates two equivalent expressions. verbal model- A word equation that represents a real-life problem. algebraic expression - An expression with variables.
Scope and Sequence KA KB 1A 1B 2A 2B 3A 3B 4A 4B 5A 5B 6A 6B
 Scope and Sequence Earlybird Kindergarten, Standards Edition Primary Mathematics, Standards Edition Copyright 2008 [SingaporeMath.com Inc.] The check mark indicates where the topic is first introduced
Data Visualization. Prepared by Francisco Olivera, Ph.D., Srikanth Koka Department of Civil Engineering Texas A&M University February 2004
 Data Visualization Prepared by Francisco Olivera, Ph.D., Srikanth Koka Department of Civil Engineering Texas A&M University February 2004 Contents Brief Overview of ArcMap Goals of the Exercise Computer
Visual Data Mining. Motivation. Why Visual Data Mining. Integration of visualization and data mining : Chidroop Madhavarapu CSE 591:Visual Analytics
 Motivation Visual Data Mining Visualization for Data Mining Huge amounts of information Limited display capacity of output devices Chidroop Madhavarapu CSE 591:Visual Analytics Visual Data Mining (VDM)
Using SPSS, Chapter 2: Descriptive Statistics
 1 Using SPSS, Chapter 2: Descriptive Statistics Chapters 2.1 & 2.2 Descriptive Statistics 2 Mean, Standard Deviation, Variance, Range, Minimum, Maximum 2 Mean, Median, Mode, Standard Deviation, Variance,
Vector Notation: AB represents the vector from point A to point B on a graph. The vector can be computed by B A.
 1 Linear Transformations Prepared by: Robin Michelle King A transformation of an object is a change in position or dimension (or both) of the object. The resulting object after the transformation is called
Tutorial 3: Graphics and Exploratory Data Analysis in R Jason Pienaar and Tom Miller
 Tutorial 3: Graphics and Exploratory Data Analysis in R Jason Pienaar and Tom Miller Getting to know the data An important first step before performing any kind of statistical analysis is to familiarize
Dealing with Data in Excel 2010
 Dealing with Data in Excel 2010 Excel provides the ability to do computations and graphing of data. Here we provide the basics and some advanced capabilities available in Excel that are useful for dealing
MULTI-DIMENSIONAL VISUALIZATION OF PROJECT CONTROL DATA
 MULTI-DIMENSIONAL VISUALIZATION OF PROJECT CONTROL DATA Anthony D. Songer 1, Benjamin Hays 2, and Christopher North 3 ABSTRACT: The construction industry produces voluminous quantitative data. Much of
SuperViz: An Interactive Visualization of Super-Peer P2P Network
 SuperViz: An Interactive Visualization of Super-Peer P2P Network Anthony (Peiqun) Yu pqyu@cs.ubc.ca Abstract: The Efficient Clustered Super-Peer P2P network is a novel P2P architecture, which overcomes
Pennsylvania System of School Assessment
 Pennsylvania System of School Assessment The Assessment Anchors, as defined by the Eligible Content, are organized into cohesive blueprints, each structured with a common labeling system that can be read