Hierarchical Data Visualization
|
|
|
- Justin Payne
- 10 years ago
- Views:
Transcription
1 Hierarchical Data Visualization 1 Hierarchical Data Hierarchical data emphasize the subordinate or membership relations between data items. Organizational Chart Classifications / Taxonomies (Species and subspecies) Information storage (file structure) Logical inference: decision tree Etc. 2 1
 Information storage (file structure) Logical inference:")
2 Organizational Chart 3 Family trees, tournament, etc. 4 2

3 Hierarchical Data Representation Special type of graph (tree): G={V,E} Acyclic (no loop or cycle) Rooted Each sub-graph is also a tree Challenging for large dataset Visual display and spatial layout of edges and nodes. Interactivity for data exploration 5 6 3

4 Hierarchical Data Visualization Techniques Node-Link Diagrams Orthogonal layout Traditional Layout Radial Layout Space-Filling Treemap Voronoi Treemap Hybrid Techniques Which technique to use Reading: People read faster by scanning in lines (not arcs!) Convention: Does the application domain have established conventions? Designs with multiple visual components How much screen real-estate do you give the tree? 8 4
 Convention: Does the application domain have established conventions?")
5 Node-Link Diagrams Orthogonal layout Indented Layout Dentrogram Icicle Traditional Layout 2D 3D : ConeTrees Radial layout Radial diagram Sunburst diagram Hyperbolic trees 9 Orthogonal Layout Nodes are horizontally or vertically aligned Easy to implement Visually more intuitive For large dataset, the layout can be imbalanced. 10 5

6 Indented Layout Child nodes placed below parent and indented Height expands and shrinks Compact width Breadth and depth fight for space resource Often used to navigate file systems Difficult to see all nodes of a specific level: losing context 11 Easy to implement Good for Searching, Bad for Structure Can use text file (or html) 12 6

7 File Systems 13 Dendrogram A branching diagram representing a hierarchy of categories based on degree of similarity. All leaves at bottom of diagram Edges usually drawn with sharp corners Often used to illustrate the arrangement of the clusters by hierarchical clustering. 14 7

8 Dendrogram: Gene Clustering

9 Heatmap and Dendrogram 17 Icicle Tree Edges implied by adjacency and spatial relationships. 18 9

10 Icicle Trees 19 Traditional Node-Link Layout Allocate Space proportional to # of Children at Different Levels 10

11 Exponential Growth of Nodes Branching = 3 Levels Base Width = B L - 1 Manage exponential growth of nodes Use 3D to linearize problem width fixed Use Slow IN / OUT animation of object or point of interest to create Object Constancy Location Slow IN / OUT linear Time 11

12 3D ConeTree Combining 3D display and 2D projection. Extending available viewing space to 3D. 3D Animation to reduce perception cost. Difficult for large trees Need 3D interaction 24 12

13 Cone Tree : file system example 25 13

14 Radial Layout Root at the center Nodes of different levels are placed on circles of different radii. More effective use of space: more nodes at deeper levels (hence more space) 27 Radial Layout examples 28 14
 27 Radial Layout examples")
15 American Heritage Dictionary SunBurst: Radial Version of Icicle Tree 15

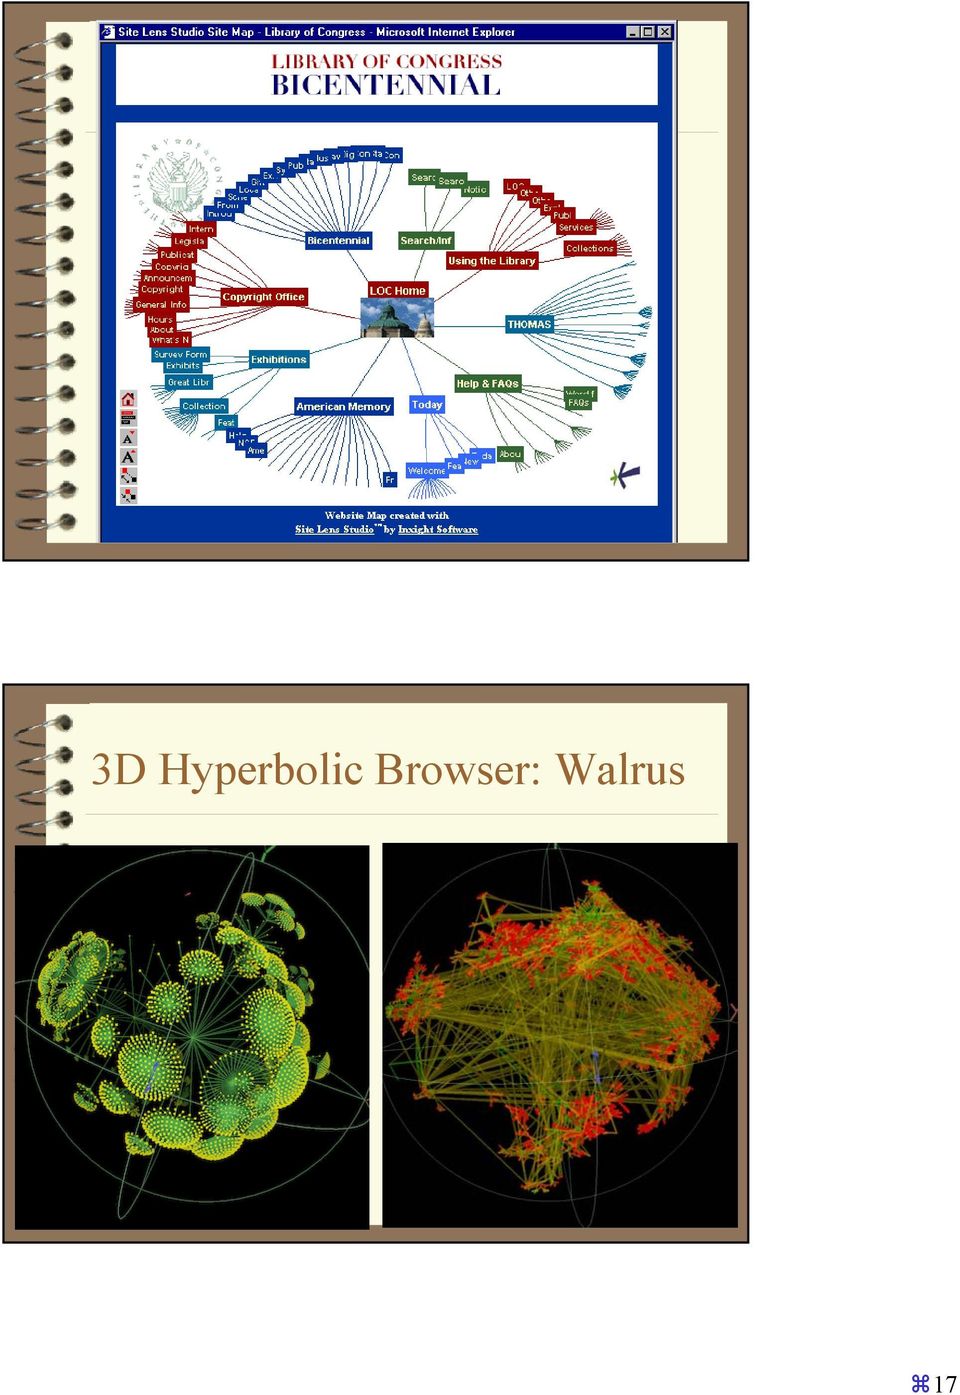
16 Hyperbolic Trees Employs hyperbolic space, which intrinsically has more room Similar to radial layout, but outer levels are shrunk according to a hyperbolic formula. Can re-focus : focus+context approach Difficult to accurately place nodes due to the nonlinear hyperbolic mapping 31 16

17 3D Hyperbolic Browser: Walrus 17
18 35 Space Filling Techniques Containment relationship Treemaps, Voronoi Treemaps 36 18

19 Treemaps: Slice & Dice Partition screen space hierarchically. Alternate x- and y-partitions, with important attribute used first. Content is represented using Area Color may correspond to an additional attribute Suitable to get an overview over large amounts of hierarchical data (e.g., file system) and for data with multiple ordinal attributes (e.g., census data) 37 Treemap 38 19
 and for data with multiple ordinal attributes (e.")
20 Treemap Algorithm Calculate sizes: Recurse to children My size = sum children sizes Draw Treemap (node, space, direction) Draw node rectangle in space Alternate direction For each child: Calculate child space as % of node space using size and direction Draw Treemap (child, child space, direction) 20

21 Treemaps Nested vs. Non-nested Non-nested Tree-Map Nested Tree-Map 42 21
22 Treemap : file system 43 Squarified layout 44 22
23 Slice-and-dice Ordered, very bad aspect ratios Squarified Unordered best aspect ratios 45 Tree maps for categorical data Categorical data do not have natural hierarchy. Building hierarchy for categories is critical Higher levels in the hierarchy for more important categories Example: Real estate data. Location, Property Type, Price, etc
24 London Real Estate Transaction 47 Treemaps Shading 24
25 Treemaps 1,000,000 items 50 25
26 Voronoi Treemaps Dividing space using arbitrary polygons Based on Voronoi tessellations 51 Voronoi vs. Slice-and-Dice vs. Squarified 52 26
27 US Consumer Expenditures 53 Hybrid Techniques: Elastic Hierarchy Combining Node-link diagrams and treemaps 54 27
28 55 InfoCube : file system example 56 28
29 Botanical Visualization of Huge Hierarchies 29
30 Focus+Context Interaction Nonlinear Magnification Fisheye Views Focus+Context 30
31 Treemap Interaction 31
Hierarchy and Tree Visualization
 Hierarchy and Tree Visualization Definition Hierarchies An ordering of groups in which larger groups encompass sets of smaller groups. Data repository in which cases are related to subcases Hierarchical
Hierarchical Data Visualization. Ai Nakatani IAT 814 February 21, 2007
 Hierarchical Data Visualization Ai Nakatani IAT 814 February 21, 2007 Introduction Hierarchical Data Directory structure Genealogy trees Biological taxonomy Business structure Project structure Challenges
7. Hierarchies & Trees Visualizing topological relations
 7. Hierarchies & Trees Visualizing topological relations Vorlesung Informationsvisualisierung Prof. Dr. Andreas Butz, WS 2011/12 Konzept und Basis für n: Thorsten Büring 1 Outline Hierarchical data and
VISUALIZING HIERARCHICAL DATA. Graham Wills SPSS Inc., http://willsfamily.org/gwills
 VISUALIZING HIERARCHICAL DATA Graham Wills SPSS Inc., http://willsfamily.org/gwills SYNONYMS Hierarchical Graph Layout, Visualizing Trees, Tree Drawing, Information Visualization on Hierarchies; Hierarchical
HierarchyMap: A Novel Approach to Treemap Visualization of Hierarchical Data
 P a g e 77 Vol. 9 Issue 5 (Ver 2.0), January 2010 Global Journal of Computer Science and Technology HierarchyMap: A Novel Approach to Treemap Visualization of Hierarchical Data Abstract- The HierarchyMap
Space-filling Techniques in Visualizing Output from Computer Based Economic Models
 Space-filling Techniques in Visualizing Output from Computer Based Economic Models Richard Webber a, Ric D. Herbert b and Wei Jiang bc a National ICT Australia Limited, Locked Bag 9013, Alexandria, NSW
Introduction of Information Visualization and Visual Analytics. Chapter 7. Trees and Graphs Visualization
 Introduction of Information Visualization and Visual Analytics Chapter 7 Trees and Graphs Visualization Overview! Motivation! Trees Visualization! Graphs Visualization 1 Motivation! Often datasets contain
Squarified Treemaps. Mark Bruls, Kees Huizing, and Jarke J. van Wijk
 Squarified Treemaps Mark Bruls, Kees Huizing, and Jarke J. van Wijk Eindhoven University of Technology Dept. of Mathematics and Computer Science, P.O. Box 513, 500 MB Eindhoven, The Netherlands emailfkeesh,
Treemaps for Search-Tree Visualization
 Treemaps for Search-Tree Visualization Rémi Coulom July, 2002 Abstract Large Alpha-Beta search trees generated by game-playing programs are hard to represent graphically. This paper describes how treemaps
Agenda. TreeMaps. What is a Treemap? Basics
 Agenda TreeMaps What is a Treemap? Treemap Basics Original Treemap Algorithm (Slice-and-dice layout) Issues for Treemaps Cushion Treemaps Squarified Treemaps Ordered Treemaps Quantum Treemaps Other Treemaps
Visualizing Large Graphs with Compound-Fisheye Views and Treemaps
 Visualizing Large Graphs with Compound-Fisheye Views and Treemaps James Abello 1, Stephen G. Kobourov 2, and Roman Yusufov 2 1 DIMACS Center Rutgers University {abello}@dimacs.rutgers.edu 2 Department
Voronoi Treemaps in D3
 Voronoi Treemaps in D3 Peter Henry University of Washington [email protected] Paul Vines University of Washington [email protected] ABSTRACT Voronoi treemaps are an alternative to traditional rectangular
Visualization Techniques in Data Mining
 Tecniche di Apprendimento Automatico per Applicazioni di Data Mining Visualization Techniques in Data Mining Prof. Pier Luca Lanzi Laurea in Ingegneria Informatica Politecnico di Milano Polo di Milano
Tree Visualization with Tree-Maps: 2-d Space-Filling Approach
 I THE INTERACTION TECHNIQUE NOTEBOOK I Tree Visualization with Tree-Maps: 2-d Space-Filling Approach Ben Shneiderman University of Maryland Introduction. The traditional approach to representing tree structures
Rendering Hierarchical Data
 Rendering Hierarchical Data Jarke J. van Wijk, Frank van Ham, and Huub van de Wetering Why is my hard disk full? A question no doubt familiar to many readers, and one that has inspired our research for
Ordered Treemap Layouts
 Ordered Treemap Layouts Ben Shneiderman Department of Computer Science, Human-Computer Interaction Lab, Insitute for Advanced Computer Studies & Institute for Systems Research University of Maryland [email protected]
CS171 Visualization. The Visualization Alphabet: Marks and Channels. Alexander Lex [email protected]. [xkcd]
![CS171 Visualization. The Visualization Alphabet: Marks and Channels. Alexander Lex alex@seas.harvard.edu. [xkcd]](/thumbs/39/19465011.jpg "CS171 Visualization. The Visualization Alphabet: Marks and Channels. Alexander Lex alex@seas.harvard.edu. [xkcd]") CS171 Visualization Alexander Lex [email protected] The Visualization Alphabet: Marks and Channels [xkcd] This Week Thursday: Task Abstraction, Validation Homework 1 due on Friday! Any more problems
CS171 Visualization Alexander Lex [email protected] The Visualization Alphabet: Marks and Channels [xkcd] This Week Thursday: Task Abstraction, Validation Homework 1 due on Friday! Any more problems
Evaluating the Effectiveness of Tree Visualization Systems for Knowledge Discovery
 Eurographics/ IEEE-VGTC Symposium on Visualization (2006) Thomas Ertl, Ken Joy, and Beatriz Santos (Editors) Evaluating the Effectiveness of Tree Visualization Systems for Knowledge Discovery Yue Wang
Regular TreeMap Layouts for Visual Analysis of Hierarchical Data
 Regular TreeMap Layouts for Visual Analysis of Hierarchical Data Tobias Schreck Daniel Keim Florian Mansmann Databases and Visualization Group University of Konstanz, Germany {schreck,keim,mansmann}@inf.uni-konstanz.de
Improvements of Space-Optimized Tree for Visualizing and Manipulating Very Large Hierarchies
 Improvements of Space-Optimized Tree for Visualizing and Manipulating Very Large Hierarchies Quang Vinh Nguyen and Mao Lin Huang Faculty of Information Technology University of Technology, Sydney, Australia
Graph/Network Visualization
 Graph/Network Visualization Data model: graph structures (relations, knowledge) and networks. Applications: Telecommunication systems, Internet and WWW, Retailers distribution networks knowledge representation
Elastic Hierarchies: Combining Treemaps and Node-Link Diagrams
 Elastic Hierarchies: Combining Treemaps and Node-Link Diagrams Shengdong Zhao 1 University of Toronto Michael J. McGuffin 2 University of Toronto Mark H. Chignell 3 University of Toronto Node Link Diagram
Clustering & Visualization
 Chapter 5 Clustering & Visualization Clustering in high-dimensional databases is an important problem and there are a number of different clustering paradigms which are applicable to high-dimensional data.
The course: An Introduction to Information Visualization Techniques for Exploring Large Database
 The course: An Introduction to Information Visualization Techniques for Exploring Large Database Jing Yang Fall 2006 www.cs.uncc.edu/~jyang13 1 Multi-dimensional Data Visualization 2 1 Parallel Coordinates
Cascaded Treemaps: Examining the Visibility and Stability of Structure in Treemaps
 Cascaded Treemaps: Examining the Visibility and Stability of Structure in Treemaps Hao Lü and James Fogarty Computer Science & Engineering DUB Group University of Washington { hlv, jfogarty }@cs.washington.edu
Visualization methods for patent data
 Visualization methods for patent data Treparel 2013 Dr. Anton Heijs (CTO & Founder) Delft, The Netherlands Introduction Treparel can provide advanced visualizations for patent data. This document describes
6.3 Treemaps: a space-filling approach to the visualization of hierarchical information structures
 Sparks of Innovation in Human-Computer Interaction, 275 B. Shneiderman, Ed., Ablex Publ., Norwood, NJ (1993) 6.3 Treemaps: a space-filling approach to the visualization of hierarchical information structures
BIG DATA VISUALIZATION. Team Impossible Peter Vilim, Sruthi Mayuram Krithivasan, Matt Burrough, and Ismini Lourentzou
 BIG DATA VISUALIZATION Team Impossible Peter Vilim, Sruthi Mayuram Krithivasan, Matt Burrough, and Ismini Lourentzou Let s begin with a story Let s explore Yahoo s data! Dora the Data Explorer has a new
Software Analysis Visualization
 28th International Conference on Software Engineering Software Analysis Visualization Harald Gall and Michele Lanza !oftware Visualiza"o# Tutorial F7 Software Evolution: Analysis and Visualization 2006
Data Visualization. or Graphical Data Presentation. Jerzy Stefanowski Instytut Informatyki
 Data Visualization or Graphical Data Presentation Jerzy Stefanowski Instytut Informatyki Data mining for SE -- 2013 Ack. Inspirations are coming from: G.Piatetsky Schapiro lectures on KDD J.Han on Data
Big Data: Rethinking Text Visualization
 Big Data: Rethinking Text Visualization Dr. Anton Heijs [email protected] Treparel April 8, 2013 Abstract In this white paper we discuss text visualization approaches and how these are important
Degree-of-Interest Trees: A Component of an Attention-Reactive User Interface
 Degree-of-Interest Trees: A Component of an Attention-Reactive User Interface Stuart K. Card, David Nation Palo Alto Research Center 3333 Coyote Hill Road Palo Alto, California 94304 USA [email protected],
Treemaps with bounded aspect ratio
 technische universiteit eindhoven Department of Mathematics and Computer Science Master s Thesis Treemaps with bounded aspect ratio by Vincent van der Weele Supervisor dr. B. Speckmann Eindhoven, July
Information Visualization Multivariate Data Visualization Krešimir Matković
 Information Visualization Multivariate Data Visualization Krešimir Matković Vienna University of Technology, VRVis Research Center, Vienna Multivariable >3D Data Tables have so many variables that orthogonal
Visualizing Web Navigation Data with Polygon Graphs
 Visualizing Web Navigation Data with Polygon Graphs Jiyang Chen, Tong Zheng, William Thorne, Daniel Huntley, Osmar R. Zaïane and Randy Goebel Department of Computing Science University of Alberta, Edmonton,
By LaBRI INRIA Information Visualization Team
 By LaBRI INRIA Information Visualization Team Tulip 2011 version 3.5.0 Tulip is an information visualization framework dedicated to the analysis and visualization of data. Tulip aims to provide the developer
Interactive Exploration of Decision Tree Results
 Interactive Exploration of Decision Tree Results 1 IRISA Campus de Beaulieu F35042 Rennes Cedex, France (email: pnguyenk,[email protected]) 2 INRIA Futurs L.R.I., University Paris-Sud F91405 ORSAY Cedex,
Cabinet Tree: An Orthogonal Enclosure Approach to Visualizing and Exploring Big Data
 Cabinet Tree: An Orthogonal Enclosure Approach to Visualizing and Exploring Big Data Yalong Yang 1 Kang Zhang 1,2 Quang Vinh Nguyen 3 Jianrong Wang 4 1 School of Computer Software, Tianjin University,
Cabinet Tree: an orthogonal enclosure approach to visualizing and exploring big data
 Yang et al. Journal of Big Data DOI 10.1186/s40537-015-0022-3 RESEARCH Open Access Cabinet Tree: an orthogonal enclosure approach to visualizing and exploring big data Yalong Yang 2,3, Kang Zhang 4,JianrongWang
What is Visualization? Information Visualization An Overview. Information Visualization. Definitions
 What is Visualization? Information Visualization An Overview Jonathan I. Maletic, Ph.D. Computer Science Kent State University Visualize/Visualization: To form a mental image or vision of [some
Vector storage and access; algorithms in GIS. This is lecture 6
 Vector storage and access; algorithms in GIS This is lecture 6 Vector data storage and access Vectors are built from points, line and areas. (x,y) Surface: (x,y,z) Vector data access Access to vector
Voronoi Treemaps for the Visualization of Software Metrics
 Voronoi Treemaps for the Visualization of Software Metrics Michael Balzer University of Konstanz, Germany Oliver Deussen University of Konstanz, Germany Claus Lewerentz Brandenburg University of Technology
Visual Analysis of People s Calling Network from CDR data
 Visual Analysis of People s Calling Network from CDR data Category: Research Sloan Business School Media Lab Graduation Student Media Lab Staff Radial tree view of selected hierarchy and groups Media Lab
Diagrams and Graphs of Statistical Data
 Diagrams and Graphs of Statistical Data One of the most effective and interesting alternative way in which a statistical data may be presented is through diagrams and graphs. There are several ways in
All Visualizations Documentation
 All Visualizations Documentation All Visualizations Documentation 2 Copyright and Trademarks Licensed Materials - Property of IBM. Copyright IBM Corp. 2013 IBM, the IBM logo, and Cognos are trademarks
Interactive Data Mining and Visualization
 Interactive Data Mining and Visualization Zhitao Qiu Abstract: Interactive analysis introduces dynamic changes in Visualization. On another hand, advanced visualization can provide different perspectives
MultiExperiment Viewer Quickstart Guide
 MultiExperiment Viewer Quickstart Guide Table of Contents: I. Preface - 2 II. Installing MeV - 2 III. Opening a Data Set - 2 IV. Filtering - 6 V. Clustering a. HCL - 8 b. K-means - 11 VI. Modules a. T-test
DHL Data Mining Project. Customer Segmentation with Clustering
 DHL Data Mining Project Customer Segmentation with Clustering Timothy TAN Chee Yong Aditya Hridaya MISRA Jeffery JI Jun Yao 3/30/2010 DHL Data Mining Project Table of Contents Introduction to DHL and the
Hierarchical Edge Bundles: Visualization of Adjacency Relations in Hierarchical Data
 IEEE TRANSACTIONS ON VISUALIZATION AND COMPUTER GRAPHICS, VOL. 12, NO. 5, SEPTEMBER/OCTOBER 2006 741 Hierarchical Edge Bundles: Visualization of Adjacency Relations in Hierarchical Data Danny Holten Abstract
Decision Trees What Are They?
 Decision Trees What Are They? Introduction...1 Using Decision Trees with Other Modeling Approaches...5 Why Are Decision Trees So Useful?...8 Level of Measurement... 11 Introduction Decision trees are a
A Note on Space-Filling Visualizations and Space-Filling Curves
 A Note on Space-Filling Visualizations and Space-Filling Curves Martin Wattenberg, IBM Research ABSTRACT A recent line of treemap research has focused on layout algorithms that optimize properties such
3 Information Visualization
 3 Information Visualization 3.1 Motivation and Examples 3.2 Basics of Human Perception 3.3 Principles and Terminology 3.4 Standard Techniques for Visualization 3.5 Further Examples Ludwig-Maximilians-Universität
Hierarchical-temporal Data Visualization Using a Tree-ring Metaphor
 Hierarchical-temporal Data Visualization Using a Tree-ring Metaphor Roberto Therón Departamento de Informática y Automática, Universidad de Salamanca, Salamanca, 37008, Spain [email protected] Abstract. This
3D Interactive Information Visualization: Guidelines from experience and analysis of applications
 3D Interactive Information Visualization: Guidelines from experience and analysis of applications Richard Brath Visible Decisions Inc., 200 Front St. W. #2203, Toronto, Canada, [email protected] 1. EXPERT
Best Practices in Data Visualizations. Vihao Pham 2014
 Best Practices in Data Visualizations Vihao Pham 2014 Agenda Best Practices in Data Visualizations Why We Visualize Understanding Data Visualizations Enhancing Visualizations Visualization Considerations
Best Practices in Data Visualizations. Vihao Pham January 29, 2014
 Best Practices in Data Visualizations Vihao Pham January 29, 2014 Agenda Best Practices in Data Visualizations Why We Visualize Understanding Data Visualizations Enhancing Visualizations Visualization
NakeDB: Database Schema Visualization
 NAKEDB: DATABASE SCHEMA VISUALIZATION, APRIL 2008 1 NakeDB: Database Schema Visualization Luis Miguel Cortés-Peña, Yi Han, Neil Pradhan, Romain Rigaux Abstract Current database schema visualization tools
Visualizing Large, Complex Data
 Visualizing Large, Complex Data Outline Visualizing Large Scientific Simulation Data Importance-driven visualization Multidimensional filtering Visualizing Large Networks A layout method Filtering methods
Interactive Visual Analysis of the NSF Funding Information
 Interactive Visual Analysis of the NSF Funding Information Shixia Liu IBM China Research Lab Nan Cao IBM China Research Lab Hao Lv Shanghai Jiaotong University IBM China Research Lab ABSTRACT This paper
Random Map Generator v1.0 User s Guide
 Random Map Generator v1.0 User s Guide Jonathan Teutenberg 2003 1 Map Generation Overview...4 1.1 Command Line...4 1.2 Operation Flow...4 2 Map Initialisation...5 2.1 Initialisation Parameters...5 -w xxxxxxx...5
Data Structure [Question Bank]
![Data Structure [Question Bank]](/thumbs/40/21355705.jpg "Data Structure [Question Bank]") Unit I (Analysis of Algorithms) 1. What are algorithms and how they are useful? 2. Describe the factor on best algorithms depends on? 3. Differentiate: Correct & Incorrect Algorithms? 4. Write short note:
Unit I (Analysis of Algorithms) 1. What are algorithms and how they are useful? 2. Describe the factor on best algorithms depends on? 3. Differentiate: Correct & Incorrect Algorithms? 4. Write short note:
Visualizing Changes of Hierarchical Data using Treemaps
 286 IEEE TRANSACTIONS ON VISUALIZATION AND COMPUTER GRAPHICS, VOL. 3, NO. 6, NOVEMBER/DECEMBER 27 Visualizing Changes of Hierarchical Data using Treemaps Ying Tu and Han-Wei Shen Abstract While the treemap
Classifying Large Data Sets Using SVMs with Hierarchical Clusters. Presented by :Limou Wang
 Classifying Large Data Sets Using SVMs with Hierarchical Clusters Presented by :Limou Wang Overview SVM Overview Motivation Hierarchical micro-clustering algorithm Clustering-Based SVM (CB-SVM) Experimental
Geometry Unit 6 Areas and Perimeters
 Geometry Unit 6 Areas and Perimeters Name Lesson 8.1: Areas of Rectangle (and Square) and Parallelograms How do we measure areas? Area is measured in square units. The type of the square unit you choose
Hierarchical Clustering Analysis
 Hierarchical Clustering Analysis What is Hierarchical Clustering? Hierarchical clustering is used to group similar objects into clusters. In the beginning, each row and/or column is considered a cluster.
ONLINE FILE SHARING PALANIAPPAN RAMANATHAN. B.E., Annamalai University, India, 2004 A REPORT MASTER OF SCIENCE
 ONLINE FILE SHARING by PALANIAPPAN RAMANATHAN B.E., Annamalai University, India, 2004 A REPORT submitted in partial fulfillment of the requirements for the degree MASTER OF SCIENCE Department of Computing
Topic Maps Visualization
 Topic Maps Visualization Bénédicte Le Grand, Laboratoire d'informatique de Paris 6 Introduction Topic maps provide a bridge between the domains of knowledge representation and information management. Topics
Map-like Wikipedia Visualization. Pang Cheong Iao. Master of Science in Software Engineering
 Map-like Wikipedia Visualization by Pang Cheong Iao Master of Science in Software Engineering 2011 Faculty of Science and Technology University of Macau Map-like Wikipedia Visualization by Pang Cheong
Component visualization methods for large legacy software in C/C++
 Annales Mathematicae et Informaticae 44 (2015) pp. 23 33 http://ami.ektf.hu Component visualization methods for large legacy software in C/C++ Máté Cserép a, Dániel Krupp b a Eötvös Loránd University [email protected]
Software Engineering & Architecture
 Software Engineering & Architecture 11. QUALITY METRICS AND VISUALIZATION Martin Kropp University of Applied Sciences Northwestern Switzerland Institute for Mobile and Distributed Systems References Some
An example. Visualization? An example. Scientific Visualization. This talk. Information Visualization & Visual Analytics. 30 items, 30 x 3 values
 Information Visualization & Visual Analytics Jack van Wijk Technische Universiteit Eindhoven An example y 30 items, 30 x 3 values I-science for Astronomy, October 13-17, 2008 Lorentz center, Leiden x An
Common Core Unit Summary Grades 6 to 8
 Common Core Unit Summary Grades 6 to 8 Grade 8: Unit 1: Congruence and Similarity- 8G1-8G5 rotations reflections and translations,( RRT=congruence) understand congruence of 2 d figures after RRT Dilations
Hyperbolic Tree for Effective Visualization of Large Extensible Data Standards
 Hyperbolic Tree for Effective Visualization of Large Extensible Data Standards Research-in-Progress Yinghua Ma Shanghai Jiaotong University Hongwei Zhu Old Dominion University Guiyang SU Shanghai Jiaotong
A HYBRID APPROACH FOR AUTOMATED AREA AGGREGATION
 A HYBRID APPROACH FOR AUTOMATED AREA AGGREGATION Zeshen Wang ESRI 380 NewYork Street Redlands CA 92373 [email protected] ABSTRACT Automated area aggregation, which is widely needed for mapping both natural
MicroStrategy Analytics Express User Guide
 MicroStrategy Analytics Express User Guide Analyzing Data with MicroStrategy Analytics Express Version: 4.0 Document Number: 09770040 CONTENTS 1. Getting Started with MicroStrategy Analytics Express Introduction...
STAN. Structure Analysis for Java. Version 2. White Paper. Fall 2009
 STAN Structure Analysis for Java Version 2 White Paper Fall 2009 Abstract: This paper gives a brief introduction to structure analysis using STAN, a static code analysis tool bringing together Java development
ONTOLOGY VISUALIZATION PROTÉGÉ TOOLS A REVIEW
 ONTOLOGY VISUALIZATION PROTÉGÉ TOOLS A REVIEW R. Sivakumar 1 and P.V. Arivoli 2 1 Associate Professor, Department of Computer Science, A.V.V.M. Sri Pushpam College, Bharathidasan University, Trichirappalli,
Data Mining. Cluster Analysis: Advanced Concepts and Algorithms
 Data Mining Cluster Analysis: Advanced Concepts and Algorithms Tan,Steinbach, Kumar Introduction to Data Mining 4/18/2004 1 More Clustering Methods Prototype-based clustering Density-based clustering Graph-based
Visual Data Mining with Pixel-oriented Visualization Techniques
 Visual Data Mining with Pixel-oriented Visualization Techniques Mihael Ankerst The Boeing Company P.O. Box 3707 MC 7L-70, Seattle, WA 98124 [email protected] Abstract Pixel-oriented visualization
PHP Code Design. The data structure of a relational database can be represented with a Data Model diagram, also called an Entity-Relation diagram.
 PHP Code Design PHP is a server-side, open-source, HTML-embedded scripting language used to drive many of the world s most popular web sites. All major web servers support PHP enabling normal HMTL pages
GRADES 7, 8, AND 9 BIG IDEAS
 Table 1: Strand A: BIG IDEAS: MATH: NUMBER Introduce perfect squares, square roots, and all applications Introduce rational numbers (positive and negative) Introduce the meaning of negative exponents for
COC131 Data Mining - Clustering
 COC131 Data Mining - Clustering Martin D. Sykora [email protected] Tutorial 05, Friday 20th March 2009 1. Fire up Weka (Waikako Environment for Knowledge Analysis) software, launch the explorer window
Mathematics Cognitive Domains Framework: TIMSS 2003 Developmental Project Fourth and Eighth Grades
 Appendix A Mathematics Cognitive Domains Framework: TIMSS 2003 Developmental Project Fourth and Eighth Grades To respond correctly to TIMSS test items, students need to be familiar with the mathematics
Clustering. Data Mining. Abraham Otero. Data Mining. Agenda
 Clustering 1/46 Agenda Introduction Distance K-nearest neighbors Hierarchical clustering Quick reference 2/46 1 Introduction It seems logical that in a new situation we should act in a similar way as in
Multi-Dimensional Data Visualization. Slides courtesy of Chris North
 Multi-Dimensional Data Visualization Slides courtesy of Chris North What is the Cleveland s ranking for quantitative data among the visual variables: Angle, area, length, position, color Where are we?!