Hierarchy and Tree Visualization
|
|
|
- Jonathan Malone
- 8 years ago
- Views:
Transcription
1 Hierarchy and Tree Visualization

2 Definition Hierarchies An ordering of groups in which larger groups encompass sets of smaller groups. Data repository in which cases are related to subcases

3 Hierarchical Data Family histories, ancestries File/directory systems on computers Organization charts Object-oriented software classes Queen Victoria s Family Tree

4 Hierarchy Visualization Allow adequate space within nodes to display information Allow users to understand relationship between a node and its context Allow to find elements quickly Fit into a bounded region

5 Trees Hierarchies are often represented as trees Two major categories of tree visualization techniques Node-link diagram Visible graphical edge from parents to their children Space-filling

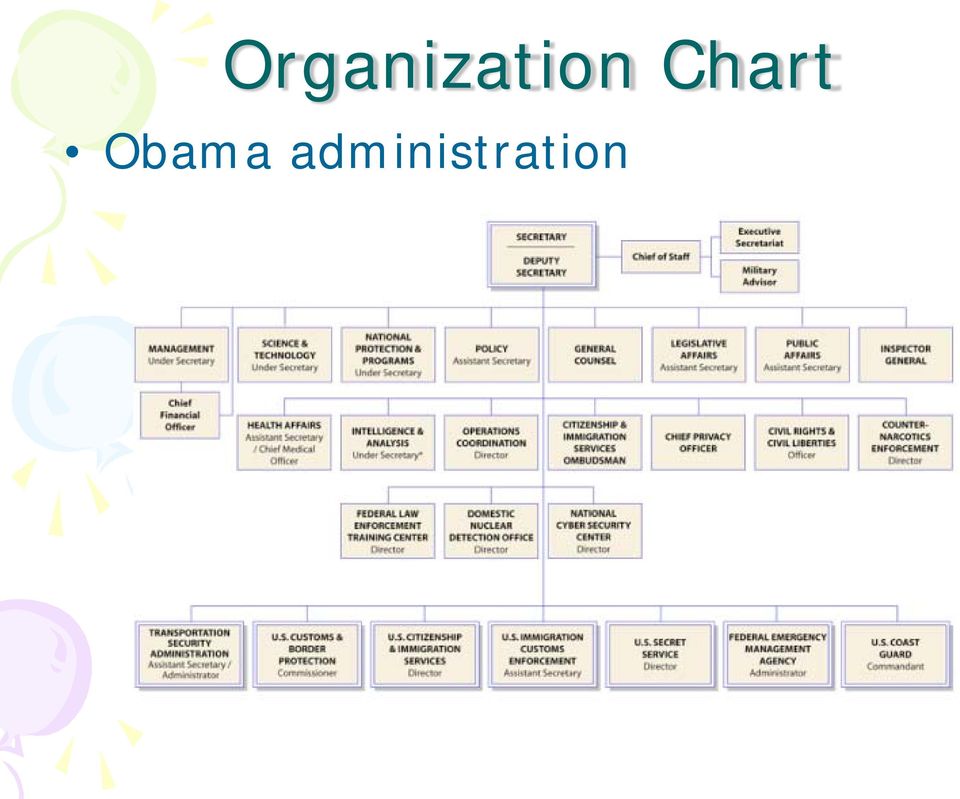
6 Node-Link Diagrams Root at top, leaves at bottom is very common

7 Different Styles

8 Windows Explorer A very popular visualization

9 Decision Tree Manual decision tree

10 Organization Chart Obama administration
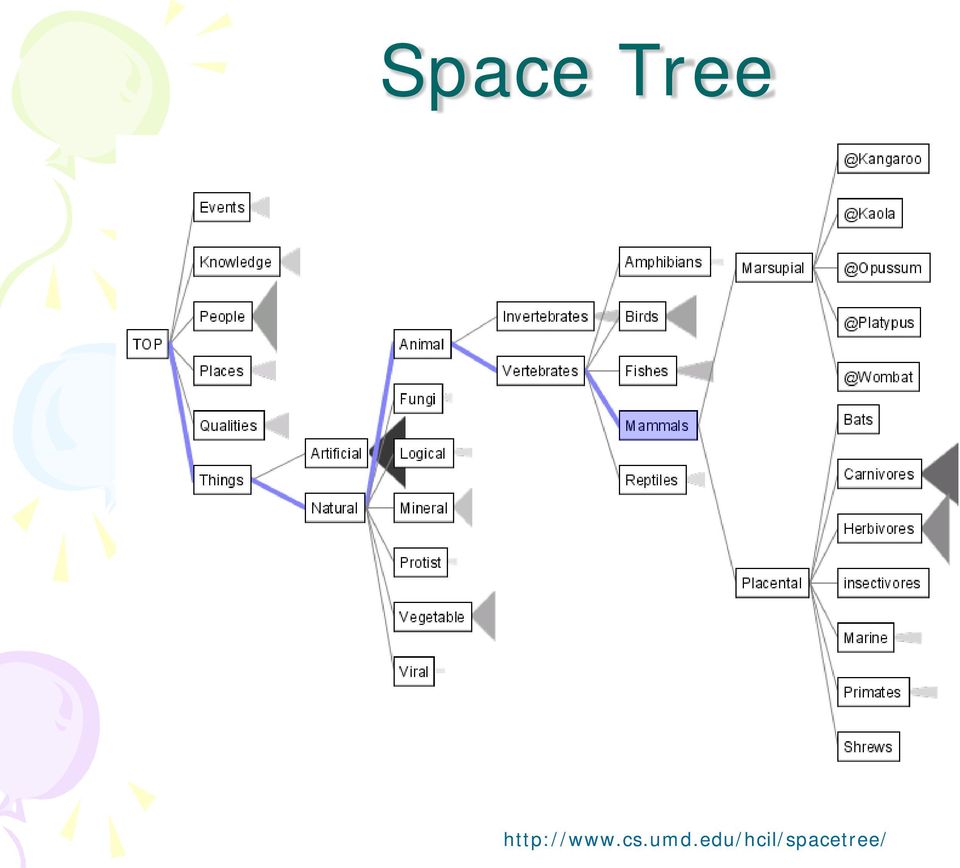
11 When there are lots of nodes Showing more attributes of data cases in hierarchy or focusing on particular applications of trees Interactive exploration

12 Space Tree
13 Why Put Root at Top or Left Root can be at center with levels growing outward too Any node might be the root From J. Stasko s slides

14 Radial View Tree Recursively position children of a subtree into circular wedges the central angle of these wedges are proportional to the number of leaves

15 Radial View Tree

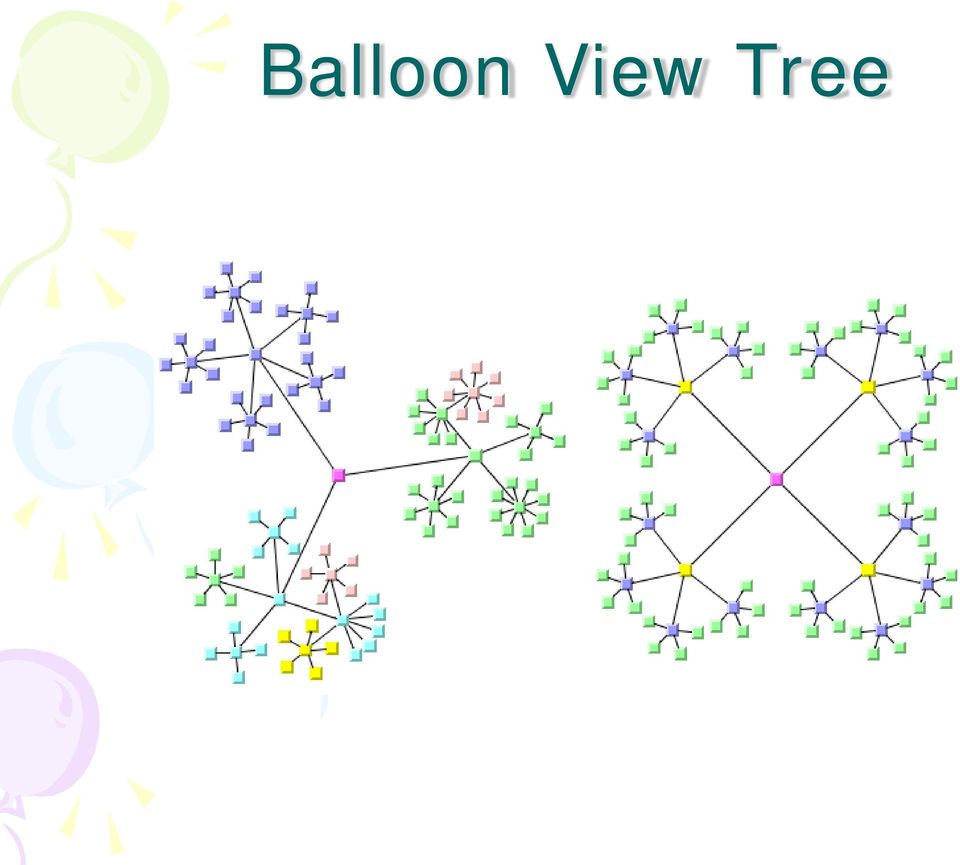
16 Balloon View Tree Siblings of sub-trees are included in circles attached to the father node Melancon, G., Herman, I.: Circular drawing of rooted trees. Reports of the Centre for Mathematics and Computer Sciences (CWI), INSR9817

17 Balloon View Tree
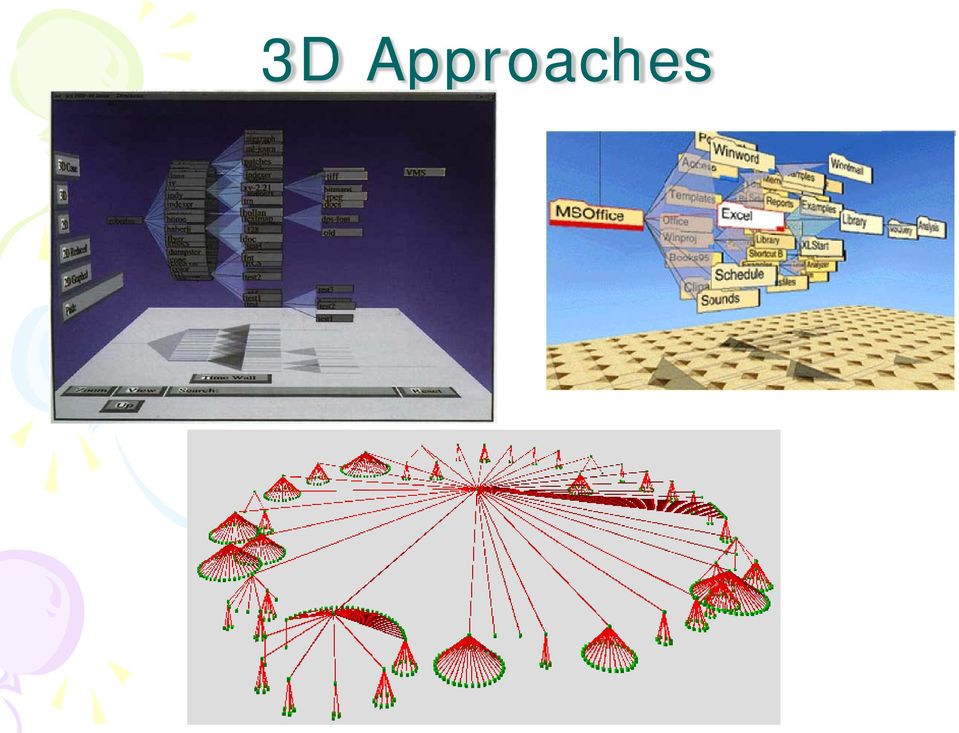
18 3D Approaches
19 Botanical Tree
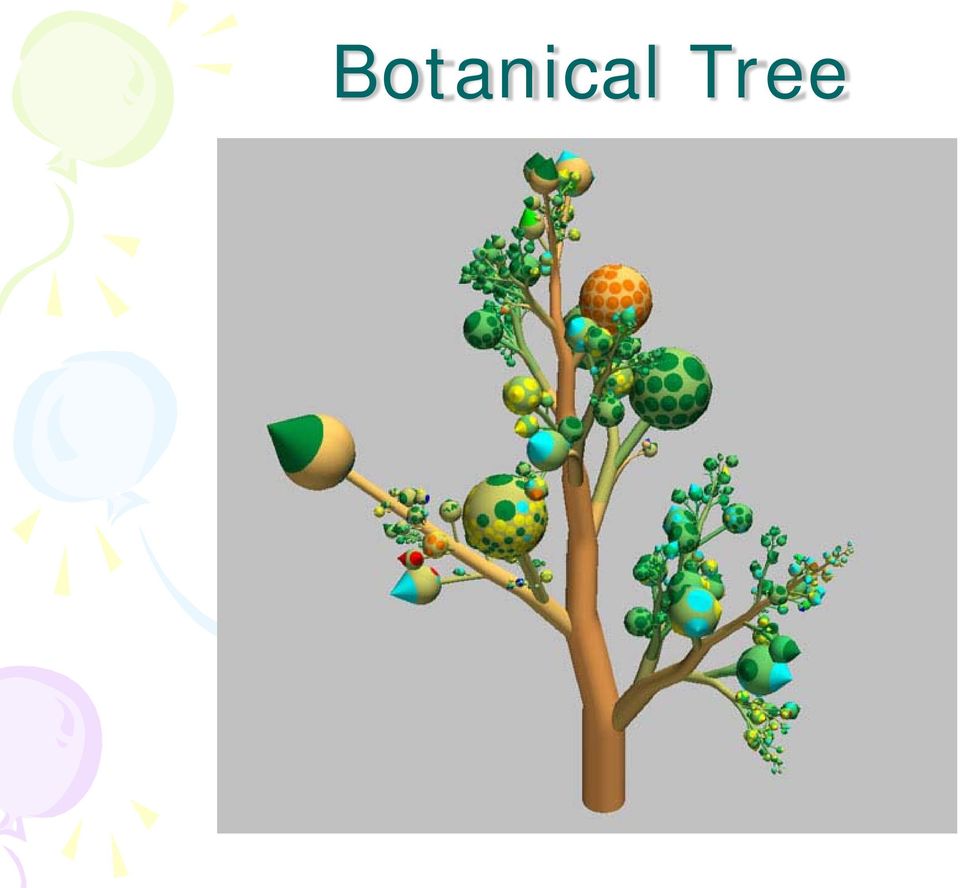
20 Pros Pros and Cons More effective area to lay out tree Use of smooth animation to help person track updates Aesthetically pleasing Cons 3D occlusion obscures some nodes Non-trivial to implement and requires some graphics horsepower

21 Collapsible Cylindrical Tree Basic idea: use a set of nested cylinders according to the telescope metaphor Limitation: one path is visible Interactions: rotation, go down/up Dachselt & Ebert Infovis 01
22 Hyperbolic Browser Find a space (hyperbolic space) that increases exponentially, lay the tree on it Transform from the hyperbolic space to 2D Euclidean space J. Lamping and R. Rao, The Hyperbolic Browser: A Focus + Context Technique for Visualizing Large Hierarchies, Journal of Visual Languages and Computing, vol. 7, no. 1, 1995, pp
23
24
25 Hyperbolic Browser
26 Hyperbolic Browser R. Spence. Information Visualization
27 Hyperbolic Browser Change Focus R. Spence. Information Visualization
28 Key Features Natural magnification (fisheye) in center Layout depends only on 2-3 generations from current node Smooth animation for change in focus Don t draw objects when far enough from root (simplify rendering)
29 Space-Filling Techniques Each item occupies an area Children are contained within parent
30 Visualization of Hierarchical Data by Circle Packing Tree visualization using nested circles Brother nodes represented by externally tangent circles Nodes at different levels displayed by using 2D nested circles or 3D nested cylinders W.Wang et al. CHI 2006
31 Circle Packing Visualization of a file system
32 Example Visualizing a class hierarchy of software
33 Treemap Children are drawn inside their parents Alternative horizontal and vertical slicing at each successive level Use area and color to encode node attributes B. Johnson, Ben Shneiderman: Tree maps: A Space-Filling Approach to the Visualization of Hierarchical Information Structures. IEEE Visualization 1991:
34 Treemap Very popular visualization tool -source-flex-component-treemap-2-1-0/
35 Treemap Features It is rectangular! It makes better use of space Good representation of two attributes beyond node-link: color and area Not as good at representing structure Can get long-thin aspect ratios What happens if it s a perfectly balanced tree of items all the same size?
36 Aspect ratios J. Stasko s slides
37 Showing Structure A tree with 698 node (from [Balzer:infovis2005])
38 Showing Structure Borderless treemap: hard to discern structure of hierarchy What happens if it s a perfectly balanced tree of items all the same size? Variations Use border Change rectangles to other forms
39 Nested vs. Non-nested
40 Nested Treemap Borders help on small trees, but take up too much area on large, deep ones
41 Cushion Treemap Add shading and texture Van Wijk and Van de Wetering InfoVis 99
42 Voronoi Treemaps Enable subdivisions of and in polygons Fit into areas of arbitrary shape balzer:infovis05
43 Treemap Applications Software visualization Multimedia visualization Tennis matches File/directory structures Basketball statistics Stocks and portfolios
44 Marketmap
45 Internet News Groups the Usenet newsgroup discussion community space generated by the Netscan system at Microsoft Research
46 Photemesa Image browser
47 Major References Jing Yang, Lecture notes, UNCC Colin Ware. Information visualization, 2004 Daniel Keim. Tutorial note in InfoVis 2000 John Stasko. Course slides, Fall 2005
Hierarchical Data Visualization
 Hierarchical Data Visualization 1 Hierarchical Data Hierarchical data emphasize the subordinate or membership relations between data items. Organizational Chart Classifications / Taxonomies (Species and
7. Hierarchies & Trees Visualizing topological relations
 7. Hierarchies & Trees Visualizing topological relations Vorlesung Informationsvisualisierung Prof. Dr. Andreas Butz, WS 2011/12 Konzept und Basis für n: Thorsten Büring 1 Outline Hierarchical data and
Introduction of Information Visualization and Visual Analytics. Chapter 7. Trees and Graphs Visualization
 Introduction of Information Visualization and Visual Analytics Chapter 7 Trees and Graphs Visualization Overview! Motivation! Trees Visualization! Graphs Visualization 1 Motivation! Often datasets contain
Space-filling Techniques in Visualizing Output from Computer Based Economic Models
 Space-filling Techniques in Visualizing Output from Computer Based Economic Models Richard Webber a, Ric D. Herbert b and Wei Jiang bc a National ICT Australia Limited, Locked Bag 9013, Alexandria, NSW
Agenda. TreeMaps. What is a Treemap? Basics
 Agenda TreeMaps What is a Treemap? Treemap Basics Original Treemap Algorithm (Slice-and-dice layout) Issues for Treemaps Cushion Treemaps Squarified Treemaps Ordered Treemaps Quantum Treemaps Other Treemaps
Cascaded Treemaps: Examining the Visibility and Stability of Structure in Treemaps
 Cascaded Treemaps: Examining the Visibility and Stability of Structure in Treemaps Hao Lü and James Fogarty Computer Science & Engineering DUB Group University of Washington { hlv, jfogarty }@cs.washington.edu
Improvements of Space-Optimized Tree for Visualizing and Manipulating Very Large Hierarchies
 Improvements of Space-Optimized Tree for Visualizing and Manipulating Very Large Hierarchies Quang Vinh Nguyen and Mao Lin Huang Faculty of Information Technology University of Technology, Sydney, Australia
HierarchyMap: A Novel Approach to Treemap Visualization of Hierarchical Data
 P a g e 77 Vol. 9 Issue 5 (Ver 2.0), January 2010 Global Journal of Computer Science and Technology HierarchyMap: A Novel Approach to Treemap Visualization of Hierarchical Data Abstract- The HierarchyMap
Rendering Hierarchical Data
 Rendering Hierarchical Data Jarke J. van Wijk, Frank van Ham, and Huub van de Wetering Why is my hard disk full? A question no doubt familiar to many readers, and one that has inspired our research for
Squarified Treemaps. Mark Bruls, Kees Huizing, and Jarke J. van Wijk
 Squarified Treemaps Mark Bruls, Kees Huizing, and Jarke J. van Wijk Eindhoven University of Technology Dept. of Mathematics and Computer Science, P.O. Box 513, 500 MB Eindhoven, The Netherlands emailfkeesh,
The course: An Introduction to Information Visualization Techniques for Exploring Large Database
 The course: An Introduction to Information Visualization Techniques for Exploring Large Database Jing Yang Fall 2006 www.cs.uncc.edu/~jyang13 1 Multi-dimensional Data Visualization 2 1 Parallel Coordinates
Visualization Techniques in Data Mining
 Tecniche di Apprendimento Automatico per Applicazioni di Data Mining Visualization Techniques in Data Mining Prof. Pier Luca Lanzi Laurea in Ingegneria Informatica Politecnico di Milano Polo di Milano
Hierarchical Data Visualization. Ai Nakatani IAT 814 February 21, 2007
 Hierarchical Data Visualization Ai Nakatani IAT 814 February 21, 2007 Introduction Hierarchical Data Directory structure Genealogy trees Biological taxonomy Business structure Project structure Challenges
Evaluating the Effectiveness of Tree Visualization Systems for Knowledge Discovery
 Eurographics/ IEEE-VGTC Symposium on Visualization (2006) Thomas Ertl, Ken Joy, and Beatriz Santos (Editors) Evaluating the Effectiveness of Tree Visualization Systems for Knowledge Discovery Yue Wang
Voronoi Treemaps in D3
 Voronoi Treemaps in D3 Peter Henry University of Washington phenry@gmail.com Paul Vines University of Washington paul.l.vines@gmail.com ABSTRACT Voronoi treemaps are an alternative to traditional rectangular
Treemaps for Search-Tree Visualization
 Treemaps for Search-Tree Visualization Rémi Coulom July, 2002 Abstract Large Alpha-Beta search trees generated by game-playing programs are hard to represent graphically. This paper describes how treemaps
Ordered Treemap Layouts
 Ordered Treemap Layouts Ben Shneiderman Department of Computer Science, Human-Computer Interaction Lab, Insitute for Advanced Computer Studies & Institute for Systems Research University of Maryland ben@cs.umd.edu
Regular TreeMap Layouts for Visual Analysis of Hierarchical Data
 Regular TreeMap Layouts for Visual Analysis of Hierarchical Data Tobias Schreck Daniel Keim Florian Mansmann Databases and Visualization Group University of Konstanz, Germany {schreck,keim,mansmann}@inf.uni-konstanz.de
Time Series Data Visualization
 Time Series Data Visualization Time Series Data Fundamental chronological component to the data set Random sample of 4000 graphics from 15 of world s newspapers and magazines from 74-80 found that 75%
VISUALIZING HIERARCHICAL DATA. Graham Wills SPSS Inc., http://willsfamily.org/gwills
 VISUALIZING HIERARCHICAL DATA Graham Wills SPSS Inc., http://willsfamily.org/gwills SYNONYMS Hierarchical Graph Layout, Visualizing Trees, Tree Drawing, Information Visualization on Hierarchies; Hierarchical
A Comparison of 2-D Visualizations of Hierarchies
 A Comparison of 2-D Visualizations of Hierarchies Todd Barlow Padraic Neville SAS Institute Inc. todd.barlow@sas.com padraic.neville@sas.com Abstract This paper describes two experiments that compare four
Information Visualization. Ronald Peikert SciVis 2007 - Information Visualization 10-1
 Information Visualization Ronald Peikert SciVis 2007 - Information Visualization 10-1 Overview Techniques for high-dimensional data scatter plots, PCA parallel coordinates link + brush pixel-oriented techniques
Visualizing Large Graphs with Compound-Fisheye Views and Treemaps
 Visualizing Large Graphs with Compound-Fisheye Views and Treemaps James Abello 1, Stephen G. Kobourov 2, and Roman Yusufov 2 1 DIMACS Center Rutgers University {abello}@dimacs.rutgers.edu 2 Department
Tree Visualization with Tree-Maps: 2-d Space-Filling Approach
 I THE INTERACTION TECHNIQUE NOTEBOOK I Tree Visualization with Tree-Maps: 2-d Space-Filling Approach Ben Shneiderman University of Maryland Introduction. The traditional approach to representing tree structures
Treemaps with bounded aspect ratio
 technische universiteit eindhoven Department of Mathematics and Computer Science Master s Thesis Treemaps with bounded aspect ratio by Vincent van der Weele Supervisor dr. B. Speckmann Eindhoven, July
Visualization of Software Metrics Marlena Compton Software Metrics SWE 6763 April 22, 2009
 Visualization of Software Metrics Marlena Compton Software Metrics SWE 6763 April 22, 2009 Abstract Visualizations are increasingly used to assess the quality of source code. One of the most well developed
Visualization of Software
 Visualization of Software Jack van Wijk Plenary Meeting SPIder Den Bosch, March 30, 2010 Overview Software Vis Examples Hierarchies Networks Evolution Visual Analytics Application data Visualization images
An example. Visualization? An example. Scientific Visualization. This talk. Information Visualization & Visual Analytics. 30 items, 30 x 3 values
 Information Visualization & Visual Analytics Jack van Wijk Technische Universiteit Eindhoven An example y 30 items, 30 x 3 values I-science for Astronomy, October 13-17, 2008 Lorentz center, Leiden x An
A Self-adaptive Treemap-based Technique for Visualizing Hierarchical Data in 3D
 Self-adaptive Treemap-based Technique for Visualizing Hierarchical Data in 3D bon Chaudhuri Han-Wei Shen Computer Science & Engineering The Ohio State University, US BSTRCT In this paper, we present a
6.3 Treemaps: a space-filling approach to the visualization of hierarchical information structures
 Sparks of Innovation in Human-Computer Interaction, 275 B. Shneiderman, Ed., Ablex Publ., Norwood, NJ (1993) 6.3 Treemaps: a space-filling approach to the visualization of hierarchical information structures
Cabinet Tree: An Orthogonal Enclosure Approach to Visualizing and Exploring Big Data
 Cabinet Tree: An Orthogonal Enclosure Approach to Visualizing and Exploring Big Data Yalong Yang 1 Kang Zhang 1,2 Quang Vinh Nguyen 3 Jianrong Wang 4 1 School of Computer Software, Tianjin University,
NakeDB: Database Schema Visualization
 NAKEDB: DATABASE SCHEMA VISUALIZATION, APRIL 2008 1 NakeDB: Database Schema Visualization Luis Miguel Cortés-Peña, Yi Han, Neil Pradhan, Romain Rigaux Abstract Current database schema visualization tools
Cushion Treemaps: Visualization of Hierarchical Information
 To be presented at the IEEE Symposium on Information Visualization (INFOVIS 99), San Francisco, October 25-26, 1999 Cushion Treemaps: Visualization of Hierarchical Information Jarke J. van Wijk Huub van
Interactive Exploration of Decision Tree Results
 Interactive Exploration of Decision Tree Results 1 IRISA Campus de Beaulieu F35042 Rennes Cedex, France (email: pnguyenk,amorin@irisa.fr) 2 INRIA Futurs L.R.I., University Paris-Sud F91405 ORSAY Cedex,
an introduction to VISUALIZING DATA by joel laumans
 an introduction to VISUALIZING DATA by joel laumans an introduction to VISUALIZING DATA iii AN INTRODUCTION TO VISUALIZING DATA by Joel Laumans Table of Contents 1 Introduction 1 Definition Purpose 2 Data
TECHNICAL REPORT. Extending Tree-Maps to Three Dimensions A Comparative Study. Thomas Bladh, David A. Carr, Jeremiah Scholl.
 2004:04 TECHNICAL REPORT Extending Tree-Maps to Three Dimensions A Comparative Study Thomas Bladh, David A. Carr, Jeremiah Scholl Technical Report Department of Computer Science and Electrical Engineering
Interactive Visual Analysis of the NSF Funding Information
 Interactive Visual Analysis of the NSF Funding Information Shixia Liu IBM China Research Lab Nan Cao IBM China Research Lab Hao Lv Shanghai Jiaotong University IBM China Research Lab ABSTRACT This paper
A Dual-View Visualization of In-Car Communication Processes
 A Dual-View Visualization of In-Car Communication Processes Michael Sedlmair, Wolfgang Hintermaier, Konrad Stocker, Thorsten Büring, Andreas Butz BMW Group Research and Technology, University of Munich,
Information Visualization Multivariate Data Visualization Krešimir Matković
 Information Visualization Multivariate Data Visualization Krešimir Matković Vienna University of Technology, VRVis Research Center, Vienna Multivariable >3D Data Tables have so many variables that orthogonal
3 Information Visualization
 3 Information Visualization 3.1 Motivation and Examples 3.2 Basics of Human Perception 3.3 Principles and Terminology 3.4 Standard Techniques for Visualization 3.5 Further Examples Ludwig-Maximilians-Universität
Hierarchical-temporal Data Visualization Using a Tree-ring Metaphor
 Hierarchical-temporal Data Visualization Using a Tree-ring Metaphor Roberto Therón Departamento de Informática y Automática, Universidad de Salamanca, Salamanca, 37008, Spain theron@usal.es Abstract. This
Voronoi Treemaps for the Visualization of Software Metrics
 Voronoi Treemaps for the Visualization of Software Metrics Michael Balzer University of Konstanz, Germany Oliver Deussen University of Konstanz, Germany Claus Lewerentz Brandenburg University of Technology
Graph/Network Visualization
 Graph/Network Visualization Data model: graph structures (relations, knowledge) and networks. Applications: Telecommunication systems, Internet and WWW, Retailers distribution networks knowledge representation
Graph Visualization and Navigation in Information Visualization: a Survey
 HERMAN ET AL.: GRAPH VISUALIZATION AND NAVIGATION IN INFORMATION VISUALIZATION 1 Graph Visualization and Navigation in Information Visualization: a Survey Ivan Herman, Member, IEEE CS Society, Guy Melançon,
Cabinet Tree: an orthogonal enclosure approach to visualizing and exploring big data
 Yang et al. Journal of Big Data DOI 10.1186/s40537-015-0022-3 RESEARCH Open Access Cabinet Tree: an orthogonal enclosure approach to visualizing and exploring big data Yalong Yang 2,3, Kang Zhang 4,JianrongWang
A Survey on Cabinet Tree Based Approach to Approach Visualizing and Exploring Big Data
 A Survey on Cabinet Tree Based Approach to Approach Visualizing and Exploring Big Data Sonali Rokade, Bharat Tidke PG Scholar, M.E., Dept. of Computer Network, Flora Institute of Technology, Pune, India
TREE-MAP: A VISUALIZATION TOOL FOR LARGE DATA
 TREE-MAP: A VISUALIZATION TOOL FOR LARGE DATA Mahipal Jadeja DA-IICT Gandhinagar,Gujarat India Tel:+91-9173535506 mahipaljadeja5@gmail.com Kesha Shah DA-IICT Gandhinagar,Gujarat India Tel:+91-7405217629
ONTOLOGY VISUALIZATION PROTÉGÉ TOOLS A REVIEW
 ONTOLOGY VISUALIZATION PROTÉGÉ TOOLS A REVIEW R. Sivakumar 1 and P.V. Arivoli 2 1 Associate Professor, Department of Computer Science, A.V.V.M. Sri Pushpam College, Bharathidasan University, Trichirappalli,
All Visualizations Documentation
 All Visualizations Documentation All Visualizations Documentation 2 Copyright and Trademarks Licensed Materials - Property of IBM. Copyright IBM Corp. 2013 IBM, the IBM logo, and Cognos are trademarks
Visualization of the Static aspects of Software: a survey
 Visualization of the Static aspects of Software: a survey Pierre Caserta, Olivier Zendra To cite this version: Pierre Caserta, Olivier Zendra. Visualization of the Static aspects of Software: a survey.
Degree-of-Interest Trees: A Component of an Attention-Reactive User Interface
 Degree-of-Interest Trees: A Component of an Attention-Reactive User Interface Stuart K. Card, David Nation Palo Alto Research Center 3333 Coyote Hill Road Palo Alto, California 94304 USA card@parc.com,
AN ABSTRACT OF THE THESIS OF. 20, 2008. Title: DiskGrapher: A Different Approach to Hard Drive Visualization for Mac
 AN ABSTRACT OF THE THESIS OF John Batch for the degree of Honors Baccalaureate of Science in Electrical and Computer Engineering and Honors Baccalaureate of Science in Computer Science presented on May
PowerPoint: Graphics and SmartArt
 PowerPoint: Graphics and SmartArt Contents Inserting Objects... 2 Picture from File... 2 Clip Art... 2 Shapes... 3 SmartArt... 3 WordArt... 3 Formatting Objects... 4 Move a picture, shape, text box, or
An evaluation of space-filling information visualizations for depicting hierarchical structures
 Int. J. Human-Computer Studies (2000) 53, 663}694 doi:10.1006/ijhc.2000.0420 Available online at http://www.idealibrary.com on An evaluation of space-filling information visualizations for depicting hierarchical
WHAT IS A SITE MAP. Types of Site Maps. vertical. horizontal. A site map (or sitemap) is a
 is a") WHAT IS A SITE MAP A site map (or sitemap) is a list of pages of a web site accessible to crawlers or users. It can be either a document in any form used as a planning tool for Web design, or a Web page
WHAT IS A SITE MAP A site map (or sitemap) is a list of pages of a web site accessible to crawlers or users. It can be either a document in any form used as a planning tool for Web design, or a Web page
Elastic Hierarchies: Combining Treemaps and Node-Link Diagrams
 Elastic Hierarchies: Combining Treemaps and Node-Link Diagrams Shengdong Zhao 1 University of Toronto Michael J. McGuffin 2 University of Toronto Mark H. Chignell 3 University of Toronto Node Link Diagram
Software Engineering & Architecture
 Software Engineering & Architecture 11. QUALITY METRICS AND VISUALIZATION Martin Kropp University of Applied Sciences Northwestern Switzerland Institute for Mobile and Distributed Systems References Some
A Short Introduction to Computer Graphics
 A Short Introduction to Computer Graphics Frédo Durand MIT Laboratory for Computer Science 1 Introduction Chapter I: Basics Although computer graphics is a vast field that encompasses almost any graphical
User Experiments with Tree Visualization Systems
 User Experiments with Tree Visualization Systems Alfred Kobsa University of California, Irvine ABSTRACT * This paper describes a comparative experiment with five wellknown tree visualization systems, and
Welcome to CorelDRAW, a comprehensive vector-based drawing and graphic-design program for the graphics professional.
 Workspace tour Welcome to CorelDRAW, a comprehensive vector-based drawing and graphic-design program for the graphics professional. In this tutorial, you will become familiar with the terminology and workspace
A Practical Approach to Software Quality Management visualization
 Visualization-based Analysis of Quality for Large-scale Software Systems Guillaume Langelier Houari Sahraoui Pierre Poulin DIRO, Université de Montréal Montréal, QC Canada ABSTRACT We propose an approach
Cartesian vs. Radial A Comparative Evaluation of Two Visualization Tools
 Cartesian vs. Radial A Comparative Evaluation of Two Visualization Tools Michael Burch, Felix Bott, Fabian Beck, and Stephan Diehl Computer Science Department, University of Trier, Germany {burchm,diehl}@uni-trier.de
Glencoe. correlated to SOUTH CAROLINA MATH CURRICULUM STANDARDS GRADE 6 3-3, 5-8 8-4, 8-7 1-6, 4-9
 Glencoe correlated to SOUTH CAROLINA MATH CURRICULUM STANDARDS GRADE 6 STANDARDS 6-8 Number and Operations (NO) Standard I. Understand numbers, ways of representing numbers, relationships among numbers,
GosperMap: Using a Gosper Curve for Laying out Hierarchical Data
 GosperMap: Using a Gosper Curve for Laying out Hierarchical Data David Auber, Charles Huet, Antoine Lambert, Benjamin Renoust, Arnaud Sallaberry, Agnes Saulnier To cite this version: David Auber, Charles
CS171 Visualization. The Visualization Alphabet: Marks and Channels. Alexander Lex alex@seas.harvard.edu. [xkcd]
![CS171 Visualization. The Visualization Alphabet: Marks and Channels. Alexander Lex alex@seas.harvard.edu. [xkcd]](/thumbs/39/19465011.jpg "CS171 Visualization. The Visualization Alphabet: Marks and Channels. Alexander Lex alex@seas.harvard.edu. [xkcd]") CS171 Visualization Alexander Lex alex@seas.harvard.edu The Visualization Alphabet: Marks and Channels [xkcd] This Week Thursday: Task Abstraction, Validation Homework 1 due on Friday! Any more problems
CS171 Visualization Alexander Lex alex@seas.harvard.edu The Visualization Alphabet: Marks and Channels [xkcd] This Week Thursday: Task Abstraction, Validation Homework 1 due on Friday! Any more problems
Microsoft Business Intelligence Visualization Comparisons by Tool
 Microsoft Business Intelligence Visualization Comparisons by Tool Version 3: 10/29/2012 Purpose: Purpose of this document is to provide a quick reference of visualization options available in each tool.
Hierarchical Edge Bundles: Visualization of Adjacency Relations in Hierarchical Data
 IEEE TRANSACTIONS ON VISUALIZATION AND COMPUTER GRAPHICS, VOL. 12, NO. 5, SEPTEMBER/OCTOBER 2006 741 Hierarchical Edge Bundles: Visualization of Adjacency Relations in Hierarchical Data Danny Holten Abstract
Trees in a Treemap: Visualizing multiple Hierarchies
 Trees in a Treemap: Visualizing multiple Hierarchies Michael urch and Stephan iehl Computer Science, Catholic University ichstätt, 85072 ichstätt, Germany ASTRACT This paper deals with the visual representation
Software Analysis Visualization
 28th International Conference on Software Engineering Software Analysis Visualization Harald Gall and Michele Lanza !oftware Visualiza"o# Tutorial F7 Software Evolution: Analysis and Visualization 2006
Visualization Software
 Visualization Software Maneesh Agrawala CS 294-10: Visualization Fall 2007 Assignment 1b: Deconstruction & Redesign Due before class on Sep 12, 2007 1 Assignment 2: Creating Visualizations Use existing
Jing Yang Spring 2010
 Information Visualization Jing Yang Spring 2010 1 InfoVis Programming 2 1 Outline Look at increasing higher-level tools 2D graphics API Graphicial User Interface (GUI) toolkits Visualization framework
Effective Visualization of File System Access-Control
 Effective Visualization of File System Access-Control Alexander Heitzmann 1, Bernardo Palazzi 1,2,3, Charalampos Papamanthou 1, and Roberto Tamassia 1 1 Brown University, Department of Computer Science,
Visualizing Changes of Hierarchical Data using Treemaps
 286 IEEE TRANSACTIONS ON VISUALIZATION AND COMPUTER GRAPHICS, VOL. 3, NO. 6, NOVEMBER/DECEMBER 27 Visualizing Changes of Hierarchical Data using Treemaps Ying Tu and Han-Wei Shen Abstract While the treemap
Student Outcomes. Lesson Notes. Classwork. Exercises 1 3 (4 minutes)
") Student Outcomes Students give an informal derivation of the relationship between the circumference and area of a circle. Students know the formula for the area of a circle and use it to solve problems.
Student Outcomes Students give an informal derivation of the relationship between the circumference and area of a circle. Students know the formula for the area of a circle and use it to solve problems.
Vector storage and access; algorithms in GIS. This is lecture 6
 Vector storage and access; algorithms in GIS This is lecture 6 Vector data storage and access Vectors are built from points, line and areas. (x,y) Surface: (x,y,z) Vector data access Access to vector
Universidade de Aveiro Departamento de Electrónica, Telecomunicações e Informática. Introduction to Information Visualization
 Universidade de Aveiro Departamento de Electrónica, Telecomunicações e Informática Introduction to Information Visualization www.portugal-migration.info Information Visualization Beatriz Sousa Santos,
Submission to 2003 National Conference on Digital Government Research
 Submission to 2003 National Conference on Digital Government Research Title: Data Exploration with Paired Hierarchical Visualizations: Initial Designs of PairTrees Authors: Bill Kules, Ben Shneiderman
Visualizing Biodiversity with Voronoi Treemaps
 Visualizing Biodiversity with Voronoi Treemaps Michael S. Horn, Matthew Tobiasz, and Chia Shen Initiative in Innovative Computing at Harvard University 60 Oxford Street Cambridge, MA 02138 USA Email: mhorn@seas.harvard.edu,
ClarisWorks 5.0. Graphics
 ClarisWorks 5.0 Graphics Level 1 Training Guide DRAFT Instructional Technology Page 1 Table of Contents Objectives... Page 3 Course Description and Organization... Page 4 Technology Requirements... Page
Microsoft Project 2010
 Tutorial 1: Planning a Project Microsoft Project 2010 In Tutorial Section 1.1 you will: Learn project management terminology Understand the benefits of project management Explore the Project 2010 window
Visualizing Software Projects in JavaScript
 Visualizing Software Projects in JavaScript Tim Disney Abstract Visualization techniques have been used to help programmers deepen their understanding of large software projects. However the existing visualization
Curriculum Overview YR 9 MATHS. SUPPORT CORE HIGHER Topics Topics Topics Powers of 10 Powers of 10 Significant figures
 Curriculum Overview YR 9 MATHS AUTUMN Thursday 28th August- Friday 19th December SUPPORT CORE HIGHER Topics Topics Topics Powers of 10 Powers of 10 Significant figures Rounding Rounding Upper and lower
Number Sense and Operations
 Number Sense and Operations representing as they: 6.N.1 6.N.2 6.N.3 6.N.4 6.N.5 6.N.6 6.N.7 6.N.8 6.N.9 6.N.10 6.N.11 6.N.12 6.N.13. 6.N.14 6.N.15 Demonstrate an understanding of positive integer exponents
Instructions for Creating a Poster for Arts and Humanities Research Day Using PowerPoint
 Instructions for Creating a Poster for Arts and Humanities Research Day Using PowerPoint While it is, of course, possible to create a Research Day poster using a graphics editing programme such as Adobe
The Effect of Animated Transitions on User Navigation in 3D Tree-Maps
 The Effect of Animated Transitions on User Navigation in 3D Tree-Maps Thomas Bladh Dept. of Computer Science and Electrical Engineering Luleå Univ. of Technology SE-971 87 Luleå, Sweden tbladh@sm.luth.se
Large Scale Information Visualization. Jing Yang Fall 2007. Interaction. A major portion of these slides come from John Stasko s course slides
 Large Scale Information Visualization Jing Yang Fall 2007 1 Interaction A major portion of these slides come from John Stasko s course slides 2 1 What is Interaction? From Google: Reciprocal action between
Microsoft Office PowerPoint 2003. Creating a new presentation from a design template. Creating a new presentation from a design template
 Microsoft Office PowerPoint 2003 Tutorial 2 Applying and Modifying Text and Graphic Objects 1 Creating a new presentation from a design template Click File on the menu bar, and then click New Click the
Visualization Techniques for Geospatial Data IDV 2015/2016
 Interactive Data Visualization 07 Visualization Techniques for Geospatial Data IDV 2015/2016 Notice n Author t João Moura Pires (jmp@fct.unl.pt) n This material can be freely used for personal or academic
Hyperbolic Tree for Effective Visualization of Large Extensible Data Standards
 Hyperbolic Tree for Effective Visualization of Large Extensible Data Standards Research-in-Progress Yinghua Ma Shanghai Jiaotong University Hongwei Zhu Old Dominion University Guiyang SU Shanghai Jiaotong
Visualizing Traceability Links between Source Code and Documentation
 Visualizing Traceability Links between Source Code and Documentation Xiaofan Chen 1, John Hosking 2, John Grundy 3 1 Department of Computer Science, University of Auckland, Auckland, New Zealand xche044@aucklanduni.ac.nz
Choosing Colors for Data Visualization Maureen Stone January 17, 2006
 Choosing Colors for Data Visualization Maureen Stone January 17, 2006 The problem of choosing colors for data visualization is expressed by this quote from information visualization guru Edward Tufte:
TOP-DOWN DATA ANALYSIS WITH TREEMAPS
 TOP-DOWN DATA ANALYSIS WITH TREEMAPS Martijn Tennekes, Edwin de Jonge Statistics Netherlands (CBS), P.0.Box 4481, 6401 CZ Heerlen, The Netherlands m.tennekes@cbs.nl, e.dejonge@cbs.nl Keywords: Abstract:
THE rapid increase of automatically collected data has led
 IEEE TRANSACTIONS ON VISUALIZATION AND COMPUTER GRAPHICS, VOL. 13, NO. 4, JULY/AUGUST 2007 1 Value-Cell Bar Charts for Visualizing Large Transaction Data Sets Daniel A. Keim, Member, IEEE Computer Society,
Excel -- Creating Charts
 Excel -- Creating Charts The saying goes, A picture is worth a thousand words, and so true. Professional looking charts give visual enhancement to your statistics, fiscal reports or presentation. Excel
Visual Data Mining with Pixel-oriented Visualization Techniques
 Visual Data Mining with Pixel-oriented Visualization Techniques Mihael Ankerst The Boeing Company P.O. Box 3707 MC 7L-70, Seattle, WA 98124 mihael.ankerst@boeing.com Abstract Pixel-oriented visualization
Navigating the I-TRIZ Knowledge Base Using Hyperbolic Trees
 Navigating the I-TRIZ Knowledge Base Using Hyperbolic Trees Ron Fulbright University of South Carolina Upstate Spartanburg, SC 29615 rfulbright@uscupstate.edu ABSTRACT The I-TRIZ knowledge base consists
Expert Color Choices for Presenting Data
 Expert Color Choices for Presenting Data Maureen Stone, StoneSoup Consulting The problem of choosing colors for data visualization is expressed by this quote from information visualization guru Edward
Art Tuts Learn how to draw, animate, etc. Inkscape tutorials How to draw a candle. Candle
 Art Tuts Learn how to draw, animate, etc Inkscape tutorials How to draw a candle Let s continue our How to draw in Inkscape series with a candle tutorial. At the beginning we'll use basic shapes, gradually
How to create pop-up menus
 How to create pop-up menus Pop-up menus are menus that are displayed in a browser when a site visitor moves the pointer over or clicks a trigger image. Items in a pop-up menu can have URL links attached
Graph Visualization and Navigation as an Interface to Data Exploration
 TEXTES DES COMMUNICATIONS - Tome II Graph Visualization and Navigation as an Interface to Data Exploration M. DELEST 1, B. LEBLANC 2, M. S. MARSCHAL 3, G. MELANCON 4 Keywords: Information Visualization,