POLITECNICO DI BARI ENGINEERING FACULTY DEPARTMENT OF MECHANICAL ENGINEERING MECHANICAL ENGINEERING FINAL THESIS
|
|
|
- Caitlin Hutchinson
- 9 years ago
- Views:
Transcription
1 POLITECNICO DI BARI ENGINEERING FACULTY DEPARTMENT OF MECHANICAL ENGINEERING MECHANICAL ENGINEERING FINAL THESIS PERFORMANCE OF A 50 MW CONCENTRATING SOLAR POWER PLANT Tutor: Prof. Eng. SERGIO CAMPOREALE Author: JUANY M. VALENZUELA ACADEMIC YEAR
2 ABSTRACT The following document is the written memory of an engineering final thesis. The aim of this project is to study and simulate the viability of introducing a 50 MW solar power plant in the locality of Barletta, Italy. The thesis is divided in two main parts: The first theoretical one which talks about solar energy and explains the two main processes with which profit can be taken from the sun: photovoltaic energy and thermal energy. It concentrates on the CSP technology to provide the reader with a good background on the subject. In the second part, the 50 MW plant is studied and simulated to arrive to the final design. During the simulation many variables and design parameters are taken into consideration to study their influence in the plant s performance and to be able to choose the best possible combination in order to take the maximum electric power output from the designed plant. This simulation study is made possible by the GateCycle software. GateCycle is a software of the General Electric company that gives assistance in the performance prediction of thermal power plants, such as, combined cycle plants, fossil boiler plants, combined heat-and-power plants, advanced gas turbines as well as other types of energy systems. In order to obtain accurate results from which to draw coherent conclusions it will be necessary to take into consideration Barletta s annual weather conditions: Irradiation, wind, temperature and other factors. This information will be extracted from a database. 2
3 Table of contents ABSTRACT INTRODUCTION SOLAR ENERGY PHOTOVOLTAIC PLANTS SOLAR COLLECTOR PLANTS Sun irradiation Non-concentrating solar power Concentrating solar power ENERGY STORAGE PLANTS The Andasol project 9, SOLAR POWER: STATE OF THE ART SOLAR ENERGY IN ITALY DESIGN AND SIMULATION OF THE 50 MW PLANT FUNCTIONING OF THE PLANT Description of the thermodynamic cycle CHARACTERISTICS OF THE SOLAR COLLECTORS USED FOR THE PLANT TRACKING THEORY AND ORIENTATION OF CSP CRITERIA FOLLOWED TO CHOOSE THE NUMBER OF REGENERATORS FOR THE PLANT CRITERIA FOLLOWED TO CHOOSE THE PUMP EXIT PRESSURE MACRO USED TO CALCULATE THE STEAM CYCLE EFFICIENCY MACRO USED TO CALCULATE THE COLLECTOR S EFFICIENCY THE OVERALL PLANT EFFICIENCY MACRO USED TO CALCULATE THE OIL FLOW RATES FOR A 50 MW PLANT MACRO USED TO CALCULATE THE COLLECTORS SURFACE INFLUENCE OF ENVIRONMENT TEMPERATURE ON THE PLANT INFLUENCE OF THE WORKING FLUID S PRESSURE AND TEMPERATURE OF ENTRANCE THE ADDITION OF A COOLING TOWER THE PLANT S FINAL DESIGN AND DESIGN POINT FUNCTIONING DESCRIPTION OF THE DESIGNED PLANT CONCLUSIONS REFERENCES
4 1. Introduction The vast majority of the world s population relies on energy. This demand for energy has been growing exponentially and on a yearly basis during the past decades, reaching a pace in which the earth s energy resources are being consumed faster than the natural processes can replace them. Together with industrial and technological progress of many countries has come a steep increase of fossil fuel consumption, which has unfortunately also caused negative consequences such as climate change, environmental pollution, depletion of natural resources and political disagreements amongst countries. The time has come where the earth s energy situation can be defined as critical, which might be one of the reasons why many countries are becoming more conscious on subjects related to energy consume, energy efficiency, climate change, investment in renewable energies, dependence on fossil fuels This general concern has leaded some countries to establish CO2 limits, with contracts and protocols such as the well-known Kyoto protocol, the intentions of which is to reduce the impact of the industrialized countries on climate change and natural resources, as well as to promote investment in higher energy efficiency and renewable energy systems. As mentioned before, it is widely known that energy consume increases yearly and it is also a fact that fossil fuel reserves are limited and will eventually deplete. Therefore resorting to renewable and clean energies no longer remains a question. Many countries have investigated and invested on these types of energies; some of them, such as Sweden are already using up to 60% of sustainable energy for their overall electric power production 1*. This is one of the motivations of this thesis, to continue investigating and pursuing lower dependence on fossil fuels and more powerful sustainable energy systems. Italy is a country with a high percent of sun irradiation that can be used in many different ways; one of them is to produce thermal energy and electricity 3. (*) The superscript numbers refer to the reference that was used in order to obtain the information stated. 4
5 This project intends to study the feasibility of introducing a 50MW solar power plant in the locality of Barletta, situated in the southern part of Italy where the sun s irradiation is higher. The conclusions will be drawn from the results obtained by the simulation of the plant in a specific software called GateCycle. 2. Solar Energy Solar energy is a highly renowned alternative energy type. The intensity of the sun s irradiation that reaches the globe yearly is equivalent to 92 billion tons of petroleum 2. A calculation from 2002 states that the energy received from the sun in one hour was greater than the world used in one year 3. Due to the latter, the investigation of this source has lasted for years and continues to be a matter of great importance and relevance today. There are two main ways of taking profit of the sun s energy, which are photovoltaic plants and solar collector plants Photovoltaic plants These types of plants employ solar panels that take profit from the sun s light (photo) and convert it into direct current electricity (volts). This phenomenon takes place thanks to the light detection cells contained in the panels, which are made of photovoltaic material. The photovoltaic effect is closely related to the photoelectric effect in which electrons are ejected from a material upon energy exposure, such as light radiation. In the photovoltaic effect however, these 5
6 generated electrons are forced to flow within the material, which result in an electric current and the build up of voltage. Due to the growing demand of renewable energy the photovoltaic (PV) market has considerably grown in the past years. In between 2004 and 2009 the photovoltaic capacity increased at an average annual rate of 60%, arriving to the global world capacity of 21GW 1. In 2010 PV energy was generating electricity in more than 100 countries 1. However, photovoltaic plants are not yet profitable at industrial level. Although PV technology has developed substantially in the past years, the obtaining costs of its composing cells are still high. In addition to this, the efficiency with which these plants convert light into electricity is approximately 13%, a low level in relation to the surface that solar PV plants occupy Solar collector plants Solar collector plants take profit of the sun s electromagnetic waves and transform them into heat power, which is generally used to heat a liquid. These plants can be classified into two main categories: non-concentrating solar power and concentrating solar power (CSP), each of them is able to take profit from the sun s irradiation in a different way Sun irradiation Sun irradiation can be described as the flux of energy that the earth receives from the sun. This energy arrives as a set of waves at different frequencies, some of which are detectable by the human eye and another part, such as infrared rays, cannot be detected by the human eye. A classification of the types of irradiation can be made according to the way an object receives the sun s rays. 6
7 Direct radiation: It is the unaltered radiation that comes directly from the sun without going through any changes on its way. It is characterized by its projection of a defined shade of those objects that intercept its path. Diffuse radiation: Part of the sun irradiation that crosses the atmosphere is absorbed and reflected by clouds, dust particles in the air, trees, mountains, etc. As a consequence of this, this type of radiation goes in all directions. It does not produce shades on objects. Horizontal surfaces receive it more than vertical ones because they are exposed to the entire sky vault; whereas the vertical surfaces are only exposed to half of it. Reflexed radiation: This is the radiation that is reflected by a surface. Its quantity depends on the surface s reflection coefficient. In this case, it is vertical surfaces that receive all of the reflexed radiation, for they look at or are in the way of other surfaces, whereas horizontal surfaces that are not. Global radiation: As its name indicates, this is the sum of the abovementioned radiations. There are many types of solar collectors in the market, each of which takes profit of different ways of sun radiation. Concentrating solar collectors, for instance, only capture direct radiation. Flat solar collectors, however, are able to capture direct and diffuse radiation. This is the reason why CSP plants are generally located in geographical areas where cloudiness and mist are not common Non-concentrating solar power These types of plants are generally used to produce renewable heat power. The area to be heated is directly exposed to sunlight without mirrors, lenses or any types of auxiliary gadgets. This result in less complex models with low probabilities of failure but also results in plants with a lower efficiency level. 7
8 Concentrating solar power These types of plants use gadgets such as lenses and mirrors to concentrate a large surface of sun exposure into a small area. This concentrated sunlight is then transformed into the heating of a particular fluid, which can be used directly to produce renewable heat, or can also be used to produce electricity. In the case of electricity production the heated fluid will drive a heat turbine (usually a steam turbine) which mechanical power will be then transformed into electricity by an electrical power generator. Today there are four main types of concentrating technologies: Parabolic trough, dish Stirling, concentrating linear Fresnel reflectors and solar power towers. Each one of them has its own advantages and disadvantages regarding its applications and their working. They also vary from one another in the way they focus and concentrate the sun s irradiation. 8

9 Parabolic trough (Fig 1.) Parabolic trough functioning scheme 5. These types of energy collectors consist on long, parabolic mirrors. Throughout the whole length of these mirrors, runs a tube that is positioned at the focal point of these parabolas. Sun irradiation is reflected by the mirror and, due to the implanted geometry, concentrated on the tube. The troughs can be aligned in a northsouth position or an east-west position and they rotate during the day to track the sunlight during daylight hours. Inside the tube, at the focal point, runs a heat transfer fluid (usually oil) that absorbs the concentrated sun irradiation and rises its temperature up to 400 C. The heat of the high-temperature oil is used to produce steam, which will run through a steam turbine, producing mechanical power. The latter is then transformed into electrical power by an electrical power generator. As it will be explained with further detail in following sections, some of the plants that use 9
10 parabolic troughs also count with an energy storage system that stores heat power using molten salts Dish Stirling (Fig 2.) Almeria s solar platform 6. Dish Stirling systems use a parabolic solar dish concentrator that tracks sunlight and focuses it into a cavity receiver. The working fluid in the receiver is heated to C. This thermal energy is transformed into power by a Stirling engine generator. The use of this technology is of great interest because it provides the highest solar/electric efficiency among CSP technologies. 10
11 Fresnel reflectors (Fig 3.) Fresnel reflector plant 7. Fresnel reflector systems consist on numerous flat and thin mirrors that concentrate sunlight onto tubes through which runs a working fluid. This technology is similar to parabolic reflectors but differs from it in two main aspects; it presents a lower efficiency and therefore is simpler and lower-priced. 11
12 Solar power towers (Fig 4.) e-solar s 5 MW Sierra sun tower facility, located in California 8. This technology consists of a collector tower surrounded by an array of flat, movable mirrors (heliostats) that concentrate sunlight upon it. This generates thermal power; which heats water, transforming it in steam. Steam is used to run a turbine and therefore produce power. 12
13 Concentrating solar power technology restrictions As it has been stated before, concentrating solar power is a technology with great future prospects. Nevertheless, it presents a series of restrictions, some of which are yet to be solved. The intermittency of its source, the sun. There can be casual, daily and seasonal; this can strongly vary depending on the geographical situation. This first restriction is, at the same time, one of the characteristics of solar energy and therefore cannot be solved. However, energy storage technologies are used in some cases to offset this effect. Inflammability of the working fluid. In some solar plants, where oil is used as a working fluid, special precautions must be taken because fire could be started when the oil exceeds a certain temperature. Toxicity of the working fluid. This is also a risk when working with oil as a working fluid. Low efficiency rates are achieved in these types of plants. Partly because of the low temperature restriction that comes from the working fluid and also due to the difficulty to collect sunlight efficiently Energy storage plants As previously mentioned, one of solar power technology s restrictions or inconveniences is the unavailability of sunlight during certain periods of time such as night, cloudy days or even whole seasons in the case of some countries. Modern life however, requires continuous energy availability; therefore today s energy systems should be prepared and designed to provide it. When using solar energy power, one of the solutions to offset the effect of intermittency is to design hybrid plants that use sunlight when it is available and 13
14 fuel during non-solar periods. Nevertheless there are other solutions that do not require fossil fuel consumption and that can therefore deliver lower-priced and more ecological energy. These types of plants receive the name of energy storage plants. There are numerous ways to store thermal energy: thermal mass systems, phase change materials, rechargeable batteries, high temperature storage using molten salts and pumped storage hydroelectricity, which uses the exceeding energy (when it is available) to pump water from a low level dam to a high level dam; this energy is then recovered by the release of water in the opposite direction, running through a hydroelectric power generator. In the case that an energy storage system was introduced in this project s scheme, the most adequate solution would have been energy storage using molten salts. The reason of this is that molten salts posses a high specific heat capacity and are not highly priced. Apart from this, they can stand high temperatures, compatible with a 50 MW power plant. There are two main processes to load thermal energy storage systems: Indirect and direct systems. Direct systems use the same fluid in for storage and for the solar field whereas indirect systems use a different fluid for each purpose. One of the problems with direct systems is that molten salts solidify at temperatures in between 120 and 220 C and there is the risk that they may solidify in the solar field during the night. Indirect energy storage systems are generally loaded by running hot working fluid from the solar field through heat exchangers. The cold molten salts, which come from the cold storage tanks, are also run through these same heat exchangers and consequently suffer a temperature rise. The heated molten salts are then reserved in a storage tank and subsequently used. Later, when there is energy demand during non-solar periods, the system operates in reverse: the molten salts transfer their reserved heat to the working fluid through the same heat exchangers. This creates steam once again, which activates the plant during hours without sunlight. 14
15 The Andasol project 9,11 (Fig 5.) Gaudix on a Spanish map 10. The first commercial parabolic solar power plant installed in Europe is Andasol1, which began to work in 2009 and is located near Gaudix; Andalusia, Spain. The project began with a 50 MW plant (Andasol1) and later on, two other plants were added, providing a total of 150 MW of electric power. Each one of these plants is able to provide clean energy to approximately 200,000 people. The semi-arid climate and the high altitude (1,100m) make this area strategic for the location of parabolic trough plants, with a high annual direct insolation 2,200 kwh/m 2 year. Each of these plants is provided with a thermal energy storage system, which consist of two tanks (ø = 36m, h = 14m), and that uses a molten salt mixture (60% sodium nitrate and 40% potassium nitrate). The molten salts absorb part of the available heat during the day and store it for the plant functioning during non-solar periods. A full reservoir is capable of holding up to 1,010 MWh of heat, which can make the turbine run at full load for about 7.5 hours. Each solar camp of the Andasol project occupies 510,120 m 2 of surface and consists of 156 cylindrical parabolic collectors; each of them has a four-meter width and a 150-meter length. 15
16 (Fig 6.) The Andasol Project 9. The cylindrical mirrors achieve an 82:1 solar concentration in the absorbing tubes and are provided with solar and inclination sensors in order to follow the sun s rays during its natural path. There are two main efficiencies to distinguish from in these types of plants: radiation-steam efficiency and overall efficiency (radiation-electricity). Radiationsteam efficiency is the percentage of heat power that can be extracted from the arriving radiation from the sun and is approximately 43% for this plant. The overall efficiency on the other hand, is the percentage of electricity power that can be extracted from a unit of radiation power, which is 16% in the case of this plant. These plants operate 3,644 yearly hours at full load. The electricity produced during these hours prevents the emission of 152,000 tons of CO2 yearly. There are other important parabolic trough solar thermal power plants working today, such as the Kramer Junction in California, which provides 354 MW of power and is the largest solar plant in the world. It is located in the California Mojave 16
 that use auxiliary natural gas boilers to provide backup capability during low and non-solar hours. The facilities occupy a surface of 6.5 km 2.")
17 desert, one of the areas with highest insolation in the United States. This plant is subdivided into nine other plants (SEGS I-SEGS IX). These are solar electric generating stations (SEGS) that use auxiliary natural gas boilers to provide backup capability during low and non-solar hours. The facilities occupy a surface of 6.5 km Nevertheless, for the fulfillment of this project is has been considered most interesting to focus on the Andasol project for its geographical closeness to Italy, where the realization of this thesis has taken place, and also because it provides the same power than the simulated plant. (Fig 7.) The functioning scheme of an energy storage plant The above image is a functioning scheme of an energy storage plant 9 : 17
18 2.4. Solar power: State of the art. The development of technologies that take profit from the sun s energy has been growing since the late 1990 s. However, the commercial use of concentrating solar power plants (CSP) did not start to arise until The PS10, installed in Andalusia; Spain, which was finished in 2005, was the first CSP plant to work in Europe, providing 11 MW of power. It is said that using concentrating solar plants in less than one percent of the world s deserts surface could generate enough electric power to satisfy the world s demand of electricity 12. As for today, the solar thermal power industry is growing at a fast pace. In 2009 there were 1.2 GW of concentrated solar power under construction and another 13.9 GW announced to start working in In 2010, Spain was the country with most CSP projects, with 22 constructed projects for the equivalent of 1,037 MW. Today there are over 30 operational projects, which give a total electric power of MW. The largest constructed project is located in the Mojave Desert in California, USA; it counts with nine units and gives a total of 354 MW 13. Other large projects of 150, 100 and 50 MW are located in Spain, mainly in the south where the sun s irradiation is higher. Other important projects of around 20 MW and 17 MW of power are built respectively in Morocco and Iran 13. Three World Bank projects for development countries have already been approved; they are solar thermal/combined cycle gas turbine plants that are expected to be located in Egypt, Mexico and Morocco 13. In Italy the Archimede solar power plant, located in Sicily, was finished in July 2010, with an operational power of 5 MW. Today there are over 2,200 MW of concentrating solar power plants under construction, located mainly in Spain and the United States. The following map was published by the trek-uk. Organization and it represents the world s potential areas for CSP plant installation. 18
19 (Fig 8.) Potential for CSP around the world map
20 2.5. Solar energy in Italy (Fig 9.) The Archimede Project in Sicily, Italy 16. In 2009 Italy was the second largest market in photovoltaic technology in the world. Its first CSP plant, however, did not come until Archimede is a concentrating solar power plant of 5 MW that uses energy storage. It is located in Sicily, Italy; it was unveiled the 14 th of July Archimede is the first CSP plant in the world to use molten salts as the heat transfer fluid and energy storage fluid. As it has been mentioned in previous sections, using molten salts as a working fluid has many advantages. To begin with, they can tolerate higher temperatures than oil (up to 550 C instead of the recommended 400 C of oil); which increases the overall efficiency and the profit power that can be taken from the plant. This feature also simplifies the plant design, since no water/oil heat exchangers need to be designed for it. Molten salts are cheaper and involve less toxicity risks than oil. Italy s 20
21 development of this technology has opened the doors to other countries in sunny geographical areas, such as Northern Africa, Australia, Middle East and the U.S. to take profit from it and its advantages 14. ANEST, the Italian CSP association, states that by the year 2020 Italy could be giving a power of 3 to 5 thousand MW with CSP plants. This could create numerous job placements, as well as an industrial know-how in Italy. It seems that the Archimede project has just been a start in Italy s CSP plants Design and simulation of the 50 MW plant This section of the project focuses on the design process of the 50 MW plant. This process, as well as the choosing of the used equipment and the values of the different variables and parameters of the plant, is done comparing the output data results in the GateCycle simulation of the plant. The designed plant is a two-turbine concentrating solar power plant with parabolic trough collectors. It uses the Dowtherm A oil as the working fluid for the collectors and water/steam for the functioning of the cycle Functioning of the plant Fig 10. is the scheme of a one regenerator CSP plant. As it can be seen in the image, the plant counts with two turbines: (1) and (2); one regenerator: (3); two superheaters: (4) and (5); an evaporator: (7); one economizer: (8); two splitters: (9) and (10); a condenser: (11) and a pump: (12). 21

22 (Fig 10.) Scheme of a one-regenerator CSP plant. In order to explain the plant s functioning in the clearest way it is important to bear understand that this plant works with two different working fluids: oil and steam/water. On the one hand, oil, which is represented in red lines in the image, is responsible of absorbing the heat power that is produced by irradiation at the collector. Once it passes through it, it enters the plant at a high temperature, typically in between 300 and 400 Celsius degrees. As shown in the image above, when entering the system it first passes through the superheaters: (5) and (6), where it exchanges heat with the steam produced by the evaporator, rising the steam s temperature before it enters the turbine. The oil then passes through the evaporator (7) where it again gives away part of its heat to water, for its transformation to steam. When passing through the last piece of equipment: the economizer (8); the oil exchanges once again exchanges heat, giving it this time to liquid water for the increasing of its temperature at the entrance of the evaporator. This helps in the improvement of the power given by the plant and the plant s efficiency. At this point the oil exits 22
23 the plant and goes back to the collector; where it receives power from the sun and is gets heated and ready to restart the process. Water, on the other hand, transforms into steam with the heat power received by oil. The resultant reheated steam passes through turbines (1) and (2), where its heat power is transformed into mechanical and then electrical power. Depending on the number of regenerators used on the plant, there are extractions made from the turbines; which run through the regenerators and give away heat to cool water that also passes through them. Regenerators (3) are heat-exchanging devices that permit the heat exchange between steam coming from turbines and the cool water that comes out from the pump; its use can significantly increase the efficiency of the cycle, as well as the power given by the plant. This will be explained in further detail in the subsequent sections. Another very important device in the plant is the condenser (11). The remaining steam from the turbines, as well as the remaining hot water from the regenerators, is cooled here. In some cases, condensers cool the incoming water by making it exchange heat with water from rivers or the sea; which has a lower temperature. In other cases, when water from these sources cannot be used, condensers are connected to cooling towers, which cool the water by two different methods: making it exchange heat with environment air and by the partial evaporation of the incoming water. After passing through the condenser, the resulting water goes into a pump, where it suffers a pressure increase. At this pressure it enters the regenerators, followed by the economizer, where it increases its temperature. After this the heated water enters the evaporator where it changes into steam. It then runs through the superheaters and enters the turbine in the form of heated steam. The process is repeated in a closed circuit Description of the thermodynamic cycle The thermodynamic process followed by this plant is named Rankine cycle. It converts heat into work and is mostly used in power plants. This cycle generates approximately an 80% of the electric power used throughout the world
24 The four processes of the Rankine cycle (Fig 11.) T-S diagram of a simple Rankine cycle. 25 Fig. 11. is the T-S diagram of a simple Rankine cycle. It consists on four processes: 1-2, 2-3, 3-4 and 4-1. Process 1-2: During this process water is pumped from low pressure to high pressure. Process 2-3: In this part of the cycle, the high-pressure working fluid enters a boiler where it receives heat power and transforms into dry steam. Process 3-4: The saturated dry steam expands by running through a turbine; therefore its temperature and pressure decrease notoriously. Some condensation may occur in this process. 24
25 Process 4-1: The resulting fluid that exits the turbine passes through the condenser where it is fully transformed into saturated water at a constant temperature. There are some variations that can be made to the Rankine cycle in order to increase its efficiency: the adding of regenerators, economizers or superheaters. Rankine cycle with superheat: (Fig 12.) T-S diagram, Rankine cycle with superheat. The efficiency of the steam turbine and, therefore the cycle, is limited by the water droplet formation in the expansion of the fluid at the exit of the turbine. Water droplets could eventually cause pitting and erosion to the turbine blades. A good solution to overcome this problem is to superheat the steam and hence move state 3 to the right; which produces a dryer steam at the exit of the turbine. Rankine cycle with reheaters: Two turbines working in series are used when reheating is applied. The steam that exits the turbine passes through another heat exchanger and is reheated to pass through the second low-pressure turbine. This increases the efficiency of the cycle because more steam passes through the turbines at a higher temperature. Apart from this, steam condensing is avoided at the exit of the turbine. 25
26 (Fig 13.) T-S diagram, Rankine cycle with reheaters. Rankine cycle using regenerators: (Fig 14.) T-S diagram, Rankine cycle with regenerators. turbines and hence the efficiency of the cycle. Two turbines working in series are also used when applying regeneration. Part of the steam that exits the first turbine is sent to the regenerator where it gives part of its heat to the cooled water that exits from the condenser. This increases the temperature at which the water enters the boiler. Therefore, with the same energy used by the boiler it is possible to produce steam at a higher temperature which increases the power produced by the 26
27 In the simulation of the designed plant, several parameters are examined to study their influence in the plant s performance. Being that the plant will have two turbines working in series, the number of regenerators and therefore extractions from the turbines need to be examined and decided. In addition to this, the influence of the pump exit pressure will also be studied to decide the optimal pressure. The influence of the environment temperature in the performance of the plant, as well as the inlet oil temperature to the plant will also be studied and fixated for the design point Characteristics of the solar collectors used for the plant (Fig 15.)Parabolic trough collector with Dewar tube 24. The collectors used in this plant are parabolic trough collectors. As its own name indicates, these types of collectors have a parabolic geometry, which concentrates the sun s rays in the focal point. These types of collectors are constructed as long parabolic mirrors, which have a thickness of approximately four millimeters and are typically coated by silver or polished aluminum to maximize the reflectance of 27

28 the incoming rays. The sunrays are reflected on this mirror and concentrated on a tube; which receives the name of Dewar tube. (Fig 16.) Detailed scheme of the Dewar tube 25. The Dewar tube, also called absorber pipe is made of stainless steel and should resist the mechanical and thermal stress it will suffer with the running of the oil throughout its length. A coating treatment made of black crome or cerment is applied to its external surface; this coating promotes a high absorbance of the incoming spectral irradiation and has a very low emitting coefficient for infrared rays. Apart from this the Dewar tube is protected with an isolating glass tube, treated with antireflection coatings both in the inside and outside surfaces. This treatment helps maximize the quantity of radiation received by the Dewar tube and therefore, on the heat received by the oil. Vacuum is created between the steel tube and the glass covering tube to prevent heat escape due to the convection process Tracking theory and orientation of CSP As mentioned previously, concentrated solar power plants use the direct irradiation from the sun to produce energy. For this reason these types of plants need to be oriented appropriately toward the sun. Solar trackers are devices used to accomplish this objective; they indicate how the mirrors should rotate along the 28
29 day in order to follow the sun s path across the sky and therefore receive the maximum direct irradiation from it. To gather energy effectively, solar collectors should be positioned twenty degrees perpendicular to the sun on either side. Tracking systems are classified by their motions; they can rotate in one or two axis. Due to the length of parabolic trough collectors, these only rotate in one axis. In these types of plants, the mirrors are usually oriented in a north-south direction to maximize their efficiency in the absorbing of sunlight. Alternatively to this, however, is the possibility of orienting the mirrors in an east-west direction; this minimizes the irradiation-thermal efficiency of the collectors but has the advantage that the tracking system does not require tracking motors and only needs to be re-aligned with the change of seasons. Being that the power produced by the designed plant is high, the troughs will be oriented in a north-south direction in order to obtain the maximum irradiationthermal efficiency possible Criteria followed to choose the number of regenerators for the plant It is theoretically known that the number of regenerators increases the efficiency of the cycle. However, increasing the number of regenerators also entails a more complex and highly priced plant. Therefore there is the need to find a balance between efficiency and technical-economical resources. In order to do so the plant was simulated using: one, two and three regenerators. The hypotheses for this simulation were the same for all three cases and are stated on the table beneath. 29
30 Oil properties Oil inlet temperature 673 K Oil outlet temperature 530 K Air flow rate 10 kg/s Oil flow rate 5.38 kg/s Oil inlet/outlet pressure 1 bar Water/Steam properties in the economizer Water temperature in the inlet of 453 K economizer Water pressure in the inlet of 50 bar economizer (Table 1.) Initial estimations As it can be noted from table /, the assumed air-flow rate has been 10 kg/s. The real circulating air-flow value that is needed for the production of the plant s 50 MW will be calculated in subsequent sections. In this section however, it was only important to study the influence of the number of regenerators on the plant s power, efficiency and general performance. It will also be noted in the tables beneath that the outlet power is much lower than the 50 MW of the design point; this is due to the initial air-flow assumption which will be later on changed to match the desired outlet power. The following are the schemes of the one, two and three regenerator designs: 30
31 (Fig 17.) One-regenerator scheme. 31
32 (Fig 18.) Two-regenerator scheme. (Fig 19.) Three-regenerator scheme. 32
33 As it has been mentioned before, the plant works with oil as the working fluid. However, when simulating with GateCycle it is simpler to use air as the working fluid and make all the calculations with it, converting later on the airflow rate to oil flow rate using the following equation: m oil c p,oil m air c p,air Being and at the working temperatures. This value for the cp,oil, has been extracted from the Dowtherm A datasheet provided by the Dow Chemical company. Apart from this, in the simulations using two and three regenerators there were extractions made from the low-pressure turbine. A criterion was necessary to decide the pressures at which to make these extractions. The procedure that was followed is the following: Simulation using two regenerators: First of all it is necessary to find h1, the enthalpy in between the enthalpy of water the entrance of the economizer (hb) and the enthalpy of the water at the entrance of the regenerator (ha). After this the corresponding saturation pressure is found using the steam tables. This is P 1, the extraction pressure of the low-pressure turbine. 33
34 Simulation using three regenerators: The same procedure is followed; only in this case there are two extractions to be made from the low-pressure turbine. Main extraction: Once again the saturation pressure is found using the steam tables and assigned as the main extraction pressure. Secondary extraction The corresponding pressure, The output from the simulations is classified by the number of regenerators used. Simulation using one regenerator: Steam cycle Shaft power 0.52 MW Net power 0.51 MW Steam cycle efficiency 34% Steam properties in the superheaters Steam pressure in the outlet of the first 50 bar superheater Steam temperature in the outlet of the 653 K first superheater Steam temperature in the inlet of the 537 K first superheater (outlet of evaporator) Steam pressure in the outlet of the 10 bar second superheater 34
35 Steam temperature in the outlet of the 653 K second superheater Steam properties in the high pressure turbine Steam pressure in the outlet of the high 10 bar pressure turbine Steam temperature in the outlet of the 468 K high pressure turbine Steam properties in the low pressure turbine Steam pressure in the outlet of the low 0.05 bar pressure turbine Steam temperature in the outlet of the 306 K low pressure turbine (Table 2.) Output for the one-regenerator case Simulation using two regenerators: Steam cycle Shaft power 0.55 MW Net power 0.54 MW Steam cycle efficiency 36% Steam properties in the superheaters Steam pressure in the outlet of the first 50 bar superheater Steam temperature in the outlet of the 653 K first superheater Steam temperature in the inlet of the 537 K first superheater (outlet of evaporator) Steam pressure in the outlet of the 10 bar second superheater Steam temperature in the outlet of the 653 K second superheater Steam properties in the high pressure turbine Steam pressure in the outlet of the high 10 bar pressure turbine Steam temperature in the outlet of the 468 K high pressure turbine Steam properties in the low pressure turbine Steam pressure in the outlet of the low 0.05 bar pressure turbine Steam temperature in the outlet of the 306 K low pressure turbine Steam pressure in the extraction of the 1.4 bar low pressure turbine Steam temperature in the extraction of 446 K the low pressure turbine (Table 3.) Output for the two-regenerator case 35
36 Simulation using three regenerators: Steam cycle Shaft power 0.56 MW Net power 0.55 MW Steam cycle efficiency 37% Steam properties in the superheaters Steam pressure in the outlet of the first 50 bar superheater Steam temperature in the outlet of the 653 K first superheater Steam temperature in the inlet of the 537 K first superheater (outlet of evaporator) Steam pressure in the outlet of the 10 bar second superheater Steam temperature in the outlet of the 653 K second superheater Steam properties in the high pressure turbine Steam pressure in the outlet of the high 10 bar pressure turbine Steam temperature in the outlet of the 468 K high pressure turbine Steam properties in the low pressure turbine Steam pressure in the outlet of the low 0.05 bar pressure turbine Steam temperature in the outlet of the 306 K low pressure turbine Steam pressure in the first extraction of 2.92 bar the low pressure turbine Steam temperature in the first 517 K extraction of the low pressure turbine Steam pressure in the second extraction 0.55 bar of the low pressure turbine Steam temperature in the second extraction of the low pressure turbine (Table 4.) Output for the three-regenerator case 3.5. Criteria followed to choose the pump exit pressure In order to verify how the pump pressure influences the power, the efficiency and the evaporation temperature, the one-regenerator scheme plant will be simulated 36
37 using a pump pressure of 25, 50 and 100 bar. The results are shown in the tables beneath. 25 bar increase Steam cycle Shaft power 0.58 MW Generator power 0.57 MW Net power 0.57 MW Steam cycle efficiency 31% Oil properties Oil inlet temperature 673 K Oil outlet temperature 530 K Oil flow rate 5.38 kg/s Oil inlet/outlet pressure 1 bar Water/Steam properties in the economizer Water temperature in the inlet of 453 K economizer Water pressure in the inlet of 25 bar economizer Steam properties in the superheaters Steam pressure in the outlet of the first 25 bar superheater Steam temperature in the outlet of the 653 K first superheater Steam temperature in the inlet of the 497 K first superheater Steam pressure in the outlet of the 10 bar second superheater Steam temperature in the outlet of the 653 K second superheater Steam properties in the high pressure turbine Steam pressure in the outlet of the high 10 bar pressure turbine Steam temperature in the outlet of the K high pressure turbine Steam properties in the low pressure turbine Steam pressure in the outlet of the low 0.05 bar pressure turbine Steam temperature in the outlet of the 306 K low pressure turbine (Table 5.) Output for the 25 bar pump exit pressure 37
38 50 bar increase Steam cycle Shaft power 0.52 MW Generator power 0.51 MW Net power 0.51 MW Steam cycle efficiency 34% Oil properties Oil inlet temperature 673 K Oil outlet temperature 530 K Oil flow rate 5.38 kg/s Oil inlet/outlet pressure 1 bar Water/Steam properties in the economizer Water temperature in the inlet of 453 K economizer Water pressure in the inlet of 50 bar economizer Steam properties in the superheaters Steam pressure in the outlet of the first 50 bar superheater Steam temperature in the outlet of the 653 K first superheater Steam temperature in the inlet of the 537 K first superheater (outlet of evaporator) Steam pressure in the outlet of the 10 bar second superheater Steam temperature in the outlet of the 653 K second superheater Steam properties in the high pressure turbine Steam pressure in the outlet of the high 10 bar pressure turbine Steam temperature in the outlet of the 468 K high pressure turbine Steam properties in the low pressure turbine Steam pressure in the outlet of the low 0.05 bar pressure turbine Steam temperature in the outlet of the 306 K low pressure turbine (Table 6.) Output for the 50 bar pump exit pressure 38
39 100 bar increase Steam cycle Shaft power 0.32 MW Generator power 0.31 MW Net power 0.31 MW Steam cycle efficiency 32% Oil properties Oil inlet temperature 673 K Oil outlet temperature 530 K Oil flow rate 5.38 kg/s Oil inlet/outlet pressure 1 bar Water/Steam properties in the economizer Water temperature in the inlet of K economizer Water pressure in the inlet of 100 bar economizer Steam properties in the superheaters Steam pressure in the outlet of the first 100 bar superheater Steam temperature in the outlet of the 653 K first superheater Steam temperature in the inlet of the 584 K first superheater (outlet of evaporator) Steam pressure in the outlet of the 30.5 bar second superheater Steam temperature in the outlet of the 653 K second superheater Steam properties in the high pressure turbine Steam pressure in the outlet of the high 30.5 bar pressure turbine Steam temperature in the outlet of the 508 K high pressure turbine Steam properties in the low pressure turbine Steam pressure in the outlet of the low 0.05 bar pressure turbine Steam temperature in the outlet of the 306 K low pressure turbine (Table 7.) Output for the 100 bar pump exit pressure 39
40 As it can be observed from the tables above, the best solution is to use a 50 bar pressure increase in the pump. It can also be seen that the power diminishes with the increase of the pump s pressure; this is due to the fact that the necessary power for the pump to propel water is taken from the power produced by the plant and the higher the pump pressure increase is the more power is needed to take the liquid to this pressure Macro used to calculate the steam cycle efficiency Macros are a set of tools that help the user to elaborate different types of calculations and carry out relationships between the cycle system and the equipment data. They are algorithmic alternatives to hand calculations. To create a macro it is necessary to know which variables will be needed and which parts of the simulation equipment will be accessed. The GateCycle software displays a wide set of variables from the simulation equipment. However, in some cases it is also necessary to create user-defined-variables that can be relationships or calculations using the GateCycle variables. There are two types of macros: Set macros and Control macros, they will be explained in further detail throughout the project. In order to calculate the steam cycle efficiency it was necessary to use a Set macro. These types of macros assign a mathematical expression to a user-defined variable. In this case a variable under the name of steam cycle efficiency was created and assigned to the expression: cycle Net _ cycle _ power m h h in,air out,air 40
, on the collector plane and on the temperature difference")
41 3.7. Macro used to calculate the collector s efficiency Another Set macro will be used to calculate the collector efficiency. The collector s efficiency depends on various technical parameters. In the case of this project it has been decided to use a simplified expression 26 that depends only on the sun s direct irradiation (I), on the collector plane and on the temperature difference between the environment and the mean collector temperature ( T ). Assuming a North-South orientation of the plant s mirrors, the collector is oriented horizontally at noontime and therefore the value of I corresponds to the direct radiation on the horizontal plane, which is available from solar maps. According to the PVGIS solar map 22, the site of Barletta (41.32N, 16.28E) receives a global radiation of 799 W/m 2, and a diffuse radiation of 205 W/m 2. The horizontal direct radiation is 600 W/m 2. 41
 22 Tmc: The mean temperature in the collector.")
42 collector T I T I T 2 This time it will be necessary to create several user-defined-variables. I: Barletta s sun irradiation at design point (600 W/m 2 ) 22 Tmc: The mean temperature in the collector. T mc T inlet,collector 2 T outlet,collector Tamb: The mean temperature in Barletta at design point (20 C) 22 ΔT: The temperature difference between the environment and the mean collector temperature T T mc Tamb As it is shown in the image above, the collector efficiency is ηcollector = 67%. 42
43 3.8. The overall plant efficiency Once the efficiency for the collector has been calculated and also that the steam cycle efficiency for the three cases (one, two and three regenerators); it is possible to calculate the global plant efficiency. global cycle collector cycle collector global One regenerator 34% 67% 23% Two regenerators 36% 67% 24% Three regenerators 37% 67% 25% 3.9. Macro used to calculate the oil flow rates for a 50 MW plant As it has been explained previously, some hypothesis were made in order to study how the plant worked and how the regenerators affected the cycle efficiency, power, temperatures and other factors. For instance, with the hypotheses made, the installation using three regenerators gives a net power of 0.55 MW, while the one using one regenerator gives 0.52 MW; this helps to give a general idea of the influence of the number of regenerators in the plant. However, the plant that is being designed should give a fix power of 50 MW. In order to calculate the real oil flow rates a control macro was utilized. 43

44 Macros are a set of tools that help the user to elaborate different types of calculations and carry out relationships between the cycle system and the equipment data. They are an algorithmic alternative to hand calculations. To create a macro it is necessary to know which variables will be needed and which parts of the simulation equipment will be accessed. The GateCycle software displays a wide set of variables from the simulation equipment. However, in some cases it is also necessary to create user-defined-variables that can be relationships or calculations using the GateCycle variables. There are two types of macros: Set macros and Control macros, they will be explained in further detail throughout the project. Control macros are used when the desired variable to be changed is an output variable, which is the case of the net cycle power. They set the chosen output variable to the desired value by changing a defined input variable. In this case it will set the net cycle power to 50 MW by changing the airflow rate from 10 kg/s, which was the initial hypothesis, to the corresponding value. 44
45 The obtained results for the three cases (one, two and three regenerators) are the following: Power (MW) Air flow rate (kg/s) Oil flow rate (kg/s) One regenerator Two regenerators Three regenerators Power (MW) Air flow rate (kg/s) Oil flow rate (kg/s) One regenerator Two regenerators Three regenerators Macro used to calculate the collectors surface Because the dimensions in which a solar plant are limited and sometimes occupying a larger surface also entails a highly priced plant, a crucial parameter in the designing stage is to determine the surface that it will occupy. The efficiency expression for the collectors is: collector T I T I T 2 However, another expression that is always valid for efficiency in solar collectors is: 45

46 collector Q A I Being I the sun irradiation, A the overall surface and Q the heat power transmitted by the collectors: Q m ( h out,coll h in, coll ) It is important to bear in mind that hout,coll is the enthalpy at which the oil enters the plant, in the same way that hin,coll is the enthalpy at which the oil exits the system. The collectors give this energy difference. A set macro was used to determine the surface occupied by the plants with one, two and three regenerators. The obtained results where the following: 46
47 Qcollectors (MW) A (m 2 ) global One regenerator ,4 23% Two regenerators ,3 24% Three regenerators ,2 25% Influence of environment temperature on the plant Once that the influence of the number of regenerators has been studied it is time to study how other factors affect the designed plant. Environment temperature is directly related to the overall plant efficiency and, therefore to the power of the plant. In the previous study a temperature of 20 C was used as the design point temperature. Nevertheless, it is important to study what happens when this temperature is different from the design point and how strongly it affects the plant s performance. This study will be fulfilled using the one-regenerator scheme. In order to do so a study will be made using different temperature values: 0, 5, 10, 15, 20, 25, 30, 35, 40 and 45 C. 47
48 Global plant efficiency [%] Collector efficiency [%] Environment temperature vs. Collector efficiency Environment temperature [ C] Environment temperature vs. Global plant efficiency Environment temperature [ C] It is also important to study how the environment temperature affects the power produced by the plant. The overall plant efficiency, which was calculated before can also be defined as the electrical power produced, divided by the power that comes from the sun: 48
49 Plant power [MW] global cycle collector P P elect sun P I elect A Being that the total surface covered by the plant does not change throughout the lifetime of the plant and that the sun irradiation is considered constant for this part of the study, the following graphic shows how the temperature affects the power given by the plant: Environment temperature vs. Plant power Environment temperature [ C] As it is shown on the graphics and can also be deduced from the collector efficiency expression, a temperature rise entails also an efficiency increment. However, a 45 C temperature difference affects the overall plant efficiency in approximately a 0.6%. It is similar in the case of the power given by the plant. A difference of 1.4 MW can be noticed when varying the temperature from 0 to 45 C, which approximately represents a 0.4% of the total power. Therefore it can be 49
50 Plant power [MW] considered acceptable to use the design point temperature in the simulation of the plant Influence of the working fluid s pressure and temperature of entrance Until now the temperature and the pressure of entrance of the working fluid have been considered constant and equal to the initial hypotheses estimations. However, in the same way it was important to study how the environment temperature affected the overall efficiency and the power given by the plant, it is also important to verify how the pressure and temperature influence the plant s performance. As it can be seen in the oil s technical data sheet, the temperatures it can reach when working in the plant are limited by the recommended maximum and minimum, established to avoid reaching the auto ignition or the freezing point. Oil inlet temperature vs. Plant power Oil inlet temperature [ C] 50
51 Global plant efficiency [%] Steam cycle Efficiency [%] Oil inlet temperature vs. Steam cycle efficiency Oil inlet temperature [ C] Oil inlet temperature vs. Global plant efficiency Oil inlet temperature [ C] 51
52 Collector efficiency [%] Temperature [ C] Oil inlet temperature vs. Oil outlet temperature, superheater outlet temperature Oil inlet temperature [ C] Oil inlet temperature vs. Oil outlet temperature Oil inlet tempearture vs. Superheater outlet temperature Oil inlet temperature vs. Collector efficiency Oil inlet temperature [ C] 52
53 Water pressure [bar] Oil inlet temperature vs. Water pressure Oil inlet temperature [ C] As it can be seen in the graphics above, the oil temperature of entrance is a determinant and influential variable in the plant s performance. Before explaining the significant results in the power and the efficiency it is important to explain the Oil inlet temperature vs. Water pressure and the Oil inlet temperature vs. Superheater outlet temperature graphs. These are all input variables that were altered in the following way for the correct functioning of the system: Water pressure: One bar was increased in the pump pressure for every 5- Celsius degree increase in the oil inlet temperature. Superheater outlet temperature: The superheater outlet temperature was modified in such way that it was always 20-Celsius degrees lower than the oil inlet temperature and therefore was increased in 5-Celsius degrees for every 5-Celsius degree increase in the oil inlet temperature. 53
54 The output was the oil outlet temperature, the plant power and the efficiencies. As it can be seen in the Oil inlet temperature vs. Oil outlet temperature graphic, no significant changes occur in the oil outlet temperature when changing the oil inlet temperature and therefore the oil outlet temperature will be considered constant. In the case of the power given by the plant, one of the variables of greater relevance in this study, it can be seen that it increases when increasing the oil inlet temperature. On the one hand, by increasing the temperature of entrance the enthalpy of entrance is also increasing and therefore, in simple words, it can be said more energy is entering the system. Whereas, on the other hand, and as it was mentioned before, the oil outlet temperature remains practically constant and therefore the same energy is exiting the system. This entails an increase in the energy that stays in the system and therefore in the plant s power. It can also be seen from the point of view that when increasing the oil inlet temperature the superheater temperature of exit also increases and therefore the steam that arrives to the turbines arrives with a greater amount of enthalpy, which causes the turbines to give a greater power. Another important matter in this study is the overall efficiency. As it can be seen from the Oil inlet temperature vs. Global plan efficiency graphic, the plant s overall efficiency increases when increasing the oil s temperature of entrance. Knowing that the overall efficiency is the produced power of the plant divided by the irradiation power coming from the sun ( Pr oduced _ power Power _ from _ the_ sun P I A global ) and being that both the irradiation (I) and the Surface of the plant (A) have remained constant, the efficiency increase could have also been deducted by the increase in the plant s power. There is another interesting perspective from which to study this increase, which is from the fact that the global efficiency is also the product between the cycle efficiency and the collector s efficiency. The first one, as it can be seen in the Oil inlet temperature vs. Cycle efficiency graphic, increases when increasing the oil s temperature of entrance; whereas the collector s efficiency decreases when increasing the oil s inlet temperature, as it is shown in the Oil inlet temperature vs. Collector efficiency graphic. The collector s efficiency 54
55 does not decrease so steeply, in such a way that the product of both efficiencies increases when increasing the oil s temperature of entrance. The same study was done varying the pressure of entrance from 100 bar to 40 bar by 10 bar increments and it was verified that no relevant changes occur The addition of a cooling tower (Fig 20.) Industrial cooling towers 17. A cooling tower is a heat rejecting device that extracts the unwanted heat from a system by decreasing a water stream s temperature. They are used when limited water 55
56 resources to cool the water stream are available nearby or, in the cases where the water stream is cooled with water from a river or the ocean, there is a temperature outlet limit which can not be exceeded. In those cases the condenser is connected to a cooling tower. There are two main types of cooling towers: wet cooling towers and dry cooling towers. Wet cooling towers have a consumption of water that is approximately equal to the steam flowrate that is condensed in the condenser. Dry cooling towers do not consume water at all. In wet cooling towers water is cooled by exterior air through two simultaneous processes: latent heat transfer and sensible heat transfer. In other words, water temperature is decreased partly because of heat exchange with air (sensible heat transfer) and partly because of evaporation of water droplets (latent heat transfer). About 80 percent of the cooling process is due to vaporization and the other 20 percent is due to heat exchange. 56
 and is sprinkled into water droplets at (2), the spray nozzles.")
57 Fig 21. Functioning scheme of a wet cooling tower. Figure 21 is a scheme of a wet cooling tower, which helps in the understanding of its functioning 17. The water stream to be cooled enters the cooling tower at (1) and is sprinkled into water droplets at (2), the spray nozzles. In a parallel way, dry air enters the tower from beneath at (3) and is propelled upward, as we can see from the figure in (4). When dry air is travelling up it comes in contact with the sprinkled water droplets which begin to evaporate and humidify this dry air, transforming it into saturated air at its exit from the tower (5). This is where both heat transfer processes occur. When water is in contact with cool ambient air its temperature decreases because of sensible heat transfer with air. In a parallel way, the energy needed by the water droplets to evaporate is taken from the water and therefore this water is cooled. The cooled water descends (6), is collected at the collection basin and is then returned to the system (7). In dry cooling towers, on the other hand, no water evaporation takes place and therefore are less effective devices than wet cooling towers, apart from the fact that the cooling 57

58 potential of a wet surface is greater than the one with a dry surface. Dry cooling towers are sometimes used when there is a lack of water resources. The geographical situation of the designed plant permits the use of a wet cooling tower. Therefore the scheme including a cooling tower was studied to contemplate the situation in case it is needed. 58
59 The obtained results, however, are not as beneficial as they would be searched to be. The adding of the cooling tower entails a slight decrease in the plant s power, of about 10 kw but a more important decrease in the steam cycle efficiency. The cycle s efficiency diminishes in approximately 10 per cent; it goes from 33.8% when the cooling tower is not used and a 30.7% when the tower is added to the scheme. This is due to the fact that, in order for it to function properly, the condenser outlet pressure is necessarily increased when using a cooling tower. This also entails an increase in the condenser s outlet temperature. The pressure rise goes from 0.05 bar to 0.2 bar, whereas the temperature increase goes from K to K; 300 and nine per cent respectively. Apart from this, the ventilation system that propels the humid air to the exit of the cooling tower is driven by the power produced by the plant and therefore this is also one of the reasons why it diminishes. 4. The plant s final design and design point After studying the influence of the different parameters and input variables in the plant s performance it is time to decide the best solution and the most adequate scheme for the designed plant. To begin with, the scheme using three regenerators is considered the most adequate for the plant. It provides a significant decrease in the occupied surface, compared to the one and two-regenerator scheme. Apart from this, as it has been mentioned in previous sections of the project, it provides the plant with the highest efficiency and power combination. The working fluid to be used is the DOWTHERM A oil from the Dow Chemical Company. It is one of the best working fluid oils that can be found in the market today. As a matter of fact, it is the working fluid used in the Andasol project. The technical data of this fluid is stated below. 59
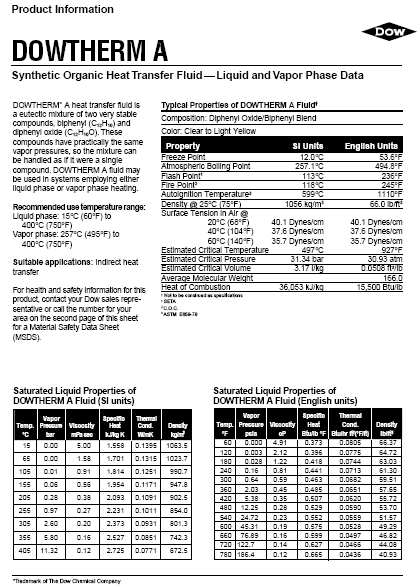
60 60
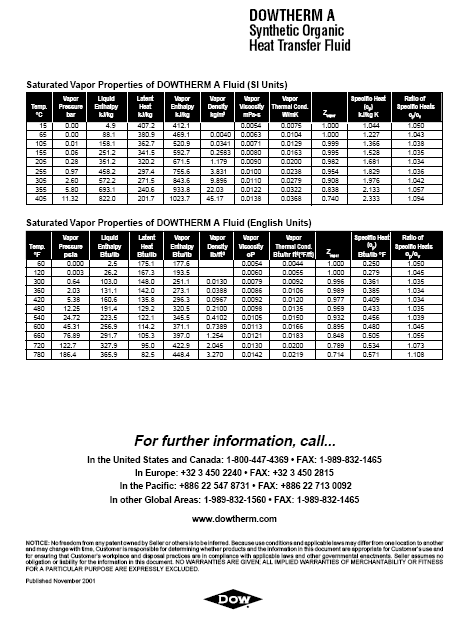
61 61
62 Throughout the project, the environment temperature influence was also studied. The simulations showed that an increase in the environment temperature caused an increase in the power provided by the plant and its efficiency. The temperature for the design point will be 20 C, as it can be considered a typical mean daytime temperature on a sunny day, which is the design point situation. The irradiation design point that has been considered constant throughout the project is 600 W/m 2. Another important aspect studied along the project was the influence of the oil s inlet temperature in the system. The results from the simulations showed that the increasing of the oil s inlet temperature entails an increase of both power and efficiency in the plant. However, a temperature higher than 400 C is not recommended by the oil s supplier, the Dow Chemical Company. Therefore the best solution for the oil inlet temperature at the design point is 400 C. As for the pump pressure increase, a 50 bar pressure increase has demonstrated to significantly provide the best combination of power and efficiency and therefore it will be used for the design of this plant. The final scheme for the designed plant is the following: 62

63 At the design point it gives a power of 50 MW, occupying a surface of 340,160 m 2, with an oil flow rate of 491 kg/s, a cycle efficiency of 37% and a global plant efficiency of 25%. The final scheme when using a cooling tower is the following: As previously stated, the results when using a cooling tower differ from the ones of the scheme without a cooling tower. In fact, the cycle efficiency diminishes from 37% to 32% and therefore the global efficiency for this scheme is 22%. This also entails that, if the plant s power is to remain constant at 50 MW, when using a cooling tower, the needed surface is 387,016 m 2. 63
64 4.1. Functioning description of the designed plant This section explains the functioning of the designed plant. For this matter the plant will be divided in two main parts: the oil part and the water part. The oil part: In the above schemes, the streams containing oil are drawn in red. The oil that exits the sun collectors at a temperature of 400 C enters the system and is divided in two equal flows by a splitter. Each one of these flows enters a superheater where a heat exchange process between steam and oil takes place (oil transfers part of its heat to steam). After this, both oil streams enter a mixer where they are put together again. The oil flow then goes through the evaporator, where it transfers heat to water for its complete evaporation. Before exiting the system and going back to the sun collector, the oil stream passes through the economizer where it transfers heat to water so that it has a higher temperature at the entrance of the evaporator. After this the oil returns to the sun collector to gain heat power and repeat the cycle. The water/steam part: Beginning at the entrance of the pump: Water enters the pump at 33 C and 0.05 bar of pressure (0.2 when using a cooling tower). The pump increases this pressure up to 50 bar, pressure at which the water enters the superheaters where it receives heat from the steam coming from the exit of the turbines. The water exits the last superheater at a temperature of 180 C and a pressure of 50 bar. At this point it enters the economizer where, as it is mentioned previously in the oil section, exchanges heat with the oil, increasing its temperature to 253 C. It then goes through the evaporator where, by the heat exchange process with oil, changes phase from water to steam and receives a 11 C increase. The 264 C steam enters the superheater where its temperature reaches the 380 C; after of which it enters the first turbine, leaving in which 16.5 MW of heat power. The resulting flow is divided in two streams, one of which goes to the last regenerator to release its heat and give it to the water stream that was mentioned previously. The other stream enters another superheater 64
65 where its temperature rises again to 380 C and it then goes enters the second turbine. In the second turbine there are a total of three extractions made. The first one, at a pressure of 2.92 bar, goes to the second superheater, where it gives heat power to liquid water. The same happens to the second extraction that, at a pressure of 0.55 bar, goes to the first superheater. The last extraction that is made at 0.05 bar and 0.2 bar in the case of using a cooling tower, goes to the condenser where it changes to water to restart the cycle by entering the pump. It is important to mention that the regenerators, once they have used the heat power from steam to increase the water s temperature, give back the resulting water to the economizer for its cooling and restarting of the cycle at the pump. The following is a Q-T diagram that illustrates the heat exchange process that takes place between oil and steam/water. (Fig. 22) Q-T heat Exchange diagram between oil and water 65
66 The blue lines represent the water/ steam, whereas the red line represents the oil stream. (1) is the water s inlet point into the economizer, where it begins to receive heat power from the oil. A horizontal line with no temperature increase can be noted in the water stream; this is the part when the phase changes of water to steam takes place; inside the evaporator. After this the steam temperature continues to rise until it arrives to (2), which is the steam s inlet temperature into the turbine: 380-Celsius degrees. This second temperature increase process takes place in both the evaporator and the superheater. As for the oil, it can be seen that it follows a more or less constant slope line. This is because no changes of phase take place in this case and its temperature varies gradually. (3) is the oil s entrance point, whereas (4) is its exit point, at 257,5 Celsius degrees. It can also be observed in the graphic that the oil stream and the water stream go in opposite directions this is because while the oil is donating its heat the water/steam is receiving it from it. Apart from this a descendant line that comes after (2) can be noted. This is the representation of the entering of the steam into the first turbine. It goes in the opposite direction as before, which makes sense because it is giving away part of its power for it to be transformed into mechanical and then electrical power. The following is the final plant thermodynamic cycle diagram. The red line is the water saturation line; the blue lines stand for the expansion processes and the black lines stand for the constant pressure processes 66

67 (Fig 23.) Thermodynamic diagram of the cycle. 5. Conclusions The main conclusion of this project is the designed final scheme, as well as the design point. The plant was decided to have two turbines, two superheaters and three regenerators. It uses a pump pressure increase of 50 bar and an inlet oil temperature of 400-Celsius degrees. The environment temperature of Barletta is considered to be 20-Celsius degrees and its sun irradiation 600 W/m 2. It was seen that the increasing of the oil s inlet temperature entailed an increase in both the global efficiency of the plant and its power. When varying the oil s inlet pressure, however, no similar results were noted. In fact the variation of this pressure did not bring any significant changes. The rising of the environment temperature, as it happens with the oil s inlet temperature, also entailed an increase in the global efficiency and the power given by the plant. An increase in the efficiency was noted when increasing the pump s pressure; however, since the 67
68 pump receives the power from the plant, the rise of this pressure also entailed a decrease in the power given by the plant. During this study a plant with a cooling tower was also simulated. Cooling towers are used when no water resources for cooling are available or when the available ones cannot be used because of temperature or pollution restrictions. For the correct functioning of the plant, the addition of a cooling tower entails an increase in the turbines outlet pressure, which not only affects the power negatively but also significantly decreases the overall efficiency of a plant. There are also other less technical conclusions. During this project it was learnt that the variation of each variable, parameter or piece of equipment could bring remarkable differences in a plant s performance. When working in a designing stage it is important to contemplate and study the influence of every aspect that is related or can affect the plant. It is once all the results are shown and the user has a global idea of what is being designed, that coherent conclusions can be drawn from a project. 68
69 6. References 1) ed%20sept2010.pdf 2) 3) 4) 5) 6) 7) 8) 9) V/D.%20Antonio%20Gómez%20Zamora%20- %20Andasol%20I%20y%20II,%20ACS-Cobra.pdf 10) 11) 12) 13) 14) 15) 16) 300x221.jpg 17) 69
70 18) b89.pdf?filepath=heattrans/pdfs/noreg/ pdf&fromPage=GetDoc 19) 20) 21) 22) 23) 24) 25) 30y/csp/PTPP.html#ap 26) Ref: Blanco J., Alarcón D., Sánchez B., Malato S., Maldonado M., Hublitz A., Spinnler M., Technical comparison of different solar-assisted heat supply systems for a multieffect seawater distillation unit, ISES Solar World Congress 2003 Solar Energy for a Sustainable Future Göteborg, Sweden June, 14-19,
VGB Congress Power Plants 2001 Brussels October 10 to 12, 2001. Solar Power Photovoltaics or Solar Thermal Power Plants?
 VGB Congress Power Plants 2001 Brussels October 10 to 12, 2001 Solar Power Photovoltaics or Solar Thermal Power Plants? Volker Quaschning 1), Manuel Blanco Muriel 2) 1) DLR, Plataforma Solar de Almería,
Solar energy and power
 Solar energy and power Solar Basics Energy from the Sun The sun has produced energy for billions of years. Solar energy is the sun s rays (solar radiation) that reach the Earth. This energy can be converted
Abstract. emails: [email protected], [email protected], phone: 860-429-6508, fax: 860-429-4456
 SOLAR THERMAL POWER PLANT WITH THERMAL STORAGE Ronald C. Derby, President Samuel P. Lazzara, Chief Technical Officer Cenicom Solar Energy LLC * Abstract TM employs 88 parabolic mirrors (concentrating dishes)
Renewable Solar. Solar Basics. Energy from the Sun. Solar Energy Can Be Used for Heat and Electricity
 Renewable Solar Solar Basics Energy from the Sun The sun has produced energy for billions of years. Solar energy is the sun s rays (solar radiation) that reach the Earth. This energy can be converted into
Solar Energy Alternative and their Potential in the Arab World
 Short Paper Series Short paper #2 Solar Energy Alternative and their Potential in the Arab World - August 2008 - Written and Researched by: Taha Roushdy Edited by: Ahmed Zahran - 1 - The aim of the short
ENERGY PRODUCING SYSTEMS
 ENERGY PRODUCING SYSTEMS SOLAR POWER INTRODUCTION Energy from the sun falls on our planet on a daily basis. The warmth of the sun creates conditions on earth conducive to life. The weather patterns that
Testing and Performance of the Convex Lens Concentrating Solar Power Panel Prototype
 Testing and Performance of the Convex Lens Concentrating Solar Power Panel Prototype Ankit S. Gujrathi 1, Prof. Dilip Gehlot 2 1 M.tech (2 nd Year), 2 Assistant Professor, Department of Mechanical Engg.,
Solar power for sustainable energy
 Solar power for sustainable energy Prepared by: Ahmed Al Busaidi, Oman Water Society Antonio Palacios, Inabensa Oman Eng. Narineh Simonian, Inabensa Oman Index 1 Introduction to Solar technology and different
Steam turbines for solar thermal power plants. Industrial steam turbines. Answers for energy.
 Steam turbines for solar thermal power plants Industrial steam turbines Answers for energy. Power without carbon dioxide The advantage of solar energy is that the fuel is free, abundant and inexhaustible.
Solar One and Solar Two
 Solar One and Solar Two Solar One generated electricity between 1982 and 1988. (178-182) Solar One generated steam directly from water in its receiver, but its direct steam system had low efficiency in
Solar Energy System Design
 1. Solar Energy System Design The largest solar electric generating plant in the world produces a maximum of 354 megawatts (MW) of electricity and is located at Kramer Junction, California. This solar
Solare termico altre applicazioni. G.V. Fracastoro
 Solare termico altre applicazioni G.V. Fracastoro CSP per produzione elettrica Usati in combinazione con un impianto a ciclo termodinamico (Rankine o Stirling) point concentration systems (parabolic reflectors)
CONCENTRATING SOLAR POWER NOW CLEAN ENERGY FOR SUSTAINABLE DEVELOPMENT
 CONCENTRATING SOLAR POWER NOW CLEAN ENERGY FOR SUSTAINABLE DEVELOPMENT Dr. Franz Trieb German Aerospace Center (DLR) PRINCIPLE OF CONCENTRATING SOLAR POWER Heat from concentrating solar thermal collectors
Solar energy is available as long as the sun shines, but its intensity depends on weather conditions and geographic
 Solar Energy What is Solar Energy? The radiation from the sun gives our planet heat and light. All living things need energy from the sun to survive. More energy from sunlight strikes the earth in one
DOE Concentrating Solar Power 2007 Funding Opportunity Project Prospectus
 DOE Concentrating Solar Power 2007 Funding Opportunity Project Prospectus DOE Solar Energy Technologies Program Contact: Frank Tex Wilkins [email protected] Enabling a New Vision for Concentrating
Solar Energy Systems
 Solar Energy Systems Energy Needs Today s global demand for energy is approximately 15 terawatts and is growing rapidly Much of the U.S. energy needs are now satisfied from petroleum (heating, cooling,
Transient Analysis of Integrated Shiraz Hybrid Solar Thermal Power Plant Iman Niknia 1, Mahmood Yaghoubi 1, 2
 Transient Analysis of Integrated Shiraz Hybrid Solar Thermal Power Plant Iman Niknia 1, Mahmood Yaghoubi 1, 2 1 School of Mechanical Engineering, Shiraz University, Shiraz, Iran 1, 2 Shiraz University,
Solar and Hydroelectric Power. Abbie Thill Becca Mattson Grace Nordquist Keira Jacobs Miyabi Goedert
 Solar and Hydroelectric Power Abbie Thill Becca Mattson Grace Nordquist Keira Jacobs Miyabi Goedert Photovoltaic Cell vs Solar Heating Panel Photovoltaic cells power things such as calculators and satellites.
Module 2.2. Heat transfer mechanisms
 Module 2.2 Heat transfer mechanisms Learning Outcomes On successful completion of this module learners will be able to - Describe the 1 st and 2 nd laws of thermodynamics. - Describe heat transfer mechanisms.
Engineering and Construction for Sustainability Solar Concentration Workshop World Bank November 5th, 2008
 Engineering and Construction for Sustainability Solar Concentration Workshop World Bank November 5th, 2008 Table of Contents 1. Abener General Presentation 2. Solar Thermal Technology. 3. Market - Development
Dynamic modelling of a parabolic trough solar power plant
 Robert Österholm a, Jens Pålsson b a Lund University, LTH, Department of Energy Sciences, Lund, Sweden b Modelon AB, Ideon Science Park, Lund, Sweden [email protected], [email protected] Abstract
Station #1 Interpreting Infographs
 Energy Resources Stations Activity Page # 1 Station #1 Interpreting Infographs 1. Identify and explain each of the energy sources (5) illustrated in the infograph. 2. What do the white and black circles
Solar Tracking Application
 Solar Tracking Application A Rockwell Automation White Paper Solar trackers are devices used to orient photovoltaic panels, reflectors, lenses or other optical devices toward the sun. Since the sun s position
Solar Thermal Systems
 Solar Thermal Systems Design and Applications in the UAE Murat Aydemir Viessmann Middle East FZE General Manager (M.Sc. Mech.Eng., ASHRAE) Dubai Knowledge Village Congress Centre, Dubai 20.4.2009 Viessmann
Solar Thermal Energy Storage Technologies
 Solar Thermal Energy Storage Technologies Doerte Laing, German Aerospace Center (DLR) ENERGY FORUM, 10,000 Solar GIGAWATTS Hannover, 23. April 2008 Folie 1 Energy Storage for Concentrating Solar Power
Irradiance. Solar Fundamentals Solar power investment decision making
 Solar Fundamentals Solar power investment decision making Chilean Solar Resource Assessment Antofagasta and Santiago December 2010 Edward C. Kern, Jr., Ph.D., Inc. Global Solar Radiation Solar Power is
CHAPTER 2 Energy and Earth
 CHAPTER 2 Energy and Earth This chapter is concerned with the nature of energy and how it interacts with Earth. At this stage we are looking at energy in an abstract form though relate it to how it affect
Solar Concentrators. Author: Scott Elrod Palo Alto Research Center 3333 Coyote Hill Road Palo Alto, CA 94304 [email protected]
 Solar Concentrators Author: Scott Elrod Palo Alto Research Center 3333 Coyote Hill Road Palo Alto, CA 94304 [email protected] While flat-plate silicon photovoltaics dominated the 1GW market for solar generation
Solar Energy Systems. Matt Aldeman Senior Energy Analyst Center for Renewable Energy Illinois State University
 Solar Energy Solar Energy Systems Matt Aldeman Senior Energy Analyst Center for Renewable Energy Illinois State University 1 SOLAR ENERGY OVERVIEW 1) Types of Solar Power Plants 2) Describing the Solar
TERMOSOLAR BORGES: A THERMOSOLAR HYBRID PLANT WITH BIOMASS
 TERMOSOLAR BORGES: A THERMOSOLAR HYBRID PLANT WITH BIOMASS A. COT*, A. AMETLLER*, J. VALL-LLOVERA*, J. AGUILÓ* AND J.M. ARQUÉ* * COMSA EMTE MEDIO AMBIENTE, ITG, Av. Roma 25, 08029 Barcelona, Spain SUMMARY:
ALONE. small scale solar cooling device Project No TREN FP7EN 218952. Project No TREN/FP7EN/218952 ALONE. small scale solar cooling device
 Project No TREN/FP7EN/218952 ALONE small scale solar cooling device Collaborative Project Small or Medium-scale Focused Research Project DELIVERABLE D5.2 Start date of the project: October 2008, Duration:
The Power of Concentrating Solar
 The Power of Concentrating Solar Project Development and Implementation in the MENA Region Sonnenkolloquium Strom aus der Wüste, 29.6.2010 Ferrostaal AG Solar Energy Ferrostaal AG - Solar Energy Agenda
Name: Class: Date: 10. Some substances, when exposed to visible light, absorb more energy as heat than other substances absorb.
 Name: Class: Date: ID: A PS Chapter 13 Review Modified True/False Indicate whether the statement is true or false. If false, change the identified word or phrase to make the statement true. 1. In all cooling
Contact us. ABB Ltd. Business Unit Power Generation P.O. Box 8131 8050 Zurich, Switzerland Phone: +41 (0) 43 317-5380 Fax: +41 (0) 43 317-5382
 43 317-5380 Fax: +41 (0) 43 317-5382") Contact us ABB Ltd. Business Unit Power Generation P.O. Box 8131 8050 Zurich, Switzerland Phone: +41 (0) 43 317-5380 Fax: +41 (0) 43 317-5382 www.abb.com/powergeneration Copyright 2009 ABB. All rights
Contact us ABB Ltd. Business Unit Power Generation P.O. Box 8131 8050 Zurich, Switzerland Phone: +41 (0) 43 317-5380 Fax: +41 (0) 43 317-5382 www.abb.com/powergeneration Copyright 2009 ABB. All rights
6 th Grade Science Assessment: Weather & Water Select the best answer on the answer sheet. Please do not make any marks on this test.
 Select the be answer on the answer sheet. Please do not make any marks on this te. 1. Weather is be defined as the A. changes that occur in cloud formations from day to day. B. amount of rain or snow that
Boiler Calculations. Helsinki University of Technology Department of Mechanical Engineering. Sebastian Teir, Antto Kulla
 Helsinki University of Technology Department of Mechanical Engineering Energy Engineering and Environmental Protection Publications Steam Boiler Technology ebook Espoo 2002 Boiler Calculations Sebastian
MCQ - ENERGY and CLIMATE
 1 MCQ - ENERGY and CLIMATE 1. The volume of a given mass of water at a temperature of T 1 is V 1. The volume increases to V 2 at temperature T 2. The coefficient of volume expansion of water may be calculated
Cooking at the Speed of light!
 Cooking at the Infrared Cooking & Colouring Infrabaker is a modular infrared continuous cooking system developed by Infrabaker International. The machine is designed to cook and/or put colour on a wide
Energy Sources in Siciliy
 COMENIUS PROJECT Energy Sources in Siciliy Solar Energy Gas Energy Wind Energy Biomass Energy Thermic Energy Coal Energy Water Energy Geothermal Energy Map Power Plants Hidroelectric Power Plant Solar
CSP- Biomass Hybrid cogeneration system offers synergistic solution for continuous process industries. 9 th May 2013 Chennai
 CSP- Biomass Hybrid cogeneration system offers synergistic solution for continuous process industries RENERGY 2013 Innovation Session 9 th May 2013 Chennai T.S.Venkataraman & T.G.Sundara Raman Esvin Advanced
SOLAR THERMAL POWER PLANTS FOR HYDROGEN PRODUCTION
 SOLAR THERMAL POWER PLANTS FOR HYDROGEN PRODUCTION Volker Quaschning* and Franz Trieb** * Deutsches Zentrum für Luft- und Raumfahrt e.v (DLR) Plataforma Solar de Almería (PSA) Apartado 39 E-04200 Tabernas
Assessment of Solar-Coal Hybrid Electricity Power Generating Systems 13
 Journal of Energy and Power Engineering 6 (2012) 12-19 D DAVID PUBLISHING Assessment of Solar-Coal Hybrid Electricity Power Generating Systems Moses Tunde Oladiran 1, Cheddi Kiravu 1 and Ovid Augustus
SOLAR ENERGY How much strikes the earth? How much can my building get? When is it too much?
 SOLAR ENERGY How much strikes the earth? How much can my building get? When is it too much? The sun: friend of foe? Drawing by Le Corbusier ENGS 44 Sustainable Design Benoit Cushman-Roisin 14 April 2015
CSP Parabolic Trough Technology for Brazil A comprehensive documentation on the current state of the art of parabolic trough collector technology
 CSP Parabolic Trough Technology for Brazil A comprehensive documentation on the current state of the art of parabolic trough collector technology Seite 1 1. Introduction 1.1. History 1.2. Aspects for Parabolic
Dispelling the Solar Myth - Evacuated Tube versus Flat Plate Panels. W illiam Comerford Sales Manager Ireland Kingspan Renewables Ltd.
 Dispelling the Solar Myth - Evacuated Tube versus Flat Plate Panels W illiam Comerford Sales Manager Ireland Kingspan Renewables Ltd. 1 The Kingspan Group Energy independent buildings for a sustainable
Post graduate program for engineering leading to M.Tech in renewable energy systems with specialization in solar energy
 Post graduate program for engineering leading to M.Tech in renewable energy systems with specialization in solar energy 1.0 Introduction India s growing energy needs mixed with world s order for reducing
SOLAR TECHNOLOGY CHRIS PRICE TECHNICAL SERVICES OFFICER BIMOSE TRIBAL COUNCIL
 SOLAR TECHNOLOGY CHRIS PRICE TECHNICAL SERVICES OFFICER BIMOSE TRIBAL COUNCIL SOLAR TECHNOLOGY Photovoltaics Funding Options Solar Thermal Photovoltaics 1. What are they and how do they work? 2. The Solar
HEATING OF DOMESTIC OUTDOOR SWIMMING POOLS
 HEATING OF DOMESTIC OUTDOOR SWIMMING POOLS INTRODUCTION 1. There are no general EU regulations and standards for outdoor swimming pool heating. Local regulations in the member countries are covering most
A Novel Storage Technology Opens New Opportunities for CSP
 A Novel Storage Technology Opens New Opportunities for CSP Reuel Shinnar Dept. of Chemical Engineering The City College of The City University of New York The Future of CSP CSP is at presently the only
RENEWABLE ENERGY IN EGYPT
 Arab Republic of Egypt Ministry of Electricity & Energy New & Renewable Energy Authority (NREA) RENEWABLE ENERGY IN EGYPT Strategies, Achievements and Plans Eng. Mohamed Gamal Chief Engineer of Solar Thermal
APPLIED THERMODYNAMICS TUTORIAL 1 REVISION OF ISENTROPIC EFFICIENCY ADVANCED STEAM CYCLES
 APPLIED THERMODYNAMICS TUTORIAL 1 REVISION OF ISENTROPIC EFFICIENCY ADVANCED STEAM CYCLES INTRODUCTION This tutorial is designed for students wishing to extend their knowledge of thermodynamics to a more
HYBRID SOLAR - BIOMASS PLANTS FOR POWER GENERATION; TECHNICAL AND ECONOMIC ASSESSMENT
 Global NEST Journal, Vol 13, No 3, pp 266-276, 2011 Copyright 2011 Global NEST Printed in Greece. All rights reserved HYBRID SOLAR - BIOMASS PLANTS FOR POWER GENERATION; TECHNICAL AND ECONOMIC ASSESSMENT
Your Partner for Concentrated Solar Power Generation The Heart of Your Process
 1 Sulzer Pumps Your Partner for Concentrated Solar Power Generation The Heart of Your Process 2 Experience and Solutions You Can Rely on Around the world, the power industry is taking on the challenge
How To Build A Solar Energised Power Plant
 Project Title Solar Energised Power Plant Project Description In recent years energy crisis has become one of the most talked about issues around the world. Especially in the developing countries, the
AE BIO SOLAR AE BIO SOLAR HYBRID PLANT SOLAR/BIOMASS ADESSO ENERGIA SRL HYBRID PLANT SOLAR/BIOMASS THE BEGINNING OF A NEW ENERGY PRESENTATION
 ADESSO ENERGIA SRL AE BIO SOLAR THE BEGINNING OF A NEW ENERGY PRESENTATION Tel.0918887364 14.05.2014 fax 0917480735 Pagina 1 INTRODUCTION Adesso Energia is an innovative startup based in Palermo created
Renewable Energy. Solar Power. Courseware Sample 86352-F0
 Renewable Energy Solar Power Courseware Sample 86352-F0 A RENEWABLE ENERGY SOLAR POWER Courseware Sample by the staff of Lab-Volt Ltd. Copyright 2009 Lab-Volt Ltd. All rights reserved. No part of this
Solar and Wind Energy for Greenhouses. A.J. Both 1 and Tom Manning 2
 Solar and Wind Energy for Greenhouses A.J. Both 1 and Tom Manning 2 1 Associate Extension Specialist 2 Project Engineer NJ Agricultural Experiment Station Rutgers University 20 Ag Extension Way New Brunswick,
A Review on Power Generation in Thermal Power Plant for Maximum Efficiency
 International Journal of Advanced Mechanical Engineering. ISSN 2250-3234 Volume 4, Number 1 (2014), pp. 1-8 Research India Publications http://www.ripublication.com/ijame.htm A Review on Power Generation
CSP-gas hybrid plants: Cost effective and fully dispatchable integration of CSP into the electricity mix
 CSP-gas hybrid plants: Cost effective and fully dispatchable integration of CSP into the electricity mix Erik Zindel Director Marketing CSP (Power Block) Siemens AG PowerGen Europe 2012 Köln Messe, 12-14
Executive summary. - It has a favorable geographical location with significant direct solar irradiation.
 Executive summary Introduction The use of solar concentrated energy in thermal applications has very little presence in Spain. In particular, the integration of solar thermal systems in district heating
12.5: Generating Current Electricity pg. 518
 12.5: Generating Current Electricity pg. 518 Key Concepts: 1. Electrical energy is produced by energy transformations. 2. Electrical energy is produced from renewable and non-renewable resources. 4. Electrical
Sensitivity analysis for concentrating solar power technologies
 20th International Congress on Modelling and Simulation, Adelaide, Australia, 1 6 December 2013 www.mssanz.org.au/modsim2013 Sensitivity analysis for concentrating solar power technologies B. Webby a a
Solar Energy in Egypt Advantages and Obstacles
 Solar Energy in Egypt Advantages and Obstacles By Samir S. Ayad Professor of Mechanical Engineering Faculty of Engineering Benha University Email:[email protected] Cell Phone: +2 012 7871281 President
Data Bulletin. Mounting Variable Frequency Drives in Electrical Enclosures Thermal Concerns OVERVIEW WHY VARIABLE FREQUENCY DRIVES THERMAL MANAGEMENT?
 Data Bulletin April 2001 Raleigh, NC, USA Mounting Variable Frequency Drives in Electrical Enclosures Thermal Concerns OVERVIEW Variable frequency drives are available from manufacturers as enclosed engineered
Solar thermal collectors for medium temperature applications: a comprehensive review and updated database
 Available online at www.sciencedirect.com ScienceDirect Energy Procedia 00 (2015) 000 000 www.elsevier.com/locate/procedia SHC 2015, International Conference on Solar Heating and Cooling for Buildings
AP ENVIRONMENTAL SCIENCE 2012 SCORING GUIDELINES
 AP ENVIRONMENTAL SCIENCE 2012 SCORING GUIDELINES Question 2 The Fremont School District uses oil to heat school buildings. Go Green! is a new project the district will implement. The superintendent has
CHAPTER 5 PHOTOVOLTAIC SYSTEM DESIGN
 CHAPTER 5 PHOTOVOLTAIC SYSTEM DESIGN 5.1 Introduction So far in the development of this research, the focus has been to estimate the available insolation at a particular location on the earth s surface
Consider How can you collect solar energy for use in your school? What are other alternatives?
 5 a 5 Energy Sources a - Energy from the sun Purpose To explore sourcing our energy from the sun Key concepts Solar energy is a natural and renewable resource Heat energy from the sun can be used to heat
Fichtner s activities in Solar Engineering. Georg Brakmann Managing Director Fichtner Solar GmbH www.fichtnersolar.com
 Fichtner s activities in Solar Engineering Georg Brakmann Managing Director Fichtner Solar GmbH www.fichtnersolar.com 1 Company Brief International leading solar engineering consultant, established in
R ENEWABLE SOURCES CSP. Sustainable and cost-efficient solar thermal energy
 R ENEWABLE SOURCES CSP Sustainable and cost-efficient solar thermal energy 2 Turning environmental challenges into sustainable opportunities Feranova GmbH was founded in 2005 as a project development company
Solar Tower Systems. Status and Perspective. CSP Industry Days Dr. Reiner Buck. DLR Institute of Solar Research
 Solar Tower Systems Status and Perspective CSP Industry Days Dr. Reiner Buck DLR Institute of Solar Research slide 1 Advantages of Concentrating Solar Power (CSP) Plants dispatchability supply security
Physics PH1FP. (Jun15PH1FP01) General Certificate of Secondary Education Foundation Tier June 2015. Unit Physics P1. Unit Physics P1 TOTAL
 General Certificate of Secondary Education Foundation Tier June 2015. Unit Physics P1. Unit Physics P1 TOTAL") Centre Number Surname Candidate Number For Examiner s Use Other Names Candidate Signature Examiner s Initials Question Mark Science A Unit Physics P1 Physics Unit Physics P1 Friday 12 June 2015 General
Centre Number Surname Candidate Number For Examiner s Use Other Names Candidate Signature Examiner s Initials Question Mark Science A Unit Physics P1 Physics Unit Physics P1 Friday 12 June 2015 General
VITOSOL r 200-T SP2A. VITOSOL 200-T Type SP2A
 Technical Data Manual Model Nos. and pricing: see Price List Vacuum tube collector based on the heat pipe principle For the utilisation of solar energy VITOSOL r 200-T SP2A Product may not be exactly as
Rainwater Harvesting
 Rainwater Harvesting With climate change now a reality rather than a speculated possibility, the demand on water resources has gone up, whilst the amount of water available for supply has gone down. Forth
Vicot Solar Air Conditioning. V i c o t A i r C o n d i t i o n i n g C o., l t d Tel: 86-531-8235 5576 Fax: 86-531-82357911 Http://www.vicot.com.
 Vicot Solar Air Conditioning V i c o t A i r C o n d i t i o n i n g C o., l t d Tel: 86-531-8235 5576 Fax: 86-531-82357911 Http://www.vicot.com.cn Cooling, heating, and domestic hot water. Return on investment
Torino Nord. Cogeneration Plant. The gas turbine. The steam generator. The Torino Nord cogeneration plant produces electricity and heat for district
 PLANT TORINO NORD Iren Energia is the company in the Iren Group whose core businesses are the production and distribution of electricity, the production and distribution of thermal energy for district
The days of cheap abundant electricity are over! This article forms part
 Solar Power for Metal Finishers By Helmut Hertzog of Atlantic Solar The days of cheap abundant electricity are over! This article forms part of a series of articles where we will explore the possibility
Performance analysis of a Gamma type Stirling engine using three different solar concentrators
 Performance analysis of a Gamma type Stirling engine using three different solar concentrators Krishanu Ganguly 1, Bhushan Dewangan *2, Sumit Banerjee 3, Rajeev Kumar 4 1 Krishanu Ganguly 2 Bhushan Dewangan
Solar Thermal Power Plants From Vision to Realisation
 S H O R T P R O F I L E F L A G S O L Solar Thermal Power Plants From Vision to Realisation P R O F I L E Our everyday work is dedicated to putting global energy supply on a sustainable basis. Flagsol
Master of Science Program (M.Sc.) in Renewable Energy Engineering in Qassim University
 in Renewable Energy Engineering in Qassim University") Master of Science Program (M.Sc.) in Renewable Energy Engineering in Qassim University Introduction: The world is facing the reality that the global energy demand is increasing significantly over the coming
Master of Science Program (M.Sc.) in Renewable Energy Engineering in Qassim University Introduction: The world is facing the reality that the global energy demand is increasing significantly over the coming
PERFORMANCE EVALUATION OF WATER-FLOW WINDOW GLAZING
 PERFORMANCE EVALUATION OF WATER-FLOW WINDOW GLAZING LI CHUNYING DOCTOR OF PHILOSOPHY CITY UNIVERSITY OF HONG KONG FEBRUARY 2012 CITY UNIVERSITY OF HONG KONG 香 港 城 市 大 學 Performance Evaluation of Water-flow
Humidity, Condensation, Clouds, and Fog. Water in the Atmosphere
 Humidity, Condensation, Clouds, and Fog or Water in the Atmosphere The Hydrologic Cycle Where the Water Exists on Earth Evaporation From the Oceans and Land The Source of Water Vapor for the Atmosphere
Renewable Wind. Wind Basics. Energy from Moving Air. The Daily Wind Cycle. Wind Energy for Electricity Generation
 Renewable Wind Wind Basics Energy from Moving Air Wind is simply air in motion. It is caused by the uneven heating of the Earth's surface by the sun. Because the Earth's surface is made of very different
Optimum Solar Orientation: Miami, Florida
 Optimum Solar Orientation: Miami, Florida The orientation of architecture in relation to the sun is likely the most significant connection that we can make to place in regards to energy efficiency. In
ENEA Thermodynamic Solar Project. Prepared by Mauro Vignolini Presented by A. Fontanella Italy China Innovation Forum - November 8, 2010
 ENEA Thermodynamic Solar Project Prepared by Mauro Vignolini Presented by A. Fontanella ENEA objective To produce electricity by solar plant at high temperature (550 C) using molten salt. the advantages
Impact of Reflectors on Solar Energy Systems
 Impact of Reflectors on Solar Energy Systems J. Rizk, and M. H. Nagrial Abstract The paper aims to show that implementing different types of reflectors in solar energy systems, will dramatically improve
www.universityquestions.in
 DEPARTMENT OF ELECTRICAL AND ELECTRONICS ENGINEERING QUESTION BANK SUBJECT: ME6701-POWER PLANT ENGINEERING YEAR/SEM: III/V UNIT-I COAL BASED THERMAL POWER PLANTS 1. What are the processes of rankine cycle?
Why is it renewable? Well, the sun will always be there for us, and we can use as much of the sun s energy as we want and it will never run out.
 6. Solar Energy So far we have been looking at how to reduce CO 2 emissions by cutting down on our use of fossil fuels. Now let s look at getting renewable energy from the sun. Why is it renewable? Well,
FACTS ABOUT CLIMATE CHANGE
 FACTS ABOUT CLIMATE CHANGE 1. What is climate change? Climate change is a long-term shift in the climate of a specific location, region or planet. The shift is measured by changes in features associated
Kinetic Theory. Energy. Transfers and Efficiency. The National Grid
 AQA P1 Revision Infrared Radiation Heating and Insulating Buildings Kinetic Theory Energy Transfers and Efficiency Energy Transfer by Heating Transferring Electrical Energy Generating Electricity The National
SPQ Module 3 Solar Power
 SPQ Module 3 Solar Power The sun is the source of all life on earth. Yet we sometimes forget how central it is to our every activity. We stumble through our daily routine worrying about the mundane tribulations
Solar Heating Basics. 2007 Page 1. a lot on the shape, colour, and texture of the surrounding
 2007 Page 1 Solar Heating Basics Reflected radiation is solar energy received by collectorsfrom adjacent surfaces of the building or ground. It depends a lot on the shape, colour, and texture of the surrounding
Receiver für Salzschmelzen Der nächste Schritt in der Parabolrinnentechnologie
 Receiver für Salzschmelzen Der nächste Schritt in der Parabolrinnentechnologie 16. Sonnensymposium, DLR Köln, 12.06.2013 Dr. Thomas Kuckelkorn, Dr. Patrick Haibach, Dr. Hanno Kamp, Dr. Markus Arntzen,
Catching the Sun The Physics of Solar Energy
 VEA Bringing Learning to Life Program Support Notes Junior Middle Secondary Catching the Sun The Physics of Solar Energy 18 mins Teacher Notes by Amanda Bianco, B.Sc.Ed. Produced by VEA Pty Ltd Commissioning
SOLAR WATER PURIFICATION WITH THE HELP OF CSP TECHNOLOGY
 Sci. Revs. Chem. Commun.: 3(2), 2013, 128-132 ISSN 2277-2669 SOLAR WATER PURIFICATION WITH THE HELP OF CSP TECHNOLOGY JINESH S. MACHALE *, PRACHI D. THAKUR, PIYUSH S. LALWANI and GAYATRI M. APTE Department
AREVA SOLAR. Presentation title Presenter/ref. - 19 August 2010 - p.1
 Presentation title Presenter/ref. - 19 August 2010 - p.1 Kimberlina CLFR Solar Thermal Power Plant Clean, Reliable Superheated Steam Silicon Valley Photovoltaic Society Table of Contents AREVA Solar AREVA