SPSS and AMOS. Miss Brenda Lee 2:00p.m. 6:00p.m. 24 th July, 2015 The Open University of Hong Kong
|
|
|
- Vivian Harmon
- 8 years ago
- Views:
Transcription
1 Seminar on Quantitative Data Analysis: SPSS and AMOS Miss Brenda Lee 2:00p.m. 6:00p.m. 24 th July, 2015 The Open University of Hong Kong SBAS (Hong Kong) Ltd. All Rights Reserved. 1 Agenda MANOVA, Repeated Measures ANOVA, Linear Mixed Models Demo and Q&A EFA Demo and Q&A CFA and SEM Demo and Q&A SBAS (Hong Kong) Ltd. All Rights Reserved. 2
 Ltd. 2")
2 What is MANOVA MANOVA is short for Multivariate ANalysis Of Variance Have one or more independent variables and two or more dependent variables Tests for population group differences on several dependent measures simultaneously (a set or vector of means) SBAS (Hong Kong) Ltd. All Rights Reserved. 3 What is MANOVA (cont d) Two Groups Compared on Three Outcome Measures SBAS (Hong Kong) Ltd. All Rights Reserved. 4
 Two Groups Compared on Three Outcome Measures SBAS (Hong Kong) Ltd.")
3 MANOVA Assumptions Large samples or multivariate normality Homogeneity of the within group variance covariance matrices (Box s M test) Residuals (errors)follow a multivariate li i normal distribution in the population Linear model (additivity, independence between the error and model effect, independence of the errors) SBAS (Hong Kong) Ltd. All Rights Reserved. 5 What to Look for in MANOVA Multivariate statistical tests Post hoc test on marginal means (univariate only) Type 1 through htype 4 sums of squares Specify Multiple Random Effect models, if necessary Residuals, predicted d values and influence measures SBAS (Hong Kong) Ltd. All Rights Reserved. 6
 Type 1 through htype 4 sums of squares Specify Multiple")
4 General Linear Model in SPSS General llinear Model Factors and covariates are assumed to have linear relationships to the dependent variable(s) GLM Multivariate procedure Model the values of multiple dependent scale variables, based on their relationships to categorical and scale predictors GLM Repeated Measures procedure Model the values of multiple dependent scale variables ibl measured at multiple l time periods, based on their relationships to categorical and scale predictors and the time periods at which they were measured. SBAS (Hong Kong) Ltd. All Rights Reserved. 7 Multivariate Tests MANOVA Results Pillai's trace is a positive valued statistic. Increasing values of the statistic indicate effects that contribute more to the model. Wilks' Lambda is a positive valued statistic that ranges from 0 to 1. Decreasing values of the statistic indicate effects that contribute more to the model. SBAS (Hong Kong) Ltd. All Rights Reserved. 8

5 MANOVA Results (cont d) Hotelling'strace is the sum of the eigenvalues of the test matrix. It is a positive valued statistic for which increasing values indicate effects that contribute more to the model. Roy's largest root is the largest eigenvalue of the test matrix. Thus, it is a positive valued statistic for which increasing values indicate effects that contribute more to the model. There is evidence that Pillai's trace is more robust than the other statistics to violations of model assumptions SBAS (Hong Kong) Ltd. All Rights Reserved. 9 Post HocTests LSD The LSD or least significant difference method simply applies standard t tests to all possible pairs of group means. No adjustment is made based on the number of tests performed. The argument is that since an overall difference in group means has already been established at the selected criterionlevel (say.05), no additional control is necessary. This is the most liberal of the post hoc tests. SNK, REGWF, REGWQ & Duncan The SNK (Student Newman Keuls), REGWF (Ryan Einot Gabriel Welsh F), REGWQ (Ryan Einot Gabriel Welsh Q, based on the studentized range statistic) and Duncan methods involve sequential testing. After ordering the group means from lowest to highest, the two most extreme means are tested for a significant difference using a critical value adjusted for the fact that these are the extremes from a larger set of means. If these means are found not to be significantly different, the testing stops; if they are different then the testing continues with the next most extreme set, and so on. All are more conservative than the LSD. REGWF and REGWQ improve on the traditionally used SNK in that they adjust for the slightly elevated false positive rate (Type I error) that SNK has when the set of means tested is much smaller than the full set. SBAS (Hong Kong) Ltd. All Rights Reserved. 10
 Ltd. All Rights Reserved.")
6 Post HocTests (cont d) Bonferroni i& Sidak The Bonferroni (also called the Dunn procedure) and Sidak (also called Dunn Sidak) perform each test at a stringent significance level to insure that the family wise (applying to the set of tests) false positive rate does not exceed the specified value. They are based on inequalities relating the probability of a false positive result on each individual test to the probability of one or more false positives for a set of independent d ttests. t For example, the Bonferroni iis based on an additive inequality, so the criterion level for each pairwise test is obtained by dividing the original criterion level (say.05) by the number of pairwise comparisons made. Thus with fivemeans means, and therefore ten pairwise comparisons, each Bonferroni test will be performed at the.05/10 or.005 level. Tukey (b) The Tukey (b) test is a compromise test, combining the Tukey (see next test) and the SNK criterion producing a test result that falls between the two. SBAS (Hong Kong) Ltd. All Rights Reserved. 11 Post HocTests (cont d) Tukey Tukey s HSD (Honestly Significant Difference; also called Tukey HSD, WSD, or Tukey(a) test) controls the false positive rate family wise. This means if you are testing at the.05 level, that when performing all pairwise comparisons, the probability of obtaining one or more false positives is.05. It is more conservative than the Duncan and SNK. If all pairwise comparisons are of interest, which is usually the case, Tukey s test tis more powerful than the Bonferroni and Sidak. Scheffe Scheffe s method also controls the family wise error rate. It adjusts not only for the pairwise comparisons, but also for any possible comparison the researcher might ask. As such it is the most conservative of the available methods (false positive rate is least), but has less statistical power. SBAS (Hong Kong) Ltd. All Rights Reserved. 12

7 Specialized Post HocTests Hochberg s GT2 G2& Gabriel: GbilUnequal Ns Most post hoc procedures mentioned above (excepting LSD, Bonferroni & Sidak) were derived assuming equal group sample sizes in addition to homogeneity of variance and normality of error. When the subgroup sizes are unequal, SPSS substitutes a single value (the harmonic mean) for the sample size. Hochberg s GT2 and Gabriel s post hoc test explicitly allow for unequal sample sizes. Waller Duncan The Waller Duncan takes an approach (Bayesian) that adjusts the criterion value based on the size of the overall F statistic in order to be sensitive to the types of group differences associated with the F (for example, large or small). Also, you can specify the ratio of Type I (false positive) to Type II (false negative) error in the test. This feature allows for adjustments if there are differential costs to the two types of errors. SBAS (Hong Kong) Ltd. All Rights Reserved. 13 Unequal Variances and Unequal Ns and Selection of Post Hoc Tests Tamhane T2, Dunnett s T3, Games Howell, Dunnett s C Each of these post hoc tests adjust for unequal variances and sample sizes in the groups. Simulation studies (summarized in Toothaker, 1991) suggest that although Games Howell can be too liberal l when the group variances are equal and sample sizes are unequal, it is more powerful than the others. An approach some analysts take is to run both a liberal (say LSD) and a conservative (Scheffe or Tukey HSD) post hoc test. Group differences that show up under both criteria are considered solid findings, while those found ddifferent only under the liberal l criterion are viewed as tentative results. SBAS (Hong Kong) Ltd. All Rights Reserved. 14
 that adjusts the criterion value based on the size of the overall F statistic in order to be sensitive to the types of group differences")
8 Repeated Measures ANOVA To test for significant differences in means when the same observation appears in multiple l levels l of a factor SBAS (Hong Kong) Ltd. All Rights Reserved. 15 Linear MixedModelsModels The procedure expands the general linear model so that the error terms and random effects are permitted to exhibit correlated and non constant variability. Thelinear mixed model, therefore, provides the flexibility to model not only the mean of a response variable, but its covariance structure as well. SBAS (Hong Kong) Ltd. All Rights Reserved. 16

9 Linear MixedModelsModels (cont d) SBAS (Hong Kong) Ltd. All Rights Reserved. 17 MANOVA, Repeated dmeasures ANOVA andlinearmixed Models Demo Q&A SBAS (Hong Kong) Ltd. All Rights Reserved. 18

10 ExploratoryFactor Analysis The purpose of data reduction is to remove redundant (highly correlated) variables from the data file, perhaps replacing the entire data file with a smaller number of uncorrelated variables. The purpose of structure detection is to examine the underlying (or latent) relationships between the variables. SBAS (Hong Kong) Ltd. All Rights Reserved. 19 EFA Methods For Data Reduction. The principal components method of extraction begins by finding a linear combination of variables (a component) ) that accounts for as much variation in the original variables as possible. It then finds another component that accounts for as much of the remaining variation as possible and is uncorrelated with the previous component, continuing in this way until there are as many components as original variables. Usually, a few components will account for most of the variation, and these components can be used to replace the original variables. This method is most often used to reduce the number of variables in the data file. SBAS (Hong Kong) Ltd. All Rights Reserved. 20
 ) that accounts for as much variation in the original variables as possible.")
11 EFA Methods (cont d) For Structure Detection. Other Factor Analysis extraction methods go one step further by adding the assumption that some of the variability in the data cannot be explained by the components (usually called factors in other extraction methods). As a result, the total variance explained by the solution is smaller; however, the addition of this structure to the factor model makes these methods ideal for examining relationships between the variables. SBAS (Hong Kong) Ltd. All Rights Reserved. 21 EFA Methods (cont d) Principal components attempts to account for the maximum amount of variance in the set of variables. Since the diagonal of a correlation matrix (the ones) represents standardized variances, each principal component can be thought of as accounting for as much of the variation remaining in the diagonal as possible. Principal axis factoring attempts to account for correlations between the variables, which in turn accounts for some of their variance. Therefore, factor focuses more on the off diagonal elements in the correlation matrix. Unweighted least squares produces a factor solution that minimizes the residual between the observed and the reproduced correlation matrix. Generalized least squares does the same thing, only it gives more weight to variables with stronger correlations. Maximum likelihood generates the solution that is the most likely to have produced the correlation matrix if the variables follow a multivariate normal distribution. Alpha factoring considers variables in the analysis, rather than the cases, to be sampled from a universe of all possible variables. As a result, eigenvalues and communalities are not derived from factor loadings. Image factoring decomposes each observed variable into a common part (partial image) and a unique part (anti image) and then operates with the common part. The common part of a variable can be predicted dfrom a linear combination of the remaining variables (via regression), while the unique part cannot be predicted (the residual). SBAS (Hong Kong) Ltd. All Rights Reserved. 22

12 EFA Rotation Two Factors Based on Six Variables SBAS (Hong Kong) Ltd. All Rights Reserved. 23 EFA Result Communalities indicate the amount of variance in each variable that is accounted for. Initial communalities are estimates of the variance in each variable accounted for by all components or factors. For principal components extraction, this is always equal to 1.0 for correlation analyses. Extraction communalities are estimates of the variance in each variable accounted for by the components. SBAS (Hong Kong) Ltd. All Rights Reserved. 24

13 EFA Result (cont d) For the initial i i solution of Total lvariance Explained, there are as many components as variables, and in a correlations analysis, the sum of the eigenvalues equals the number of components. Extracted those components with eigenvalues greater than 1. The rotated component matrix helps you to determine what the components represent. For each case and each component, the component score is computed by multiplying the case's standardized variable values (computed using listwise deletion) by the component's score coefficients. SBAS (Hong Kong) Ltd. All Rights Reserved. 25 Exploratory Factor Analysis Demo Q&A SBAS (Hong Kong) Ltd. All Rights Reserved. 26
 by the")
14 ConfirmatoryFactor Analysis Test whether measures of a construct are consistent with a researcher's understanding of the nature of that construct (or factor). As such, the objective of confirmatory factor analysis is to test whether the data fit a hypothesized measurement model. This hypothesized model is based on theory and/or previous analytic research SBAS (Hong Kong) Ltd. All Rights Reserved. 27 Difference between EFA and CFA Both exploratory factor analysis (EFA) and confirmatory factor analysis (CFA) are employed to understand shared variance of measured variables that is believed to be attributable to a factor or latent construct. Despite this similarity, however, EFA and CFA are conceptually and statistically distinct analyses. SBAS (Hong Kong) Ltd. All Rights Reserved. 28
 and confirmatory factor analysis (CFA) are employed to understand shared variance of measured variables that is believed to")
15 Difference between EFA and CFA (cont d) The goal of EFAi is to identify if factors based on data and to maximize the amount of variance explained. The researcher is not required to have any specific hypotheses about how many factors will emerge, and what items or variables these factors will comprise. By contrast, CFA evaluates a priori hypotheses and is largely driven by theory. CFA analyses require the researcher to hypothesize, in advance, the number of factors, whether or not these factors are correlated, and which h items/measures load onto and reflect which h factors. SBAS (Hong Kong) Ltd. All Rights Reserved. 29 CFA and SEM Structural t equation modeling dli software is typically used for performing confirmatory factor analysis. CFA is also frequently used as a first step to assess the proposed p measurement model in a structural equation model. Many of the rules of interpretation regarding assessment of model fit and model modification in SEM apply equally to CFA. CFA is distinguished from structural equation modeling by the fact that in CFA, there are no directed arrows between latent factors. In the context of SEM, the CFA is often called 'the measurement model', while the relations between the latent variables (with directed arrows) are called 'the structural model'. SBAS (Hong Kong) Ltd. All Rights Reserved. 30

16 Structural Equation Modeling In general SEM is used when you have a model to test with hypothesized relationships between variables. Typically, we want to assess which variables are important in explaining/predicting another variable (or explaining/predicting othervariables variables, as we can have more than one dependent variable). SBAS (Hong Kong) Ltd. All Rights Reserved. 31 SEMConcepts and Definitions SEM procedures incorporate both observed and unobserved variables Latent Variables (or Factors) These cannot be observed, nor measured directly We define latent variables in terms of behaviour believed to represent it (observed, or manifest, variables) Exogenous Variables Synonymous with independent variables, in other words they cause fluctuationsin in the values of other latent variables in the model Endogenous Variables Synonymous with dependent variables, they are influenced by the exogenous variables ibl in the exogenous variables ibl in the model, dleither directly or indirectly Note: In SEM variables are only either dependent or independent, but cannot beboth both, although ghitma may appearthis way SBAS (Hong Kong) Ltd. All Rights Reserved. 32
 These cannot be observed, nor measured directly We define latent")
17 AMOS can be used for Correlation measure relationships between >=2 variables Simple Regression an extension of correlation, where we attempt to measure the extent to which one variable (the predictor) can be used to make a prediction about a criterion measure MultipleRegression extends simple regression by incorporating several predictor variables Factor Analysis investigates relationships between sets of observed variables ibl and lt latent tvariables ibl Path Analysis extends multiple regression by incorporating several predictor variables to explain or predict several dependent variables SEM extension of Path Analysis, using latent variables SBAS (Hong Kong) Ltd. All Rights Reserved. 33 SEM Model Notation SBAS (Hong Kong) Ltd. All Rights Reserved. 34
 Ltd. All Rights Reserved. 33 SEM Model Notation SBAS (Hong Kong) Ltd. All Rights Reserved. 34")
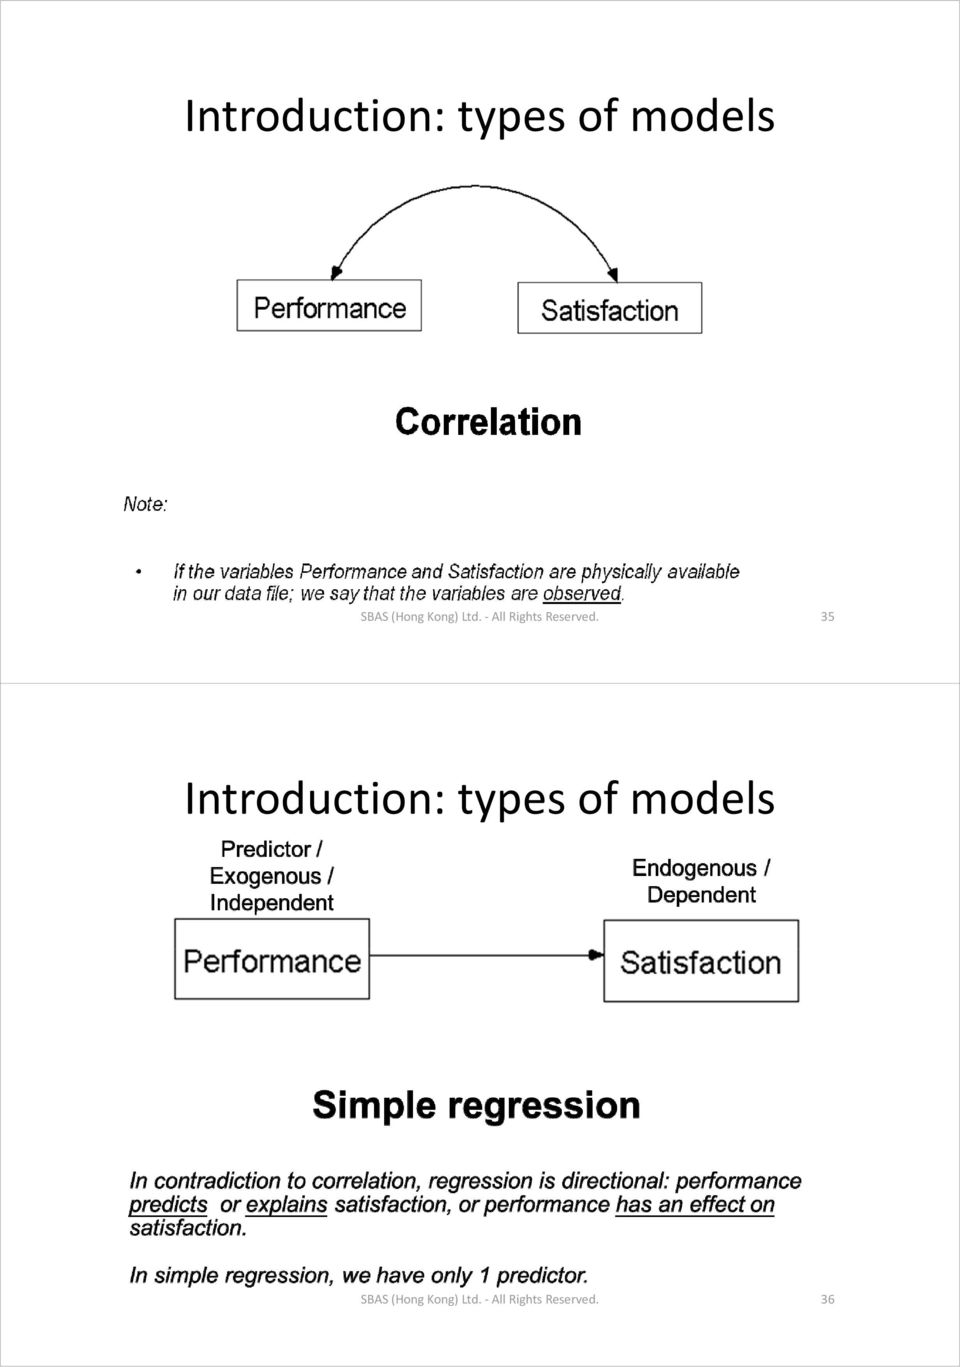
18 Introduction: types of models SBAS (Hong Kong) Ltd. All Rights Reserved. 35 Introduction: types of models SBAS (Hong Kong) Ltd. All Rights Reserved. 36
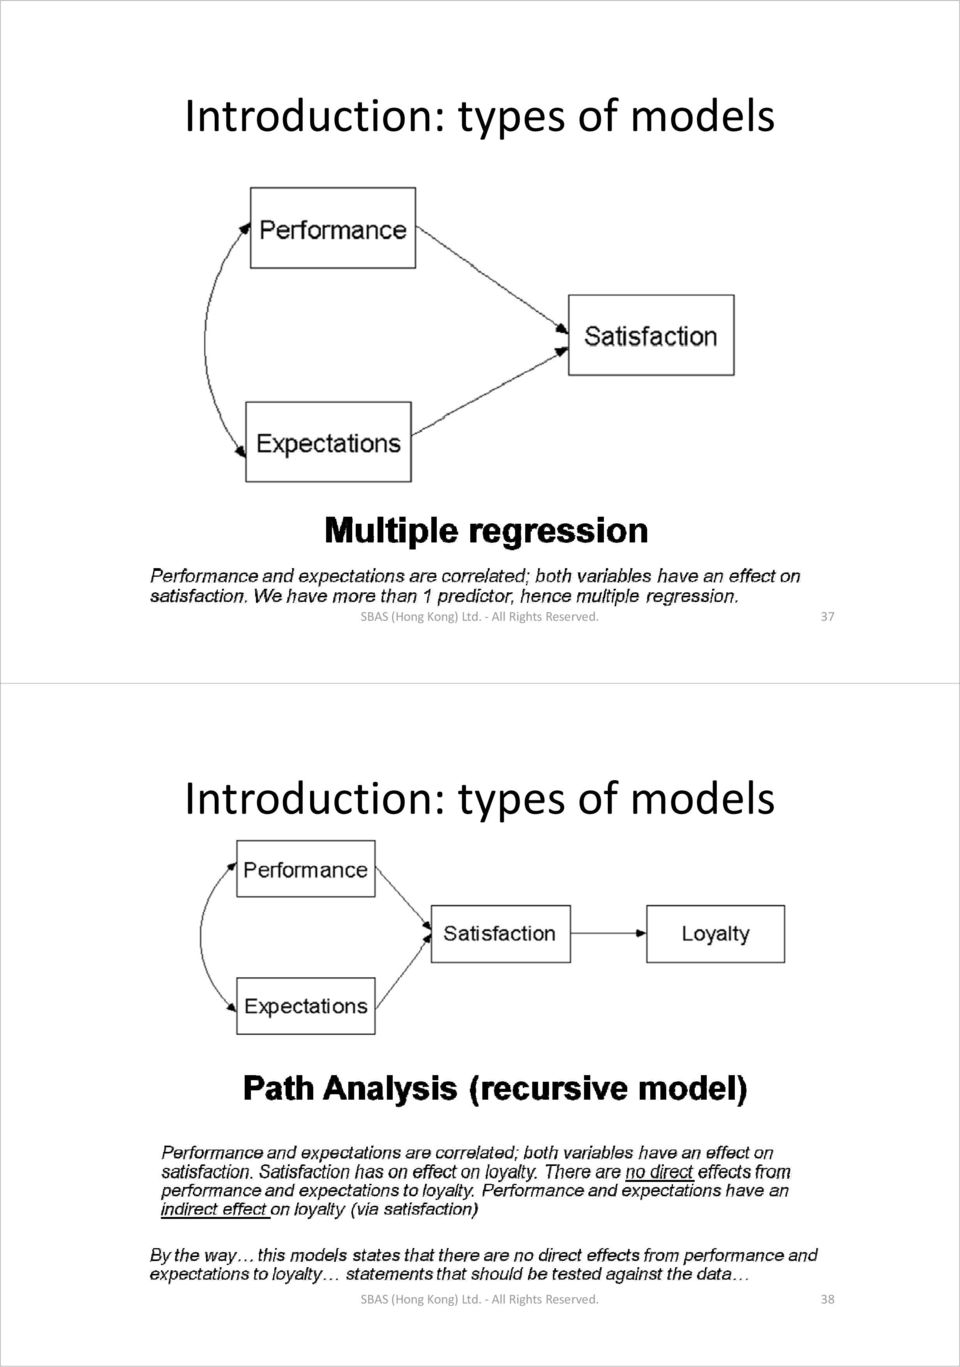
19 Introduction: types of models SBAS (Hong Kong) Ltd. All Rights Reserved. 37 Introduction: types of models SBAS (Hong Kong) Ltd. All Rights Reserved. 38
20 Introduction: types of models SBAS (Hong Kong) Ltd. All Rights Reserved. 39 Introduction: types of models SBAS (Hong Kong) Ltd. All Rights Reserved. 40

21 Introduction: types of models SBAS (Hong Kong) Ltd. All Rights Reserved. 41 Introduction: types of models SBAS (Hong Kong) Ltd. All Rights Reserved. 42
22 Introduction: real life example SBAS (Hong Kong) Ltd. All Rights Reserved. 43 How to calculate degree of freedom A simple formula allows us to calculate the degrees of freedom for any model. The most basic version of the formula is this: Df = (number of pieces of information in sample) (number of parameters estimated) By pieces of information we mean the sample means, variances, and covariances in the data, the information available to Amos to do its calculations. By parameters estimated we mean whatever we ask Amos to calculate, which usually includes effects (single headed arrows), covariances (double headed arrows), and even population means and variances. Technically, the information in the sample is referred to as sample moments, just as the name Amos stands for Analysis of Moment Structures. As we have learned, the estimates t Amos makes for our model dlare called generically parameters. Thus, another more general version of the above formula is this: Df = (number of distinct sample moments) (number of parameters estimated) SBAS (Hong Kong) Ltd. All Rights Reserved. 44
23 How to calculate degree of freedom (cont d) Number of distinct sample moment = p * (p+1) / 2, where p is the number of observed variables Number of parameters estimated = direct effects + variances + covariances SBAS (Hong Kong) Ltd. All Rights Reserved. 45 Steps involved Open data Amos how to operate Draw model Run analysis Interpret results SBAS (Hong Kong) Ltd. All Rights Reserved. 46
24 Testing modeladequacy We re calculate estimates for this model, but first ask for extra output (for instructional purposes ): Analysis properties, tab Output Check Sample moments and Implied moments SBAS (Hong Kong) Ltd. All Rights Reserved. 47 Testing modeladequacy (cont d) Chi 2 value, # of degrees of freedom and probability level can be displayed in the diagram automatically: Add title to the diagram Type in this text \cmin, \df, \p are macro names ; Amos will replace these with the actual results SBAS (Hong Kong) Ltd. All Rights Reserved. 48
25 Testing modeladequacy (cont d) Every model dlimplies specific (population) correlations between the variables, so every model implies a certain population p correlation matrix. The model is our null hypothesis. On the other hand we have the observed correlations, so we have a sample correlation matrix A Chi 2 test is used to asses the discrepancy between these two matrices a. If probability < 0.05, 005 we reject our model; if probability >= 0.05, we do not reject our model a Technical note: actually the discrepancy between the sample variance/covariance matrix and the implied variance/covariance matrix is used in the Chi 2 test, not the correlation matrix SBAS (Hong Kong) Ltd. All Rights Reserved. 49 Testing modeladequacy (cont d) In traditional testing we (as the researcher) have a certain hypothesis we want to prove by trying to reject a null hypothesis which states the contrary. We stick to this null hypothesis until it s very unlikely, in which case we accept our own hypothesis. Here, the null hypothesis has the benefit of the doubt. In SEM we (as the researcher) postulate a model and we believe in this model (and nothing but the model), until this model appears to be unlikely. Now, we (our model) has the benefit of the doubt. SBAS (Hong Kong) Ltd. All Rights Reserved. 50
26 How to correct a model Analysis Properties, tab Output Check this option (note: that by default the threshold is 4; if the MI for a particular restriction < 4, then it will not be reported in the output) SBAS (Hong Kong) Ltd. All Rights Reserved. 51 Multiple Group Analysis We run a multiple group analysis when we want to test whether a particular model holds for each and every group within our dataset In other words, we are testing to see if there is an interaction effect: is the model groupdependent? SBAS (Hong Kong) Ltd. All Rights Reserved. 52
27 Multiple Group Analysis (cont d) Double click Group number 1 To display the Manage Groups dialog box Rename the group into girls Click New Rename the group into boys and Close this window SBAS (Hong Kong) Ltd. All Rights Reserved. 53 Factor Analysis in Amos SBAS (Hong Kong) Ltd. All Rights Reserved. 54
28 Note: Factor Analysis in Amos (cont d) In CFA, only certain items areproposed to be indicators of each factor. The curved line indicates the relationship that could exist between the factors Again, the errors in measurement are shown by the circles with the E SBAS (Hong Kong) Ltd. All Rights Reserved. 55 The General Model in Amos Model fits, so we can interpret the results R Squared value is0.32compared to.22 in SPSS We have a better result analysing the data in the correct way In general, the lower the loadings are, the more we under estimate the R Squared value. SBAS (Hong Kong) Ltd. All Rights Reserved. 56
29 Fit Measures The model under test (your model) model where number of estimated parameters = number of data points model of complete independence of all variables in the model Absolute measures of fit: does the model reproduce the data (= variance/covariance i matrix)? i)? Incremental measures of fit: how does the model describe the data, compared to a baseline model? SBAS (Hong Kong) Ltd. All Rights Reserved. 57 Absolute Fit Measures Standardized Residual Covariances. In big samples these elements are ~ N (0, 1). Values less than 2 or greater then 2 indicate problems (wherecovariances can t be reproduced by the model). This table appears when you request residual moments in your output. SBAS (Hong Kong) Ltd. All Rights Reserved. 58
30 Absolute Fit Measures (cont d) Chi 2 /df (Wheaton,Muthén, thé Alwin & Summers 1977) Problem: distribution of this statistic does not exist, so people have rules of thumb: Wheaton (1977) Chi 2 / df <= 5 is acceptable fit. Carmines: Chi 2 / df <= 3 is acceptable fit Byrne (1989): it seems clear that t a ratio > 2.00 represents an inadequate fit. Amos User Guide: close to 1 for correct models Note: Wheaton (1987) later advocated that this ratio not be used SBAS (Hong Kong) Ltd. All Rights Reserved. 59 Absolute Fit Measures (cont d) Population discrepancy. Idea: how far is Chi2 value from expected value? This difference divided by sample size (labelled F0). Root Mean Square Error of Approximation Browne et al: RMSEA of 005or 0.05 less indicates a close fit It can be tested: H0: RMSEA <= 0.05 (compare with regular Chi 2 test: RMSEA = 0 ) Amos gives this probability (H0: RMSEA <= 0.05) in Pclose. In words: Pclose is the probability that the model is almost correct. SBAS (Hong Kong) Ltd. All Rights Reserved. 60
31 Relative Fit Measures NFI NormedFit Index (Bentler & Bonnett s 1980) was the practical criterion of choice for several years Addressingevidence evidence that the NFI has shown a tendency to underestimate fit in small samples, Bentler revised this measure, taking in to account sample size the CFI, Comparative Fit Index Both range from 0 to 1 Value of >.9 was originally i proposed as well fitting model Revised value of >.95 advised by Hu &Bentler (1999) Note: Bentler (1980) suggested CFI was measure of choice SBAS (Hong Kong) Ltd. All Rights Reserved. 61 Relative Fit Measures (cont d) RFI Rlti Relative Fit Index Derivative of NFI Range of values from 0 to 1, with values close to indicating superior fit (Hu & Bentler 1999) IFI Incremental Index of Fit Issues of parsimony and sample size with NFI lead to Bollen (1989) develop this measure Same calculation as NFI, but degrees of freedom taken into account Again values range from 0 to 1, with those close to 0.95 indicating well fitting models SBAS (Hong Kong) Ltd. All Rights Reserved. 62
32 Relative Fit Measures (cont d) GFI Goodness of Fit Index A measures of the relative amount of variance & covariance in thesample covariance matrix (of observed variables) that is jointly explained by the population matrix Values range from 0 to 1 (though ve value theoretically possible) with 1 being the perfect model of fit. Rule of thumb is either >.8 or >.9 AGFI Adjusted Goodness of Fit Index Correction of GFI to include degrees of freedom Values interpreted as above SBAS (Hong Kong) Ltd. All Rights Reserved. 63 Relative Fit Measures (cont d) PGFI Parsimony Goodness of Fit Index Takes into account the complexity y( (i.e. number of estimated parameters) Provides more realistic evaluation of the model (Mulaik et al, 1989 Typically parsimony fit indices have lower thresholds, so values in the.50 s are not uncommon, and can accompany other indices in the.90 s SBAS (Hong Kong) Ltd. All Rights Reserved. 64
33 Other Fit Measures AIC Akaike s Information Criteria Ci i and CAIC Consistent Akaike s Information Criteria Bothaddress the issue ofparsimonyandgoodness and offit, but AIC only relates to degrees of freedom. Bozdogan (1987) proposed CAIC to take into account sample size Used in the comparison of 2 or more models, with smaller values representing a better fit of the model BIC (Bayes Information Criterion) and BCC (Browne Cudeck Criterion) Operate in the same way as AIC and CAIC, but impose greater penalties for model complexity SBAS (Hong Kong) Ltd. All Rights Reserved. 65 Other Fit Measures (cont d) Hoelter s Citi Critical ln: Last goodness of fit statistic appearing in the Amos output In fact two values for levels of significance of.05 and.01 Differs substantially from those previously mentioned Focuses directly on sample size, rather than model fit It s purpose is to estimate a sample size that would be sufficient to yield an adequate model fit for a χ 2 test Hoelter proposed a value > 200 is indicative of a model that adequately represents the sample data SBAS (Hong Kong) Ltd. All Rights Reserved. 66
34 AMOS (CFA and SEM) Demo Q&A SBAS (Hong Kong) Ltd. All Rights Reserved. 67
Indices of Model Fit STRUCTURAL EQUATION MODELING 2013
 Indices of Model Fit STRUCTURAL EQUATION MODELING 2013 Indices of Model Fit A recommended minimal set of fit indices that should be reported and interpreted when reporting the results of SEM analyses:
Applications of Structural Equation Modeling in Social Sciences Research
 American International Journal of Contemporary Research Vol. 4 No. 1; January 2014 Applications of Structural Equation Modeling in Social Sciences Research Jackson de Carvalho, PhD Assistant Professor
STATISTICA Formula Guide: Logistic Regression. Table of Contents
 : Table of Contents... 1 Overview of Model... 1 Dispersion... 2 Parameterization... 3 Sigma-Restricted Model... 3 Overparameterized Model... 4 Reference Coding... 4 Model Summary (Summary Tab)... 5 Summary
Overview of Factor Analysis
 Overview of Factor Analysis Jamie DeCoster Department of Psychology University of Alabama 348 Gordon Palmer Hall Box 870348 Tuscaloosa, AL 35487-0348 Phone: (205) 348-4431 Fax: (205) 348-8648 August 1,
SPSS Advanced Statistics 17.0
 i SPSS Advanced Statistics 17.0 For more information about SPSS Inc. software products, please visit our Web site at http://www.spss.com or contact SPSS Inc. 233 South Wacker Drive, 11th Floor Chicago,
IBM SPSS Advanced Statistics 20
 IBM SPSS Advanced Statistics 20 Note: Before using this information and the product it supports, read the general information under Notices on p. 166. This edition applies to IBM SPSS Statistics 20 and
Multivariate Analysis of Variance. The general purpose of multivariate analysis of variance (MANOVA) is to determine
 is to determine") 2 - Manova 4.3.05 25 Multivariate Analysis of Variance What Multivariate Analysis of Variance is The general purpose of multivariate analysis of variance (MANOVA) is to determine whether multiple levels
2 - Manova 4.3.05 25 Multivariate Analysis of Variance What Multivariate Analysis of Variance is The general purpose of multivariate analysis of variance (MANOVA) is to determine whether multiple levels
Descriptive Statistics
 Descriptive Statistics Primer Descriptive statistics Central tendency Variation Relative position Relationships Calculating descriptive statistics Descriptive Statistics Purpose to describe or summarize
I n d i a n a U n i v e r s i t y U n i v e r s i t y I n f o r m a t i o n T e c h n o l o g y S e r v i c e s
 I n d i a n a U n i v e r s i t y U n i v e r s i t y I n f o r m a t i o n T e c h n o l o g y S e r v i c e s Confirmatory Factor Analysis using Amos, LISREL, Mplus, SAS/STAT CALIS* Jeremy J. Albright
Multiple-Comparison Procedures
 Multiple-Comparison Procedures References A good review of many methods for both parametric and nonparametric multiple comparisons, planned and unplanned, and with some discussion of the philosophical
Common factor analysis
 Common factor analysis This is what people generally mean when they say "factor analysis" This family of techniques uses an estimate of common variance among the original variables to generate the factor
T-test & factor analysis
 Parametric tests T-test & factor analysis Better than non parametric tests Stringent assumptions More strings attached Assumes population distribution of sample is normal Major problem Alternatives Continue
MISSING DATA TECHNIQUES WITH SAS. IDRE Statistical Consulting Group
 MISSING DATA TECHNIQUES WITH SAS IDRE Statistical Consulting Group ROAD MAP FOR TODAY To discuss: 1. Commonly used techniques for handling missing data, focusing on multiple imputation 2. Issues that could
Multivariate Analysis of Variance (MANOVA)
") Chapter 415 Multivariate Analysis of Variance (MANOVA) Introduction Multivariate analysis of variance (MANOVA) is an extension of common analysis of variance (ANOVA). In ANOVA, differences among various
Chapter 415 Multivariate Analysis of Variance (MANOVA) Introduction Multivariate analysis of variance (MANOVA) is an extension of common analysis of variance (ANOVA). In ANOVA, differences among various
NCSS Statistical Software Principal Components Regression. In ordinary least squares, the regression coefficients are estimated using the formula ( )
") Chapter 340 Principal Components Regression Introduction is a technique for analyzing multiple regression data that suffer from multicollinearity. When multicollinearity occurs, least squares estimates
Chapter 340 Principal Components Regression Introduction is a technique for analyzing multiple regression data that suffer from multicollinearity. When multicollinearity occurs, least squares estimates
Multivariate Analysis of Variance (MANOVA)
") Multivariate Analysis of Variance (MANOVA) Aaron French, Marcelo Macedo, John Poulsen, Tyler Waterson and Angela Yu Keywords: MANCOVA, special cases, assumptions, further reading, computations Introduction
Multivariate Analysis of Variance (MANOVA) Aaron French, Marcelo Macedo, John Poulsen, Tyler Waterson and Angela Yu Keywords: MANCOVA, special cases, assumptions, further reading, computations Introduction
The Technology Acceptance Model with Online Learning for the Principals in Elementary Schools and Junior High Schools
 The Technology Acceptance Model with Online Learning for the Principals in Elementary Schools and Junior High Schools RONG-JYUE FANG 1, HUA- LIN TSAI 2, CHI -JEN LEE 3, CHUN-WEI LU 4 1,2 Department of
Chapter 5 Analysis of variance SPSS Analysis of variance
 Chapter 5 Analysis of variance SPSS Analysis of variance Data file used: gss.sav How to get there: Analyze Compare Means One-way ANOVA To test the null hypothesis that several population means are equal,
DISCRIMINANT FUNCTION ANALYSIS (DA)
") DISCRIMINANT FUNCTION ANALYSIS (DA) John Poulsen and Aaron French Key words: assumptions, further reading, computations, standardized coefficents, structure matrix, tests of signficance Introduction Discriminant
DISCRIMINANT FUNCTION ANALYSIS (DA) John Poulsen and Aaron French Key words: assumptions, further reading, computations, standardized coefficents, structure matrix, tests of signficance Introduction Discriminant
Multivariate Analysis of Variance (MANOVA): I. Theory
: I. Theory") Gregory Carey, 1998 MANOVA: I - 1 Multivariate Analysis of Variance (MANOVA): I. Theory Introduction The purpose of a t test is to assess the likelihood that the means for two groups are sampled from the
Gregory Carey, 1998 MANOVA: I - 1 Multivariate Analysis of Variance (MANOVA): I. Theory Introduction The purpose of a t test is to assess the likelihood that the means for two groups are sampled from the
Introduction to Path Analysis
 This work is licensed under a Creative Commons Attribution-NonCommercial-ShareAlike License. Your use of this material constitutes acceptance of that license and the conditions of use of materials on this
Additional sources Compilation of sources: http://lrs.ed.uiuc.edu/tseportal/datacollectionmethodologies/jin-tselink/tselink.htm
 Mgt 540 Research Methods Data Analysis 1 Additional sources Compilation of sources: http://lrs.ed.uiuc.edu/tseportal/datacollectionmethodologies/jin-tselink/tselink.htm http://web.utk.edu/~dap/random/order/start.htm
A Brief Introduction to SPSS Factor Analysis
 A Brief Introduction to SPSS Factor Analysis SPSS has a procedure that conducts exploratory factor analysis. Before launching into a step by step example of how to use this procedure, it is recommended
Factor Analysis. Principal components factor analysis. Use of extracted factors in multivariate dependency models
 Factor Analysis Principal components factor analysis Use of extracted factors in multivariate dependency models 2 KEY CONCEPTS ***** Factor Analysis Interdependency technique Assumptions of factor analysis
Simple Linear Regression Inference
 Simple Linear Regression Inference 1 Inference requirements The Normality assumption of the stochastic term e is needed for inference even if it is not a OLS requirement. Therefore we have: Interpretation
ANOVA ANOVA. Two-Way ANOVA. One-Way ANOVA. When to use ANOVA ANOVA. Analysis of Variance. Chapter 16. A procedure for comparing more than two groups
 ANOVA ANOVA Analysis of Variance Chapter 6 A procedure for comparing more than two groups independent variable: smoking status non-smoking one pack a day > two packs a day dependent variable: number of
Presentation Outline. Structural Equation Modeling (SEM) for Dummies. What Is Structural Equation Modeling?
 for Dummies. What Is Structural Equation Modeling?") Structural Equation Modeling (SEM) for Dummies Joseph J. Sudano, Jr., PhD Center for Health Care Research and Policy Case Western Reserve University at The MetroHealth System Presentation Outline Conceptual
Structural Equation Modeling (SEM) for Dummies Joseph J. Sudano, Jr., PhD Center for Health Care Research and Policy Case Western Reserve University at The MetroHealth System Presentation Outline Conceptual
Factor Analysis. Advanced Financial Accounting II Åbo Akademi School of Business
 Factor Analysis Advanced Financial Accounting II Åbo Akademi School of Business Factor analysis A statistical method used to describe variability among observed variables in terms of fewer unobserved variables
Simple Tricks for Using SPSS for Windows
 Simple Tricks for Using SPSS for Windows Chapter 14. Follow-up Tests for the Two-Way Factorial ANOVA The Interaction is Not Significant If you have performed a two-way ANOVA using the General Linear Model,
Multivariate analyses
 14 Multivariate analyses Learning objectives By the end of this chapter you should be able to: Recognise when it is appropriate to use multivariate analyses (MANOVA) and which test to use (traditional
INTERPRETING THE ONE-WAY ANALYSIS OF VARIANCE (ANOVA)
") INTERPRETING THE ONE-WAY ANALYSIS OF VARIANCE (ANOVA) As with other parametric statistics, we begin the one-way ANOVA with a test of the underlying assumptions. Our first assumption is the assumption of
INTERPRETING THE ONE-WAY ANALYSIS OF VARIANCE (ANOVA) As with other parametric statistics, we begin the one-way ANOVA with a test of the underlying assumptions. Our first assumption is the assumption of
CHAPTER 8 FACTOR EXTRACTION BY MATRIX FACTORING TECHNIQUES. From Exploratory Factor Analysis Ledyard R Tucker and Robert C.
 CHAPTER 8 FACTOR EXTRACTION BY MATRIX FACTORING TECHNIQUES From Exploratory Factor Analysis Ledyard R Tucker and Robert C MacCallum 1997 180 CHAPTER 8 FACTOR EXTRACTION BY MATRIX FACTORING TECHNIQUES In
FACTOR ANALYSIS NASC
 FACTOR ANALYSIS NASC Factor Analysis A data reduction technique designed to represent a wide range of attributes on a smaller number of dimensions. Aim is to identify groups of variables which are relatively
How To Understand Multivariate Models
 Neil H. Timm Applied Multivariate Analysis With 42 Figures Springer Contents Preface Acknowledgments List of Tables List of Figures vii ix xix xxiii 1 Introduction 1 1.1 Overview 1 1.2 Multivariate Models
Introduction to Principal Components and FactorAnalysis
 Introduction to Principal Components and FactorAnalysis Multivariate Analysis often starts out with data involving a substantial number of correlated variables. Principal Component Analysis (PCA) is a
SEM Analysis of the Impact of Knowledge Management, Total Quality Management and Innovation on Organizational Performance
 2015, TextRoad Publication ISSN: 2090-4274 Journal of Applied Environmental and Biological Sciences www.textroad.com SEM Analysis of the Impact of Knowledge Management, Total Quality Management and Innovation
This chapter will demonstrate how to perform multiple linear regression with IBM SPSS
 CHAPTER 7B Multiple Regression: Statistical Methods Using IBM SPSS This chapter will demonstrate how to perform multiple linear regression with IBM SPSS first using the standard method and then using the
Missing Data: Part 1 What to Do? Carol B. Thompson Johns Hopkins Biostatistics Center SON Brown Bag 3/20/13
 Missing Data: Part 1 What to Do? Carol B. Thompson Johns Hopkins Biostatistics Center SON Brown Bag 3/20/13 Overview Missingness and impact on statistical analysis Missing data assumptions/mechanisms Conventional
Confirmatory factor analysis in MPlus
 Jan Štochl, Ph.D. Department of Psychiatry University of Cambridge Email: js883@cam.ac.uk Confirmatory factor analysis in MPlus The Psychometrics Centre Agenda of day 1 General ideas and introduction to
4. There are no dependent variables specified... Instead, the model is: VAR 1. Or, in terms of basic measurement theory, we could model it as:
 1 Neuendorf Factor Analysis Assumptions: 1. Metric (interval/ratio) data 2. Linearity (in the relationships among the variables--factors are linear constructions of the set of variables; the critical source
Data analysis process
 Data analysis process Data collection and preparation Collect data Prepare codebook Set up structure of data Enter data Screen data for errors Exploration of data Descriptive Statistics Graphs Analysis
Multivariate Statistical Inference and Applications
 Multivariate Statistical Inference and Applications ALVIN C. RENCHER Department of Statistics Brigham Young University A Wiley-Interscience Publication JOHN WILEY & SONS, INC. New York Chichester Weinheim
Didacticiel - Études de cas
 1 Topic Linear Discriminant Analysis Data Mining Tools Comparison (Tanagra, R, SAS and SPSS). Linear discriminant analysis is a popular method in domains of statistics, machine learning and pattern recognition.
IBM SPSS Advanced Statistics 22
 IBM SPSS Adanced Statistics 22 Note Before using this information and the product it supports, read the information in Notices on page 103. Product Information This edition applies to ersion 22, release
Research Methods & Experimental Design
 Research Methods & Experimental Design 16.422 Human Supervisory Control April 2004 Research Methods Qualitative vs. quantitative Understanding the relationship between objectives (research question) and
Structural Equation Modelling (SEM)
") (SEM) Aims and Objectives By the end of this seminar you should: Have a working knowledge of the principles behind causality. Understand the basic steps to building a Model of the phenomenon of interest.
(SEM) Aims and Objectives By the end of this seminar you should: Have a working knowledge of the principles behind causality. Understand the basic steps to building a Model of the phenomenon of interest.
2. Linearity (in relationships among the variables--factors are linear constructions of the set of variables) F 2 X 4 U 4
 F 2 X 4 U 4") 1 Neuendorf Factor Analysis Assumptions: 1. Metric (interval/ratio) data. Linearity (in relationships among the variables--factors are linear constructions of the set of variables) 3. Univariate and multivariate
1 Neuendorf Factor Analysis Assumptions: 1. Metric (interval/ratio) data. Linearity (in relationships among the variables--factors are linear constructions of the set of variables) 3. Univariate and multivariate
Section 13, Part 1 ANOVA. Analysis Of Variance
 Section 13, Part 1 ANOVA Analysis Of Variance Course Overview So far in this course we ve covered: Descriptive statistics Summary statistics Tables and Graphs Probability Probability Rules Probability
" Y. Notation and Equations for Regression Lecture 11/4. Notation:
 Notation: Notation and Equations for Regression Lecture 11/4 m: The number of predictor variables in a regression Xi: One of multiple predictor variables. The subscript i represents any number from 1 through
January 26, 2009 The Faculty Center for Teaching and Learning
 THE BASICS OF DATA MANAGEMENT AND ANALYSIS A USER GUIDE January 26, 2009 The Faculty Center for Teaching and Learning THE BASICS OF DATA MANAGEMENT AND ANALYSIS Table of Contents Table of Contents... i
Rens van de Schoot a b, Peter Lugtig a & Joop Hox a a Department of Methods and Statistics, Utrecht
 This article was downloaded by: [University Library Utrecht] On: 15 May 2012, At: 01:20 Publisher: Psychology Press Informa Ltd Registered in England and Wales Registered Number: 1072954 Registered office:
An Empirical Study on the Effects of Software Characteristics on Corporate Performance
 , pp.61-66 http://dx.doi.org/10.14257/astl.2014.48.12 An Empirical Study on the Effects of Software Characteristics on Corporate Moon-Jong Choi 1, Won-Seok Kang 1 and Geun-A Kim 2 1 DGIST, 333 Techno Jungang
A Casual Structure Analysis of Smart phone Addiction: Use Motives of Smart phone Users and Psychological Characteristics
 A Casual Structure Analysis of Smart phone Addiction: Use Motives of Smart phone Users and Psychological Characteristics Dept. of Social Welfare, BaekSeok Culture University, ijoo65@hanmail.net Abstract
Least Squares Estimation
 Least Squares Estimation SARA A VAN DE GEER Volume 2, pp 1041 1045 in Encyclopedia of Statistics in Behavioral Science ISBN-13: 978-0-470-86080-9 ISBN-10: 0-470-86080-4 Editors Brian S Everitt & David
Factors That Improve the Quality of Information Technology and Knowledge Management System for SME(s) in Thailand
 in Thailand") China-USA Business Review, ISSN 1537-1514 March 2012, Vol. 11, No. 3, 359-367 D DAVID PUBLISHING Factors That Improve the Quality of Information Technology and Knowledge Management System for SME(s) in
China-USA Business Review, ISSN 1537-1514 March 2012, Vol. 11, No. 3, 359-367 D DAVID PUBLISHING Factors That Improve the Quality of Information Technology and Knowledge Management System for SME(s) in
MULTIPLE REGRESSION AND ISSUES IN REGRESSION ANALYSIS
 MULTIPLE REGRESSION AND ISSUES IN REGRESSION ANALYSIS MSR = Mean Regression Sum of Squares MSE = Mean Squared Error RSS = Regression Sum of Squares SSE = Sum of Squared Errors/Residuals α = Level of Significance
lavaan: an R package for structural equation modeling
 lavaan: an R package for structural equation modeling Yves Rosseel Department of Data Analysis Belgium Utrecht April 24, 2012 Yves Rosseel lavaan: an R package for structural equation modeling 1 / 20 Overview
Time Series Analysis
 Time Series Analysis hm@imm.dtu.dk Informatics and Mathematical Modelling Technical University of Denmark DK-2800 Kgs. Lyngby 1 Outline of the lecture Identification of univariate time series models, cont.:
Example: Credit card default, we may be more interested in predicting the probabilty of a default than classifying individuals as default or not.
 Statistical Learning: Chapter 4 Classification 4.1 Introduction Supervised learning with a categorical (Qualitative) response Notation: - Feature vector X, - qualitative response Y, taking values in C
IBM SPSS Statistics 20 Part 4: Chi-Square and ANOVA
 CALIFORNIA STATE UNIVERSITY, LOS ANGELES INFORMATION TECHNOLOGY SERVICES IBM SPSS Statistics 20 Part 4: Chi-Square and ANOVA Summer 2013, Version 2.0 Table of Contents Introduction...2 Downloading the
How To Check For Differences In The One Way Anova
 MINITAB ASSISTANT WHITE PAPER This paper explains the research conducted by Minitab statisticians to develop the methods and data checks used in the Assistant in Minitab 17 Statistical Software. One-Way
Evaluating Goodness-of-Fit Indexes for Testing Measurement Invariance
 STRUCTURAL EQUATION MODELING, 9(2), 233 255 Copyright 2002, Lawrence Erlbaum Associates, Inc. Evaluating Goodness-of-Fit Indexes for Testing Measurement Invariance Gordon W. Cheung Department of Management
Linear Mixed-Effects Modeling in SPSS: An Introduction to the MIXED Procedure
 Technical report Linear Mixed-Effects Modeling in SPSS: An Introduction to the MIXED Procedure Table of contents Introduction................................................................ 1 Data preparation
Correlational Research
 Correlational Research Chapter Fifteen Correlational Research Chapter Fifteen Bring folder of readings The Nature of Correlational Research Correlational Research is also known as Associational Research.
5.2 Customers Types for Grocery Shopping Scenario
 ------------------------------------------------------------------------------------------------------- CHAPTER 5: RESULTS AND ANALYSIS -------------------------------------------------------------------------------------------------------
How to report the percentage of explained common variance in exploratory factor analysis
 UNIVERSITAT ROVIRA I VIRGILI How to report the percentage of explained common variance in exploratory factor analysis Tarragona 2013 Please reference this document as: Lorenzo-Seva, U. (2013). How to report
Evaluating the Fit of Structural Equation Models: Tests of Significance and Descriptive Goodness-of-Fit Measures
 Methods of Psychological Research Online 003, Vol.8, No., pp. 3-74 Department of Psychology Internet: http://www.mpr-online.de 003 University of Koblenz-Landau Evaluating the Fit of Structural Equation
Moderation. Moderation
 Stats - Moderation Moderation A moderator is a variable that specifies conditions under which a given predictor is related to an outcome. The moderator explains when a DV and IV are related. Moderation
Exploratory Factor Analysis Brian Habing - University of South Carolina - October 15, 2003
 Exploratory Factor Analysis Brian Habing - University of South Carolina - October 15, 2003 FA is not worth the time necessary to understand it and carry it out. -Hills, 1977 Factor analysis should not
Factor Analysis. Chapter 420. Introduction
 Chapter 420 Introduction (FA) is an exploratory technique applied to a set of observed variables that seeks to find underlying factors (subsets of variables) from which the observed variables were generated.
Recall this chart that showed how most of our course would be organized:
 Chapter 4 One-Way ANOVA Recall this chart that showed how most of our course would be organized: Explanatory Variable(s) Response Variable Methods Categorical Categorical Contingency Tables Categorical
Goodness of fit assessment of item response theory models
 Goodness of fit assessment of item response theory models Alberto Maydeu Olivares University of Barcelona Madrid November 1, 014 Outline Introduction Overall goodness of fit testing Two examples Assessing
Social Media Marketing Management 社 會 媒 體 行 銷 管 理 確 認 性 因 素 分 析. (Confirmatory Factor Analysis) 1002SMMM12 TLMXJ1A Tue 12,13,14 (19:20-22:10) D325
 1002SMMM12 TLMXJ1A Tue 12,13,14 (19:20-22:10) D325") Social Media Marketing Management 社 會 媒 體 行 銷 管 理 確 認 性 因 素 分 析 (Confirmatory Factor Analysis) 1002SMMM12 TLMXJ1A Tue 12,13,14 (19:20-22:10) D325 Min-Yuh Day 戴 敏 育 Assistant Professor 專 任 助 理 教 授 Dept.
Social Media Marketing Management 社 會 媒 體 行 銷 管 理 確 認 性 因 素 分 析 (Confirmatory Factor Analysis) 1002SMMM12 TLMXJ1A Tue 12,13,14 (19:20-22:10) D325 Min-Yuh Day 戴 敏 育 Assistant Professor 專 任 助 理 教 授 Dept.
Testing Group Differences using T-tests, ANOVA, and Nonparametric Measures
 Testing Group Differences using T-tests, ANOVA, and Nonparametric Measures Jamie DeCoster Department of Psychology University of Alabama 348 Gordon Palmer Hall Box 870348 Tuscaloosa, AL 35487-0348 Phone:
CHAPTER 4 EXAMPLES: EXPLORATORY FACTOR ANALYSIS
 Examples: Exploratory Factor Analysis CHAPTER 4 EXAMPLES: EXPLORATORY FACTOR ANALYSIS Exploratory factor analysis (EFA) is used to determine the number of continuous latent variables that are needed to
Handling attrition and non-response in longitudinal data
 Longitudinal and Life Course Studies 2009 Volume 1 Issue 1 Pp 63-72 Handling attrition and non-response in longitudinal data Harvey Goldstein University of Bristol Correspondence. Professor H. Goldstein
Factor analysis. Angela Montanari
 Factor analysis Angela Montanari 1 Introduction Factor analysis is a statistical model that allows to explain the correlations between a large number of observed correlated variables through a small number
Quantitative Methods for Finance
 Quantitative Methods for Finance Module 1: The Time Value of Money 1 Learning how to interpret interest rates as required rates of return, discount rates, or opportunity costs. 2 Learning how to explain
SPSS ADVANCED ANALYSIS WENDIANN SETHI SPRING 2011
 SPSS ADVANCED ANALYSIS WENDIANN SETHI SPRING 2011 Statistical techniques to be covered Explore relationships among variables Correlation Regression/Multiple regression Logistic regression Factor analysis
Introduction to Structural Equation Modeling (SEM) Day 4: November 29, 2012
 Day 4: November 29, 2012") Introduction to Structural Equation Modeling (SEM) Day 4: November 29, 202 ROB CRIBBIE QUANTITATIVE METHODS PROGRAM DEPARTMENT OF PSYCHOLOGY COORDINATOR - STATISTICAL CONSULTING SERVICE COURSE MATERIALS
Introduction to Structural Equation Modeling (SEM) Day 4: November 29, 202 ROB CRIBBIE QUANTITATIVE METHODS PROGRAM DEPARTMENT OF PSYCHOLOGY COORDINATOR - STATISTICAL CONSULTING SERVICE COURSE MATERIALS
Data Analysis in SPSS. February 21, 2004. If you wish to cite the contents of this document, the APA reference for them would be
 Data Analysis in SPSS Jamie DeCoster Department of Psychology University of Alabama 348 Gordon Palmer Hall Box 870348 Tuscaloosa, AL 35487-0348 Heather Claypool Department of Psychology Miami University
Chapter 6: Multivariate Cointegration Analysis
 Chapter 6: Multivariate Cointegration Analysis 1 Contents: Lehrstuhl für Department Empirische of Wirtschaftsforschung Empirical Research and und Econometrics Ökonometrie VI. Multivariate Cointegration
Profile analysis is the multivariate equivalent of repeated measures or mixed ANOVA. Profile analysis is most commonly used in two cases:
 Profile Analysis Introduction Profile analysis is the multivariate equivalent of repeated measures or mixed ANOVA. Profile analysis is most commonly used in two cases: ) Comparing the same dependent variables
A Basic Guide to Analyzing Individual Scores Data with SPSS
 A Basic Guide to Analyzing Individual Scores Data with SPSS Step 1. Clean the data file Open the Excel file with your data. You may get the following message: If you get this message, click yes. Delete
Analysis of Variance. MINITAB User s Guide 2 3-1
 3 Analysis of Variance Analysis of Variance Overview, 3-2 One-Way Analysis of Variance, 3-5 Two-Way Analysis of Variance, 3-11 Analysis of Means, 3-13 Overview of Balanced ANOVA and GLM, 3-18 Balanced
13: Additional ANOVA Topics. Post hoc Comparisons
 13: Additional ANOVA Topics Post hoc Comparisons ANOVA Assumptions Assessing Group Variances When Distributional Assumptions are Severely Violated Kruskal-Wallis Test Post hoc Comparisons In the prior
Exploratory Factor Analysis and Principal Components. Pekka Malo & Anton Frantsev 30E00500 Quantitative Empirical Research Spring 2016
 and Principal Components Pekka Malo & Anton Frantsev 30E00500 Quantitative Empirical Research Spring 2016 Agenda Brief History and Introductory Example Factor Model Factor Equation Estimation of Loadings
Analysis of Data. Organizing Data Files in SPSS. Descriptive Statistics
 Analysis of Data Claudia J. Stanny PSY 67 Research Design Organizing Data Files in SPSS All data for one subject entered on the same line Identification data Between-subjects manipulations: variable to
COMPARISONS OF CUSTOMER LOYALTY: PUBLIC & PRIVATE INSURANCE COMPANIES.
 277 CHAPTER VI COMPARISONS OF CUSTOMER LOYALTY: PUBLIC & PRIVATE INSURANCE COMPANIES. This chapter contains a full discussion of customer loyalty comparisons between private and public insurance companies
EPS 625 INTERMEDIATE STATISTICS FRIEDMAN TEST
 EPS 625 INTERMEDIATE STATISTICS The Friedman test is an extension of the Wilcoxon test. The Wilcoxon test can be applied to repeated-measures data if participants are assessed on two occasions or conditions
UNDERSTANDING THE TWO-WAY ANOVA
 UNDERSTANDING THE e have seen how the one-way ANOVA can be used to compare two or more sample means in studies involving a single independent variable. This can be extended to two independent variables
How to Get More Value from Your Survey Data
 Technical report How to Get More Value from Your Survey Data Discover four advanced analysis techniques that make survey research more effective Table of contents Introduction..............................................................2
Pragmatic Perspectives on the Measurement of Information Systems Service Quality
 Pragmatic Perspectives on the Measurement of Information Systems Service Quality Analysis with LISREL: An Appendix to Pragmatic Perspectives on the Measurement of Information Systems Service Quality William
Tutorial: Get Running with Amos Graphics
 Tutorial: Get Running with Amos Graphics Purpose Remember your first statistics class when you sweated through memorizing formulas and laboriously calculating answers with pencil and paper? The professor
Specification of Rasch-based Measures in Structural Equation Modelling (SEM) Thomas Salzberger www.matildabayclub.net
 Thomas Salzberger www.matildabayclub.net") Specification of Rasch-based Measures in Structural Equation Modelling (SEM) Thomas Salzberger www.matildabayclub.net This document deals with the specification of a latent variable - in the framework
Specification of Rasch-based Measures in Structural Equation Modelling (SEM) Thomas Salzberger www.matildabayclub.net This document deals with the specification of a latent variable - in the framework
HYPOTHESIS TESTING: CONFIDENCE INTERVALS, T-TESTS, ANOVAS, AND REGRESSION
 HYPOTHESIS TESTING: CONFIDENCE INTERVALS, T-TESTS, ANOVAS, AND REGRESSION HOD 2990 10 November 2010 Lecture Background This is a lightning speed summary of introductory statistical methods for senior undergraduate
REVIEWING THREE DECADES WORTH OF STATISTICAL ADVANCEMENTS IN INDUSTRIAL-ORGANIZATIONAL PSYCHOLOGICAL RESEARCH
 1 REVIEWING THREE DECADES WORTH OF STATISTICAL ADVANCEMENTS IN INDUSTRIAL-ORGANIZATIONAL PSYCHOLOGICAL RESEARCH Nicholas Wrobel Faculty Sponsor: Kanako Taku Department of Psychology, Oakland University
The Statistics Tutor s Quick Guide to
 statstutor community project encouraging academics to share statistics support resources All stcp resources are released under a Creative Commons licence The Statistics Tutor s Quick Guide to Stcp-marshallowen-7
Example: Boats and Manatees
 Figure 9-6 Example: Boats and Manatees Slide 1 Given the sample data in Table 9-1, find the value of the linear correlation coefficient r, then refer to Table A-6 to determine whether there is a significant
Chapter 7: Simple linear regression Learning Objectives
 Chapter 7: Simple linear regression Learning Objectives Reading: Section 7.1 of OpenIntro Statistics Video: Correlation vs. causation, YouTube (2:19) Video: Intro to Linear Regression, YouTube (5:18) -