FACTOR ANALYSIS NASC
|
|
|
- Emma Alyson Campbell
- 9 years ago
- Views:
Transcription
1 FACTOR ANALYSIS NASC

2 Factor Analysis A data reduction technique designed to represent a wide range of attributes on a smaller number of dimensions. Aim is to identify groups of variables which are relatively homogeneous. Groups of related variables are called factors.

3 Purposes The main applications of factor analytic techniques are: (1) to reduce the number of variables and (2) to detect structure in the relationships between variables, that is to classify variables.

4 Conceptual Model for a Factor Analysis with a Simple Model Factor 1 Factor 2 Factor 3 e.g., 12 items testing might actually tap only 3 underlying factors

5 Conceptual Model for Factor Analysis (with cross-loadings)

6 Common Factor Model It is suggested that X 1, X 2, and X 3 are functions of two underlying factors, F 1 and F 2. It is assumed that each X variables are linearly related to the two factors as shown in the following model. X 1 = β 11 F 1 + β 12 F 2 + e 1 X 2 = β 21 F 1 + β 22 F 2 + e 2 X 3 = β 31 F 1 + β 32 F 2 + e 3 The error terms e 1, e 2, and e 3, serve to indicate that the hypothesized relationships are not exact. In the vocabulary of factor analysis, the parameters β ij are referred to asfactorloadings. For example, β 12 is the factor loading of variable X 1 on factor F 2.

7 Expected Structure of Loadings It is expected that the loadings have roughly the structure as shown in the table. Loading (F1) β i1 Loading (F2) β i2 X1 + 0 X2 0 + X3 0 + Of course, the zeros in the preceding table are not expected to be exactly equal to zero. By `0' we mean approximately equal to zero and by `+' a positive number substantially different from zero.

8 Model Assumptions A1: The error terms e i are independent of one another and E(e i ) = 0 and Var(e i ) = σ i2, A2:The unobservable factors are independent of one another. It is also assumed that the factors and error terms are independent. As for the factor means and variances, the assumption is that the factors are standardized: E(F j ) = 0 and Var(F j ) = 1. It is an assumption made for convenience; since the factors are unobservable, we might as well think of them as measured in standardized form.

9 Implications of Assumptions The variance of X i from the model can be expressed as Var(X i ) = Var(F 1 ) + Var(F 2 )+ Var(e i ) = + + We see that the variance of X i consists of two parts: ( + ) and. The first part is called communality of the variable. It is the part of Var(X i ) explained by the common factors F 1 and F 2. The second part is called specific variance of the variable. It is the part of Var(X i ) unable to explain by the common factors. The covariance of any two observable variables, X i and X j, from the model can be expressed as Cov(X i, X j ) = β i1 β j1 Var(F 1 )+ β i2 β j2 Var(F 2 ) = β i1 β j1 +β i2 β j2
 unable to explain by the common factors.")
10 History of Factor Analysis? Invented by Spearman (1904) Usage hampered by onerousness of hand calculation Since the advent of computers, usage has thrived, esp. to develop: Theory e.g., determining the structure of personality Practice e.g., development of 10,000s+ of psychological screening and measurement tests

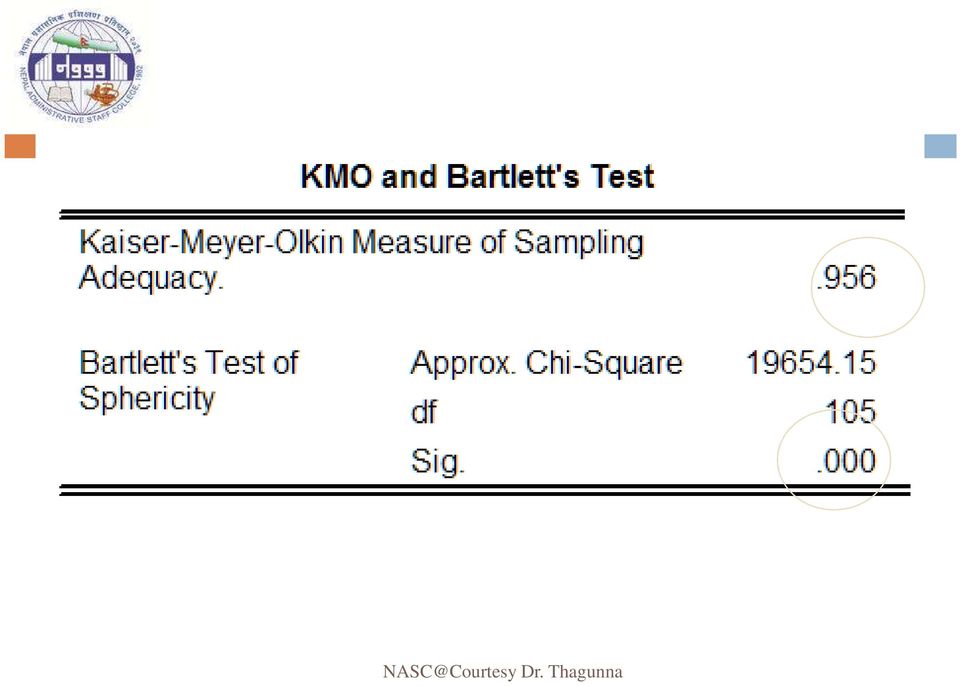
11 Assumption Testing Factorability It is important to check the factorability of the correlation matrix (i.e., how suitable is the data for factor analysis?) Check correlation matrix for correlations Check the anti-image matrix for diagonals Check measures of sampling adequacy (MSAs) Bartlett s KMO
 Bartlett s KMO")
12 Rule of thumb: Measures of Sampling Adequacy Are there several correlations over.3? Are the diagonals of anti-image matrix >.5? Is Bartlett s test significant? Is KMO >.5?

13 Assumption Testing Factorability (Correlation and partial correlation) Medium effort, reasonably accurate Examine the diagonals on the anti-image correlation matrix to assess the sampling adequacy of each variable Variables with diagonal anti-image correlations of less that.5 should be excluded from the analysis they lack sufficient correlation with other variables

14 Assumption Testing Factorability (Bartlett s and KMO measure) Sampling Adequacy predicts whether the data you have collected are likely to "factor well" based on correlation and partial correlation and this is measured by the Kaiser- Meyer-Olkin (KMO) statistic Quickest method, but least reliable Global diagnostic indicators - correlation matrix is factorable if: Bartlett s test of sphericity is significant and/or (Null: no correlation among the variables(unit R matrix) Kaiser-Mayer Olkin (KMO) measure of sampling adequacy >.5
 Kaiser-Mayer Olkin (KMO) measure of")
15
16 Communalities The proportion of variance in each variable which can be explained by the factors Also called the explained variation due to factor. Communalities range between 0 and 1 High communalities (>.5) show that the factors extracted explain most of the variance in the variables being analysed. Low communalities (<.5) mean there is considerable variance unexplained by the factors extracted
 show that the factors extracted explain most of the variance in the variables being analysed.")
17 Eigen Values EV = sum of squared correlations for each factor EV = overall strength of relationship between a factor and the variables Successive EVs have lower values Eigen values over 1 are stable

18 Explained Variance A good factor solution is one that explains the most variance with the fewest factors Realistically happy with 50-75% of the variance explained

19 Example: interpreting the communality Variable (1) Variance (2) Loadings of F 1 (3) Loadings of F 2 (4) Communality (5) % explained (6) = 100 (5)/(2) Finance 1, Marketing Policy Overall The loadings on F 1 are relatively large for marketing and policy but close to zero for finance. On the contrary, the loadings on F 2 are relatively large for finance but relatively low for marketing and policy. This solution supports the expectation. F 1 could be interpreted as verbal ability, and F 2 as quantitative ability.

20 Assessment of the First Solution based on R The communalities show that the factor model explains nearly 100%, 99.5%, and 99.5% respectively of the observed variance of finance, marketing and policy grades. Overall, the two factors explain 99.65% of the sum of all observed variances. The sum of squared loadings on F 1 can be interpreted as the contribution of F 1, and that on F 2 as the contribution of F 2 in explaining the sum of the observed variances. In our example F 1 explains about /3 or 66%, and F 2 about 33.7% of the sum of the observed variances. Theoretically, the sum of squared loadings, , is the largest eigenvalue of R and the loadings on F1 constitute the corresponding eigenvector. the sum of squared loadings, , is the second largest eigenvalue of R and the loadings on F2 constitute the corresponding eigenvector.

21
22 How Many Factors? A subjective process. Seek to explain maximum variance using fewest factors, considering: 1. Theory what is predicted/expected? 2. Eigen Values > 1? (Kaiser s criterion) 3. Scree Plot where does it drop off? 4. Factors must be able to be meaningfully interpreted & make theoretical sense?
23 Cattell & Jaspers (1967) suggest that the number of factors be taken as the number of eigenvalues immediately before the straight line begins.
24 Scree Plot A bar graph of Eigen Values Depicts the amount of variance explained by each factor. Look for point where additional factors fail to add appreciably to the cumulative explained variance. 1st factor explains the most variance Last factor explains the least amount of variance
25 Factor Rotation Factor loadings are not unique. There exist an infinite sets of factor loadings yielding the same theoretical dispersion matrix. The process of obtaining a new set of loadings with some specific objective is called factor rotation. Orthogonal (Varimax) Oblimin
26 Factor loading stages In practice, FA can be carried out in two stages. In the first stage, one set of loadings is estimated. These loadings may not agree with the prior expectations, or may not lend themselves to a reasonable interpretation. In the second stage, the first set of factor loadings are "rotated" in an effort to arrive at another set that are more consistent with prior expectations or more easily interpretable. variables with cross-loading shall be omitted from the further analysis.
27 How do I eliminate items? A subjective process, but consider: Size of main loading (min=.5) Size of cross loadings (max=.3?) Eliminate 1 variable at a time, then re-run, before deciding which/if any items to eliminate next Number of items already in the factor More items in a factor -> greater reliability Minimum = 3 Maximum = unlimited
28 Factor Analysis: an example suppose that an automobile company asked a large number of questions about different vehicles. Consider how the different items (features) might be more parsimoniously represented by just a few constructs (factors). - Ideally, interval data (e.g., a rating on a k- point scale), regarding the perceptions of consumers are required regarding a number of features
29
30
31
32 Cumulative percent of variance explained. We are looking for an eigenvalue above 1.0.
33
34
35 Expensive Exciting Luxury Distinctive Not Conservative Not Family Not Basic Appeals to Others Attractive Looking Trend Setting Reliable Latest Features Trust
36 What shall these components be called? Expensive Exciting Luxury Distinctive Not Conservative Not Family Not Basic Appeals to Others Attractive Looking Trend Setting Reliable Latest Features Trust
37 EXCLUSIVE TRENDY RELIABLE Expensive Exciting Luxury Distinctive Not Conservative Not Family Not Basic Appeals to Others Attractive Looking Trend Setting Reliable Latest Features Trust
38 Calculate Component Scores(summated score) EXCLUSIVE = (Expensive + Exciting + Luxury + Distinctive Conservative Family Basic)/7 TRENDY = (Appeals to Others + Attractive Looking + Trend Setting)/3 RELIABLE = (Reliable + Latest Features + Trust)/3
39
40
41 Exclusive Trendy Reliable Beetle Hummer Lotus Minivan Pick-Up Not much differing on this dimension.
42 Exclusive Trendy Reliable Beetle Hummer Lotus Minivan Pick-Up

43 Practical session : using SPSS Step 1: Open the data file, for example, Example.SAV Step 2: Click on sequentially: Analyze Data Reduction Factor. Step 3: Move the three variables X1, X2 & X3 - from Source to Variable box

44 Step 4: Click on Descriptives. Activate Coefficients Significance levels KMO and Bartlett s test of sphericity Anti-image Click on Continue. This will produce correlation matrix and significance of correlations, sampling adequacy and test of sphericity. Step 5: Click on Extraction. Activate Correlation Matrix Unrotated factor solution Eigenvalues greater than 1 Click on Continue. This will produce loadings from correlation matrix and the number of factors is same as the number of eigenvalues greater than 1.

45 Step 6: Click on Rotation. Activate Varimax Rotated Solution Click on Continue Step 7: Click on OK SPSS will produce 8 tables as outputs with table titles 1. Correlation Matrix 2. KMO & Bartlett s Test 3. Anti-image Matrices 4. Communalities 5. Total Variance Explained 6. Component Matrix 7. Rotated Component Matrix 8. Component Transformation Matrix
46 Composite Factor Values Frequently, FA is not an end in itself but an intermediate step on the way to further analysis of the data. In such case we may require the composite values of each factor based on original/standardized data. are generated through three techniques. In recent years, the composite values Surrogated variables (A surrogated variable of a factor is a single variable that has the highest factor loading) Summated scale (The values of several variables defining a factor are summed and their total or average scores are considered) Factor scores (computer generated scores available under Scores of the main FA procedure). There are three methods Regression, Bartlett, and Anderson-Rubin.
47 Advantages & Disadvantages of the Techniques Surrogate Variables Factor Scores Summated Scales Source: Hair et al Advantages Simple to administer and interpret Represent all variables through loadings Best method for complete data reduction By default orthogonal Compromise between the surrogate variable and factor score options Reduce measurement error Represent multiple facets of a concept Disadvantages Does not represent all facets of a factor Prone to measurement error Interpretation more difficult because all variables contribute through loadings Include only the variables that load highly on the factor and exclude those having little or marginal impact Not necessarily orthogonal Require extensive analysis of reliability and validity
48 Judging Practical Significance of FA In interpreting factors, a decision must be made regarding the factor loadings. A factor loading is the correlation of the variable and the factor, the squared loading is the amount of the variable's total variation accounted for by the factor. Thus, a 0.3 loading translates to 9 per cent explanation; and a 0.5 loading denotes that 25% of the variation is accounted for by the factor. The loading must exceed 0.7 for the factor to account for 50% of the variation of the variable. Thus larger the absolute size of the factor loading, the more improvement the loading in interpreting the factor matrix using the practical significance as the criteria, we can assess the loadings as follows. Factor loadings in the range of ±0.3 to ±0.4 are considered to meet the minimal level for interpretation of structure Absolute value of loading 0.5 or greater are considered practically significant Absolute value of loading 0.7 or greater are considered indicative of well-defined structure and are the goal of any FA
49 Some Relations Among Output Values A number of relations exist among outputs, which help us to understand and interpret outputs better. The major relations are the followings when input matrix is p p correlation matrix. 1. Sum of all eigenvalues = p = total variance of p standardized variables. 2. Sum of squared factor loadings for the j th factor =λ j = j th largest eigenvalue 3. λ j = amount of variance the j th factor explains 4. λ j /p = proportion of variance explained by the j th factor 5. Sum of squared factor loadings for the i th variable = i th communality 6. i th communality = proportion of the variance of the i th standardized variable explained by the common factor model 7. (i, j) th factor loading is the correlation between the i th variable and the j th factor
Chapter 7 Factor Analysis SPSS
 Chapter 7 Factor Analysis SPSS Factor analysis attempts to identify underlying variables, or factors, that explain the pattern of correlations within a set of observed variables. Factor analysis is often
Factor Analysis. Principal components factor analysis. Use of extracted factors in multivariate dependency models
 Factor Analysis Principal components factor analysis Use of extracted factors in multivariate dependency models 2 KEY CONCEPTS ***** Factor Analysis Interdependency technique Assumptions of factor analysis
Factor Analysis. Advanced Financial Accounting II Åbo Akademi School of Business
 Factor Analysis Advanced Financial Accounting II Åbo Akademi School of Business Factor analysis A statistical method used to describe variability among observed variables in terms of fewer unobserved variables
A Brief Introduction to SPSS Factor Analysis
 A Brief Introduction to SPSS Factor Analysis SPSS has a procedure that conducts exploratory factor analysis. Before launching into a step by step example of how to use this procedure, it is recommended
Factor Analysis. Chapter 420. Introduction
 Chapter 420 Introduction (FA) is an exploratory technique applied to a set of observed variables that seeks to find underlying factors (subsets of variables) from which the observed variables were generated.
Exploratory Factor Analysis
 Introduction Principal components: explain many variables using few new variables. Not many assumptions attached. Exploratory Factor Analysis Exploratory factor analysis: similar idea, but based on model.
Exploratory Factor Analysis and Principal Components. Pekka Malo & Anton Frantsev 30E00500 Quantitative Empirical Research Spring 2016
 and Principal Components Pekka Malo & Anton Frantsev 30E00500 Quantitative Empirical Research Spring 2016 Agenda Brief History and Introductory Example Factor Model Factor Equation Estimation of Loadings
Exploratory Factor Analysis Brian Habing - University of South Carolina - October 15, 2003
 Exploratory Factor Analysis Brian Habing - University of South Carolina - October 15, 2003 FA is not worth the time necessary to understand it and carry it out. -Hills, 1977 Factor analysis should not
T-test & factor analysis
 Parametric tests T-test & factor analysis Better than non parametric tests Stringent assumptions More strings attached Assumes population distribution of sample is normal Major problem Alternatives Continue
FACTOR ANALYSIS. Factor Analysis is similar to PCA in that it is a technique for studying the interrelationships among variables.
 FACTOR ANALYSIS Introduction Factor Analysis is similar to PCA in that it is a technique for studying the interrelationships among variables Both methods differ from regression in that they don t have
5.2 Customers Types for Grocery Shopping Scenario
 ------------------------------------------------------------------------------------------------------- CHAPTER 5: RESULTS AND ANALYSIS -------------------------------------------------------------------------------------------------------
To do a factor analysis, we need to select an extraction method and a rotation method. Hit the Extraction button to specify your extraction method.
 Factor Analysis in SPSS To conduct a Factor Analysis, start from the Analyze menu. This procedure is intended to reduce the complexity in a set of data, so we choose Data Reduction from the menu. And the
Factor Analysis Example: SAS program (in blue) and output (in black) interleaved with comments (in red)
 and output (in black) interleaved with comments (in red)") Factor Analysis Example: SAS program (in blue) and output (in black) interleaved with comments (in red) The following DATA procedure is to read input data. This will create a SAS dataset named CORRMATR
Factor Analysis Example: SAS program (in blue) and output (in black) interleaved with comments (in red) The following DATA procedure is to read input data. This will create a SAS dataset named CORRMATR
2. Linearity (in relationships among the variables--factors are linear constructions of the set of variables) F 2 X 4 U 4
 F 2 X 4 U 4") 1 Neuendorf Factor Analysis Assumptions: 1. Metric (interval/ratio) data. Linearity (in relationships among the variables--factors are linear constructions of the set of variables) 3. Univariate and multivariate
1 Neuendorf Factor Analysis Assumptions: 1. Metric (interval/ratio) data. Linearity (in relationships among the variables--factors are linear constructions of the set of variables) 3. Univariate and multivariate
Common factor analysis
 Common factor analysis This is what people generally mean when they say "factor analysis" This family of techniques uses an estimate of common variance among the original variables to generate the factor
Factor Analysis. Factor Analysis
 Factor Analysis Principal Components Analysis, e.g. of stock price movements, sometimes suggests that several variables may be responding to a small number of underlying forces. In the factor model, we
Multivariate Analysis (Slides 13)
") Multivariate Analysis (Slides 13) The final topic we consider is Factor Analysis. A Factor Analysis is a mathematical approach for attempting to explain the correlation between a large set of variables
Multivariate Analysis (Slides 13) The final topic we consider is Factor Analysis. A Factor Analysis is a mathematical approach for attempting to explain the correlation between a large set of variables
4. There are no dependent variables specified... Instead, the model is: VAR 1. Or, in terms of basic measurement theory, we could model it as:
 1 Neuendorf Factor Analysis Assumptions: 1. Metric (interval/ratio) data 2. Linearity (in the relationships among the variables--factors are linear constructions of the set of variables; the critical source
Factor Analysis Using SPSS
 Psychology 305 p. 1 Factor Analysis Using SPSS Overview For this computer assignment, you will conduct a series of principal factor analyses to examine the factor structure of a new instrument developed
Review Jeopardy. Blue vs. Orange. Review Jeopardy
 Review Jeopardy Blue vs. Orange Review Jeopardy Jeopardy Round Lectures 0-3 Jeopardy Round $200 How could I measure how far apart (i.e. how different) two observations, y 1 and y 2, are from each other?
Exploratory Factor Analysis
 Exploratory Factor Analysis Definition Exploratory factor analysis (EFA) is a procedure for learning the extent to which k observed variables might measure m abstract variables, wherein m is less than
Statistics in Psychosocial Research Lecture 8 Factor Analysis I. Lecturer: Elizabeth Garrett-Mayer
 This work is licensed under a Creative Commons Attribution-NonCommercial-ShareAlike License. Your use of this material constitutes acceptance of that license and the conditions of use of materials on this
STA 4107/5107. Chapter 3
 STA 4107/5107 Chapter 3 Factor Analysis 1 Key Terms Please review and learn these terms. 2 What is Factor Analysis? Factor analysis is an interdependence technique (see chapter 1) that primarily uses metric
Rachel J. Goldberg, Guideline Research/Atlanta, Inc., Duluth, GA
 PROC FACTOR: How to Interpret the Output of a Real-World Example Rachel J. Goldberg, Guideline Research/Atlanta, Inc., Duluth, GA ABSTRACT THE METHOD This paper summarizes a real-world example of a factor
DATA ANALYSIS AND INTERPRETATION OF EMPLOYEES PERSPECTIVES ON HIGH ATTRITION
 DATA ANALYSIS AND INTERPRETATION OF EMPLOYEES PERSPECTIVES ON HIGH ATTRITION Analysis is the key element of any research as it is the reliable way to test the hypotheses framed by the investigator. This
Exploratory Factor Analysis: rotation. Psychology 588: Covariance structure and factor models
 Exploratory Factor Analysis: rotation Psychology 588: Covariance structure and factor models Rotational indeterminacy Given an initial (orthogonal) solution (i.e., Φ = I), there exist infinite pairs of
Factor Analysis. Sample StatFolio: factor analysis.sgp
 STATGRAPHICS Rev. 1/10/005 Factor Analysis Summary The Factor Analysis procedure is designed to extract m common factors from a set of p quantitative variables X. In many situations, a small number of
Introduction to Principal Components and FactorAnalysis
 Introduction to Principal Components and FactorAnalysis Multivariate Analysis often starts out with data involving a substantial number of correlated variables. Principal Component Analysis (PCA) is a
APPRAISAL OF FINANCIAL AND ADMINISTRATIVE FUNCTIONING OF PUNJAB TECHNICAL UNIVERSITY
 APPRAISAL OF FINANCIAL AND ADMINISTRATIVE FUNCTIONING OF PUNJAB TECHNICAL UNIVERSITY In the previous chapters the budgets of the university have been analyzed using various techniques to understand the
Research Methodology: Tools
 MSc Business Administration Research Methodology: Tools Applied Data Analysis (with SPSS) Lecture 02: Item Analysis / Scale Analysis / Factor Analysis February 2014 Prof. Dr. Jürg Schwarz Lic. phil. Heidi
A Beginner s Guide to Factor Analysis: Focusing on Exploratory Factor Analysis
 Tutorials in Quantitative Methods for Psychology 2013, Vol. 9(2), p. 79-94. A Beginner s Guide to Factor Analysis: Focusing on Exploratory Factor Analysis An Gie Yong and Sean Pearce University of Ottawa
Overview of Factor Analysis
 Overview of Factor Analysis Jamie DeCoster Department of Psychology University of Alabama 348 Gordon Palmer Hall Box 870348 Tuscaloosa, AL 35487-0348 Phone: (205) 348-4431 Fax: (205) 348-8648 August 1,
Exploratory Factor Analysis
 Exploratory Factor Analysis ( 探 索 的 因 子 分 析 ) Yasuyo Sawaki Waseda University JLTA2011 Workshop Momoyama Gakuin University October 28, 2011 1 Today s schedule Part 1: EFA basics Introduction to factor
Factor Analysis Using SPSS
 Factor Analysis Using SPSS The theory of factor analysis was described in your lecture, or read Field (2005) Chapter 15. Example Factor analysis is frequently used to develop questionnaires: after all
Principal Component Analysis
 Principal Component Analysis Principle Component Analysis: A statistical technique used to examine the interrelations among a set of variables in order to identify the underlying structure of those variables.
Statistics for Business Decision Making
 Statistics for Business Decision Making Faculty of Economics University of Siena 1 / 62 You should be able to: ˆ Summarize and uncover any patterns in a set of multivariate data using the (FM) ˆ Apply
Topic 10: Factor Analysis
 Topic 10: Factor Analysis Introduction Factor analysis is a statistical method used to describe variability among observed variables in terms of a potentially lower number of unobserved variables called
Least-Squares Intersection of Lines
 Least-Squares Intersection of Lines Johannes Traa - UIUC 2013 This write-up derives the least-squares solution for the intersection of lines. In the general case, a set of lines will not intersect at a
Multivariate Analysis
 Table Of Contents Multivariate Analysis... 1 Overview... 1 Principal Components... 2 Factor Analysis... 5 Cluster Observations... 12 Cluster Variables... 17 Cluster K-Means... 20 Discriminant Analysis...
Psychology 7291, Multivariate Analysis, Spring 2003. SAS PROC FACTOR: Suggestions on Use
 : Suggestions on Use Background: Factor analysis requires several arbitrary decisions. The choices you make are the options that you must insert in the following SAS statements: PROC FACTOR METHOD=????
CHAPTER 8 FACTOR EXTRACTION BY MATRIX FACTORING TECHNIQUES. From Exploratory Factor Analysis Ledyard R Tucker and Robert C.
 CHAPTER 8 FACTOR EXTRACTION BY MATRIX FACTORING TECHNIQUES From Exploratory Factor Analysis Ledyard R Tucker and Robert C MacCallum 1997 180 CHAPTER 8 FACTOR EXTRACTION BY MATRIX FACTORING TECHNIQUES In
The Effectiveness of Ethics Program among Malaysian Companies
 2011 2 nd International Conference on Economics, Business and Management IPEDR vol.22 (2011) (2011) IACSIT Press, Singapore The Effectiveness of Ethics Program among Malaysian Companies Rabiatul Alawiyah
LIST OF TABLES. 4.3 The frequency distribution of employee s opinion about training functions emphasizes the development of managerial competencies
 LIST OF TABLES Table No. Title Page No. 3.1. Scoring pattern of organizational climate scale 60 3.2. Dimension wise distribution of items of HR practices scale 61 3.3. Reliability analysis of HR practices
Canonical Correlation Analysis
 Canonical Correlation Analysis LEARNING OBJECTIVES Upon completing this chapter, you should be able to do the following: State the similarities and differences between multiple regression, factor analysis,
NCSS Statistical Software Principal Components Regression. In ordinary least squares, the regression coefficients are estimated using the formula ( )
") Chapter 340 Principal Components Regression Introduction is a technique for analyzing multiple regression data that suffer from multicollinearity. When multicollinearity occurs, least squares estimates
Chapter 340 Principal Components Regression Introduction is a technique for analyzing multiple regression data that suffer from multicollinearity. When multicollinearity occurs, least squares estimates
An introduction to. Principal Component Analysis & Factor Analysis. Using SPSS 19 and R (psych package) Robin Beaumont [email protected].
 Robin Beaumont robin@organplayers.co.") An introduction to Principal Component Analysis & Factor Analysis Using SPSS 19 and R (psych package) Robin Beaumont [email protected] Monday, 23 April 2012 Acknowledgment: The original version
An introduction to Principal Component Analysis & Factor Analysis Using SPSS 19 and R (psych package) Robin Beaumont [email protected] Monday, 23 April 2012 Acknowledgment: The original version
Factor analysis. Angela Montanari
 Factor analysis Angela Montanari 1 Introduction Factor analysis is a statistical model that allows to explain the correlations between a large number of observed correlated variables through a small number
Data analysis process
 Data analysis process Data collection and preparation Collect data Prepare codebook Set up structure of data Enter data Screen data for errors Exploration of data Descriptive Statistics Graphs Analysis
This chapter will demonstrate how to perform multiple linear regression with IBM SPSS
 CHAPTER 7B Multiple Regression: Statistical Methods Using IBM SPSS This chapter will demonstrate how to perform multiple linear regression with IBM SPSS first using the standard method and then using the
Least Squares Estimation
 Least Squares Estimation SARA A VAN DE GEER Volume 2, pp 1041 1045 in Encyclopedia of Statistics in Behavioral Science ISBN-13: 978-0-470-86080-9 ISBN-10: 0-470-86080-4 Editors Brian S Everitt & David
HYPOTHESIS TESTING: CONFIDENCE INTERVALS, T-TESTS, ANOVAS, AND REGRESSION
 HYPOTHESIS TESTING: CONFIDENCE INTERVALS, T-TESTS, ANOVAS, AND REGRESSION HOD 2990 10 November 2010 Lecture Background This is a lightning speed summary of introductory statistical methods for senior undergraduate
Principal Component Analysis
 Principal Component Analysis ERS70D George Fernandez INTRODUCTION Analysis of multivariate data plays a key role in data analysis. Multivariate data consists of many different attributes or variables recorded
SPSS ADVANCED ANALYSIS WENDIANN SETHI SPRING 2011
 SPSS ADVANCED ANALYSIS WENDIANN SETHI SPRING 2011 Statistical techniques to be covered Explore relationships among variables Correlation Regression/Multiple regression Logistic regression Factor analysis
Does organizational culture cheer organizational profitability? A case study on a Bangalore based Software Company
 Does organizational culture cheer organizational profitability? A case study on a Bangalore based Software Company S Deepalakshmi Assistant Professor Department of Commerce School of Business, Alliance
II. DISTRIBUTIONS distribution normal distribution. standard scores
 Appendix D Basic Measurement And Statistics The following information was developed by Steven Rothke, PhD, Department of Psychology, Rehabilitation Institute of Chicago (RIC) and expanded by Mary F. Schmidt,
Pull and Push Factors of Migration: A Case Study in the Urban Area of Monywa Township, Myanmar
 Pull and Push Factors of Migration: A Case Study in the Urban Area of Monywa Township, Myanmar By Kyaing Kyaing Thet Abstract: Migration is a global phenomenon caused not only by economic factors, but
Practical Considerations for Using Exploratory Factor Analysis in Educational Research
 A peer-reviewed electronic journal. Copyright is retained by the first or sole author, who grants right of first publication to the Practical Assessment, Research & Evaluation. Permission is granted to
Simple Linear Regression Inference
 Simple Linear Regression Inference 1 Inference requirements The Normality assumption of the stochastic term e is needed for inference even if it is not a OLS requirement. Therefore we have: Interpretation
PRINCIPAL COMPONENT ANALYSIS
 1 Chapter 1 PRINCIPAL COMPONENT ANALYSIS Introduction: The Basics of Principal Component Analysis........................... 2 A Variable Reduction Procedure.......................................... 2
Introduction to Matrix Algebra
 Psychology 7291: Multivariate Statistics (Carey) 8/27/98 Matrix Algebra - 1 Introduction to Matrix Algebra Definitions: A matrix is a collection of numbers ordered by rows and columns. It is customary
Association Between Variables
 Contents 11 Association Between Variables 767 11.1 Introduction............................ 767 11.1.1 Measure of Association................. 768 11.1.2 Chapter Summary.................... 769 11.2 Chi
Using Principal Components Analysis in Program Evaluation: Some Practical Considerations
 http://evaluation.wmich.edu/jmde/ Articles Using Principal Components Analysis in Program Evaluation: Some Practical Considerations J. Thomas Kellow Assistant Professor of Research and Statistics Mercer
Chapter Seven. Multiple regression An introduction to multiple regression Performing a multiple regression on SPSS
 Chapter Seven Multiple regression An introduction to multiple regression Performing a multiple regression on SPSS Section : An introduction to multiple regression WHAT IS MULTIPLE REGRESSION? Multiple
2. What is the general linear model to be used to model linear trend? (Write out the model) = + + + or
 = + + + or") Simple and Multiple Regression Analysis Example: Explore the relationships among Month, Adv.$ and Sales $: 1. Prepare a scatter plot of these data. The scatter plots for Adv.$ versus Sales, and Month versus
Simple and Multiple Regression Analysis Example: Explore the relationships among Month, Adv.$ and Sales $: 1. Prepare a scatter plot of these data. The scatter plots for Adv.$ versus Sales, and Month versus
Summary of Formulas and Concepts. Descriptive Statistics (Ch. 1-4)
") Summary of Formulas and Concepts Descriptive Statistics (Ch. 1-4) Definitions Population: The complete set of numerical information on a particular quantity in which an investigator is interested. We assume
Summary of Formulas and Concepts Descriptive Statistics (Ch. 1-4) Definitions Population: The complete set of numerical information on a particular quantity in which an investigator is interested. We assume
Multiple Regression: What Is It?
 Multiple Regression Multiple Regression: What Is It? Multiple regression is a collection of techniques in which there are multiple predictors of varying kinds and a single outcome We are interested in
Part 2: Analysis of Relationship Between Two Variables
 Part 2: Analysis of Relationship Between Two Variables Linear Regression Linear correlation Significance Tests Multiple regression Linear Regression Y = a X + b Dependent Variable Independent Variable
Chapter 5 Analysis of variance SPSS Analysis of variance
 Chapter 5 Analysis of variance SPSS Analysis of variance Data file used: gss.sav How to get there: Analyze Compare Means One-way ANOVA To test the null hypothesis that several population means are equal,
Statistical Machine Learning
 Statistical Machine Learning UoC Stats 37700, Winter quarter Lecture 4: classical linear and quadratic discriminants. 1 / 25 Linear separation For two classes in R d : simple idea: separate the classes
9.2 User s Guide SAS/STAT. The FACTOR Procedure. (Book Excerpt) SAS Documentation
 SAS Documentation") SAS/STAT 9.2 User s Guide The FACTOR Procedure (Book Excerpt) SAS Documentation This document is an individual chapter from SAS/STAT 9.2 User s Guide. The correct bibliographic citation for the complete
SAS/STAT 9.2 User s Guide The FACTOR Procedure (Book Excerpt) SAS Documentation This document is an individual chapter from SAS/STAT 9.2 User s Guide. The correct bibliographic citation for the complete
Additional sources Compilation of sources: http://lrs.ed.uiuc.edu/tseportal/datacollectionmethodologies/jin-tselink/tselink.htm
 Mgt 540 Research Methods Data Analysis 1 Additional sources Compilation of sources: http://lrs.ed.uiuc.edu/tseportal/datacollectionmethodologies/jin-tselink/tselink.htm http://web.utk.edu/~dap/random/order/start.htm
Multivariate Analysis of Variance (MANOVA)
") Chapter 415 Multivariate Analysis of Variance (MANOVA) Introduction Multivariate analysis of variance (MANOVA) is an extension of common analysis of variance (ANOVA). In ANOVA, differences among various
Chapter 415 Multivariate Analysis of Variance (MANOVA) Introduction Multivariate analysis of variance (MANOVA) is an extension of common analysis of variance (ANOVA). In ANOVA, differences among various
CALCULATIONS & STATISTICS
 CALCULATIONS & STATISTICS CALCULATION OF SCORES Conversion of 1-5 scale to 0-100 scores When you look at your report, you will notice that the scores are reported on a 0-100 scale, even though respondents
Dimensionality Reduction: Principal Components Analysis
 Dimensionality Reduction: Principal Components Analysis In data mining one often encounters situations where there are a large number of variables in the database. In such situations it is very likely
DEPARTMENT OF PSYCHOLOGY UNIVERSITY OF LANCASTER MSC IN PSYCHOLOGICAL RESEARCH METHODS ANALYSING AND INTERPRETING DATA 2 PART 1 WEEK 9
 DEPARTMENT OF PSYCHOLOGY UNIVERSITY OF LANCASTER MSC IN PSYCHOLOGICAL RESEARCH METHODS ANALYSING AND INTERPRETING DATA 2 PART 1 WEEK 9 Analysis of covariance and multiple regression So far in this course,
A Brief Introduction to Factor Analysis
 1. Introduction A Brief Introduction to Factor Analysis Factor analysis attempts to represent a set of observed variables X 1, X 2. X n in terms of a number of 'common' factors plus a factor which is unique
1. What is the critical value for this 95% confidence interval? CV = z.025 = invnorm(0.025) = 1.96
 = 1.96") 1 Final Review 2 Review 2.1 CI 1-propZint Scenario 1 A TV manufacturer claims in its warranty brochure that in the past not more than 10 percent of its TV sets needed any repair during the first two years
1 Final Review 2 Review 2.1 CI 1-propZint Scenario 1 A TV manufacturer claims in its warranty brochure that in the past not more than 10 percent of its TV sets needed any repair during the first two years
How to Get More Value from Your Survey Data
 Technical report How to Get More Value from Your Survey Data Discover four advanced analysis techniques that make survey research more effective Table of contents Introduction..............................................................2
CHAPTER-III CUSTOMER RELATIONSHIP MANAGEMENT (CRM) AT COMMERCIAL BANKS. performance of the commercial banks. The implementation of the CRM consists
 AT COMMERCIAL BANKS. performance of the commercial banks. The implementation of the CRM consists") 71 CHAPTER-III CUSTOMER RELATIONSHIP MANAGEMENT (CRM) AT COMMERCIAL BANKS The implementation of the CRM is essential to establish a better performance of the commercial banks. The implementation of the
71 CHAPTER-III CUSTOMER RELATIONSHIP MANAGEMENT (CRM) AT COMMERCIAL BANKS The implementation of the CRM is essential to establish a better performance of the commercial banks. The implementation of the
Part III. Item-Level Analysis
 Part III Item-Level Analysis 6241-029-P3-006-2pass-r02.indd 169 1/16/2013 9:14:56 PM 6241-029-P3-006-2pass-r02.indd 170 1/16/2013 9:14:57 PM 6 Exploratory and Confirmatory Factor Analysis Rex Kline 6.1
Lecture Notes Module 1
 Lecture Notes Module 1 Study Populations A study population is a clearly defined collection of people, animals, plants, or objects. In psychological research, a study population usually consists of a specific
Factor Analysis - 2 nd TUTORIAL
 Factor Analysis - 2 nd TUTORIAL Subject marks File sub_marks.csv shows correlation coefficients between subject scores for a sample of 220 boys. sub_marks
Introduction to Analysis of Variance (ANOVA) Limitations of the t-test
 Limitations of the t-test") Introduction to Analysis of Variance (ANOVA) The Structural Model, The Summary Table, and the One- Way ANOVA Limitations of the t-test Although the t-test is commonly used, it has limitations Can only
Introduction to Analysis of Variance (ANOVA) The Structural Model, The Summary Table, and the One- Way ANOVA Limitations of the t-test Although the t-test is commonly used, it has limitations Can only
THE USING FACTOR ANALYSIS METHOD IN PREDICTION OF BUSINESS FAILURE
 THE USING FACTOR ANALYSIS METHOD IN PREDICTION OF BUSINESS FAILURE Mary Violeta Petrescu Ph. D University of Craiova Faculty of Economics and Business Administration Craiova, Romania Abstract: : After
How To Run Factor Analysis
 Getting Started in Factor Analysis (using Stata 10) (ver. 1.5) Oscar Torres-Reyna Data Consultant [email protected] http://dss.princeton.edu/training/ Factor analysis is used mostly for data reduction
Statistical tests for SPSS
 Statistical tests for SPSS Paolo Coletti A.Y. 2010/11 Free University of Bolzano Bozen Premise This book is a very quick, rough and fast description of statistical tests and their usage. It is explicitly
Data Analysis Tools. Tools for Summarizing Data
 Data Analysis Tools This section of the notes is meant to introduce you to many of the tools that are provided by Excel under the Tools/Data Analysis menu item. If your computer does not have that tool
The Effect of Macroeconomic Factors on Indian Stock Market Performance: A Factor Analysis Approach
 IOSR Journal of Economics and Finance (IOSR-JEF) e-issn: 2321-5933, p-issn: 2321-5925. Volume 1, Issue 3 (Sep. Oct. 2013), PP 14-21 The Effect of Macroeconomic Factors on Indian Stock Market Performance:
Vector and Matrix Norms
 Chapter 1 Vector and Matrix Norms 11 Vector Spaces Let F be a field (such as the real numbers, R, or complex numbers, C) with elements called scalars A Vector Space, V, over the field F is a non-empty
Factors affecting teaching and learning of computer disciplines at. Rajamangala University of Technology
 December 2010, Volume 7, No.12 (Serial No.73) US-China Education Review, ISSN 1548-6613, USA Factors affecting teaching and learning of computer disciplines at Rajamangala University of Technology Rungaroon
Linear smoother. ŷ = S y. where s ij = s ij (x) e.g. s ij = diag(l i (x)) To go the other way, you need to diagonalize S
 e.g. s ij = diag(l i (x)) To go the other way, you need to diagonalize S") Linear smoother ŷ = S y where s ij = s ij (x) e.g. s ij = diag(l i (x)) To go the other way, you need to diagonalize S 2 Online Learning: LMS and Perceptrons Partially adapted from slides by Ryan Gabbard
Linear smoother ŷ = S y where s ij = s ij (x) e.g. s ij = diag(l i (x)) To go the other way, you need to diagonalize S 2 Online Learning: LMS and Perceptrons Partially adapted from slides by Ryan Gabbard
Module 3: Correlation and Covariance
 Using Statistical Data to Make Decisions Module 3: Correlation and Covariance Tom Ilvento Dr. Mugdim Pašiƒ University of Delaware Sarajevo Graduate School of Business O ften our interest in data analysis
CORRELATIONAL ANALYSIS: PEARSON S r Purpose of correlational analysis The purpose of performing a correlational analysis: To discover whether there
 CORRELATIONAL ANALYSIS: PEARSON S r Purpose of correlational analysis The purpose of performing a correlational analysis: To discover whether there is a relationship between variables, To find out the
UNDERSTANDING THE TWO-WAY ANOVA
 UNDERSTANDING THE e have seen how the one-way ANOVA can be used to compare two or more sample means in studies involving a single independent variable. This can be extended to two independent variables
Example: Boats and Manatees
 Figure 9-6 Example: Boats and Manatees Slide 1 Given the sample data in Table 9-1, find the value of the linear correlation coefficient r, then refer to Table A-6 to determine whether there is a significant
DISCRIMINANT FUNCTION ANALYSIS (DA)
") DISCRIMINANT FUNCTION ANALYSIS (DA) John Poulsen and Aaron French Key words: assumptions, further reading, computations, standardized coefficents, structure matrix, tests of signficance Introduction Discriminant
DISCRIMINANT FUNCTION ANALYSIS (DA) John Poulsen and Aaron French Key words: assumptions, further reading, computations, standardized coefficents, structure matrix, tests of signficance Introduction Discriminant