MISSING DATA TECHNIQUES WITH SAS. IDRE Statistical Consulting Group
|
|
|
- Ralph Dickerson
- 8 years ago
- Views:
Transcription
1 MISSING DATA TECHNIQUES WITH SAS IDRE Statistical Consulting Group

2 ROAD MAP FOR TODAY To discuss: 1. Commonly used techniques for handling missing data, focusing on multiple imputation 2. Issues that could arise when these techniques are used 3. Implementation of SAS Proc MI procedure Assuming MVN Assuming FCS 4. Imputation Diagnostics

3 GOALS OF STATISTICAL ANALYSIS WITH MISSING DATA Minimize bias Maximize use of available information Obtain appropriate estimates of uncertainty

4 THE MISSING DATA MECHANISM DESCRIBES THE PROCESS THAT IS BELIEVED TO HAVE GENERATED THE MISSING VALUES. 1. Missing completely at random (MCAR) Neither the unobserved values of the variable with missing nor the other variables in the dataset predict whether a value will be missing. Example: Planned missingness 2. Missing at random (MAR) Other variables (but not the variable with missing itself) in the dataset can be used to predict missingness. Example: Men may be more likely to decline to answer some questions than women 3. Missing not at random (MNAR) The unobserved value of the variable with missing predicts missingness. Example: Individuals with very high incomes are more likely to decline to answer questions about their own income
 The unobserved value of the variable with missing predicts missingness.")
5 OUR DATA High School and Beyond N= Variables Student Demographics and Achievement including test scores

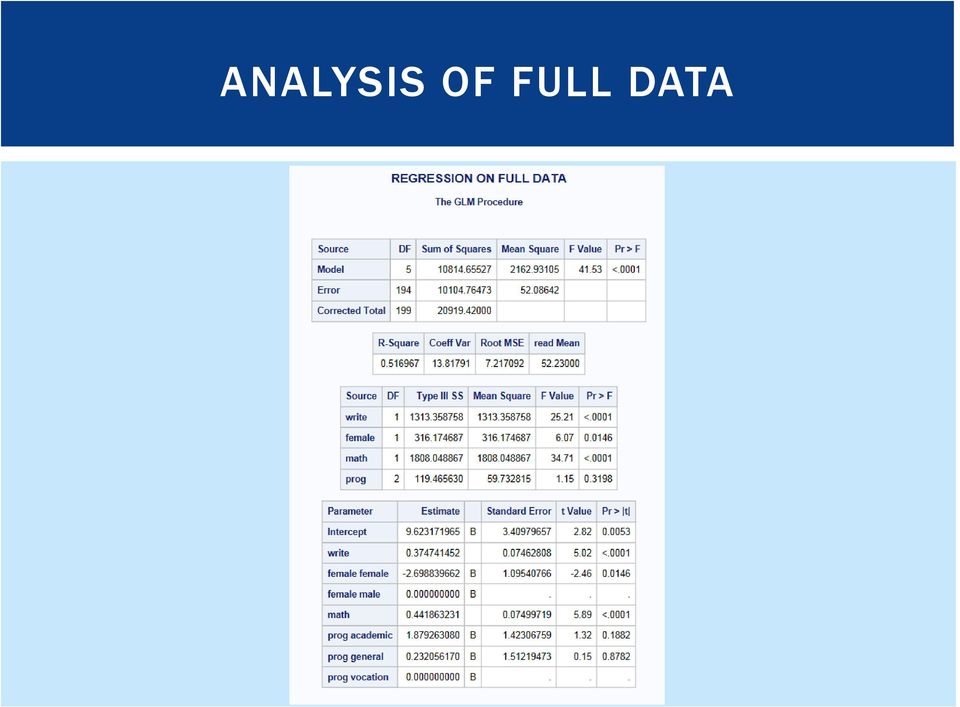
6 ANALYSIS OF FULL DATA
7 COMMON TECHNIQUES FOR DEALING WITH MISSING DATA 1. Complete case analysis (listwise deletion) 2. Mean Imputation 3. Single Imputation 4. Stochastic Imputation
 2. Mean Imputation 3.")
8 Method: Drop cases with missing data on any variable of interest Appeal: Nothing to implement default method Drawbacks: COMPLETE CASE ANALYSIS (LISTWISE DELETION) Loss of cases/data Biased estimates unless MCAR
 Loss of cases/data Biased estimates unless")

9 COMPLETE CASE ANALYSIS (LISTWISE DELETION) proc means data = ats.hsb_mar nmiss N min max mean std; var _numeric_ ; run;


10 LISTWISE DELETION ANALYSIS DROPS OBSERVATIONS WITH MISSING VALUES

11 UNCONDITIONAL MEAN IMPUTATION Method: Replace missing values for a variable with its overall estimated mean Appeal: Simple and easily implemented Drawbacks: Artificial reduction in variability b/c imputing values at the mean. Changes the magnitude of correlations between the imputed variables and other variables.


12 MEAN, SD AND CORRELATION MATRIX OF 5 VARIABLES BEFORE & AFTER MEAN IMPUTATION

13 SINGLE OR DETERMINISTIC (REGRESSION) IMPUTATION Method: Replace missing values with predicted scores from a regression equation. Appeal: Uses complete information to impute values. Drawback: All predicted values fall directly on the regression line, decreasing variability. Also known as regression imputation

14 SINGLE OR DETERMINISTIC (REGRESSION) IMPUTATION p.46, Applied Missing Data Analysis, Craig Enders (2010)

15 SINGLE OR DETERMINISTIC (REGRESSION) IMPUTATION Imputing values directly on the regression line: Underestimates uncertainty Inflates associations between variables because it imputes perfectly correlated values Upwardly biases R-squared statistics, even under the assumption of MCAR

16 STOCHASTIC IMPUTATION Stochastic imputation addresses these problems with regression imputation by incorporating or "adding back" lost variability. Method: Add randomly drawn residual to imputed value from regression imputation. Distribution of residuals based on residual variance from regression model.

17 STOCHASTIC IMPUTATION p.48, Applied Missing Data Analysis, Craig Enders (2010)

18 STOCHASTIC IMPUTATION Appeals: Restores some lost variability. Superior to the previous methods as it will produce unbiased coefficient estimates under MAR. Drawback: SE s produced during stochastic estimation, while less biased, will still be attenuated.

19 WHAT IS MULTIPLE IMPUTATION? Iterative form of stochastic imputation. Multiple values are imputed rather than a single value to reflect the uncertainty around the true value. Each imputed value includes a random component whose magnitude reflects the extent to which other variables in the model cannot predict it's true value Common misconception: imputed values should represent "real" values. Purpose: To correctly reproduce the full data variance/covariance matrix

20 ISN'T MULTIPLE IMPUTATION JUST MAKING UP DATA? No. This is argument applies to single imputation methods MI analysis methods account for the uncertainty/error associated with the imputed values. Estimated parameters never depend on a single value.

21 THREE PHASES 1. Imputation or Fill-in Phase: Missing values are imputed, forming a complete data set. This process is repeated m times. 2. Analysis Phase: Each of the m complete data sets is then analyzed using a statistical model (e.g linear regression). 3. Pooling Phase: The parameter estimates (e.g. coefficients and standard errors) obtained from each analyzed data set are then combined for inference.
22 THE IMPORTANCE OF BEING COMPATIBLE The imputation model should be "congenial to or consistent with your analytic model: Includes, at the very least, the same variables as the analytic model. Includes any transformations to variables in the analytic model E.g. logarithmic and squaring transformations, interaction terms All relationships between variables should be represented and estimated simultaneously. Otherwise, you are imputing values assuming they are uncorrelated with the variables you did not include.
23 PREPARING FOR MULTIPLE IMPUTATION 1. Examine the number and proportion of missing values among your variables of interest. 2. Examine Missing Data Patterns among your variables of interest. 3. If necessary, identify potential auxiliary variables 4. Determine imputation method

24 EXAMINE MISSING VALUES: PROC MEANS NMISS OPTION

25 EXAMINE MISSING VALUES: NOTE VARIABLE(S ) WITH HIGH PROPORTION OF MISSING -- THEY WILL IMPACT MODEL CONVERGENCE THE MOST
26 EXAMINE MISSING DATA PATTERNS: SYNTAX proc mi data=hsb_mar nimpute=0 ; var write read female math prog ; ods select misspattern; run;

27 EXAMINE MISSING DATA PATTERNS
28 IDENTIFY POTENTIAL AUXILIARY VARIABLES Characteristics: Correlated with missing variable (rule of thumb: r> 0.4) Predictor of missingness Not of analytic interest, so only used in imputation model Why? Including auxiliary variables in the imputation model can: Improve the quality of imputed values Increase power, especially with high fraction of missing information (FMI >25%) Be especially important when imputing DV Increase plausibility of MAR
29 HOW DO YOU IDENTIFY AUXILIARY VARIABLES? A priori knowledge Previous literature Identify associations in data
30 AUXILIARY VARIABLES ARE CORRELATED WITH MISSING VARIABLE

31 AUXILIARY VARIABLES ARE PREDICTORS OF MISSINGNESS
32 IMPUTATION MODEL EXAMPLE 1: MI USING MULTIVARIATE NORMAL DISTRIBUTION (MVN)
33 ASSUMING A JOINT MULTIVARIATE NORMAL DISTRIBUTION Probably the most common parametric approach for multiple imputation. Assumes variables are individually and jointly normally distributed Assuming a MVN distribution is robust to violations of normality given a large enough N. Uses the data augmentation (DA) algorithm to impute. Biased estimates may result when N is relatively small and the fraction of missing information is high.
34 IMPUTATION PHASE proc mi data= new nimpute=10 out=mi_mvn seed=54321; var socst science write read female math progcat1 progcat2 ; run;

35 MULTIPLY IMPUTED DATASET
36 ANALYSIS PHASE: ESTIMATE MODEL FOR EACH IMPUTED DATASET proc glm data = mi_mvn ; model read = write female math progcat1 progcat2; by _imputation_; ods output ParameterEstimates=a_mvn; run; quit;

37 PARAMETER ESTIMATE DATASET
38 proc mianalyze parms=a_mvn; modeleffects intercept write female math run; POOLING PHASE- COMBINING PARAMETER ESTIMATES ACROSS DATASETS progcat1 progcat2;

39

40 COMPARE MIANALYZE ESTIMATES TO ANALYSIS WITH FULL DATA FULL DATA ANALYSIS MIANALYZE OUPUT
41 HOW DOES PROC MIANALYZE WORK PROC MIANALYZE combines results across imputations Regression coefficients are averaged across imputations Standard errors incorporate uncertainty from 2 sources: "within imputation" - variability in estimate expected with no missing data The usual uncertainty regarding a regression coefficient "between imputation" - variability due to missing information. The uncertainty surrounding missing values
42 OUTPUT FROM MIANALYZE
43 VARIANCE WITHIN Sampling variability expected with no missing data. Average of variability of coefficients within an imputation Equal to arithmetic mean of sampling variances (SE 2 ) Example: Add together 10 estimated SE 2 for write and divide by 10 V w =
44 VARIANCE BETWEEN Variability in estimates across imputations i.e. the variance of the m coefficients Estimates the additional variation (uncertainty) that results from missing data. Example: take all 10 of the parameter estimates (β) for write and calculate the variance V B =
45 TOTAL VARIANCE The total variance is sum of 3 sources of variance. Within, Between Additional source of sampling variance. What is the sampling variance? Variance Between divided by number of imputations Represents sampling error associated with the overall coefficient estimates. Serves as a correction factor for using a specific number of imputations.
46 DEGREES OF FREEDOM DF for combined results are determined by the number of imputations. *By default DF = infinity, typically not a problem with large N but can be with smaller samples The standard formula to estimate DF can yield estimates that are fractional or that far exceed the DF for complete data. Correction to adjust for the problem of inflated DF has been implemented Use the EDF option on the proc mianalyze line to indicate to SAS what is the proper adjusted DF.
47 RELATIVE INCREASES IN VARIANCE (RVI) Proportional increase in total sampling variance due to missing information [V B + V B /m] V w For example, the RVI for write coefficient is 0.048, meaning that the sampling variance is 4.8% larger than it would have been with complete data.
48 FRACTION OF MISSING INFORMATION (FMI) Directly related to RVI. Proportion of total sampling variance that is due to missing data [V B + V B /m] V T For a given variable, FMI based on percentage missing and correlations with other imputation model variables. Interpretation similar to an R 2. Example: FMI=.046 for write means that 4.6% of sampling variance is attributable to missing data.

49 RELATIVE EFFICIENCY: IS 5 IMPUTATIONS ENOUGH? Captures how well true population parameters are estimated Related to both the FMI and m Low FMI + few m = high efficiency As FMI increase so should m: Better statistical power and more stable estimate
50 DIAGN0STICS: HOW DO I KNOW IF IT WORKED? Compare means and frequencies of observed and imputed values. Use boxplots to compare distributions Look at Variance Information tables from the proc mianalyze output Plots - Assess convergence of DA algorithm
51 TRACE PLOTS: DID MY IMPUTATION MODEL CONVERGE? Convergence for each imputed variable can be assessed using trace plots. Examine for each imputed variables Special attention to variables with a high FMI proc mi data= ats.hsb_mar nimpute=10 out=mi_mvn; mcmc plots=trace plots=acf ; var socst write read female math; run;

52
53 EXAMPLE OF A POOR TRACE PLOT
54 AUTOCORRELATION PLOTS: DID MY IMPUTATION MODEL CONVERGE? Assess possible auto correlation of parameter values between iterations. Assess the magnitude of the observed dependency of imputed values across iterations. proc mi data= ats.hsb_mar nimpute=10 out=mi_mvn; mcmc plots=trace plots=acf ; var socst write read female math; run;
55
56 IMPUTATION MODEL EXAMPLE 2: MI USING FULLY CONDITIONAL SPECIFICATION (FCS)
57 WHAT IF I DON T WANT TO ASSUME A MULTIVARIATE NORMAL DISTRIBUTION? Alternative method for imputation is Fully Conditional Method (FCS) FCS does not assume a joint distribution and allows the use of different distributions across variables. Each variable with missing is allowed its own type of regression (linear, logistic, etc) for imputation Example uses: Logistic model for binary outcome Poisson model for count variable Other bounded values
58 AVAILABLE DISTRIBUTIONS FCS methods available: Discriminant function or logistic regression for binary/categorical variables Linear regression and predictive mean matching for continuous variables. Properties to Note: 1. Discriminant function only continuous vars as covariates (default). 2. Logistic regression assumes ordering of class variables if more then two levels (default). 3. Regression is default imputation method for continuous vars. 4. PMM will provide plausible values. 1. For an observation missing on X, finds cases in data with similar values on other covariates, then randomly selects an X value from those cases
59 IMPUTATION PHASE proc mi data= ats.hsb_mar nimpute=20 out=mi_fcs ; class female prog; fcs plots=trace(mean std); var socst write read female math science prog; fcs discrim(female prog /classeffects=include) nbiter =100 ; run;
60 ALTERNATE EXAMPLE proc mi data= ats.hsb_mar nimpute=20 out=mi_new1; class female prog; var socst write read female math science prog; fcs logistic (female= socst science) ; fcs logistic (prog =math socst /link=glogit) regpmm(math read write); run;
61 ANALYSIS PHASE: ESTIMATE GLM MODEL USING EACH IMPUTED DATASET proc genmod data=mi_fcs; class female prog; model read=write female math prog/dist=normal; by _imputation_; ods output ParameterEstimates=gm_fcs; run;

62
63 POOLING PHASE- COMBINING PARAMETER ESTIMATES ACROSS DATASETS PROC MIANALYZE parms(classvar=level)=gm_fcs; class female prog; MODELEFFECTS INTERCEPT write female math prog; RUN;
64 TRACE PLOTS: DID MY IMPUTATION MODEL CONVERGE?
65 FCS HAS SEVERAL PROPERTIES THAT MAKE IT AN ATTRACTIVE ALTERNATIVE 1. FCS allows each variable to be imputed using its own conditional distribution 2. Different imputation models can be specified for different variables. However, this can also cause estimation problems. Beware: Convergence Issues such as complete and quasi-complete separation (e.g. zero cells) when imputing categorical variables.
66 BOTTOM LINE MI improves over single imputation methods because: Single value never used Appropriate estimates of uncertainty The nature of your data and model will determine if you choose MVN or FCS Both are state of the art methods for handling missing data Produce unbiased estimates assuming MAR
Imputing Missing Data using SAS
 ABSTRACT Paper 3295-2015 Imputing Missing Data using SAS Christopher Yim, California Polytechnic State University, San Luis Obispo Missing data is an unfortunate reality of statistics. However, there are
Missing Data: Part 1 What to Do? Carol B. Thompson Johns Hopkins Biostatistics Center SON Brown Bag 3/20/13
 Missing Data: Part 1 What to Do? Carol B. Thompson Johns Hopkins Biostatistics Center SON Brown Bag 3/20/13 Overview Missingness and impact on statistical analysis Missing data assumptions/mechanisms Conventional
2. Making example missing-value datasets: MCAR, MAR, and MNAR
 Lecture 20 1. Types of missing values 2. Making example missing-value datasets: MCAR, MAR, and MNAR 3. Common methods for missing data 4. Compare results on example MCAR, MAR, MNAR data 1 Missing Data
A Basic Introduction to Missing Data
 John Fox Sociology 740 Winter 2014 Outline Why Missing Data Arise Why Missing Data Arise Global or unit non-response. In a survey, certain respondents may be unreachable or may refuse to participate. Item
APPLIED MISSING DATA ANALYSIS
 APPLIED MISSING DATA ANALYSIS Craig K. Enders Series Editor's Note by Todd D. little THE GUILFORD PRESS New York London Contents 1 An Introduction to Missing Data 1 1.1 Introduction 1 1.2 Chapter Overview
Problem of Missing Data
 VASA Mission of VA Statisticians Association (VASA) Promote & disseminate statistical methodological research relevant to VA studies; Facilitate communication & collaboration among VA-affiliated statisticians;
Handling missing data in Stata a whirlwind tour
 Handling missing data in Stata a whirlwind tour 2012 Italian Stata Users Group Meeting Jonathan Bartlett www.missingdata.org.uk 20th September 2012 1/55 Outline The problem of missing data and a principled
Analyzing Structural Equation Models With Missing Data
 Analyzing Structural Equation Models With Missing Data Craig Enders* Arizona State University cenders@asu.edu based on Enders, C. K. (006). Analyzing structural equation models with missing data. In G.
IBM SPSS Missing Values 22
 IBM SPSS Missing Values 22 Note Before using this information and the product it supports, read the information in Notices on page 23. Product Information This edition applies to version 22, release 0,
Multiple Imputation for Missing Data: A Cautionary Tale
 Multiple Imputation for Missing Data: A Cautionary Tale Paul D. Allison University of Pennsylvania Address correspondence to Paul D. Allison, Sociology Department, University of Pennsylvania, 3718 Locust
Sensitivity Analysis in Multiple Imputation for Missing Data
 Paper SAS270-2014 Sensitivity Analysis in Multiple Imputation for Missing Data Yang Yuan, SAS Institute Inc. ABSTRACT Multiple imputation, a popular strategy for dealing with missing values, usually assumes
Missing Data & How to Deal: An overview of missing data. Melissa Humphries Population Research Center
 Missing Data & How to Deal: An overview of missing data Melissa Humphries Population Research Center Goals Discuss ways to evaluate and understand missing data Discuss common missing data methods Know
Dealing with Missing Data
 Res. Lett. Inf. Math. Sci. (2002) 3, 153-160 Available online at http://www.massey.ac.nz/~wwiims/research/letters/ Dealing with Missing Data Judi Scheffer I.I.M.S. Quad A, Massey University, P.O. Box 102904
Review of the Methods for Handling Missing Data in. Longitudinal Data Analysis
 Int. Journal of Math. Analysis, Vol. 5, 2011, no. 1, 1-13 Review of the Methods for Handling Missing Data in Longitudinal Data Analysis Michikazu Nakai and Weiming Ke Department of Mathematics and Statistics
Missing Data. Paul D. Allison INTRODUCTION
 4 Missing Data Paul D. Allison INTRODUCTION Missing data are ubiquitous in psychological research. By missing data, I mean data that are missing for some (but not all) variables and for some (but not all)
A Primer on Mathematical Statistics and Univariate Distributions; The Normal Distribution; The GLM with the Normal Distribution
 A Primer on Mathematical Statistics and Univariate Distributions; The Normal Distribution; The GLM with the Normal Distribution PSYC 943 (930): Fundamentals of Multivariate Modeling Lecture 4: September
Missing Data. Katyn & Elena
 Missing Data Katyn & Elena What to do with Missing Data Standard is complete case analysis/listwise dele;on ie. Delete cases with missing data so only complete cases are le> Two other popular op;ons: Mul;ple
IBM SPSS Missing Values 20
 IBM SPSS Missing Values 20 Note: Before using this information and the product it supports, read the general information under Notices on p. 87. This edition applies to IBM SPSS Statistics 20 and to all
Handling attrition and non-response in longitudinal data
 Longitudinal and Life Course Studies 2009 Volume 1 Issue 1 Pp 63-72 Handling attrition and non-response in longitudinal data Harvey Goldstein University of Bristol Correspondence. Professor H. Goldstein
Handling missing data in large data sets. Agostino Di Ciaccio Dept. of Statistics University of Rome La Sapienza
 Handling missing data in large data sets Agostino Di Ciaccio Dept. of Statistics University of Rome La Sapienza The problem Often in official statistics we have large data sets with many variables and
NCSS Statistical Software Principal Components Regression. In ordinary least squares, the regression coefficients are estimated using the formula ( )
") Chapter 340 Principal Components Regression Introduction is a technique for analyzing multiple regression data that suffer from multicollinearity. When multicollinearity occurs, least squares estimates
Chapter 340 Principal Components Regression Introduction is a technique for analyzing multiple regression data that suffer from multicollinearity. When multicollinearity occurs, least squares estimates
Challenges in Longitudinal Data Analysis: Baseline Adjustment, Missing Data, and Drop-out
 Challenges in Longitudinal Data Analysis: Baseline Adjustment, Missing Data, and Drop-out Sandra Taylor, Ph.D. IDDRC BBRD Core 23 April 2014 Objectives Baseline Adjustment Introduce approaches Guidance
A REVIEW OF CURRENT SOFTWARE FOR HANDLING MISSING DATA
 123 Kwantitatieve Methoden (1999), 62, 123-138. A REVIEW OF CURRENT SOFTWARE FOR HANDLING MISSING DATA Joop J. Hox 1 ABSTRACT. When we deal with a large data set with missing data, we have to undertake
HYPOTHESIS TESTING: CONFIDENCE INTERVALS, T-TESTS, ANOVAS, AND REGRESSION
 HYPOTHESIS TESTING: CONFIDENCE INTERVALS, T-TESTS, ANOVAS, AND REGRESSION HOD 2990 10 November 2010 Lecture Background This is a lightning speed summary of introductory statistical methods for senior undergraduate
Additional sources Compilation of sources: http://lrs.ed.uiuc.edu/tseportal/datacollectionmethodologies/jin-tselink/tselink.htm
 Mgt 540 Research Methods Data Analysis 1 Additional sources Compilation of sources: http://lrs.ed.uiuc.edu/tseportal/datacollectionmethodologies/jin-tselink/tselink.htm http://web.utk.edu/~dap/random/order/start.htm
SAS Software to Fit the Generalized Linear Model
 SAS Software to Fit the Generalized Linear Model Gordon Johnston, SAS Institute Inc., Cary, NC Abstract In recent years, the class of generalized linear models has gained popularity as a statistical modeling
Regression III: Advanced Methods
 Lecture 16: Generalized Additive Models Regression III: Advanced Methods Bill Jacoby Michigan State University http://polisci.msu.edu/jacoby/icpsr/regress3 Goals of the Lecture Introduce Additive Models
SPSS TRAINING SESSION 3 ADVANCED TOPICS (PASW STATISTICS 17.0) Sun Li Centre for Academic Computing lsun@smu.edu.sg
 Sun Li Centre for Academic Computing lsun@smu.edu.sg") SPSS TRAINING SESSION 3 ADVANCED TOPICS (PASW STATISTICS 17.0) Sun Li Centre for Academic Computing lsun@smu.edu.sg IN SPSS SESSION 2, WE HAVE LEARNT: Elementary Data Analysis Group Comparison & One-way
SPSS TRAINING SESSION 3 ADVANCED TOPICS (PASW STATISTICS 17.0) Sun Li Centre for Academic Computing lsun@smu.edu.sg IN SPSS SESSION 2, WE HAVE LEARNT: Elementary Data Analysis Group Comparison & One-way
5. Linear Regression
 5. Linear Regression Outline.................................................................... 2 Simple linear regression 3 Linear model............................................................. 4
Missing Data Techniques for Structural Equation Modeling
 Journal of Abnormal Psychology Copyright 2003 by the American Psychological Association, Inc. 2003, Vol. 112, No. 4, 545 557 0021-843X/03/$12.00 DOI: 10.1037/0021-843X.112.4.545 Missing Data Techniques
Auxiliary Variables in Mixture Modeling: 3-Step Approaches Using Mplus
 Auxiliary Variables in Mixture Modeling: 3-Step Approaches Using Mplus Tihomir Asparouhov and Bengt Muthén Mplus Web Notes: No. 15 Version 8, August 5, 2014 1 Abstract This paper discusses alternatives
11. Analysis of Case-control Studies Logistic Regression
 Research methods II 113 11. Analysis of Case-control Studies Logistic Regression This chapter builds upon and further develops the concepts and strategies described in Ch.6 of Mother and Child Health:
Moderation. Moderation
 Stats - Moderation Moderation A moderator is a variable that specifies conditions under which a given predictor is related to an outcome. The moderator explains when a DV and IV are related. Moderation
Missing Data. A Typology Of Missing Data. Missing At Random Or Not Missing At Random
 [Leeuw, Edith D. de, and Joop Hox. (2008). Missing Data. Encyclopedia of Survey Research Methods. Retrieved from http://sage-ereference.com/survey/article_n298.html] Missing Data An important indicator
Craig K. Enders Arizona State University Department of Psychology craig.enders@asu.edu
 Craig K. Enders Arizona State University Department of Psychology craig.enders@asu.edu Topic Page Missing Data Patterns And Missing Data Mechanisms 1 Traditional Missing Data Techniques 7 Maximum Likelihood
Outline. Topic 4 - Analysis of Variance Approach to Regression. Partitioning Sums of Squares. Total Sum of Squares. Partitioning sums of squares
 Topic 4 - Analysis of Variance Approach to Regression Outline Partitioning sums of squares Degrees of freedom Expected mean squares General linear test - Fall 2013 R 2 and the coefficient of correlation
Nonrandomly Missing Data in Multiple Regression Analysis: An Empirical Comparison of Ten Missing Data Treatments
 Brockmeier, Kromrey, & Hogarty Nonrandomly Missing Data in Multiple Regression Analysis: An Empirical Comparison of Ten s Lantry L. Brockmeier Jeffrey D. Kromrey Kristine Y. Hogarty Florida A & M University
Overview of Violations of the Basic Assumptions in the Classical Normal Linear Regression Model
 Overview of Violations of the Basic Assumptions in the Classical Normal Linear Regression Model 1 September 004 A. Introduction and assumptions The classical normal linear regression model can be written
Statistical modelling with missing data using multiple imputation. Session 4: Sensitivity Analysis after Multiple Imputation
 Statistical modelling with missing data using multiple imputation Session 4: Sensitivity Analysis after Multiple Imputation James Carpenter London School of Hygiene & Tropical Medicine Email: james.carpenter@lshtm.ac.uk
Example: Credit card default, we may be more interested in predicting the probabilty of a default than classifying individuals as default or not.
 Statistical Learning: Chapter 4 Classification 4.1 Introduction Supervised learning with a categorical (Qualitative) response Notation: - Feature vector X, - qualitative response Y, taking values in C
Data Mining and Data Warehousing. Henryk Maciejewski. Data Mining Predictive modelling: regression
 Data Mining and Data Warehousing Henryk Maciejewski Data Mining Predictive modelling: regression Algorithms for Predictive Modelling Contents Regression Classification Auxiliary topics: Estimation of prediction
DISCRIMINANT FUNCTION ANALYSIS (DA)
") DISCRIMINANT FUNCTION ANALYSIS (DA) John Poulsen and Aaron French Key words: assumptions, further reading, computations, standardized coefficents, structure matrix, tests of signficance Introduction Discriminant
DISCRIMINANT FUNCTION ANALYSIS (DA) John Poulsen and Aaron French Key words: assumptions, further reading, computations, standardized coefficents, structure matrix, tests of signficance Introduction Discriminant
13. Poisson Regression Analysis
 136 Poisson Regression Analysis 13. Poisson Regression Analysis We have so far considered situations where the outcome variable is numeric and Normally distributed, or binary. In clinical work one often
ECON 142 SKETCH OF SOLUTIONS FOR APPLIED EXERCISE #2
 University of California, Berkeley Prof. Ken Chay Department of Economics Fall Semester, 005 ECON 14 SKETCH OF SOLUTIONS FOR APPLIED EXERCISE # Question 1: a. Below are the scatter plots of hourly wages
Multiple Linear Regression
 Multiple Linear Regression A regression with two or more explanatory variables is called a multiple regression. Rather than modeling the mean response as a straight line, as in simple regression, it is
Data analysis process
 Data analysis process Data collection and preparation Collect data Prepare codebook Set up structure of data Enter data Screen data for errors Exploration of data Descriptive Statistics Graphs Analysis
Chapter 13 Introduction to Linear Regression and Correlation Analysis
 Chapter 3 Student Lecture Notes 3- Chapter 3 Introduction to Linear Regression and Correlation Analsis Fall 2006 Fundamentals of Business Statistics Chapter Goals To understand the methods for displaing
IAPRI Quantitative Analysis Capacity Building Series. Multiple regression analysis & interpreting results
 IAPRI Quantitative Analysis Capacity Building Series Multiple regression analysis & interpreting results How important is R-squared? R-squared Published in Agricultural Economics 0.45 Best article of the
An introduction to modern missing data analyses
 Journal of School Psychology 48 (2010) 5 37 An introduction to modern missing data analyses Amanda N. Baraldi, Craig K. Enders Arizona State University, United States Received 19 October 2009; accepted
DEPARTMENT OF PSYCHOLOGY UNIVERSITY OF LANCASTER MSC IN PSYCHOLOGICAL RESEARCH METHODS ANALYSING AND INTERPRETING DATA 2 PART 1 WEEK 9
 DEPARTMENT OF PSYCHOLOGY UNIVERSITY OF LANCASTER MSC IN PSYCHOLOGICAL RESEARCH METHODS ANALYSING AND INTERPRETING DATA 2 PART 1 WEEK 9 Analysis of covariance and multiple regression So far in this course,
2. Linear regression with multiple regressors
 2. Linear regression with multiple regressors Aim of this section: Introduction of the multiple regression model OLS estimation in multiple regression Measures-of-fit in multiple regression Assumptions
Stepwise Regression. Chapter 311. Introduction. Variable Selection Procedures. Forward (Step-Up) Selection
 Selection") Chapter 311 Introduction Often, theory and experience give only general direction as to which of a pool of candidate variables (including transformed variables) should be included in the regression model.
Chapter 311 Introduction Often, theory and experience give only general direction as to which of a pool of candidate variables (including transformed variables) should be included in the regression model.
Model Fitting in PROC GENMOD Jean G. Orelien, Analytical Sciences, Inc.
 Paper 264-26 Model Fitting in PROC GENMOD Jean G. Orelien, Analytical Sciences, Inc. Abstract: There are several procedures in the SAS System for statistical modeling. Most statisticians who use the SAS
Multiple Regression in SPSS This example shows you how to perform multiple regression. The basic command is regression : linear.
 Multiple Regression in SPSS This example shows you how to perform multiple regression. The basic command is regression : linear. In the main dialog box, input the dependent variable and several predictors.
SPSS Guide: Regression Analysis
 SPSS Guide: Regression Analysis I put this together to give you a step-by-step guide for replicating what we did in the computer lab. It should help you run the tests we covered. The best way to get familiar
EDUCATION AND VOCABULARY MULTIPLE REGRESSION IN ACTION
 EDUCATION AND VOCABULARY MULTIPLE REGRESSION IN ACTION EDUCATION AND VOCABULARY 5-10 hours of input weekly is enough to pick up a new language (Schiff & Myers, 1988). Dutch children spend 5.5 hours/day
Simple linear regression
 Simple linear regression Introduction Simple linear regression is a statistical method for obtaining a formula to predict values of one variable from another where there is a causal relationship between
MULTIPLE REGRESSION AND ISSUES IN REGRESSION ANALYSIS
 MULTIPLE REGRESSION AND ISSUES IN REGRESSION ANALYSIS MSR = Mean Regression Sum of Squares MSE = Mean Squared Error RSS = Regression Sum of Squares SSE = Sum of Squared Errors/Residuals α = Level of Significance
New SAS Procedures for Analysis of Sample Survey Data
 New SAS Procedures for Analysis of Sample Survey Data Anthony An and Donna Watts, SAS Institute Inc, Cary, NC Abstract Researchers use sample surveys to obtain information on a wide variety of issues Many
1. What is the critical value for this 95% confidence interval? CV = z.025 = invnorm(0.025) = 1.96
 = 1.96") 1 Final Review 2 Review 2.1 CI 1-propZint Scenario 1 A TV manufacturer claims in its warranty brochure that in the past not more than 10 percent of its TV sets needed any repair during the first two years
1 Final Review 2 Review 2.1 CI 1-propZint Scenario 1 A TV manufacturer claims in its warranty brochure that in the past not more than 10 percent of its TV sets needed any repair during the first two years
Introduction to Multilevel Modeling Using HLM 6. By ATS Statistical Consulting Group
 Introduction to Multilevel Modeling Using HLM 6 By ATS Statistical Consulting Group Multilevel data structure Students nested within schools Children nested within families Respondents nested within interviewers
STATISTICA Formula Guide: Logistic Regression. Table of Contents
 : Table of Contents... 1 Overview of Model... 1 Dispersion... 2 Parameterization... 3 Sigma-Restricted Model... 3 Overparameterized Model... 4 Reference Coding... 4 Model Summary (Summary Tab)... 5 Summary
Basic Statistical and Modeling Procedures Using SAS
 Basic Statistical and Modeling Procedures Using SAS One-Sample Tests The statistical procedures illustrated in this handout use two datasets. The first, Pulse, has information collected in a classroom
MULTIPLE REGRESSION WITH CATEGORICAL DATA
 DEPARTMENT OF POLITICAL SCIENCE AND INTERNATIONAL RELATIONS Posc/Uapp 86 MULTIPLE REGRESSION WITH CATEGORICAL DATA I. AGENDA: A. Multiple regression with categorical variables. Coding schemes. Interpreting
Implementation of Pattern-Mixture Models Using Standard SAS/STAT Procedures
 PharmaSUG2011 - Paper SP04 Implementation of Pattern-Mixture Models Using Standard SAS/STAT Procedures Bohdana Ratitch, Quintiles, Montreal, Quebec, Canada Michael O Kelly, Quintiles, Dublin, Ireland ABSTRACT
Comparison of Imputation Methods in the Survey of Income and Program Participation
 Comparison of Imputation Methods in the Survey of Income and Program Participation Sarah McMillan U.S. Census Bureau, 4600 Silver Hill Rd, Washington, DC 20233 Any views expressed are those of the author
Logistic Regression (a type of Generalized Linear Model)
") Logistic Regression (a type of Generalized Linear Model) 1/36 Today Review of GLMs Logistic Regression 2/36 How do we find patterns in data? We begin with a model of how the world works We use our knowledge
Logistic Regression (a type of Generalized Linear Model) 1/36 Today Review of GLMs Logistic Regression 2/36 How do we find patterns in data? We begin with a model of how the world works We use our knowledge
Logistic Regression (1/24/13)
") STA63/CBB540: Statistical methods in computational biology Logistic Regression (/24/3) Lecturer: Barbara Engelhardt Scribe: Dinesh Manandhar Introduction Logistic regression is model for regression used
STA63/CBB540: Statistical methods in computational biology Logistic Regression (/24/3) Lecturer: Barbara Engelhardt Scribe: Dinesh Manandhar Introduction Logistic regression is model for regression used
Multivariate Logistic Regression
 1 Multivariate Logistic Regression As in univariate logistic regression, let π(x) represent the probability of an event that depends on p covariates or independent variables. Then, using an inv.logit formulation
Multiple Linear Regression in Data Mining
 Multiple Linear Regression in Data Mining Contents 2.1. A Review of Multiple Linear Regression 2.2. Illustration of the Regression Process 2.3. Subset Selection in Linear Regression 1 2 Chap. 2 Multiple
Data Cleaning and Missing Data Analysis
 Data Cleaning and Missing Data Analysis Dan Merson vagabond@psu.edu India McHale imm120@psu.edu April 13, 2010 Overview Introduction to SACS What do we mean by Data Cleaning and why do we do it? The SACS
1/27/2013. PSY 512: Advanced Statistics for Psychological and Behavioral Research 2
 PSY 512: Advanced Statistics for Psychological and Behavioral Research 2 Introduce moderated multiple regression Continuous predictor continuous predictor Continuous predictor categorical predictor Understand
Module 5: Multiple Regression Analysis
 Using Statistical Data Using to Make Statistical Decisions: Data Multiple to Make Regression Decisions Analysis Page 1 Module 5: Multiple Regression Analysis Tom Ilvento, University of Delaware, College
Applied Data Mining Analysis: A Step-by-Step Introduction Using Real-World Data Sets
 Applied Data Mining Analysis: A Step-by-Step Introduction Using Real-World Data Sets http://info.salford-systems.com/jsm-2015-ctw August 2015 Salford Systems Course Outline Demonstration of two classification
How to choose an analysis to handle missing data in longitudinal observational studies
 How to choose an analysis to handle missing data in longitudinal observational studies ICH, 25 th February 2015 Ian White MRC Biostatistics Unit, Cambridge, UK Plan Why are missing data a problem? Methods:
Answer: C. The strength of a correlation does not change if units change by a linear transformation such as: Fahrenheit = 32 + (5/9) * Centigrade
 * Centigrade") Statistics Quiz Correlation and Regression -- ANSWERS 1. Temperature and air pollution are known to be correlated. We collect data from two laboratories, in Boston and Montreal. Boston makes their measurements
Statistics Quiz Correlation and Regression -- ANSWERS 1. Temperature and air pollution are known to be correlated. We collect data from two laboratories, in Boston and Montreal. Boston makes their measurements
Lab 5 Linear Regression with Within-subject Correlation. Goals: Data: Use the pig data which is in wide format:
 Lab 5 Linear Regression with Within-subject Correlation Goals: Data: Fit linear regression models that account for within-subject correlation using Stata. Compare weighted least square, GEE, and random
Discussion. Seppo Laaksonen 1. 1. Introduction
 Journal of Official Statistics, Vol. 23, No. 4, 2007, pp. 467 475 Discussion Seppo Laaksonen 1 1. Introduction Bjørnstad s article is a welcome contribution to the discussion on multiple imputation (MI)
Poisson Models for Count Data
 Chapter 4 Poisson Models for Count Data In this chapter we study log-linear models for count data under the assumption of a Poisson error structure. These models have many applications, not only to the
Part 2: Analysis of Relationship Between Two Variables
 Part 2: Analysis of Relationship Between Two Variables Linear Regression Linear correlation Significance Tests Multiple regression Linear Regression Y = a X + b Dependent Variable Independent Variable
4. Simple regression. QBUS6840 Predictive Analytics. https://www.otexts.org/fpp/4
 4. Simple regression QBUS6840 Predictive Analytics https://www.otexts.org/fpp/4 Outline The simple linear model Least squares estimation Forecasting with regression Non-linear functional forms Regression
Dealing with Missing Data
 Dealing with Missing Data Roch Giorgi email: roch.giorgi@univ-amu.fr UMR 912 SESSTIM, Aix Marseille Université / INSERM / IRD, Marseille, France BioSTIC, APHM, Hôpital Timone, Marseille, France January
This chapter will demonstrate how to perform multiple linear regression with IBM SPSS
 CHAPTER 7B Multiple Regression: Statistical Methods Using IBM SPSS This chapter will demonstrate how to perform multiple linear regression with IBM SPSS first using the standard method and then using the
Multiple Regression: What Is It?
 Multiple Regression Multiple Regression: What Is It? Multiple regression is a collection of techniques in which there are multiple predictors of varying kinds and a single outcome We are interested in
Chapter Seven. Multiple regression An introduction to multiple regression Performing a multiple regression on SPSS
 Chapter Seven Multiple regression An introduction to multiple regression Performing a multiple regression on SPSS Section : An introduction to multiple regression WHAT IS MULTIPLE REGRESSION? Multiple
Econometrics Simple Linear Regression
 Econometrics Simple Linear Regression Burcu Eke UC3M Linear equations with one variable Recall what a linear equation is: y = b 0 + b 1 x is a linear equation with one variable, or equivalently, a straight
Stephen du Toit Mathilda du Toit Gerhard Mels Yan Cheng. LISREL for Windows: PRELIS User s Guide
 Stephen du Toit Mathilda du Toit Gerhard Mels Yan Cheng LISREL for Windows: PRELIS User s Guide Table of contents INTRODUCTION... 1 GRAPHICAL USER INTERFACE... 2 The Data menu... 2 The Define Variables
Examining a Fitted Logistic Model
 STAT 536 Lecture 16 1 Examining a Fitted Logistic Model Deviance Test for Lack of Fit The data below describes the male birth fraction male births/total births over the years 1931 to 1990. A simple logistic
A Guide to Imputing Missing Data with Stata Revision: 1.4
 A Guide to Imputing Missing Data with Stata Revision: 1.4 Mark Lunt December 6, 2011 Contents 1 Introduction 3 2 Installing Packages 4 3 How big is the problem? 5 4 First steps in imputation 5 5 Imputation
Missing Data in Longitudinal Studies: To Impute or not to Impute? Robert Platt, PhD McGill University
 Missing Data in Longitudinal Studies: To Impute or not to Impute? Robert Platt, PhD McGill University 1 Outline Missing data definitions Longitudinal data specific issues Methods Simple methods Multiple
Introduction to mixed model and missing data issues in longitudinal studies
 Introduction to mixed model and missing data issues in longitudinal studies Hélène Jacqmin-Gadda INSERM, U897, Bordeaux, France Inserm workshop, St Raphael Outline of the talk I Introduction Mixed models
Introduction to Longitudinal Data Analysis
 Introduction to Longitudinal Data Analysis Longitudinal Data Analysis Workshop Section 1 University of Georgia: Institute for Interdisciplinary Research in Education and Human Development Section 1: Introduction
Introduction to Regression and Data Analysis
 Statlab Workshop Introduction to Regression and Data Analysis with Dan Campbell and Sherlock Campbell October 28, 2008 I. The basics A. Types of variables Your variables may take several forms, and it
TABLE OF CONTENTS ALLISON 1 1. INTRODUCTION... 3
 ALLISON 1 TABLE OF CONTENTS 1. INTRODUCTION... 3 2. ASSUMPTIONS... 6 MISSING COMPLETELY AT RANDOM (MCAR)... 6 MISSING AT RANDOM (MAR)... 7 IGNORABLE... 8 NONIGNORABLE... 8 3. CONVENTIONAL METHODS... 10
SIMPLE LINEAR CORRELATION. r can range from -1 to 1, and is independent of units of measurement. Correlation can be done on two dependent variables.
 SIMPLE LINEAR CORRELATION Simple linear correlation is a measure of the degree to which two variables vary together, or a measure of the intensity of the association between two variables. Correlation
Chapter 13 Introduction to Nonlinear Regression( 非 線 性 迴 歸 )
") Chapter 13 Introduction to Nonlinear Regression( 非 線 性 迴 歸 ) and Neural Networks( 類 神 經 網 路 ) 許 湘 伶 Applied Linear Regression Models (Kutner, Nachtsheim, Neter, Li) hsuhl (NUK) LR Chap 10 1 / 35 13 Examples
Chapter 13 Introduction to Nonlinear Regression( 非 線 性 迴 歸 ) and Neural Networks( 類 神 經 網 路 ) 許 湘 伶 Applied Linear Regression Models (Kutner, Nachtsheim, Neter, Li) hsuhl (NUK) LR Chap 10 1 / 35 13 Examples
Item Imputation Without Specifying Scale Structure
 Original Article Item Imputation Without Specifying Scale Structure Stef van Buuren TNO Quality of Life, Leiden, The Netherlands University of Utrecht, The Netherlands Abstract. Imputation of incomplete
2. Filling Data Gaps, Data validation & Descriptive Statistics
 2. Filling Data Gaps, Data validation & Descriptive Statistics Dr. Prasad Modak Background Data collected from field may suffer from these problems Data may contain gaps ( = no readings during this period)
Introduction to Fixed Effects Methods
 Introduction to Fixed Effects Methods 1 1.1 The Promise of Fixed Effects for Nonexperimental Research... 1 1.2 The Paired-Comparisons t-test as a Fixed Effects Method... 2 1.3 Costs and Benefits of Fixed