MetroGIS Project Proposal Template Version 1.0
|
|
|
- Dwight White
- 9 years ago
- Views:
Transcription
1 MetroGIS Project Proposal Template Version MetroGIS provides an on-going opportunity for collaborative projects among its stakeholders. Crucial to the success of collaborative projects are the identification of clear project goals, deliverables, and the resources and personnel needed. This template is provided to assist stakeholders to identify and list the core information to shape and start a collaborative project. Part 1: Project Overview Project Title Project Description What is the goal of the project? What are the specific business needs to by satisfied by the project? See also: Business Case Template(s) completed for the project What are the deliverables? What does a successful outcome for this project look like?

2 MetroGIS Project Proposal Template Version Part 2: Stakeholders and Resources Who are the stakeholders and/or beneficiaries of the project? Who is the Project Champion and what agency do they represent? Champion: A policy-level advocate from a stakeholder agency Who is the Project Manager and what agency do they represent? Manager: A stakeholder responsible for the delivery of the project Who is the Project Owner and what agency do they represent? Owner: A stakeholder invovled in the ongoing decisions, results and success Who would perform the work? Examples: Contracted vendor, stakeholder staff, specific agency staff, combinations of these listed, etc. Who are the Project Team members? Team: Technical and managerial staff that guide, shape and make functional decisions about the project. Is funding needed, if so, where would the funding come from? Please list approximate amounts and possible sources of funding.

3 MetroGIS Project Proposal Template Version Part 3: Practical Considerations Does this project have policy implications? If yes, please explain: Is there a need for existing policies, practices or laws to change? Are there pre-requisites that must be met or satisfied? Is there research, background information or outreach that must precede the project? What is the anticipated deadline or lifespan of the project? Please indicate any/all relevant time constraints on the project. Does this project tie to other/similar projects or initiatives? What is the likelihood of success for this project? Very High, High, Medium, Low, Unknown Please include any other relevant facts or details about the project Please attach additional relevant research or supporing materials to this project

4


5


6
7 5/7/2014 Introduction MetroGIS Regional Project Proposal GIS Dashboard Application Dashboard applications have become commonplace over the past several years. The term generally refers to a simple, graphical representation of key indicators of data or processes (see examples). Dashboard Examples Indicators may be presented in a variety of forms using widgets which may include maps, graphs, charts, tables, and lists. Widgets can be integrated, sharing the same context, so a selection or query in one widget may impact related representations in other widgets. When used with geospatial data, a dashboard can help visualize multiple aspects of features as well as display them on a map. The map dashboard has great potential in a web environment by leveraging map services published by government agencies for other applications or simply as a mechanism for providing convenient access to data without the need for moving data around. Typical web mapping applications have tended to be narrowly focused on viewing and querying with a map display, a table of contents, and an attribute display. A dashboard can greatly expand the usefulness of public geospatial data already available and encourage others to publish more data in this way. As internal applications, it expands the potential users of GIS to those who are looking for a productivity tool that leverages GIS technology in a very

8 5/7/2014 focused way. This can be accomplished by developing a single JavaScript application that can be configured at run time to use a specific web mapping service. Objective Develop an application that provides advanced view and query capabilities through multiple linked widgets related to an ArcGIS Server REST map service including a map, a list, a summary count, custom query, feature attribute detail, and a pie chart. Each widget will support its unique interactive functions, which may be reflected in other widgets. Data sources for widgets can be a layer from the map service or the results of a query. The application will be configurable through a collection of variables representing a specific implementation of the application. Multiple implementations will use the same program files (not copies). The primary variable will be the active map service or web map and associated custom queries, and the general layout of widgets, including whether they are active or not. No programming or recompilation of specific implementations will be necessary to incorporate the configuration variables. Developed in JavaScript, this application will be available to anyone to set up and configure to access any public map services or internal map services for internal applications. The application will be developed as a software framework, providing a foundation for additional enhancements and extensions. For example, numerous JavaScript libraries exist for charting, graphing, and displaying tables. It should be relatively easy to add new libraries and associated supporting JavaScript code to replace or extend initial capabilities. The Esri Operations Dashboard The design of this application is largely based on the capabilities of a limited implementation of the Esri Operations Dashboard. That application is very rich in capabilities and options, which can be configured through a GUI interface, with options for users to configure the application themselves, creating their own personal variations. Configurations are stored as Operations Views in ArcGIS Online. Accessing Operations Views requires a named ArcGIS Online account. Named accounts are available from Esri on an annual subscription basis at a bundled cost of $17,500 per 100 users. This proposed GIS Dashboard Application is intended to be a low cost, entry level alternative, similar to the Esri Operations Dashboard, without the ArcGIS Online dependency. It will have fewer capabilities but can be deployed at a fixed cost associated with its development, not the number of users. Users who exhibit a need for advanced dashboard capabilities can be easily upgraded to the Esri Operations Dashboard, with the associated ArcGIS Online subscription, using the same map services used for this application. The core capabilities outlined in this document are demonstrated in the Esri JavaScript Samples online. Development of this application fits within the Esri JavaScript API license for internal and public non commercial (no charge) use.

9 5/7/2014 Cost Estimate Preliminary inquiries of potential commercial GIS application developers have led to an estimate of hours to develop this application. At an estimated rate of $120/hour for a developer, this leads to a cost estimate of $24,000 $28,800. This estimate is entirely dependent on development of detailed requirements and level of effort necessary to achieve them. This application can be developed using an agreement similar to that which was used with the Address Point Editor, which was developed with the condition that it could be used by any government entity in the State of Minnesota at no additional cost. The developer retained the right to remarket the application to private companies and government organizations outside Minnesota. This may also be a candidate for an open source project, making it available to anyone, potentially engaging a broad development community. Development Methodology The Address Point Editor project is also a good model for developing this application. It employed an agile software development methodology of iterative and incremental requirements gathering and coding sprints. The initial requirements will be focused on core capabilities in a flexible framework. This can then be followed by iterations to add widgets. In this case, this methodology will work very well, maximizing available funding to create a flexible, extensible application that will support future enhancements. Project Team The MetroGIS Data Producer Workgroup, composed of the 7 County GIS Managers, and Olmsted County GIS Manager, which together form an 8 County IT Collaborative, support this proposal. A core team will be formed with representatives from some of those counties. Additional interested individuals will be recruited from cities and other Metro local government organizations to provide a broad perspective for defining requirements. References Esri ArcGIS Server REST API: ArcGIS Online Operations Dashboard: dashboard ArcGIS API for JavaScript: ArcGIS API for JavaScript License Agreement:

10 5/7/2014 Widgets (see diagram at end for letters referenced) Widgets represent specific component capabilities in the application. They can be added or removed from a specific configuration. Widgets generally share the same data context, thereby reflecting changes in the shared context through queries and selections. Widgets help the user perform basic data analyses by visualizing multiple aspects of a data context at the same time. Map (A) The map provides basic capabilities to zoom, pan, zoom to an address, and identify features. Clicking on a feature presents the attributes for that feature in a popup on the map (F). Maps can also have a user selectable base map service. Pie chart (B) A pie chart is configured to present a summary based on the value of a specific field. Each slice of the pie represents the portion of all records with a specific value. All values for the field are represented, based on the filter. Pie charts change when the map filter changes. Hovering the cursor over a slice pops up the value represented and the total number of records with that value. Multiple pie charts can be present in a dashboard. List (C) A list shows all records displayed in the map along with select attributes. The list can be scrolled up and down. Clicking on an entry in the list causes it to be highlighted in some way on the map. Corresponding map symbols for each record will be visible in the list, retrieved from the map service. Custom queries (D) Queries are presented as a series of criteria, allowing the user to set values for specific fields. The query operates within the context of the filter, with an option to limit the query to the current map extents. Query results are presented as an indexed display of record attributes with simple record navigation options to move to next, previous, first, and last records (G). Query results provide an option to highlight the selected records in the map. Displayed attributes are configurable, including alias names for fields. Summary count (E) The summary count reflects the sum, average, min, or max of the value of a specific field for the current records in the map. Multiple summary counts can be present in a dashboard. Filter (H) The map service can be filtered based on a specific attribute, which impacts other widgets accordingly, each displaying various aspects of the result set. A filter may be defined as mutually exclusive or as added to other filters (logical OR).
 The map provides basic capabilities to zoom, pan, zoom to an address, and identify features. Clicking on a feature presents the attributes for that feature in a popup on the map (F).")
11 Dakota County Supportive Housing Dashboard 5/7/2014 C E H F A G A Interactive map B Pie chart C List D Custom queries E Summary F Identify feature G Query results H Filters B B D

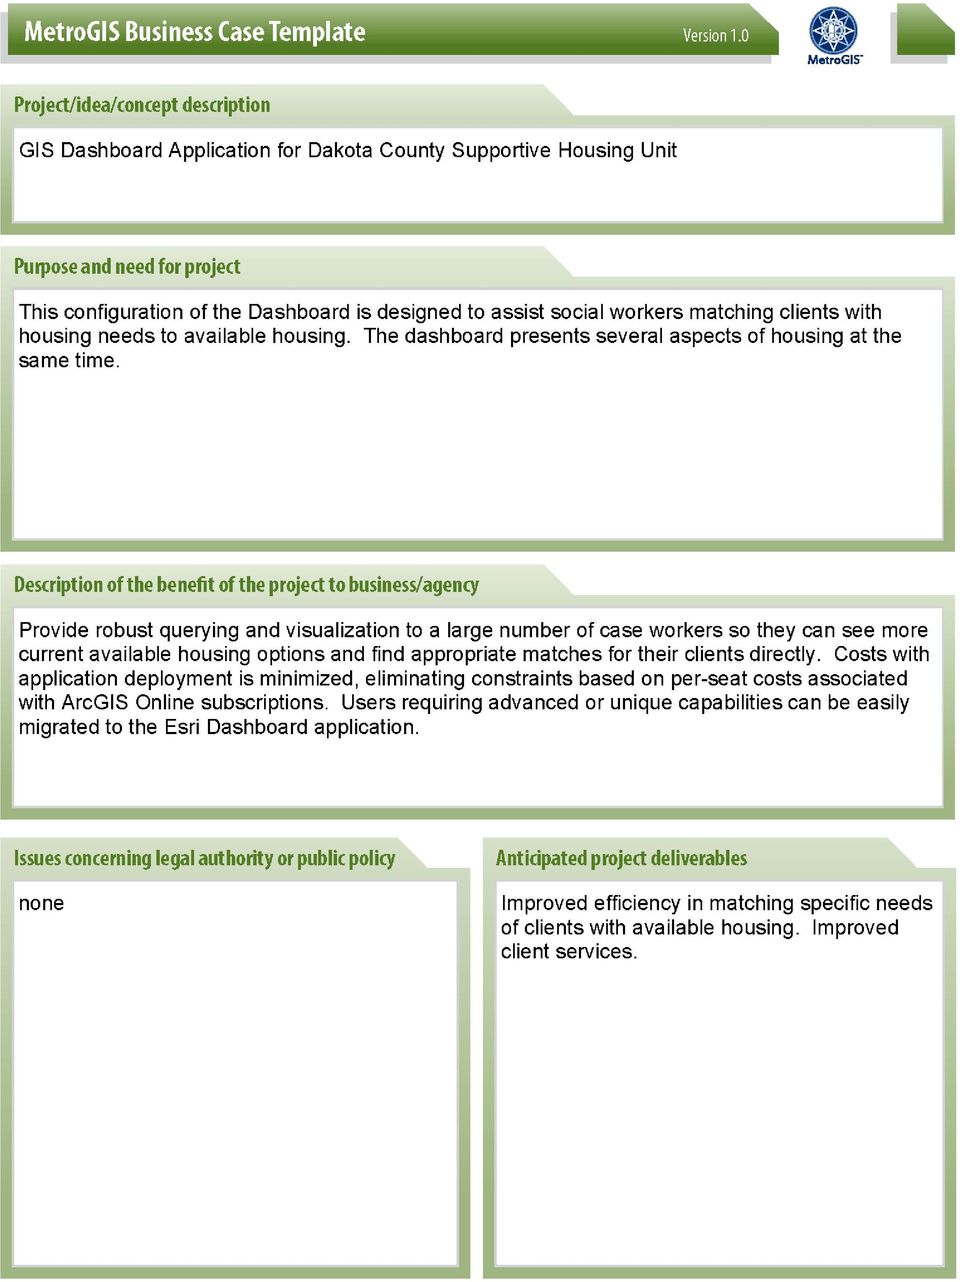
12 Detailed Use Case: Dakota County Supportive Housing 5/7/2014 This Dashboard is designed to assist social workers matching clients with housing needs to available housing. The dashboard presents several aspects of housing at the same time. The map (A) shows dots representing registered housing providers with two symbols representing those with openings (orange) and those without openings (black). Users can pan and zoom on the map and zoom to an address to see available housing in a particular vicinity. They can click on a dot and get more information about the individual site it represents in a popup (F). The alphabetical list (C) of housing providers allows users to search or scan for available housing by name, then click a particular provider to highlight or zoom to it on the map. There is a running tally (E) of the current number of openings displayed at all times. This updates as filters and search criteria change, so that overall housing available is discernible at a glance. Similarly, the pie charts (B) provide a quick breakdown of housing providers by type and by licensor. Users are able to limit the providers shown on the map by applying a filter (H). There are filters to single out housing providers by housing program type or by licensor. The map, list, summary, and charts automatically update to reflect the filtered inventory. Complex querying capabilities are necessary to effectively match clients with appropriate housing. Custom queries (D) allow users to create subsets of housing providers by selecting criteria from a series of dropdowns. For instance, a worker may need to find housing that is available to seniors, wheelchair accessible, non smoking, provides 24 hr supports, serves DD adults, and accepts GRH+Rate 2 funding. Query results (G) can be paged through record by record, and can also be highlighted or zoomed to on the map. Although this is a very specific use case, it represents only one implementation of the capabilities of this application. Other government organizations will have the need for the same capabilities applied to other business processes. The application will allow these capabilities to be used for a variety of use cases. The following pages show examples that are variations of the same dashboard, simply reconfigured to display and query other Esri REST map services.

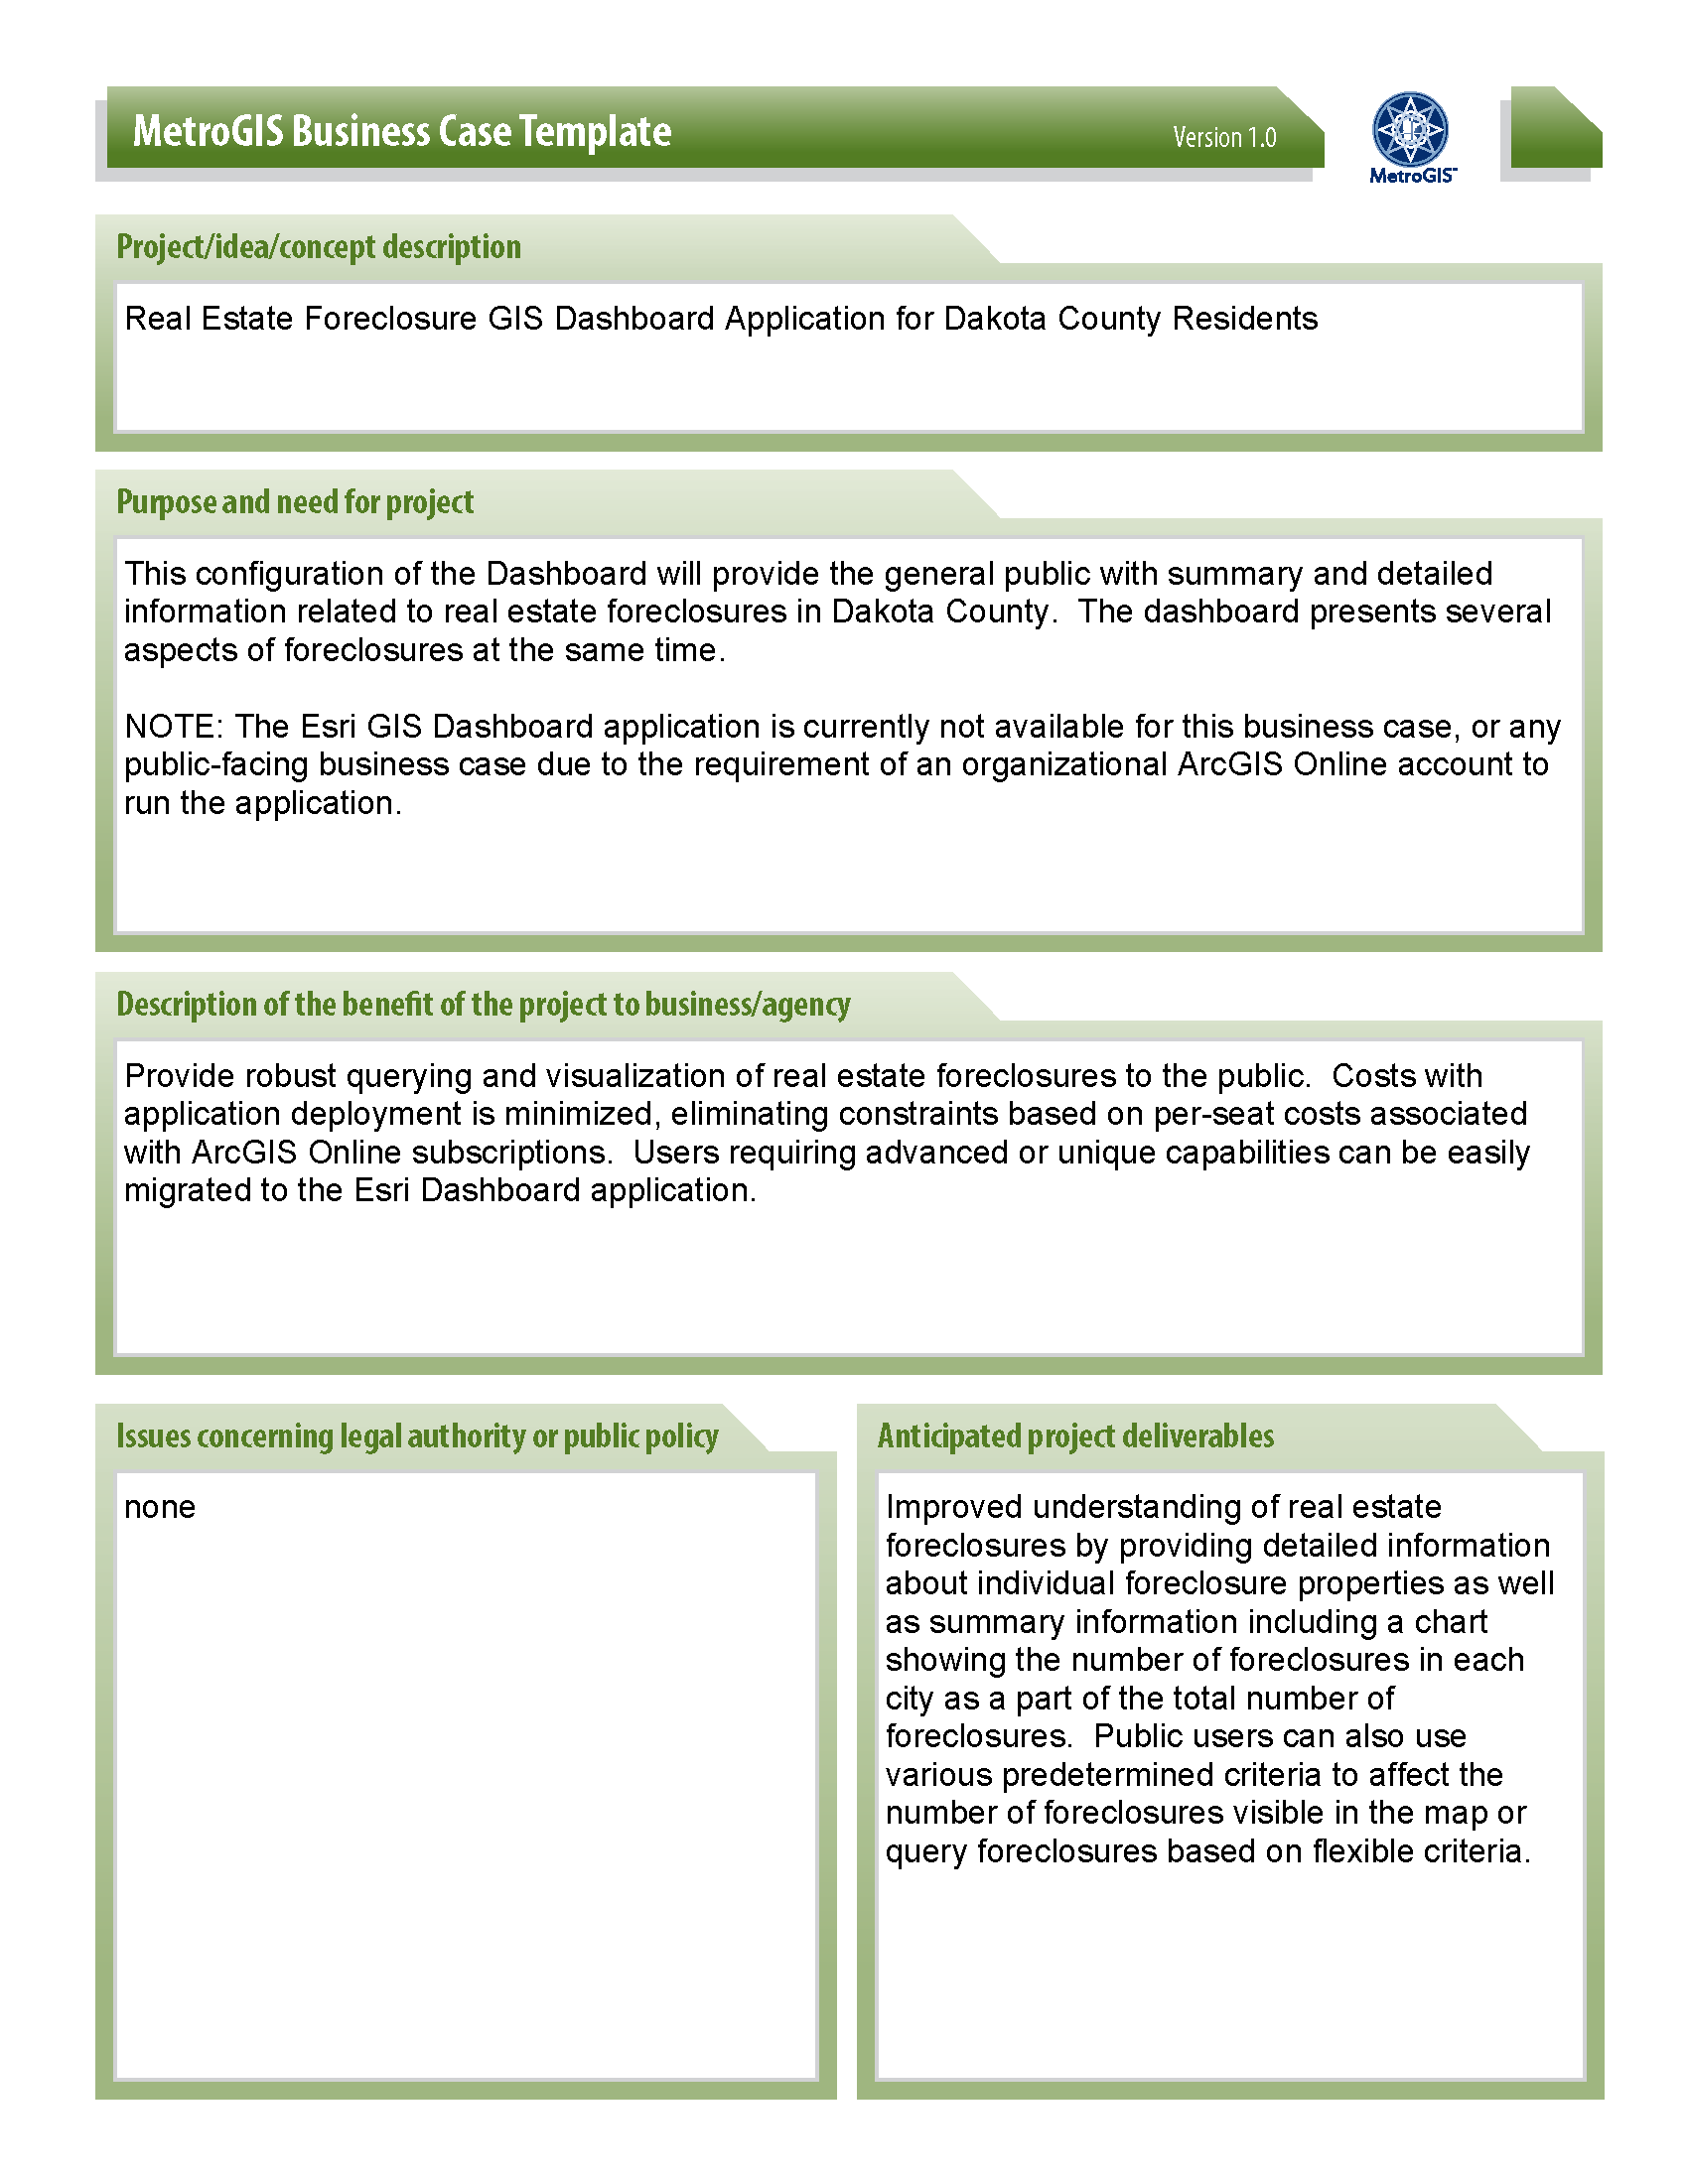
13 Land Conservation Easements 5/7/2014 Real Estate Foreclosure Sales

14 Subdivision Plat Review Process 5/7/2014 Photogrammetric Basemap Updating Process

ArcGIS 10.1 Web Apps and APIs. John Hasthorpe & Kai Hübner
 ArcGIS 10.1 Web Apps and APIs John Hasthorpe & Kai Hübner Overview Options for leveraging ArcGIS Server using Esri s Web APIs Alternatives to the Web ADF application builder (Gone in 10.1) When and how
Scott Moore, Esri April 4, 2016 2016 Intermountain, Great Falls, MT
 Create Great Web Apps No Coding Required Scott Moore, Esri April 4, 2016 2016 Intermountain, Great Falls, MT Agenda Product overview Web AppBuilder for ArcGIS tour What s New November 2015 ArcGIS Online
Build an ArcGIS Online Application
 Build an ArcGIS Online Application Sign into ArcGIS Online for Maryland 1. Open a web browser 2. Go to URL http://maryland.maps.arcgis.com/ 3. Click Sign In in the upper right corner of the web page 4.
ArcGIS Viewer for Silverlight An Introduction
 Esri International User Conference San Diego, California Technical Workshops July 26, 2012 ArcGIS Viewer for Silverlight An Introduction Rich Zwaap Agenda Background Product overview Getting started and
Intro to Web App Builder. Mark Scott, Solutions Engineer, Esri County Government Team [email protected]
 Intro to Web App Builder Mark Scott, Solutions Engineer, Esri County Government Team [email protected] The ArcGIS Platform enables Web GIS Enabling GIS Everywhere Desktop Web Device Simple Integrated Open
NatureServe s Environmental Review Tool
 NatureServe s Environmental Review Tool A Repeatable Online Software Solution for Agencies For More Information, Contact: Lori Scott Rob Solomon [email protected] [email protected] 703-908-1877
Quick Start Guide to. ArcGISSM. Online
 Quick Start Guide to ArcGISSM Online ArcGIS Online Quick Start Guide ArcGIS SM Online is a cloud-based mapping platform for organizations. Users get access to dynamic, authoritative content to create,
Salesforce Integration Guide
 Salesforce Integration Guide Salesforce Integration Guide Document Publication Date: October 14, 2011 Copyright 2009-2011 BroadVision, Inc., 1600 Seaport Boulevard, Suite 550, North Building, Redwood City,
Configuring and Extending ArcGIS Solutions Web Applications
 Esri Developer Summit March 8 11, 2016 Palm Springs, CA Configuring and Extending ArcGIS Solutions Web Applications Allison Muise & Mike Tschudi ArcGIS Solutions? ArcGIS as a Platform Simple, Open, and
Introduction to Web AppBuilder for ArcGIS: JavaScript Apps Made Easy
 Introduction to Web AppBuilder for ArcGIS: JavaScript Apps Made Easy OKSCAUG Pamela Kersh September 22, 2015 The ArcGIS Platform enables Web GIS Enabling GIS Everywhere Desktop Web Device Simple Integrated
Five Steps to Better Performance
 Effective Web maps have a specific focus and are designed so users can interact with them to accomplish meaningful tasks. Five Steps to Better Performance Sample methodology for creating a great Web map
There are various ways to find data using the Hennepin County GIS Open Data site:
 Finding Data There are various ways to find data using the Hennepin County GIS Open Data site: Type in a subject or keyword in the search bar at the top of the page and press the Enter key or click the
City of Corpus Christi. Mobile GIS Viewer. For ipad
 City of Corpus Christi Mobile GIS Viewer For ipad MIS - GIS 3/9/2012 P a g e 1 Contents Requirements... 2 Installation... 2 Using the ArcGIS Mobile App... 4 Connect to the Corpus Christi Mobile GIS Map
ArcGIS online Introduction... 2. Module 1: How to create a basic map on ArcGIS online... 3. Creating a public account with ArcGIS online...
 Table of Contents ArcGIS online Introduction... 2 Module 1: How to create a basic map on ArcGIS online... 3 Creating a public account with ArcGIS online... 3 Opening a Map, Adding a Basemap and then Saving
CRGroup Whitepaper: Digging through the Data. www.crgroup.com. Reporting Options in Microsoft Dynamics GP
 CRGroup Whitepaper: Digging through the Data Reporting Options in Microsoft Dynamics GP The objective of this paper is to provide greater insight on each of the reporting options available to you within
2/24/2010 ClassApps.com
 SelectSurvey.NET Training Manual This document is intended to be a simple visual guide for non technical users to help with basic survey creation, management and deployment. 2/24/2010 ClassApps.com Getting
Storytelling with Maps: Workflows and Best Practices
 Storytelling with Maps: Workflows and Best Practices Introduction What is a story map? Story maps are interactive maps combined with text and other content to tell a story about the world. Typically story
Contents. The OWRB Floodplain Viewer. Creating Maps... 8. Helpful Tips... 10
 Contents QUICK START GUIDE... 2-5 Add layers...9 Search for Layers...9 COMPREHENSIVE GUIDE... 6 Navigate the map...6 Locate specific places...6 Add layer from file...9 Add layer from web...9 Display pop-up
DataPA OpenAnalytics End User Training
 DataPA OpenAnalytics End User Training DataPA End User Training Lesson 1 Course Overview DataPA Chapter 1 Course Overview Introduction This course covers the skills required to use DataPA OpenAnalytics
Embedded BI made easy
 June, 2015 1 Embedded BI made easy DashXML makes it easy for developers to embed highly customized reports and analytics into applications. DashXML is a fast and flexible framework that exposes Yellowfin
Visualizing Multi-Dimensional WMS within ArcGIS For JavaScript API
 Visualizing Multi-Dimensional WMS within ArcGIS For JavaScript API Data Prep: 1. Obtain a netcdf File with a time dimension and another dimension. For example depth, altitude 2. Open ArcGIS Desktop 3.
Reporting Manual. Prepared by. NUIT Support Center Northwestern University
 Reporting Manual Prepared by NUIT Support Center Northwestern University Updated: February 2013 CONTENTS 1. Introduction... 1 2. Reporting... 1 2.1 Reporting Functionality... 1 2.2 Creating Reports...
Rational Team Concert. Quick Start Tutorial
 Rational Team Concert Quick Start Tutorial 1 Contents 1. Introduction... 3 2. Terminology... 4 3. Project Area Preparation... 5 3.1 Defining Timelines and Iterations... 5 3.2 Creating Team Areas... 8 3.3
Microsoft Visio 2010 Business Intelligence
 Microsoft Visio 2010 Business Intelligence St. Louis SharePoint User Group Candy Parisi Microsoft Visio Solution Specialist April 10, 2012 Agenda Microsoft Business Intelligence Overview Visio Business
Building and Deploying Web Applications
 Building and Deploying Web Applications Dal Hunter and Jeff Shaner Friday, Nov 6 10:30-12:00 Agenda Product overview Web AppBuilder for ArcGIS tour What s New July 2015 ArcGIS Online update Customization
The Cisco CMX Analytics Service
 Overview of the Analytics Service, page 1 The Analytics Dashboard, page 2 Customized Widgets, page 8 Social Media Analytics, page 14 Performing Heatmap Analysis, page 16 Using the Schedule Manager, page
An Esri White Paper October 2010 Esri Production Mapping Product Library: Spatially Enabled Document Management System
 An Esri White Paper October 2010 Esri Production Mapping Product Library: Spatially Enabled Document Management System Esri, 380 New York St., Redlands, CA 92373-8100 USA TEL 909-793-2853 FAX 909-793-5953
CHAPTER 2 PAVEMENT MANAGEMENT SYSTEM
 CHAPTER 2 PAVEMENT MANAGEMENT SYSTEM 2.1. INTRODUCTION TO PAVEMENT MANAGEMENT The ability of a pavement system to serve a society is largely a function of planning. Planning is the intersection between
Conservation Workshop ArcGIS Explorer
 Conservation Workshop ArcGIS Explorer Bern Szukalski [email protected] Topics for this session Introduction Overview of features Using ArcGIS Explorer effectively New features & capabilities Customization
Studying Topography, Orographic Rainfall, and Ecosystems (STORE)
") Studying Topography, Orographic Rainfall, and Ecosystems (STORE) Introduction Basic Lesson 2: Using ArcGIS Explorer to Analyze the Connection between Topography and Rainfall This lesson introduces Geographical
Studying Topography, Orographic Rainfall, and Ecosystems (STORE) Introduction Basic Lesson 2: Using ArcGIS Explorer to Analyze the Connection between Topography and Rainfall This lesson introduces Geographical
ArcGIS Mobile Application User s Guide
 ArcGIS Mobile Application User s Guide 1 Contents Chapter 1 Chapter 2 Chapter 3 Chapter 4 2 5 5 6 7 7 8 8 11 12 14 15 19 21 22 23 37 38 ArcGIS Mobile User Interface Essentials Title Bar Menu Bar Hardware
Review Manager Guide
 Review Manager Guide v8.0 May 10, 2013 For the most recent version of this document, visit kcura's Documentation Site. Table of Contents 1 Review Manager overview 4 1.1 Review Manager life cycle 4 1.2
Creating Web and Mobile Maps Using ArcGIS Online. SCO Technical Paper
 Creating Web and Mobile Maps Using ArcGIS Online SCO Technical Paper Version History Version Date Notes Author/Contact 1.0 February, 2012 Initial document created. John J Czaplewski Copyright 2012 The
MetroBoston DataCommon Training
 MetroBoston DataCommon Training Whether you are a data novice or an expert researcher, the MetroBoston DataCommon can help you get the information you need to learn more about your community, understand
P6 Analytics Reference Manual
 P6 Analytics Reference Manual Release 3.2 October 2013 Contents Getting Started... 7 About P6 Analytics... 7 Prerequisites to Use Analytics... 8 About Analyses... 9 About... 9 About Dashboards... 10 Logging
This course will also teach how to create various kinds of dashboards using Reporting Services.
 Implementing and Maintaining Microsoft SQL Server 2008 Reporting Services Length : 3 Days (24 Hours) Language(s) : English Audience(s) : IT Professionals Level : 200 Technology : Microsoft SQL Server 2008
NetIQ Operations Center 5: The Best IT Management Tool in the World Lab
 NetIQ Operations Center 5: The Best IT Management Tool in the World Lab NIQ08 Novell Training Services ATT LIVE 2012 LAS VEGAS www.novell.com Legal Notices Novell, Inc., makes no representations or warranties
Promoting Your Location Platform
 Promoting Your Location Platform A Change Management Kit www.esri.com/changekit Publication Date: November 23, 2015 Esri: Promoting Your Location Platform 1 What is the Change Management Kit? The launch
Enterprise Data Visualization and BI Dashboard
 Strengths Key Features and Benefits Ad-hoc Visualization and Data Discovery Prototyping Mockups Dashboards The application is web based and can be installed on any windows or linux server. There is no
GEOGRAPHIC INFORMATION SYSTEMS
 GIS GEOGRAPHIC INFORMATION SYSTEMS FOR CADASTRAL MAPPING Chapter 7 2015 Cadastral Mapping Manual 7-0 GIS - GEOGRAPHIC INFORMATION SYSTEMS What is GIS For a long time people have sketched, drawn and studied
Rational Team Concert. Scrum Project Management Tutorial
 Rational Team Concert Scrum Project Management Tutorial 1 Contents Contents... 2 1. Introduction... 3 2. Terminology... 4 3. Project Area Preparation... 4 3.1 Adding Users and specifying Roles... 5 3.2
OnPoint 7.0 Tools and Functionality
 P a g e 1 OnPoint 7.0 Tools and Functionality The new version of the OnPoint website has the same functionality as the old site, but the look and feel of the page has changed. This document will compare
Use ArcGIS Online to Manage
 Use ArcGIS Online to Manage Your Own Custom Map Gallery By Keith Mann, Esri Start customizing the template by changing the graphics and the web page title. Wouldn t it be great if you could create a dynamic
An Esri White Paper April 2011 Esri Business Analyst Server System Design Strategies
 An Esri White Paper April 2011 Esri Business Analyst Server System Design Strategies Esri, 380 New York St., Redlands, CA 92373-8100 USA TEL 909-793-2853 FAX 909-793-5953 E-MAIL [email protected] WEB esri.com
Process Portal Hands-on Exercise
 IBM BPM in Action using WebSphere Lombardi Edition Process Portal Hands-on Exercise This lab will introduce you to the Lombardi Process Portal, which is an interface that enables process participants to
Microsoft Consulting Services. PerformancePoint Services for Project Server 2010
 Microsoft Consulting Services PerformancePoint Services for Project Server 2010 Author: Emmanuel Fadullon, Delivery Architect Microsoft Consulting Services August 2011 Information in the document, including
MicroStrategy Analytics Express User Guide
 MicroStrategy Analytics Express User Guide Analyzing Data with MicroStrategy Analytics Express Version: 4.0 Document Number: 09770040 CONTENTS 1. Getting Started with MicroStrategy Analytics Express Introduction...
QAD Business Intelligence Dashboards Demonstration Guide. May 2015 BI 3.11
 QAD Business Intelligence Dashboards Demonstration Guide May 2015 BI 3.11 Overview This demonstration focuses on one aspect of QAD Business Intelligence Business Intelligence Dashboards and shows how this
Using the Drag-and-Drop Report Builder
 Using the Drag-and-Drop Report Builder Salesforce, Winter 16 @salesforcedocs Last updated: October 16, 2015 Copyright 2000 2015 salesforce.com, inc. All rights reserved. Salesforce is a registered trademark
Implementing ArcGIS for SharePoint Habitat for Humanity of Omaha April, 2013
 Ingenuity Innovation Integrity Implementing ArcGIS for SharePoint Habitat for Humanity of Omaha April, 2013 1851 Alexander Bell Drive Suite 350 Reston, VA 20191 703.463.2059 800.483.2434 www.vistronix.com
Geographic Information System Tools for Management of US DOE Sites 14125
 Geographic Information System Tools for Management of US DOE Sites 14125 John Montgomery*, Cliff Carpenter*, Leonard Turton**, Steve Pawel** *US DOE, Office of Legacy Management **S.M. Stoller Corporation
HELCOM Data and Map Service. User Manual
 HELCOM Data and Map Service User Manual Version 2.2 - February 2015 1 Table of contents 1. General Information... 3 1.1 Background... 3 1.2 Technical requirements... 3 1.3 Contact... 3 2. Accessing HELCOM
A Workflow for Creating and Sharing Maps
 A Workflow for Creating and Sharing Maps By Keith Mann, Esri What You Will Need Item Source ArcGIS Online for Organizations subscription ArcGIS 10.1 for Desktop (Any license level) ArcGIS Spatial Analyst
PROJECT SCOPE STATEMENT
 PROJECT SCOPE STATEMENT Note: Any work not explicitly included in this Project Scope Statement is implicitly excluded from the project. Create links to referenced documents (e.g., Link_To_ ) by using Insert
Creating Dashboards. Intellicus Enterprise Reporting and BI Platform. Intellicus Technologies [email protected] www.intellicus.
 Creating Dashboards Intellicus Enterprise Reporting and BI Platform Intellicus Technologies [email protected] www.intellicus.com Creating Dashboards i Copyright 2013 Intellicus Technologies This document
Finance Reporting. Millennium FAST. User Guide Version 4.0. Memorial University of Newfoundland. September 2013
 Millennium FAST Finance Reporting Memorial University of Newfoundland September 2013 User Guide Version 4.0 FAST Finance User Guide Page i Contents Introducing FAST Finance Reporting 4.0... 2 What is FAST
OpenText Information Hub (ihub) 3.1 and 3.1.1
 3.1 and 3.1.1") OpenText Information Hub (ihub) 3.1 and 3.1.1 OpenText Information Hub (ihub) 3.1.1 meets the growing demand for analytics-powered applications that deliver data and empower employees and customers to
OpenText Information Hub (ihub) 3.1 and 3.1.1 OpenText Information Hub (ihub) 3.1.1 meets the growing demand for analytics-powered applications that deliver data and empower employees and customers to
Embracing ArcGIS for Local Government. Robert Parsons Delaware County, Ohio Auditor s Office Steve Koenig Bruce Harris & Associates
 Embracing ArcGIS for Local Government Robert Parsons Delaware County, Ohio Auditor s Office Steve Koenig Bruce Harris & Associates Background Project began in April 2013 At that time ArcIMS 9.2 was the
Welcome to the topic on creating key performance indicators in SAP Business One, release 9.1 version for SAP HANA.
 Welcome to the topic on creating key performance indicators in SAP Business One, release 9.1 version for SAP HANA. 1 In this topic, you will learn how to: Use Key Performance Indicators (also known as
Create an Excel BI report and share on SharePoint 2013
 2013 Create an Excel BI report and share on SharePoint 2013 Hands-On Lab Lab Manual This document is provided as-is. Information and views expressed in this document, including URL and other Internet Web
Building a Reporting and Analytics System Connected Enterprise Seminar
 Manufacturing Intelligence, de stuwende kracht om in een Connected Enterprise snel accurate beslissingen te nemen om de bedrijfsprestaties te optimaliseren. Building a Reporting and Analytics System Connected
ARIZONA DEPARTMENT OF TRANSPORTATION. Presented by Lonnie D. Hendrix, P.E. Assistant State Engineer, Maintenance
 ARIZONA DEPARTMENT OF TRANSPORTATION Presented by Lonnie D. Hendrix, P.E. Assistant State Engineer, Maintenance Prepared by Feature Inventory Services Team July 2013 FIS Database Feature Inventory System
Best Practices Statement Project Management. Best Practices for Managing State Information Technology Projects
 State of Arkansas Office of Information Technology 124 W. Capitol Ave. Suite 990 Little Rock, AR 72201 501.682.4300 Voice 501.682.4020 Fax http://www.cio.arkansas.gov/techarch Best Practices Statement
ALTAIR SOFTWARE ASSET OPTIMIZATION USER GUIDE
 ALTAIR SOFTWARE ASSET OPTIMIZATION USER GUIDE Table Of Contents What is Altair SAO?... 6 System Architecture... 7 Report Navigation Chart... 8 Report Navigation Chart Dashboard... 9 Report Navigation Chart
Primavera Project Management System at WVDOT. Presented by Marshall Burgess, WVDOT Stephen Cole, Stephen Cole Consulting Jervetta Bruce, CDP, Inc.
 : Integrating GIS With Primavera Project Management System at WVDOT Presented by Marshall Burgess, WVDOT Stephen Cole, Stephen Cole Consulting Jervetta Bruce, CDP, Inc. WVDOT Geographic Information System
Power Monitoring Expert 7.2
 Power Monitoring Expert 7.2 PDF version of the Web Applications online help 7ENxx-00xx-00 07/2013 PDF version of the Web Applications online help Safety information Safety information Important information
Web Analytics with Google Analytics (GA) TRAINING MANUAL FOR WEB EDITORS
 TRAINING MANUAL FOR WEB EDITORS") Web Analytics with Google Analytics (GA) TRAINING MANUAL FOR WEB EDITORS LSA WEB SERVICES Google Analytics Training Manual LSA Web Services Haven Hall, Suite 6051 505 South State Street Ann Arbor, MI 48109-1045
Web Analytics with Google Analytics (GA) TRAINING MANUAL FOR WEB EDITORS LSA WEB SERVICES Google Analytics Training Manual LSA Web Services Haven Hall, Suite 6051 505 South State Street Ann Arbor, MI 48109-1045
Robot SCHEDULE Web Interface User Guide
 Robot SCHEDULE Web Interface User Guide Copyright Copyright HelpSystems, LLC. Robot is a division of HelpSystems. Robot SCHEDULE, HelpSystems Web Server, OPAL, OPerator Assistance Language, Robot ALERT,
Microsoft Visio 2010 Top 10 Benefits
 Microsoft Visio 2010 Top 10 Benefits The advanced diagramming tools of Microsoft Visio 2010 help you simplify complexity with dynamic, data-driven visuals and new ways to share on the Web in real-time.
SonicWALL GMS Custom Reports
 SonicWALL GMS Custom Reports Document Scope This document describes how to configure and use the SonicWALL GMS 6.0 Custom Reports feature. This document contains the following sections: Feature Overview
Doña Ana County, NM Interactive Zoning Map
 Doña Ana County, NM Interactive Zoning Map Users Guide Basic Map Navigation Zoom Control The most efficient way of zooming, or changing the scale of the map is with the use of a mouse with a scroll wheel.
QAD Usability Customization Demo
 QAD Usability Customization Demo Overview This demonstration focuses on one aspect of QAD Enterprise Applications Customization and shows how this functionality supports the vision of the Effective Enterprise;
Census Data: Access, Mapping and Visualization
 Census Data: Access, Mapping and Visualization Trent University is a member of the Data Liberation Initiative (DLI), an agreement that provides academic institutions with access to otherwise restricted
How to Create Dashboards. Published 2014-08
 How to Create Dashboards Published 2014-08 Table of Content 1. Introduction... 3 2. What you need before you start... 3 3. Introduction... 3 3.1. Open dashboard Example 1... 3 3.2. Example 1... 4 3.2.1.
Shark Talent Management System Performance Reports
 Shark Talent Management System Performance Reports Goals Reports Goal Details Report. Page 2 Goal Exception Report... Page 4 Goal Hierarchy Report. Page 6 Goal Progress Report.. Page 8 Goal Status Report...
Esri Maps for Office, SharePoint & Dynamics CRM. Tony Howser Sentha Sivabalan Scott Ball
 Esri Maps for Office, SharePoint & Dynamics CRM Tony Howser Sentha Sivabalan Scott Ball Agenda Location Analytics Esri Maps for - SharePoint - Office - Dynamics CRM Pricing Road Map Q & A Evolving the
Improving Access to GIS Data With Targeted Web Apps. Joyce Green, City of Norman John McIntosh, City of Norman
 Improving Access to GIS Data With Targeted Web Apps Joyce Green, City of Norman John McIntosh, City of Norman Improving Access to GIS Data with Targeted Web Apps Background Objective Development Environment
My AutoSupport. User Guide. October 2013
 System User Guide My AutoSupport October 2013 NetApp AutoSupport is an integrated, efficient monitoring and reporting technology that checks the health of your AutoSupport enabled NetApp systems on a continual
NETFORT LANGUARDIAN MONITORING WAN CONNECTIONS. How to monitor WAN connections with NetFort LANGuardian Aisling Brennan
 NETFORT LANGUARDIAN MONITORING WAN CONNECTIONS How to monitor WAN connections with NetFort LANGuardian Aisling Brennan LANGuardian gives you the information you need to troubleshoot problems and monitor
Data Visualization. Brief Overview of ArcMap
 Data Visualization Prepared by Francisco Olivera, Ph.D., P.E., Srikanth Koka and Lauren Walker Department of Civil Engineering September 13, 2006 Contents: Brief Overview of ArcMap Goals of the Exercise
Step 1 Preparation and Planning
 Its daunting starting any GIS Web or Mobile project. Where does one begin? This 3 step guide should help you get past your project inertia and start things moving rapidly forward. Step 1 Preparation and
Data Visualization. Prepared by Francisco Olivera, Ph.D., Srikanth Koka Department of Civil Engineering Texas A&M University February 2004
 Data Visualization Prepared by Francisco Olivera, Ph.D., Srikanth Koka Department of Civil Engineering Texas A&M University February 2004 Contents Brief Overview of ArcMap Goals of the Exercise Computer
WebSphere Business Monitor
 WebSphere Business Monitor Monitor sub-models 2010 IBM Corporation This presentation should provide an overview of the sub-models in a monitor model in WebSphere Business Monitor. WBPM_Monitor_MonitorModels_Submodels.ppt
SAS BI Dashboard 4.3. User's Guide. SAS Documentation
 SAS BI Dashboard 4.3 User's Guide SAS Documentation The correct bibliographic citation for this manual is as follows: SAS Institute Inc. 2010. SAS BI Dashboard 4.3: User s Guide. Cary, NC: SAS Institute
WHITEPAPER. Managing Design Changes in Enterprise SBM Installations
 WHITEPAPER Managing Design Changes in Enterprise SBM Installations By Tom Clement Serena Software, Inc. October 2013 Summary This document explains how to organize your SBM maintenance and development
Essential Mapping Apps
 Essential Mapping Apps 74% of adults use their smartphone to look at maps or other information based on their current location (of the 58% that own a smart phone) Pew Research Center Maps for Directions
Basic Unified Process: A Process for Small and Agile Projects
 Basic Unified Process: A Process for Small and Agile Projects Ricardo Balduino - Rational Unified Process Content Developer, IBM Introduction Small projects have different process needs than larger projects.
Developing Web and Mobile Dashboards with Oracle ADF
 Developing Web and Mobile Dashboards with Oracle ADF In this lab you ll build a web dashboard that displays data from the database in meaningful ways. You are going to leverage Oracle ADF the Oracle Application
Tutorial: Building a Dojo Application using IBM Rational Application Developer Loan Payment Calculator
 Tutorial: Building a Dojo Application using IBM Rational Application Developer Loan Payment Calculator Written by: Chris Jaun ([email protected]) Sudha Piddaparti ([email protected]) Objective In this
How to use PGS: Basic Services Provision Map App
 How to use PGS: Basic Services Provision Map App The PGS: Basic Services Provision Map App The main features of the PGP Basic Services web application includes: Navigation Tools Map Tools Main Map Links
Note: Hands On workshops are Bring Your Own Laptop (BYOL), unless otherwise noted. Some workshops are Bring Your Own Mobile Device(BYOD).
, unless otherwise noted. Some workshops are Bring Your Own Mobile Device(BYOD).") 2015 MN GIS/LIS Consortium Pre Conference Workshops The Minnesota GIS/LIS Consortium is pleased to offer a diverse list of workshops on Wednesday, October 7th, 2015 at the DECC, Duluth, Minnesota Charting
2015 MN GIS/LIS Consortium Pre Conference Workshops The Minnesota GIS/LIS Consortium is pleased to offer a diverse list of workshops on Wednesday, October 7th, 2015 at the DECC, Duluth, Minnesota Charting
Terrace Consulting Services
 Terrace Consulting Services Overview: Every project will require some degree of Planning before Implementation can begin. Analysis and Planning are essential in order to confirm requirements, define the
Learn About Analysis, Interactive Reports, and Dashboards
 Learn About Analysis, Interactive Reports, and Dashboards This document supports Pentaho Business Analytics Suite 5.0 GA and Pentaho Data Integration 5.0 GA, documentation revision February 3, 2014, copyright