Washington State Industry Outlook and Freight Transportation Forecast:
|
|
|
- Griselda Jean Caldwell
- 10 years ago
- Views:
Transcription
1 Washington State Industry Outlook and Freight Transportation Forecast: Apple Industry Prepared for the Washington State Department of Transportation Freight Systems Division By Selmin Creamer Research Assistant Dr. Eric Jessup Assistant Professor Transportation Research Group School of Economic Sciences Washington State University Pullman, WA March 2008

2 TABLE OF CONTENTS Study Goal... ii Industry Information...1 Economic Outlook...2 Washington Outlook...5 Statewide Transportation and Logistics...8 Statewide Freight Projections...8 Highway Assignments...10 Conclusions...20 References...21 TABLES Table 1: Export Value and Share of Fresh Apple Production in Washington State...6 Table 2: Base Year and Forecasted Apple Production...9 Table 3: Apple Production (in Tons) for the State, by Region...10 Table 4: Apple Production (in Tons) and Total Truck Loads for Yakima Valley...11 Table 5: Apple Production (in Tons) and Total Truck Loads for Columbia Basin...11 Table 6: Apple Production (in Tons) and Total Truck Loads for Wenatchee Valley...12 Table 7: Number of Truck Shipments, by Highway for Yakima Valley...15 Table 8: Number of Truck Shipments, by Highway for Columbia Basin...17 Table 9: Number of Truck Shipments, by Highway for Wenatchee Valley...19 i
 and Total Truck Loads for Columbia Basin...11 Table 6: Apple Production (in Tons) and Total Truck Loads for Wenatchee Valley.")
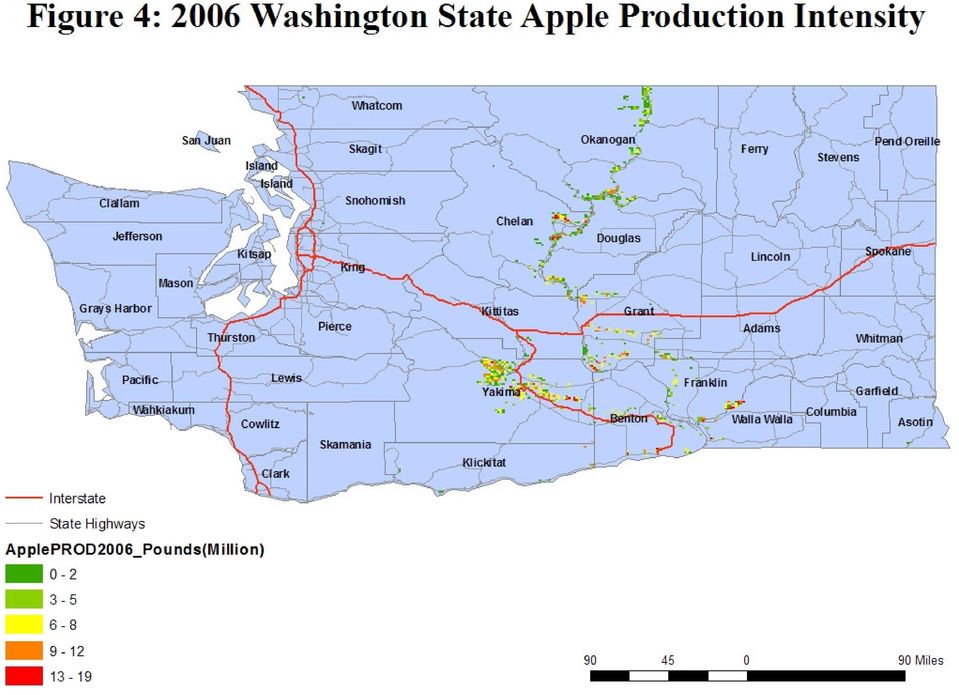
3 FIGURES Figure 1 Washington State Main Apple Producing Regions and the Acreages...2 Figure 2 U.S. Exports...3 Figure 3 Global Apple Export Market Share...4 Figure Washington State Apple Production Intensity...7 Figure 5 Historical and Projected Statewide Apple Production...9 Figure 6 Projected Apple Production, by Region...10 Figure 7 Major Marketing Regions for Washington Apples...12 Figure Yakima Valley Apple Production Intensity...14 Figure Columbia Basin Apple Production Intensity...16 Figure Wenatchee Apple Production Intensity...18 STUDY GOAL The goal of this report is to offer state and regional transportation planners necessary information regarding future freight flows specific to the apple industry. This is accomplished by providing general industry information regarding the prospects for increased trade and production growth and also projecting statewide apple production over the next twenty years. This projection was conducted at the Township, Section, and Range level and is then allocated to truck shipments and highways using information and data collected from a recent survey of the apple industry regarding transportation characteristics of the industry. ii

4 INDUSTRY INFORMATION In 2002, an estimated 15.8 pounds of fresh-market apples and 26.4 pounds of processed apples were consumed by the average U.S. consumers. Apples are considered one of the top volume items in the average supermarket produce department. Approximately 2,200 varieties of apples are grown in the United States, of which 100 varieties are grown commercially. While all 50 states grow apples, only 36 of the states grow apples on a commercial basis [1]. The top five apple producing states in the U.S. are Washington, New York, Michigan, Pennsylvania and California. Washington State provides more than half of the apples grown in the U.S. The other states grow less than one third of the Washington State apple production [2]. In 2006/2007, 6,321.8 million pounds of fresh apples were produced in the U.S.; 4,267.7 million pounds were imported, adding up to the total supply of 6,749.5 million pounds. 1,406.5 million pounds were exported, while 5,343 million pounds were consumed domestically. The per capita U.S. consumption was pounds per capita [3]. Approximately, 75% of Washington State apples are sold fresh while the remaining 25 % are processed into juice, sauce or dehydrated products. This large percentage of apples being sold fresh is somewhat unique to Washington State, since most other apple producing states market less than 50 % as fresh [2]. Washington State s apple production is concentrated in three primary geographical areas in the state: Yakima Valley, Wenatchee Valley, and the Columbia Basin [4]. The acreage devoted to apple production in each of these regions has changed over time, with the Yakima Valley and Wenatchee Valley regions decreasing in total acreage since 2001 and the Columbia Basin increasing acreage substantially since 2001 (Figure 1)

5 Figure 1: Washington State Main Apple Producing Regions and the Acreages Source: Washington Fruit Survey Highlights, Natural Agricultural Statistics Service September is the typical apple harvest period in the state, although some varieties are harvested as early as mid-august and as late as October. In order to produce apples faster and increase harvest efficiency growers use "dwarf trees" in high density plantings. This allows the growers to respond to consumer demands and increase the growers return on investment [4]. Washington exports several varieties of apples including red delicious which is often exported Mexico, Hong Kong, Indonesia, Saudi Arabia, Singapore, Malaysia, Colombia, Brazil, the Philippines and Thailand [2]. ECONOMIC OUTLOOK Domestic versus International As the U.S. consumers food choices move toward a more healthy combination of fruit and vegetables, apple consumption on a per capita basis may be expected to increase domestically. This increased per capita consumption is expected to increase even though domestic market prices are currently high and supplies tight. The competition from the snack food industry is neutralized by the availability of new processed apple - 2 -


6 products. Based on the U.S. Apple Association Market News, May 1, 2007, total fresh apple holdings in storage decreased 5 % by May 1, 2007 compared to May 1, However, tropical fruit choices from Central and South America may put some downward pressure on U.S. apple consumption [5]. U.S. apple export quantities declined between the marketing years 2005/2006 to 2006/2007 in all top markets except Canada, India and United Kingdom. Total export market values were not affected by the decrease in the overall export quantity. A 14 % increase in the export market value was observed, increasing to $480 million through March of the marketing year 2006/2007. The main drivers of the increase in the export value were strong prices going to Canada and Taiwan [6]. The U.S. is Mexico s largest apple supplier, followed by Chile. Markets in India and Taiwan also increased concerns regarding the apple trade [6]. During the marketing years 2006/2007, U.S exports to Taiwan, and Mexico decreased, while the exports to Canada increased. A decline in the Mexican market was due to the challenge of fixed supplies, higher domestic prices and anti-dumping duties. Overall, total U.S. exports decreased compared to the marketing years 2005/2006 (Figure 2). Figure 2: U.S. Exports Source: World Markets and Trade, US Department of Agriculture, Foreign Agricultural Service, May


7 U.S. apples are not currently allowed to enter into South Korean market. Access to South Korea for U.S. apples is currently limited by phyto-sanitary rules and trade restrictions. However, as the U.S. works to improve trade relations and reduce the tariff rates the South Korean market is considered an opportunity for future U.S. apples [6]. The global supply of apples has increased over time, primarily due to investments in apple orchards in China. The global supply of apples increased 20 percent between 2006 and 2007, due primarily to China s increased apple supply. China is the main driving force behind changes in the global apple production [6]. China s apple consumption is also increasing and is considered the contributing factor to increasing apple consumption worldwide. Thus, apple production in China has been growing in response to the increasing demand for apples. Improved transportation infrastructure and increased availability of cold storage facilities and capacity has also facilitated the growth of the apple industry in China [5]. While Turkey, Spain, Italy, Russia and Australia have experienced decreasing apple production, New Zealand, Argentina and Chile have increased their apple production. Total apple exports from the major traders are forecasted at 4.6 million tons [6]. The global apple market is principally shared among China, Chile, New Zealand, U.S., European Union, South Africa, Brazil and Argentina (Figure 3). Russia is the world s fifth-largest market for fruit consumption and is considered a major growing market for apple exports. A small portion of Russia s apple imports is received from the U.S. [6]. Figure 3: Global Apple Export Market Share - 4 -

8 Source: World Markets and Trade, US Department of Agriculture, Foreign Agricultural Service, May 2007 Washington Outlook In year 2006, Washington State apple production stayed stable, but contributions from New York and Michigan area increased the national total. Yet, Washington State apple production continues to be the largest and the main driver of the changes in US apple production. Apples are still the largest agricultural cash crop for the State, worth $1.4 billion in 2006, despite the recent declines. According to the U.S. Department of Agriculture's National Agriculture Statistics Service, the 2007 apple crop of 5.4 billion pounds was approximately 4 percent less than 2006 s. The mega retail stores contributed to the trend toward larger orchards [7]. Market prices for Washington State apples have been increasing due to the new markets opening up in Mexico and China. The higher quality apples of Washington State are demanded over the diminishing quality apples in the East Coast [5]. Approximately 45,000-50,000 people are employed in harvesting the crop. During the peak of harvest, approximately 35,000 to 45,000 pickers are in the fields [2]. The cost of producing an acre of apples varies between $4,800 and $6,600 with the greatest portion of the expenses being distributed among picking, pruning and hand fruit thinning operations. In addition to those expenses, packing and marketing costs $4,200 to $5,000 per average acre of production, which is about half of the labor costs [8]. The number of warehouses packing and shipping apples in the state is approximately 125. The number of boxes shipped varies from 25,000 to 2,000,000 annually [2]. Depending on the production, fruit quality, and variety, the average break-even price for a box of apples is about $ It costs around $6.50 to $8.50 to store and pack of box of fruit. In 2000, the industry received an average of $11.97 per box sold, but only about $10 was for the common varieties, with some specialty varieties receiving a premium [8]

9 As indicated earlier, apples ranked first for value of production for the state in The value of production for 2005 totaled $1.23 billion, 25 percent higher than in The higher average price was the main driver of the increase in the value of production [9]. In ,650 million pounds were produced in Washington State. Value of the utilized production was $1,386, ,350 million pounds of the production was sent to fresh markets, 1,300 million pounds were processed, 140 million pounds were canned, and 820 million pounds were turned into cider or juice, the rest 340 million pounds were used for other purposes [10]. Red Delicious, Gala, Granny Smith, Fuji and Golden Delicious were the top five varieties produced in year Table 1: Export Value and Share of Fresh Apple Production in Washington State Year Value of Washington Fresh Apples Exports ($ million) Proportion of Total State Exports Source: Total U.S. Exports (Origin of Movement) via WASHINGTON, Foreign Trade Statistics The total value of Washington State fresh apple exports has increased from 248 million dollars in 2003 to 389 million dollars in 2006, while the percentage share of fresh apple exports stayed about the same at 0.70 % (Table 2). As indicated earlier, apple production is heavily concentrated in three primary areas in Washington State: the Columbia Basin, Yakima Valley, and Wenatchee apple production regions. The 2006 production is provided at the Township, Section and Range level in million pounds in Figure

10 7
11 STATEWIDE TRANSPORTATION AND LOGISTICS Washington State is served by a multi-modal transportation system, consisting of water, rail and trucks. While many fruits and vegetables were historically shipped via rail from the State of Washington, truck transport has been by far the most used modal alternative for the majority of fresh fruit and vegetables recently [11]. Based on the survey conducted by SFTA in 2001, trucks are considered the preferred choice for the transport of apples into and out of the packing facility [12]. STATEWIDE FREIGHT PROJECTIONS Apple acreage data for the state were received from the Washington State Department of Agriculture. The township-range-section (TRS) level acreage data used in this study is the compilation of results from a series of surveys conducted by the Department of Agriculture between 1999 and The 2002 acreage information for each county (the most extensive of the prior years) was used to calculate the production proportion attributed to each county and town-range-section. The annual apple production figures for each county were then allocated to the TRS level by using yield and acreage information, while controlling for actual production in each county. Thus, future projections of statewide apple production are allocated to local geographic areas utilizing this procedure. An average annual growth rate of % was estimated from historical production volumes and used to forecast the production volumes between 2007 and The production levels for the years 2007, 2012, 2017 and 2027 were projected at the TRS level. The average annual growth rate from historical production information dating back to 1980 was very high at %. However, considering the recent industry reports and industry analyses, it was considered unlikely that Washington State will experience that same level of apple production growth over the next 20 years. Thus, the forecast utilizes a more modest annual growth rate of 0.007%. The forecasted statewide apple production for the years 2007 through 2027 are provided in Table 2, along with the growth rates for each time period. Historical and projected 8
![vegetables recently [11]. Based on the survey conducted by SFTA in 2001, trucks are considered the preferred choice for the transport of apples into and out of the packing facility [12].](/docs-images/51/13426564/images/page_11.jpg "STATEWIDE FREIGHT PROJECTIONS Apple acreage data for the state were received from the Washington State Department of Agriculture.")
12 statewide production is also demonstrated below in Figure 8. The blue bars indicate the historical production volumes and the red represents forecasted figures. Table 2: Base year and forecasted Apple Production Years Annual Growth Rate Year Production in Tons ,580, ,672, ,767, ,967,106 Figure 5: Historical and Projected Statewide Apple Production 4,000,000 Apple Production (In Tons) 3,500,000 3,000,000 2,500,000 2,000,000 1,500,000 1,000, , The forecasted apple production for each region is provided in Figure 6. The forecasted production volumes for the state and by each region are shown in Table 3. 9
 3,500,000 3,000,000 2,500,000 2,000,000 1,500,000 1,000,000 500,000 0")
13 Figure 6: Projected Apple Production, by Region 3,000,000 Apple Production T o n s 2,000,000 1,000, (Forecast) 2012 (Forecast) 2017 (Forecast) 2027 (Forecast) Yakima Valley Columbia Basin Wenatchee Table 3: Apple Production (in Tons) for the State, by Region 2006 Year Washington State Yakima Valley Columbia Basin Wenatchee Valley 2,562,797 1,017, , , (Forecast) 2012 (Forecast) 2017 (Forecast) 2027 (Forecast) 2,580,736 1,024, , ,998 2,672,336 1,060, , ,063 2,767,186 1,098, , ,981 2,967,106 1,178, , ,503 Based on 2006 apple production, Yakima Valley will produce the highest volume of apples, while Wenatchee Valley, of the three main regions, will produce the lowest volume of apples in Washington State (Table 3). HIGHWAY ASSIGNMENTS In order to convert the tons of apple production into truck load equivalents, for assignment to highway usage, a per-truck capacity for fresh apples was assumed to be 22 tons. During the calculations of the truckloads, 100 percent of the state apple 10

14 production was assumed to be utilized fresh. In addition, 95 percent of the apples are assumed to be shipped by truck, while the rest is shipped by rail. Each apple production region is forecasted separately and then converted into truck equivalents leaving each region. The information of how shipments leave and which highways are traversed to each destination were obtained from the SFTA industry survey which was designed to capture information concerning the timing, size, origins, destinations, routes, and shipping characteristics of Washington apple movements. The total volumes of production for each production region and the total number of truck loads required to transport fresh apples to their final destinations are shown below in Tables 4 through 6. Volumes in each table represent 95 percent of the region s total apple production. Unique truck loads are calculated by dividing the total volume by 22. Table 4: Apple Production (in Tons) and Total Truck Loads for Yakima Valley Yakima Valley Volume (Tons) Unique Truck Loads Fresh 2007 (Forecast) 953,244 46, (Forecast) 987,078 48, (Forecast) 1,022,113 49, (Forecast) 1,095,957 53,545 Table 5: Apple Production (in Tons) and Total Truck Loads for Columbia Basin Columbia Basin Volume (Tons) Unique Truck Loads Fresh 2007 (Forecast) 696,927 34, (Forecast) 721,663 35, (Forecast) 747,277 36, (Forecast) 801,266 39,148 11

15 Table 6: Apple Production (in Tons) and Total Truck Loads for Wenatchee Wenatchee Volume (Tons) Unique Truck Loads Fresh 2007 (Forecast) 630,779 30, (Forecast) 653,167 31, (Forecast) 676,350 33, (Forecast) 725,214 35,432 Among the three main apple production regions in Washington State, the Yakima Valley requires the most total number of truck loads to transport the fresh apples to their final destinations. This is consistent with the region producing the largest volume of apples. Figure 7: Major Marketing Regions for Washington Apples % Major Marketing Regions for Washington Apples 16.5% 16.3% 14.8% 14.0% % 8.3% 6.3% Northeastern US Southeastern US Midwest/Great Plains Southwestern US Pacific Northwest Port Mexico Canada Source: SFTA Apple Survey Major marketing regions for Washington State apples are illustrated in Figure 7. Aggregate percentage volumes for Mexico, Port (export ports such as the Ports of Seattle, Tacoma and Portland) and Canada represent the total export percentages. 12

16 Approximately 30 percent of the state apple production is exported, while 70 percent gets shipped to the eastern and western cities of United States. Based on the SFTA Apple Survey, key highways used for transportation of apples are US 97, US 12, US 2, SR 28, SR 281, SR 124, I-82, I-182 and I-90. Increased production in Columbia Basin increased stress on both the SR 124 and I-82 corridors. Key corridors for apples are US 97 and I-82. Significant volumes of the total production are transported over I-90 for export, and some for distribution in western Washington. Ninety-five percent of each region s production was weighted against Washington State s total apple production in 2006 to calculate the truck shipment percentages; for Yakima Valley, for Columbia Basin and for Wenatchee. Each apple producing region was assumed to transport fresh apples to each of the final destinations illustrated in Figure 7. The percentages in Figure 7 were multiplied with the total volume of apples shipped by trucks in Washington State to calculate the total apple volume to be shipped to the final destinations for years 2007, 2012, 2017 and The total apple volumes shipped to each destination was multiplied with the truck shipment percentages calculated for each region. After the distribution of the volumes from each region to final destinations was completed, the volumes were divided by 22 to reach the final truck load numbers. 13

17 14

18 Table 7: Number of Truck Shipments, by Highway for Yakima Valley Yakima Valley Highways US 12 41,163 42,624 44,137 47,325 US 97 41,163 42,624 44,137 47,325 I-90 19,100 19,777 20,479 21,959 US 2 5,763 5,967 6,179 6,626 I-82 35,400 36,656 37,958 40,700 I ,884 13,341 13,815 14,813 SR124 12,884 13,341 13,815 14,813 Total 46,573 48,226 49,938 53,545 Figure 8 illustrates the apple production intensity for Yakima Valley on the TRS level. On the map the highways in red are the most commonly used highways during the transportation of Washington State apples. Most commonly used routes for transportation Yakima Valley apples to the final destinations are US 12, US 97, I-90, US 2, I-82, I-182 and SR124. Table 7 shows the aggregate number truck loads on each highway during the transportation of Yakima Valley apples to their final destinations. The total value in the bottom row of each table represents the total unique truck trips for each year. Given that many of truck trip routes are common to several different highways, summation of trucks on all highways results in exceeding the total unique truck trips due to the fact that each truck trip is not unique to one and only one highway. 15

19 16

20 Table 8: Number of Truck Shipments, by Highway for Columbia Basin Columbia Basin Highways I-90 20,675 21,409 22,169 23,770 SR 28 20,675 21,409 22,169 23,770 US 2 4,213 4,363 4,518 4,844 I ,881 26,800 27,751 29,756 US 12 9,420 9,754 10,100 10,830 SR124 9,420 9,754 10,100 10,830 I-82 16,462 17,046 17,651 18,926 US 97 7,463 7,728 8,003 8,581 Total 34,050 35,258 36,510 39,148 The apple production intensity for Columbia Basin on the TRS level is illustrated in Figure 9. On the map the highways in red are the most commonly used highways during the transportation of Washington State apples. Most commonly used routes for transportation of Columbia Basin apples to the final destinations are US 12, US 97, I-90, US 2, I-82, I-182, SR124 and SR 28. The aggregate number truck loads on each highway during the transportation of Columbia Basin apples to their final destinations are shown in Table 8. The total value in the bottom row of each table represents the total unique truck trips for each year. Again, given that many of truck trip routes are common to several different highways, summation of trucks on all highways results in exceeding the total unique truck trips due to the fact that each truck trip is not unique to one and only one highway. 17

21 18
22 Table 9: Number of Truck Shipments, by Highway for Wenatchee Wenatchee Highways US 97 27,238 28,205 29,206 31,316 US 2 12,639 13,087 13,552 14,531 I-90 27,238 28,205 29,206 31,316 SR 28 22,744 23,551 24,387 26,149 SR 281 3,813 3,949 4,089 4,384 Total 30,818 31,912 33,045 35,432 The apple production intensity for Wenatchee on the TRS level is shown in Figure 10. On the map the highways in red are the most commonly used highways during the transportation of Washington State apples. Most commonly used routes for transportation of Wenatchee apples to the final destinations are US 97, I-90, US 2, SR 281 and SR 28. Table 8 shows the aggregate number truck loads on each highway during the transportation of Columbia Basin apples to their final destinations. The total value in the bottom row of each table represents the total unique truck trips for each year. Again, given that many of truck trip routes are common to several different highways, summation of trucks on all highways results in exceeding the total unique truck trips due to the fact that each truck trip is not unique to one and only one highway
23 CONCLUSIONS The SFTA Apple Survey results and further analysis of future apple production and future total truck trips required to ship the apples to their final destinations allow conclusions to be drawn regarding the future transportation characteristics of Washington apples, logistic uses and needs of the Washington State apple industry, as follows: Truck to final destination is the most commonly used transportation mode in all three apple-growing regions. Commercial truck companies are the main shipping service provider for Washington apple shipments. Over the next several years, with the addition of RailEx in Walla Walla, there may be more volume moving by rail to domestic markets. Major domestic destinations of Washington apple outside the State are Southeastern US, Midwest/Great Plains, Northeastern US, Southwestern US and Pacific Northwest. A significant portion of the apple production goes to Washington State ports to be transported to their final destinations. Canada and Mexico are the other two significant export destinations. The most heavily used routes during the transportation of fresh transportation of fresh apples are US 97, US 12, US 2, SR 28, SR 281, SR 124, I-82, I-182 and I-90. Key corridors for apples are US 97 and I-82. Increased production in Columbia Basin increased stress on SR 124 and I-82 corridors. A significant volume of the total production is transported over I-90 for export, and/or distribution in Western Washington
24 REFERENCES [1] [2] TED Case Studies; U.S. Apples Are Not So Red Delicious, [3] Fruit and Tree Nuts Situation and Outlook Yearbook, USDA, October 2007, [4] Washington Apple Orchards, Apple Journal, [5] 2007 Washington State Apples Demand Is Strong Prices Pushing Higher... Where It Stops, Nobody Knows, Nov 29, 2007, [6] World Markets and Trade, US Department of Agriculture, Foreign Agricultural Service, May 2007, [7] Washington's apple industry on rebound December 11, 2007, [8] General Production Information, Updated August, 2002, Apples in Washington State, [9] 2006 Washington Annual Agriculture Bulletin, ats,% pdf [10] Apples, Washington, NASS, Washington Field Office, [11] Value of Modal Competition for Transportation of Washington Fresh Fruits and Vegetables, SFTA Research Report #3, December 2002, [12] Transportation Characteristics of the Washington Fruit and Vegetable Industry, SFTA Steering Committee, June 2003,
Review of Canadian Apple Market & Trends
 Review of Canadian Apple Market & Trends 215 Mid-Summer Meeting- Canadian Apple Industry Wolfville, NS August 4 th, 215 Farid Makki Sector Development & Analysis Directorate Agriculture and Agri-Food Canada
The Role of Banks in Global Mergers and Acquisitions by James R. Barth, Triphon Phumiwasana, and Keven Yost *
 The Role of Banks in Global Mergers and Acquisitions by James R. Barth, Triphon Phumiwasana, and Keven Yost * There has been substantial consolidation among firms in many industries in countries around
A BRIEF LOOK AT THE WASHINGTON APPLE INDUSTRY: PAST AND PRESENT
 A BRIEF LOOK AT THE WASHINGTON APPLE INDUSTRY: PAST AND PRESENT By R. Thomas Schotzko Extension Economist Washington State University David Granatstein, Area Extension Educator, Center for Sustainable
Global Investing 2013 Morningstar. All Rights Reserved. 3/1/2013
 Global Investing 2013 Morningstar. All Rights Reserved. 3/1/2013 World Stock Market Capitalization Year-end 2012 18.5% 9.6% United States International: Other Europe United Kingdom Japan Other Pacific
Strawberry Industry Overview and Outlook. Feng Wu Research Associate Gulf Coast Research and Education Center University of Florida fengwu@ufl.
 Strawberry Industry Overview and Outlook Feng Wu Research Associate Gulf Coast Research and Education Center University of Florida [email protected] Zhengfei Guan Assistant Professor Gulf Coast Research and
Commodity Profile: Tomatoes, fresh market
 Agricultural Issues Center University of California Created October 25 Commodity Profile: Tomatoes, fresh market by Hayley Boriss, Junior Specialist Henrich Brunke, Assistant Specialist [email protected]
Foreign Taxes Paid and Foreign Source Income INTECH Global Income Managed Volatility Fund
 Income INTECH Global Income Managed Volatility Fund Australia 0.0066 0.0375 Austria 0.0045 0.0014 Belgium 0.0461 0.0138 Bermuda 0.0000 0.0059 Canada 0.0919 0.0275 Cayman Islands 0.0000 0.0044 China 0.0000
FACT SHEET Global Direct Selling
 Global 2011 Global Retail Sales: USD $153,727 million Global Sales Force The 91.5 million Direct Sellers who represent companies around the world are: 3 2 16% 9% 2% 3% 2% 3% 2% 3% Care 42% 2% 56% 3% 2
GLOBAL B2C E-COMMERCE DELIVERY 2015
 PUBLICATION DATE: OCTOBER 2015 PAGE 2 GENERAL INFORMATION I PAGE 3 KEY FINDINGS I PAGE 4-8 TABLE OF CONTENTS I PAGE 9 REPORT-SPECIFIC SAMPLE CHARTS I PAGE 10 METHODOLOGY I PAGE 11RELATED REPORTS I PAGE
U.S. Trade Overview, 2013
 U.S. Trade Overview, 213 Stephanie Han & Natalie Soroka Trade and Economic Analysis Industry and Analysis Department of Commerce International Trade Administration October 214 Trade: A Vital Part of the
Brochure More information from http://www.researchandmarkets.com/reports/3278449/
 Brochure More information from http://www.researchandmarkets.com/reports/3278449/ The 2016 World Forecasts of Hand-Operated Date, Sealing, or Numbering Stamps; Devices for Printing or Embossing Labels;
Apples Review of 2012/13 season Prognosfruit - Congress 2013 Helwig Schwartau, AMI
 Apples Review of 2012/13 season Prognosfruit - Congress 2013 Helwig Schwartau, AMI Market balance for table apples in EU-27 1.000 tons 2009/10 2010/11 2011/12 2012/13f Market production 10.984 9.651 10.663
U.S. Agriculture and International Trade
 Curriculum Guide I. Goals and Objectives A. Understand the importance of exports and imports to agriculture and how risk management is affected. B. Understand factors causing exports to change. C. Understand
2015 Growth in data center employment continues but the workforce is changing
 Published in Conjunction with MARKET BRIEFING GLOBAL DATA CENTER EMPLOYMENT 2015 2015 Growth in data center employment continues but the workforce is changing Globally, the number of people working in
Overview. Main Findings
 This Report reflects the latest trends observed in the data published in June. Remittance Prices Worldwide is available at http://remittanceprices.worldbank.org Overview The Remittance Prices Worldwide*
Consumer Credit Worldwide at year end 2012
 Consumer Credit Worldwide at year end 2012 Introduction For the fifth consecutive year, Crédit Agricole Consumer Finance has published the Consumer Credit Overview, its yearly report on the international
The Washington Apple Industry
 The Washington Apple Industry August 29, 2012 Contributions to the State Economy and the Important Role of Exports By Globalwise Inc., Vancouver, WA In Association with Belrose Inc., Pullman, WA Washington
Overview. Main Findings
 This Report reflects the latest trends observed in the data published in March 2014. Remittance Prices Worldwide is available at http://remittanceprices.worldbank.org Overview The Remittance Prices Worldwide*
Wheat Transportation Profile
 Wheat Transportation Profile Agricultural Marketing Service / Transportation and Marketing Programs November 2014 Marina R. Denicoff Marvin E. Prater Pierre Bahizi Executive Summary America s farmers depend
The Washington Apple Industry
 The Washington Apple Industry June 20, 2014 Updated Evaluation of Contributions to the State Economy and the Important Role of Exports By Globalwise Inc., Vancouver, WA In Association with Belrose Inc.,
Brochure More information from http://www.researchandmarkets.com/reports/1339929/
 Brochure More information from http://www.researchandmarkets.com/reports/1339929/ The 2011 World Forecasts of Machine Tools That Remove Material by Laser or Light, Photon, Ultrasonic, Electro-Discharge,
BANK FOR INTERNATIONAL SETTLEMENTS P.O. BOX, 4002 BASLE, SWITZERLAND
 BANK FOR INTERNATIONAL SETTLEMENTS P.O. BOX, 4002 BASLE, SWITZERLAND PRESS RELEASE CENTRAL BANK SURVEY OF FOREIGN EXCHANGE AND DERIVATIVES MARKET ACTIVITY IN APRIL 1998: PRELIMINARY GLOBAL DATA The BIS
GLOBAL DATA CENTER INVESTMENT 2013
 2013 CENSUS REPORT: Global Data Center Investment 2013 GLOBAL DATA CENTER INVESTMENT 2013 2013 - Healthy Growth in Data Center Investment Globally Globally, the data center industry has continued to maintain
New York apple growers are reeling
 Trends In Apple Marketing and Impacts on NY Growers Profitability Gerald B. White Department of Agricultural, Resource, and Managerial Economics, Cornell University, Ithaca, NY New York apple growers are
List of tables. I. World Trade Developments
 List of tables I. World Trade Developments 1. Overview Table I.1 Growth in the volume of world merchandise exports and production, 2010-2014 39 Table I.2 Growth in the volume of world merchandise trade
Wheat Import Projections Towards 2050. Chad Weigand Market Analyst
 Wheat Import Projections Towards 2050 Chad Weigand Market Analyst January 2011 Wheat Import Projections Towards 2050 Analysis Prepared by Chad Weigand, Market Analyst January 2011 Purpose The United Nations
GLOBAL ONLINE PAYMENT METHODS: FIRST HALF 2015
 PUBLICATION DATE: JULY 2015 PAGE 2 GENERAL INFORMATION I PAGE 3 KEY FINDINGS I PAGE 4-9 TABLE OF CONTENTS I PAGE 10 REPORT-SPECIFIC SAMPLE CHARTS I PAGE 11 METHODOLOGY I PAGE 12 RELATED REPORTS I PAGE
Biomass Pellet Prices Drivers and Outlook What is the worst that can happen?
 Biomass Pellet Prices Drivers and Outlook What is the worst that can happen? European Biomass Power Generation 1st October 2012 Cormac O Carroll Director, London Office Pöyry Management Consulting (UK)
Global payments trends: Challenges amid rebounding revenues
 34 McKinsey on Payments September 2013 Global payments trends: Challenges amid rebounding revenues Global payments revenue rebounded to $1.34 trillion in 2011, a steep increase from 2009 s $1.1 trillion.
S T R A W B E R R Y E X P O R T R E P O R T. Figure 1: California Export Trends
 S R A W B E R R Y E X P O R R E P O R he Strawberry Export Report is published annually and reflects trends for total fresh and frozen exports and major export countries. Data is compiled by the U.S. Census
Sensitive handling of your sensitive shipments
 Sensitive handling of your sensitive shipments 2013 Hellmann Perishable Logistics primusgf S HPL Mission & Vision Statement Insuring expertise and quality for transport and handling of perishables HPL
Apples. Industry & Trade Summary
 Apples Industry & Trade Summary Office of Industries Publication ITS-04 February 2010 UNITED STATES INTERNATIONAL TRADE COMMISSION COMMISSIONERS Shara Aranoff, Chairman Daniel R. Pearson, Vice Chairman
The Global Chemical Industry: US, China and Global Status and Opportunities, 2015
 The Global Chemical Industry: US, China and Global Status and Opportunities, 2015 August 28, 2005 American Chemical Society Martha Gilchrist Moore Moore Economics [email protected] Opportunities
IOOF QuantPlus. International Equities Portfolio NZD. Quarterly update
 IOOF QuantPlus NZD Quarterly update For the period ended 31 March 2016 Contents Overview 2 Portfolio at glance 3 Performance 4 Asset allocation 6 Overview At IOOF, we have been helping Australians secure
IMD World Talent Report. By the IMD World Competitiveness Center
 2014 IMD World Talent Report By the IMD World Competitiveness Center November 2014 IMD World Talent Report 2014 Copyright 2014 by IMD: Institute for Management Development, Lausanne, Switzerland For further
DSV Air & Sea, Inc. Aerospace Sector. DSV Air & Sea, Inc. Aerospace
 DSV Air & Sea, Inc. Aerospace Sector DSV Air & Sea, Inc. Aerospace Introduction to DSV DSV is a global supplier of transport and logistics services. We have offices in more than 70 countries and an international
Soybean Supply and Demand Forecast
 Soybean Supply and Demand Forecast U.S. soybean planted acreage is expected to increase 11.5 million acres over the forecast period. U.S. soybean yields are expected to increase 7 bushels per acre or an
Digital vs Traditional Media Consumption
 Digital vs Traditional Media Consumption Summary Comparing time spent on traditional and digital media at a global level as well as analyzing behaviors between countries and across the age groups GWI Q3
Trends in International Moving
 95 th ANNUAL CMSA CONVENTION MAY 2013 Trends in International Moving Terry Head, President International Association of Movers IAM Who are we? The largest international trade association and advocacy group
World Consumer Income and Expenditure Patterns
 World Consumer Income and Expenditure Patterns 2014 14th edi tion Euromonitor International Ltd. 60-61 Britton Street, EC1M 5UX TableTypeID: 30010; ITtableID: 22914 Income Algeria Income Algeria Income
Reporting practices for domestic and total debt securities
 Last updated: 4 September 2015 Reporting practices for domestic and total debt securities While the BIS debt securities statistics are in principle harmonised with the recommendations in the Handbook on
Appendix 1: Full Country Rankings
 Appendix 1: Full Country Rankings Below please find the complete rankings of all 75 markets considered in the analysis. Rankings are broken into overall rankings and subsector rankings. Overall Renewable
GLOBAL DATA CENTER SPACE 2013
 2013 CENSUS REPORT: Global Data Center Space 2013 GLOBAL DATA CENTER SPACE 2013 Top 3 data center markets account for almost half of all global data center space. In spite of a slowdown in the amount of
HAS BRAZIL REALLY TAKEN OFF? BRAZIL LONG-RUN ECONOMIC GROWTH AND CONVERGENCE
 HAS BRAZIL REALLY TAKEN OFF? BRAZIL LONG-RUN ECONOMIC GROWTH AND CONVERGENCE COUNTRY PROFILE: A COUNTRY IN TRANSFORMATION POLICY RECOMENDATIONS COUNTRY PROFILE Brazilian Equivalent Population in The World
Global Cashew Nut Industry Report
 Brochure More information from http://www.researchandmarkets.com/reports/310379/ Global Cashew Nut Industry Report Description: Cashew a native of Eastern Brazil was introduced to India by the Portuguese
Foods With Healthy Supplements and Organics Have Room for Growth
 Foods With Healthy Supplements and Organics Have Room for Growth Major Perception Gaps Across the Globe Towards Fortified and Organic Foods Popularity Held Back by Pricy Image, Niche Distribution and Credibility
Australia s position in global and bilateral foreign direct investment
 Australia s position in global and bilateral foreign direct investment At the end of 213, Australia was the destination for US$592 billion of global inwards foreign direct investment (FDI), representing
Thailand s Logistics
 Thailand s Logistics Over the past fourteen years, overall international trade with Thailand has grown 340% and manufacturing trade 370%; this growth, aided in part by the nation s bilateral trade agreements
Global Effective Tax Rates
 www.pwc.com/us/nes Global s Global s April 14, 2011 This document has been prepared pursuant to an engagement between PwC and its Client. As to all other parties, it is for general information purposes
The Role of Emerging and New Markets in the Shrimp Trade & Value Addition. Fatima Ferdouse INFOFISH
 The Role of Emerging and New Markets in the Shrimp Trade & Value Addition Fatima Ferdouse INFOFISH Shrimp Trade : Domestic and International Shrimp is one of the most popular seafood traded and consumed
Ghana South Korea United States. Real GDP per capita (2005 dollars) Per centage of 1960 real GDP per capita. 2009 real GDP per capita
 Per centage of 1960 real GDP per capita. 2009 real GDP per capita") Long-Run Economic Growth chapter: 24 9 ECONOMICS MACROECONOMICS 1. The accompanying table shows data from the Penn World Table, Version 7.0, for real GDP in 2005 U.S. dollars for Argentina, Ghana, South
Long-Run Economic Growth chapter: 24 9 ECONOMICS MACROECONOMICS 1. The accompanying table shows data from the Penn World Table, Version 7.0, for real GDP in 2005 U.S. dollars for Argentina, Ghana, South
British Columbia Apple Industry
 British Columbia Apple Industry September 2012 Strategic Choices and Directions for the Next Decade By Globalwise Inc., Vancouver, WA In Association with Belrose Inc., Pullman, WA British Columbia apple
Fresh Connections: China
 Fresh Connections: China China Market Overview Mabel Zhuang, PMA China Consultant M.Z. Marketing Communications March 20, 2014 Overview 1. Background 2. Production 3. Trade & Distribution 4. Trends Background:
Triple-play subscriptions to rocket to 400 mil.
 Triple-play criptions to rocket to 400 mil. Global triple-play criptions will reach 400 million by 2017; up by nearly 300 million on the end-2011 total and up by 380 million on the 2007 total, according
Appendix SM1: Sources of Modal Data and Calculation of Modal Shares
 Online Appendix for Trade and the Greenhouse Gas Emissions from International Freight Transport, Cristea Anca, David Hummels, Laura Puzzello and Avetisyan Misak: Supplementary Materials The supplementary
Global Media Report. Global Industry Overview
 Global Media Report 203 Global Industry Overview McKinsey & Company Global Media Report 203 McKinsey & Company s Global Media and Entertainment Practice Never before has an integrated view across the media
Global Dynamism Index (GDI) 2013 summary report. Model developed by the Economist Intelligence Unit (EIU)
 2013 summary report. Model developed by the Economist Intelligence Unit (EIU)") Global Dynamism Index (GDI) 2013 summary report Model developed by the Economist Intelligence Unit (EIU) What is the Global Dynamism Index (GDI)? the GDI assesses the dynamism of 60 of the world's largest
Global Dynamism Index (GDI) 2013 summary report Model developed by the Economist Intelligence Unit (EIU) What is the Global Dynamism Index (GDI)? the GDI assesses the dynamism of 60 of the world's largest
Assessing China s Merchandise Trade Data Using Mirror Statistics
 Assessing China s Merchandise Trade Data Using Mirror Statistics Iris Day* Given their timeliness, Chinese trade data have the potential to provide a useful early read on conditions in the Australian and
SUPPLEMENTAL EXECUTIVE RETIREMENT PLANS IN CANADA
 HEALTH WEALTH CAREER SUPPLEMENTAL EXECUTIVE RETIREMENT PLANS IN CANADA KEY FINDINGS FROM THE MERCER SERP DATABASE (2014 UPDATE) APRIL 2015 b CONTENTS 1. Introduction...2 2. Highlights of the Mercer SERP
A Business Newsletter for Agriculture. Vol. 12, No. 1 www.extension.iastate.edu/agdm. Energy agriculture - where s the nitrogen?
 A Business Newsletter for Agriculture Vol. 12, No. 1 www.extension.iastate.edu/agdm November 2007 Energy agriculture - where s the nitrogen? by Don Hofstrand, value-added agriculture specialist, co-director
A Nielsen Report Global Trust in Advertising and Brand Messages. April 2012
 A Nielsen Report Global Trust in Advertising and Brand Messages April 2012 CONSUMER TRUST IN EARNED ADVERTISING GROWS IN IMPORTANCE Earned media sources remain most credible Trust in traditional paid advertising
Sulfuric Acid 2013 World Market Outlook and Forecast up to 2017
 Brochure More information from http://www.researchandmarkets.com/reports/2547547/ Sulfuric Acid 2013 World Market Outlook and Forecast up to 2017 Description: Sulfuric Acid 2013 World Market Outlook and
Trade Creates Jobs for Indiana
 Trade Creates Jobs for Indiana Creating and preserving quality U.S. jobs is a goal shared by all Americans. With 95 percent of the world s consumers living outside of the United States, it makes sense
BT Premium Event Call and Web Rate Card
 BT Managed Event and BT Self-Managed Event (also referred to as Express, Plus and Premium) Conference Bridge and Call for Booked Audio Conferencing Services will comprise the following for each phone-conference:
GLOBAL HRMONITOR NEW DIMENSIONS IN ONLINE HR INFORMATION TALENT HEALTH RETIREMENT INVESTMENTS
 GLOBAL HRMONITOR NEW DIMENSIONS IN ONLINE HR INFORMATION TALENT HEALTH RETIREMENT INVESTMENTS DISCOVER MERCER S GLOBAL HRMONITOR ABOUT GLOBAL HRMONITOR Mercer s Global HRMonitor is a single-source, web-based
STATE OF GLOBAL E-COMMERCE REPORT (Preview) February 2013
 February 2013") STATE OF GLOBAL E-COMMERCE REPORT (Preview) February 2013 THE E-COMMERCE REPORT WHAT IS THE E-COMMERCE REPORT? It is an annual investigation into the global uptake and impact of e- commerce. The report
STATE OF GLOBAL E-COMMERCE REPORT (Preview) February 2013 THE E-COMMERCE REPORT WHAT IS THE E-COMMERCE REPORT? It is an annual investigation into the global uptake and impact of e- commerce. The report
Chart 1: Zambia's Major Trading Partners (Exports + Imports) Q4 2008 - Q4 2009. Switzernd RSA Congo DR China UAE Kuwait UK Zimbabwe India Egypt Other
 Q4 2008 - Q4 2009. Switzernd RSA Congo DR China UAE Kuwait UK Zimbabwe India Egypt Other") Bank of Zambia us $ Million 1. INTRODUCTION This report shows Zambia s direction of merchandise trade for the fourth quarter of 2009 compared with the corresponding quarter in 2008. Revised 1 statistics,
Bank of Zambia us $ Million 1. INTRODUCTION This report shows Zambia s direction of merchandise trade for the fourth quarter of 2009 compared with the corresponding quarter in 2008. Revised 1 statistics,
South Asia Best Entry and Recruitment Strategies for International Universities
 South Asia Best Entry and Recruitment Strategies for International Universities By : Abhijit Zaveri Managing Director Career Mosaic Pvt Ltd ( An AIRC Certified Company ) Focus points: Recruitment strategies
How To Get A New Phone System For Your Business
 Cisco Phone Systems Telemarketing Script Cold Call 1. Locate Contact: Name listed Owner General Manager / Office Manager Chief BDM (Business Decision Maker) Note: Avoid talking to IT since this is not
Corn Transportation Profile
 Corn Transportation Profile AMS Transportation and Marketing Programs August 2014 Marina R. Denicoff Marvin E. Prater Pierre Bahizi Executive Summary America s farmers depend on transportation as the critical
Overview of China s Timber Imports & Exports. Lacey/EUTR Workshop: Barcelona Apr 14, 2015
 Overview of China s Timber Imports & Exports Lacey/EUTR Workshop: Barcelona Apr 14, 215 Agenda China s timber imports - Main products? - Main supplier countries? - Hardwood vs softwood China s timber exports
Global growth rates Macroeconomic indicators CEDIGAZ Reference Scenario
 Medium and Long Term Natural Gas Outlook CEDIGAZ February 215 Global growth rates Macroeconomic indicators CEDIGAZ Reference Scenario 4 3 %/year 199-213 213-235 6 Main consuming markets - %/year (213-235)
Comparative tables. CPSS Red Book statistical update 427
 CPSS Red Book statistical update 427 January 2013 Table 1 Basic statistical data GDP (USD billions) 1 Population (millions, yearly average) Australia 952 1,050 999 1,246 1,500 21.1 21.4 21.8 22.1 22.4
WORLD. Geographic Trend Report for GMAT Examinees
 2011 WORLD Geographic Trend Report for GMAT Examinees WORLD Geographic Trend Report for GMAT Examinees The World Geographic Trend Report for GMAT Examinees identifies mobility trends among GMAT examinees
Fruit Juice Market - 04 April 2014
 Fruit Juice Market - 04 April 2014 OVERVIEW: The fruit juice market is presently in a fairly quiet phase largely due to flat demand. Supply is generally reported to be regular with the exceptions of peach
Chasing growth in a constrained environment
 Chasing growth in a constrained environment Bernard Fontana CEO June 14, 2012 Agenda 1 Drivers of demand growth 2 Allocating the asset footprint according to demand 3 Growth from customer excellence &
2012 Country RepTrak Topline Report
 2012 Country RepTrak Topline Report The World s View on Countries: An Online Study of the Reputation of 50 Countries RepTrak is a registered trademark of Reputation Institute. Global Reputation Knowledge
OUTLOOK FOR COMMERCIAL AND INDUSTRIAL REAL ESTATE FOR STATE OF WASHINGTON
 OUTLOOK FOR COMMERCIAL AND INDUSTRIAL REAL ESTATE FOR STATE OF WASHINGTON OUTLOOK FOR COMMERCIAL & INDUSTRIAL REAL ESTATE Contacted by Heber Kennedy from Geometrics Scott Carter Jones Lang LaSalle Gordon
PANDUIT Physical Layer Infrastructure Management. EMC Smarts Integration Module
 PANDUIT Physical Layer Infrastructure Management EMC Smarts Integration Module SM About PANDUIT A World Class Developer PANDUIT is a world class developer and provider of leading edge solutions that help
Cisco IT Data Center and Operations Control Center Tour
 Cisco IT Data Center and Operations Control Center Tour Inside the Build Room Page 1 of 8 5. Inside the Build Room Introduction Figure 1. Inside the Build Room Ian: The purpose of the Build room is for
GLOBAL OPPORTUNITIES FOR BUSINESS PROCESS OUTSOURCING SECTOR
 GLOBAL OPPORTUNITIES FOR BUSINESS PROCESS OUTSOURCING SECTOR * Dr. K. NIRMALA PRASAD, M.Com.M.Phil.,Ph.D. **Ms. H.S.PRIYADARSHINI, M.Com., M.Phil., Over the last few years, the worldwide Business Process
AN AUGMENTED TRADE-WEIGHTED INDEX OF THE AUSTRALIAN DOLLAR 1
 AN AUGMENTED TRADE-WEIGHTED INDEX OF THE AUSTRALIAN DOLLAR 1 Introduction Trade-weighted exchange rate indices provide a guide to a country s exchange rate against the currencies of its trading partners,
Preliminary Analysis of USDA s Organic Trade Data: 2011 to 2014
 REPORT TO THE ORGANIC TRADE ASSOCIATION Preliminary Analysis of USDA s Organic Trade Data: 2011 to 2014 Edward C. Jaenicke, Associate Professor, Penn State University, and Iryna Demko, Ph.D. Student, Penn
The wine market: evolution and trends
 The wine market: evolution and trends May 2014 1 Table of contents 1. WINE CONSUMPTION 3 2. TRENDS IN WORLD WINE TRADE IN 20 6 3. TOP WINE EXPORTERS IN 20 7 4. TOP WINE IMPORTERS IN 20 9 5. THE FIVE LARGEST
Open Doors 2011 Report on International Educational Exchange
 Open Doors 2011 Report on International Educational Exchange Produced by the Institute of International Education with support from the Bureau of Educational and Cultural Affairs of the U.S. Department
Contact Centre Integration Assessment
 Contact Centre Integration Assessment How well are your business objectives aligned with the right contact centre technologies? Knowing how the technology in your contact centre supports service delivery
A BETTER RETIREMENT PORTFOLIO FOR MEMBERS IN DC INVESTMENT DEFAULTS
 A BETTER RETIREMENT PORTFOLIO FOR MEMBERS IN DC INVESTMENT DEFAULTS JUNE 2014 TALENT HEALTH RETIREMENT INVESTMENTS EXECUTIVE SUMMARY The majority of defined contribution (DC) plan members typically end
Verdict Financial: Wealth Management. Data Collection and Forecasting Methodologies
 Verdict Financial: Wealth Management Data Collection and Forecasting Methodologies April 2014 Contents Global Wealth Markets Methodology Methodology Methodology 2 Global Wealth Markets Section 1: Global
Cotton and Wool Outlook
 Economic Research Service Situation and Outlook CWS-14h Release Date August 14, 2014 Cotton and Wool Outlook Leslie Meyer [email protected] Stephen MacDonald [email protected] Global Cotton Stocks
Doing Business in Australia and Hong Kong SAR, China
 Doing Business in Australia and Hong Kong SAR, China Mikiko Imai Ollison Private Sector Development Specialist Nan Jiang Private Sector Development Specialist Washington, DC October 29, 2013 What does
Image Lab Software for the GS-900 Densitometer
 Image Lab Software for the GS-900 Densitometer Quick Start Guide Catalog # 170-9690 Bio-Rad Technical Support For help and technical advice, please contact the Bio-Rad Technical Support department. In
Executive Summary 13. Estimated worldwide annual supply of industrial robots
 Executive Summary 13 Executive Summary 1. World Robotics 2015 Industrial Robots 2. World Robotics 2015 Service Robots 1. World Robotics 2015 Industrial Robots 2014: By far the highest volume ever recorded
The Case for International Fixed Income
 The Case for International Fixed Income June 215 Introduction Investing in fixed-income securities outside of the United States is often perceived as a riskier strategy than deploying those assets domestically,
ANNEX TABLES Table 1. Revenue by ICT Type Revenue * Share to Total Revenues Growth Rate ICT Type 2004 2005 2004 2005 (in percent)
") ANNEX TABLES Table 1. Revenue by Revenue * Share to Revenues 2004 2005 2004 2005 Contact Centers 32,904.1 54,295.1 44.4 49.4 65.0 Medical Transcription 236.7 466.2 0.3 0.4 97.0 Animation 694.2 939.1 0.9
ANNEX TABLES Table 1. Revenue by Revenue * Share to Revenues 2004 2005 2004 2005 Contact Centers 32,904.1 54,295.1 44.4 49.4 65.0 Medical Transcription 236.7 466.2 0.3 0.4 97.0 Animation 694.2 939.1 0.9
41 T Korea, Rep. 52.3. 42 T Netherlands 51.4. 43 T Japan 51.1. 44 E Bulgaria 51.1. 45 T Argentina 50.8. 46 T Czech Republic 50.4. 47 T Greece 50.
 Overall Results Climate Change Performance Index 2012 Table 1 Rank Country Score** Partial Score Tendency Trend Level Policy 1* Rank Country Score** Partial Score Tendency Trend Level Policy 21 - Egypt***
Open Doors 2013. Report on International Educational Exchange. Produced by the Institute of International Education. In partnership with the
 Open Doors 2013 Report on International Educational Exchange Produced by the Institute of International Education In partnership with the Bureau of Educational and Cultural Affairs U.S. Department of State
The State of Mobile Advertising Q2 2012
 Q2 2012 Executive summary In our first edition of the State of Mobile Advertising report, we take an in-depth look at the monetization of mobile advertising from four perspectives within the ad delivery