IMD World Talent Report. By the IMD World Competitiveness Center
|
|
|
- Beryl Rodgers
- 10 years ago
- Views:
Transcription
1 2014 IMD World Talent Report By the IMD World Competitiveness Center

2 November 2014 IMD World Talent Report 2014 Copyright 2014 by IMD: Institute for Management Development, Lausanne, Switzerland For further information, please contact the IMD World Competitiveness Center at: IMD 23, Ch. de Bellerive P.O. Box 915 CH-1001 Lausanne Switzerland Tel : Fax : Internet: eshop: [email protected] The IMD World Competitiveness Center team: At IMD Professor Arturo Bris Director of IMD World Competitiveness Center José Caballero Research Fellow Anne-France Borgeaud Pierazzi Senior Economist & Head of WCC Operations Madeleine Hediger Data Research and Online Services Specialist Carin Grydbeck Projects, Marketing and Press Coordinator William Milner Information Researcher Catherine Jobin Order and Sales administrator Luchia Mallet Programs and Client Relationship Associate Manager With the collaboration of IMD s Information Center and Information Systems Department At KAESCO Consulting Jean-François Kaeser We also have the privilege of collaborating with a unique network of Partner Institutes, and other organizations, which guarantees the relevance of the data gathered.

3 Table of Contents IMD World Talent Ranking Analysis... 3 IMD World Talent Ranking Factor Rankings Criteria Notes and Sources Partner Institutes

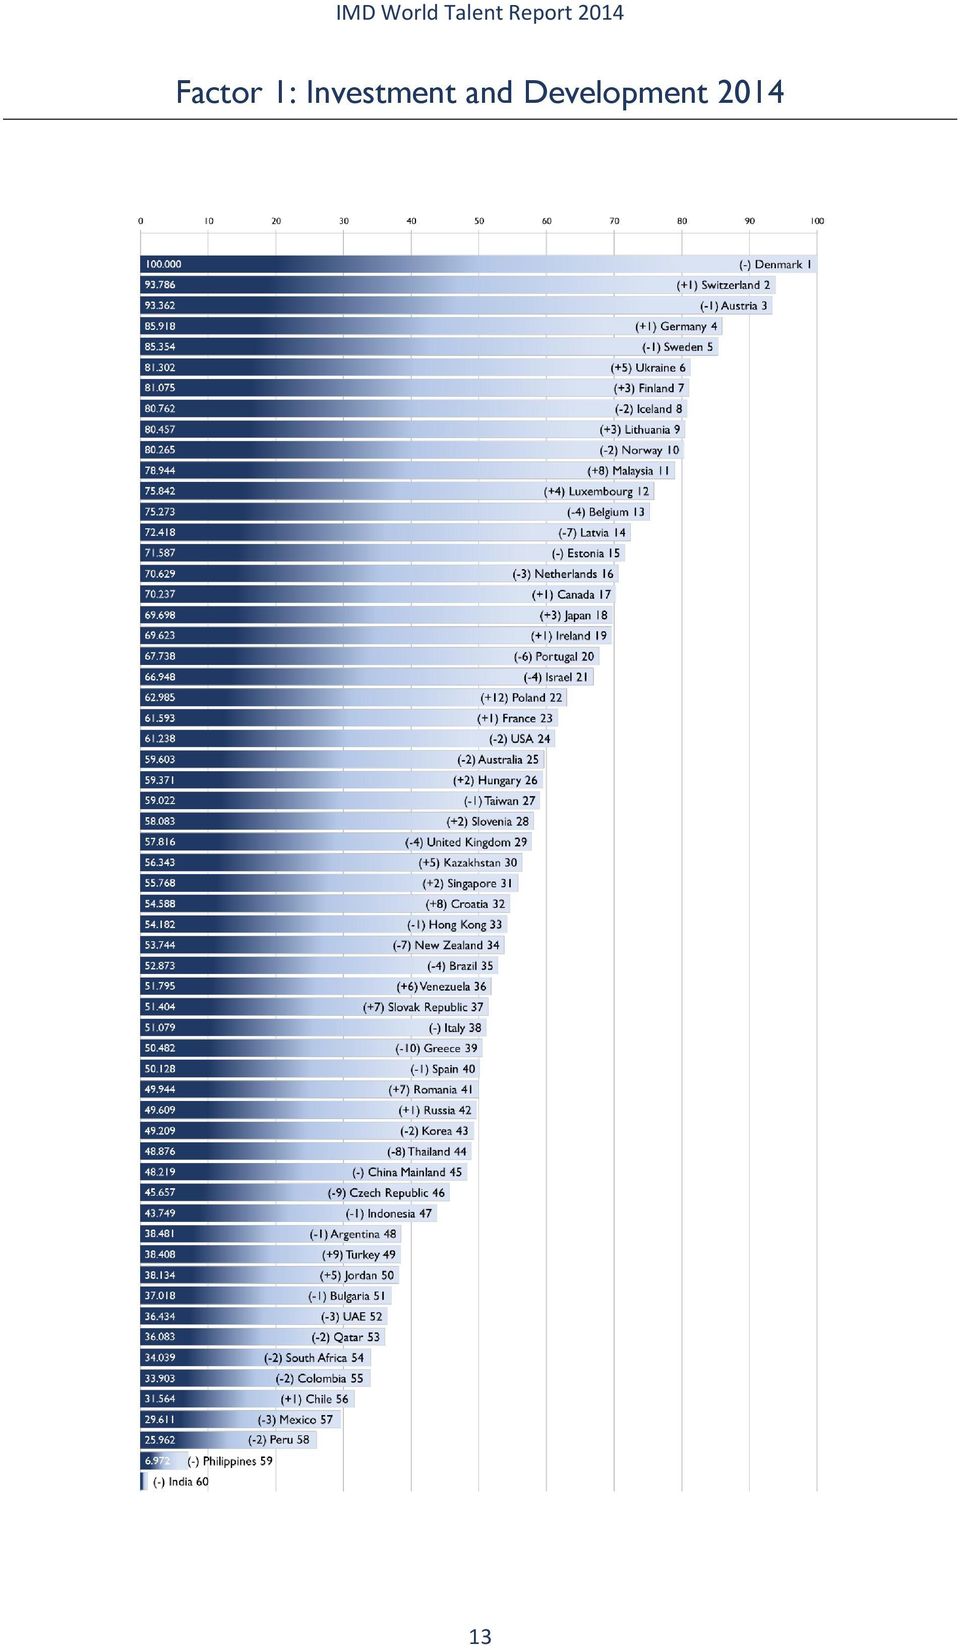
4 IMD World Talent Ranking 2014 The IMD World Talent Ranking 2014 shows the overall ranking for 60 economies. The economies are ranked from the most to the least competitive and the change from the previous year s ranking (2013) are shown in brackets. The scores shown on the left are actually indices (0 to 100) generated for the unique purpose of constructing the graphs. 2
 are shown in brackets.")
5 Analysis 1. Introduction The IMD World Competitiveness Center is delighted to present its IMD World Talent Report 2014, which includes a talent ranking for all countries that are part of the IMD World Competitiveness Yearbook (60 countries as of 2014). The data are gathered from the Center s extensive database, which encompasses 19 years of competitiveness-related data. Access to such a comprehensive repository of data allows us to trace the evolution of the ranking over the last decade. The objective of the IMD World Talent Ranking is to assess the ability of countries to develop, attract and retain talent to sustain the talent pool available for enterprises operating in those economies. To this aim, it is important to assess how countries evolve within the talent ranking. Relevant data have thus been compiled from 2005 to 2014 and the ranking is based on both hard data and survey data. While the hard data have been gathered from various sources (see Appendix1), the survey data were obtained from the Center s executive opinion survey, designed for the World Competitiveness Yearbook. We first present the 2014 World Talent Ranking to set the stage for the discussion and assessment of the evolution of the ranking. Although in the discussion that follows, we make reference to details of the performance of selected countries at the overall ranking and criterion level, we do not include all data in this report. Rather, for the evolution of the ranking we present only the overall ranking for all the years included in the report. We present data at all levels (i.e., criterion, factor and overall ranking) for the 2014 ranking. Interested readers can access data for all criteria employed in the development of this report through the World Competitiveness Online website. We have identified a list of talent competitive countries based on their 2005 to 2014 performance in the World Talent Ranking. These are the countries that have achieved a top 10 spot in the ranking for five or more years during the period of study. Such a performance is the result of an approach to talent competitiveness based on a balanced commitment to the development of home-grown talent and the attraction of overseas talent through policies that strive to meet the talent demands of the country. 2. The structure of the IMD World Talent Ranking The ranking is structured according to three factors: 1) investment and development, 2) appeal and 3) readiness: The investment and development factor takes into account the investment in and development of the homegrown talent. It traces the size of public investment on education by incorporating an indicator of public expenditure. It also looks at the quality of education through indicators related to pupil-teacher ratios. The development of talent is covered by variables related to the implementation of apprenticeship and the priority of employee training for companies. It also looks at the development of the female labor force. The appeal factor goes beyond the focus on the local labor force to incorporate into the analysis the ability of the country to tap into the overseas talent pool. It does so by including indicators such as the cost of living and quality of life in a particular economy. Specifically, it examines the ability of a country to attract highly-skilled foreign labor. In addition, it assesses the way enterprises prioritize the attraction and retention of talent. Another component of this factor evaluates the impact of brain drain on the competitiveness of countries. It also takes into account the level of worker motivation. The success of the investment in and development of talent and the ability to attract and retain talent is reflected in the availability of skills and competencies to sustain an economy s talent pool. The readiness factor looks at the context of the talent pool. It considers the growth of the labor force and the quality of the skills available. It also takes into consideration the experience and competencies of the existing senior managers pool. The readiness factor focuses, in addition, on the ability of the educational system to meet the talent needs of enterprises. It examines the way in which the educational system fulfils the talent demands of the economy, the ability of higher education to meet that demand and the languages skills available. 3

6 Figure 1: Structure of the IMD World Talent Ranking Appeal factor Investment and development factor Readiness factor The IMD World Talent Ranking Such a comprehensive set of criteria enables us to observe how countries perform in terms of sustaining their talent pool. In developing the talent ranking, we have omitted measures of the regulation of labor and productivity. The reason for this is because our objective is to assess the development and retention of talent, and the regulation of labor and its focus on conflict resolution could be perceived as peripheral to that objective. Similarly, productivity is an outcome of what we want to assess. Table 1: Components of the talent factors Investment and development factor Appeal factor Readiness factor Total public expenditure on education Total public expenditure on education (per pupil) Pupil-teacher ratio (primary) Pupil-teacher ratio (secondary) Apprenticeship Employee training Female labor force Cost of living Attracting and retaining Worker motivation Brain drain Quality of life Foreign skilled people Labor force growth Skilled labor Finance skills International experience Competent senior managers Educational system Science in schools University education Management education Language skills 4

7 3. Constructing the IMD World Talent Ranking In order to calculate the IMD World Talent Ranking, we: Normalize data to the 0 to 1 values in order to bring all indicators into the same value range Calculate the average of the normalized criteria Use averaged criteria to generate the three talent competitiveness factors Aggregate factors to build the overall talent ranking Normalize the overall ranking to the 0 to 100 range to facilitate the interpretation of results However, there are some caveats. For certain years, our sample varies according to the evolution of the IMD World Competitiveness Yearbook. That is to say, some countries appear in the talent ranking only for the years in which they are part of the Yearbook. For example, Latvia only appears in the 2013 and 2014 talent rankings because it became part of the Yearbook in Similarly, rankings for Iceland are only available from Table 2: Sample size ( ) Year # Countries The survey data follow the evolution of the Yearbook. The executive opinion survey employed in the Yearbook is constantly updated and a relevant question for the talent ranking may only have been incorporated in recent years. Therefore the availability of data for that particular indicator could be restricted to only a segment of the decade considered in this report. Specifically, the apprenticeship indicator is available for 2013 and The attracting and retaining talent and management education indicators are available from 2007 and 2008 (respectively) to the present. Additionally, hard data may not be available for specific countries in specific years. Whenever possible, we use the most recent data available. In Table 3 we present all the definitions and relevant survey question. Note that the value range for all survey based criteria is of 0 to 10. 5

8 Table 3: Criteria definitions and survey questions Criterion Definition/question Panel A: Investment and development factor Total public expenditure on education Total public expenditure on education as percentage of GDP Total public expenditure on education (per pupil) Total public expenditure on education per pupil as percentage of GDP per capita Pupil-teacher ratio (primary) Ratio of students to teaching staff, primary school Pupil-teacher ratio (secondary) Ratio of students to teaching staff, secondary school Apprenticeship Apprenticeship is sufficiently implemented Employee training Employee training is a high priority in companies Female labor force Percentage of total labor force Panel B: Appeal factor Cost of living Index of a basket of goods & services in major cities, including housing (New York City = 100) Attracting and retaining Attracting and retaining talents is a priority in companies Worker motivation Worker motivation in companies is high Brain drain Brain drain (well-educated and skilled people) does not hinder competitiveness in your economy Quality of life Quality of life is high Foreign skilled people Foreign high-skilled people are attracted to your country's business environment Panel C: Readiness factor Labor force growth Percentage change in labor force Skilled labor Skilled labor is readily available Finance skills Finance skills are readily available International experience International experience of senior managers is generally significant Competent senior managers Competent senior managers are readily available Educational system The educational system meets the needs of a competitive economy Science in schools Science in schools is sufficiently emphasized University education University education meets the needs of a competitive economy Management education Management education meets the needs of the business community Language skills Language skills are meeting the needs of enterprises 4. The IMD World Talent Ranking 2014 Results The 2014 IMD World Talent Ranking is led by Switzerland, Denmark, Germany, Finland and Malaysia (1 st to 5 th respectively). In Table 4 we present the 2014 top 10 countries and in the sub-sections that follow, we discuss in detail the performance of several countries in the three talent competitiveness factors. Table 4: Top 10 talent raking, 2014 Top 10 countries 2014 Ranking Country 1 Switzerland 2 Denmark 3 Germany 4 Finland 5 Malaysia 6 Ireland 7 Netherlands 8 Canada 9 Sweden 10 Norway 6

9 4.1 Investment and development factor Denmark leads the investment and development factor while Switzerland reaches the 2 nd spot in the same factor. Austria follows in third place with Germany and Sweden ranking 4 th and 5 th place respectively. Within this factor, Iceland achieves the highest score in total expenditure on education (as a percentage of GDP) and Denmark leads in the total public expenditure on education per pupil indicator. The pupil-teacher ratios are headed by Sweden (primary school) and Portugal (secondary school). Portugal reaches the 20 th position in the factor. Germany obtains the highest mark in the apprenticeship indicator followed closely by Switzerland (8.52) and Austria (7.63). For the same criterion, Malaysia (7.12), Japan (6.91), Indonesia (6.11) and Lithuania (5.97) make the top 10 (fourth, fifth, seventh and eighth, respectively). Ukraine comes 11 th with a score of 5.47 and Turkey 12 th with Switzerland leads the way in employee training. Germany (7.79) and Japan (7.78) reach 2 nd and 3 rd respectively. In the same indicator, Romania achieves 7 th place with 7.43, Estonia 14 th with 6.63 and Lithuania 15 th with In terms of female labor force (as a percentage of the total labor force), Latvia (14 th spot in the investment and development factor) obtains the highest score. While Lithuania (50.06%), Kazakhstan (49.13%) and Estonia (49.09%) reach the 2 nd to 4 th spots, Finland (48.34%) comes 6 th and France 7 th (47.84%). In this indicator, USA (46.80%) reaches 17 th position, Switzerland (46.16) 24 th and Germany (45.94%) 27 th. 4.2 Appeal factor Switzerland heads the talent appeal factor with Germany, USA, Ireland and Malaysia (2 nd to 5 th respectively) completing the top 5. Luxembourg makes it to the 10 th position in this factor. Within the appeal factor, in terms of the cost of living, USA is the least expensive (75.08) among the top 10 countries in the factor. Malaysia (78.60) and Germany (78.61) follow closely. The most expensive countries among the top 10 are Denmark (103.30), Norway (109.10) and Switzerland (115.90). In the quality of life criterion, Switzerland (9.73), Norway (9.47) and Germany (9.38) head the top 10 ranking while UAE (8.58), USA (8.33) and Malaysia (7.48) close it. Luxembourg obtains the lowest mark (6.93) in terms of attracting and retaining talents among the top10 countries in the factor. Other countries at the top of this indicator are Switzerland (8.38), Germany (8.00), Ireland (8.00), Denmark (7.87) and Norway (7.78). In the criterion of the level of worker motivation in companies, Malaysia ranks third with 7.68, only surpassed by Denmark (7.87) and Switzerland (7.94). In the same criterion, Austria (14 th in the appeal factor) and Japan (24 th ) make it to the top 10 with 7.59 and 7.56 respectively. Finland (11 th ) and Sweden (13 th ) close ranks in the top 10 of the criterion obtaining 7.49 and 7.24 respectively. Norway (8.09) heads the brain drain (as hindrance for competitiveness in the economy) criterion. Switzerland (7.78) and Finland (7.76) follow. While Ukraine reaches 11 th place with 6.34, the United Kingdom comes 12 th with 6.27 and Hong Kong 14 th with The ability to attract foreign highly skilled people is led by Switzerland (8.87). Singapore obtains 8.17 (third place) while the United Kingdom (7.78) reaches eighth place, Hong Kong (7.47) ninth and Chile (7.43) 10 th. 4.3 Readiness factor Switzerland heads the readiness factor followed by Finland (2 nd ), Netherlands (3 rd ), Denmark (4 th ) and UAE (5 th ). Within this factor, in the labor growth (percentage change) criterion Qatar achieves top score (14.55%) followed by UAE (9.31%), Venezuela (6.10%), Mexico (4.06%) and Peru (3.52%). Switzerland (1.41%) reaches 19 th place, Germany (0.37%) 38 th and Denmark (-0.12%) 48 th position. In terms of skilled labor (readily available), Ireland (8.09) heads the top with Finland (7.76), Denmark (7.57), the Netherlands (7.48) and the Philippines (7.37) rounding up the top of the table. Malaysia (6.95) reaches 6 th spot, Sweden (6.89) 8 th, Switzerland (6.68) 10 th and Germany (5.45) a distant 37 th spot. Switzerland (8.33) leads in the availability of finance skills. Ireland (8.29) and Canada (8.19) complete the top 3. While Hong Kong (7.92) makes it to the 8 th place, Israel (7.74) comes 10 th, the United Kingdom (7.66) 11 th and France (7.60) 12 th. Switzerland (7.92) reaches the top in the international experience of senior managers (generally significant), the Netherlands (7.45) and Luxembourg (7.26) follow. Malaysia (7.23) reaches 4 th spot, Ireland (7.17) 6 th and Germany (6.84) 8 th rank. Singapore (6.69) closes the top 10 with Denmark (5.50) in a distant 26 th. In terms of competent senior managers (readily available), Malaysia (7.44), the Netherlands (7.34) and Ireland (7.33) lead the table. Hong Kong (6.92), Canada (6.89), Switzerland (6.87), Finland (6.80) and Sweden (6.80) reach the 6 th to 10 th positions. 7
 and Portugal (secondary school). Portugal reaches the 20 th position in the factor.")
10 Switzerland (8.65), Finland (8.45), Singapore (8.17), Canada (7.85) and Ireland (7.62) lead the way in the fit between the educational system and the needs of a competitive economy. New Zealand (7.32) and Australia (7.23) close the top 10 in this criterion. Singapore (8.36) tops the table in science in schools (sufficiently emphasized). Malaysia (6.98), UAE (6.77), Hong Kong (6.53) and Taiwan (6.47) reach the 5 th to 8 th spot (respectively). While Japan (6.26) closes the top 10, Germany (5.75) comes 18 th. The top 5 for the University education (fulfil the needs of a competitive economy) criterion is Switzerland (8.68), Canada (8.19), Finland (8.16), Singapore (8.10) and Denmark (7.73). Malaysia (6.90), Sweden (6.54) and Norway (6.41) rank 14 th, 19 th and 21 st respectively. Switzerland (8.38), USA (7.93) and Singapore (7.86) top the management education (meets the needs of the businesses) indicator. Malaysia (7.28) closes the top 10 while Sweden (6.71) ranks 16 th and the United Kingdom (6.16) 28 th. Luxembourg (8.63) leads the way in the availability of language skills followed by Denmark (8.60), the Netherlands (8.49), Switzerland (8.42) and Finland (8.20). While Singapore (7.93) and Sweden (7.89) round up the top 10, Norway (7.78) ranks 12 th, Malaysia (7.52) 15 th and Germany (6.93) 19 th. 5. The IMD World Talent Ranking in retrospective ( ) In this section we discuss the evolution of the IMD World Talent Ranking for a selected group of countries during the period Talent competitive countries Developing the talent rankings enables us to identify countries that through the years consistently accomplish high scores; that is to say, the countries that rank in the top 10 for five or more years during the period assessed. We call these countries talent competitive. Talent competitive countries show a balanced approach between their commitment to education, investment in the development of local talent and their ability to attract overseas talent. The talent competitiveness strategies that these countries adopt strive to fulfil the demands of their economies. In this sense, talent competitive countries exhibit a high level of agility in the development of policies that impact their talent pipeline. In the following table we present the most talent competitive countries in the period, Table 5. The most talent competitive countries ( ) Country Austria Canada Denmark Finland Ireland Netherlands Norway Singapore Sweden Switzerland The fluctuation in the overall ranking experienced by some of these countries throughout the period may be the result of cyclical economic and socio-political issues that impact, for example, immigration policies and/or investment in education. In some cases, such policies could result in the diminishing ability of countries to attract overseas talent despite strong commitment to local talent development. In the next section we assess the proposition that talent competitive countries strike a balance between the development of local talent and the attraction of overseas talent through the adoption of policies that meet the talent requirements of their economies. We select countries based on their evolution in the talent ranking for These short case studies include examples of countries that steadily remain in the top 10 of the rankings and others that fluctuate in and out the top 10 ranks. In addition, we include countries that consistently decline in their ranks and others that steadily rise. 8
 criterion is Switzerland (8.68), Canada (8.19), Finland (8.16), Singapore (8.10) and Denmark (7.73). Malaysia (6.")
11 5.2 Case studies Brazil In the overall talent ranking, Brazil peaks at 28 th in 2005 and experiences a decline to 52 nd position in When comparing Brazil s scores for 2005 and 2014 we observe that it has experienced a decline in most of the indicators and a particularly sharp drop in some of the criteria encompassed by the readiness factor. Among these we find several indicators. Brazil sees the labor force growth indicator steeply decline from 4.57% in 2005 to 0.75% in Similarly, the availability of skilled labor scores drop from 5.34 and 3.16 in the same period. The availability of finance skills falls sharply from 6.17 (2005) to 4.93 (2014) while the access to competent senior managers dwindles from 6.20 to The ability of the country s educational institutions to fulfil the talent demands of the market suffers a similar decrease. The educational system criterion steeply falls from 3.34 in 2005 to 1.80 in 2014 while the emphasis on science in schools drops from a value of 3.68 to Such a considerable decline in the readiness factor occurs despite a somewhat stable investment and development factor. Brazil sees an increase in its total public expenditure on education from 4.60% in 2005 to 4.97% in The pupil-teacher ratio in primary education improves from to Similarly the pupilteacher ratio secondary school is enhanced from in 2005 to in The prioritization of employee training slightly improves from 5.86 to 5.90 while the percentage of female labor force increases from 43.11% to 43.30%. Brazil ranks inconsistently in the appeal factor. It experiences a sharp increase in the cost of living index from in 2005 to in The level of worker motivation in the country also takes a dive from 6.66 to 5.43 while the brain drain indicator drops from 5.63 to At the same time, the quality of life improves from 4.34 to 4.40 and the attracting and retaining talents indicator also increases from 6.59 in 2007 to 7.25 in The ability of the country to attract foreign highly skilled people slightly increases from 5.06 in 2005 to 5.17 in India In the period 2005 to 2014 India rises from 29 th place in 2005 to 26 th in 2007, dropping to 34 th in It returns to the 29 th spot in 2011 to drop to 48 th place in In the investment and development factor, results show that India increases the total public expenditure on education from 3.14% in 2005 to 3.80% in We observe a similar trend in pupil-teacher ratio in primary schools, which improves from to Likewise, the pupil-teacher ratio for secondary school improves from to Conversely, India s total public expenditure on education per pupil decreases from 12.64% in 2012 to 11.78% in The country s implementation of apprenticeship programs declines from 4.74 in 2013 to 4.51 in The prioritization of employee training in companies dwindles from 5.36 in 2005 to 5.08 in India s percentage of female labor force also decreases from 31.65% in 2005 to 25.30% in In the appeal factor, India also sees a decline in the level of worker motivation criterion from 5.80 in 2005 to 5.11 in Brain drain as a hindrance to competitiveness also observes the same pattern, declining from 6.25 (2005) to 5.54 (2014). The ability of India to attract foreign highly skilled people similarly decreases from 4.96 in 2005 to 4.41 in India s quality of life indicator decreases slightly from 4.64 in 2005 to 4.46 in 2014, while the attracting and retaining talents indicator also falls from 7.93 in 2007 to 6.86 in The country fares similarly in the readiness factor. The access to skilled labor sharply drops from 7.58 in 2005 to 5.75 in The availability of finance skills falls from 7.78 to 7.00 and likewise the international experience criterion somewhat increases from 5.11 to 5.29 during the same period. At the management level, the availability of competent senior managers indicator drops from 6.50 in 2005 to 5.63 in The management education fit to the needs of the business community also falls from 6.85 in 2008 to 6.16 in The readiness of India s educational institutions to meet the demands of the economy likewise sees a decline in the period of study. The criterion of educational system obtains a score of 6.20 in 2005 but drops to 4.89 in 9
 to 4.")
12 2014. In addition, the indicator for the emphasis assigned to science in schools decreases from 7.06 in 2005 to 5.97 in Similarly the university education criterion drops from 6.62 to 5.17 during the same years while the language skills indicator declines from 7.53 in 2005 to 6.25 in Malaysia Malaysia experiences an opposite pattern to that of Brazil and India, steadily improving its position on the overall World Talent Ranking from 20 th place in 2005 to the 6 th spot in 2010 and up to the 5 th rank in Within the readiness factor, Malaysia sees an increase in the score of the employee training criterion from 6.17 in 2005 to 7.71 in The availability of skilled labor improves from 5.77 to 6.95 while access to finance skills is enhanced from 6.15 to At the senior management level, Malaysia improves in international experience from 5.83 in 2005 to 7.23 in Likewise, access to competent senior managers increases from 5.89 to The ability of the country s educational institutions to meet the talent requirement of the market is also enhanced in the period. The educational system indicator rises from 5.54 to Likewise, the university education criterion increases from 5.49 to 6.90, while that of language skills improves from 5.60 to In addition, the emphasis that schools assign to science increases from 6.04 to 6.98 in the period under consideration. Malaysia s appeal factor also improves. The level of worker motivation in companies increases from 6.08 in 2005 to 7.68 in At the same time, the criterion covering the brain drain as a hindrance to the competitiveness of the country improves from 4.84 and Similarly, the ability of the country to attract foreign highly skilled people increases from 6.42 in 2005 to 7.24 in 2014, while the quality of life improves from 6.76 in 2005 to 7.48 in Similar improvements occur under the investment and development factor in the period Malaysia s pupil-teacher ratio for both primary and secondary education improves from to and from to 13.10, respectively. The percentage of the country s female labor force slightly increases from 36.06% in 2005 to 37.03% in The country s implementation of apprenticeship programs increases from 6.49 in 2013 to 7.12 in Although Malaysia s total public expenditure on education decreases from 6.98% in 2005 to 5.80% in 2014, the country s total public expenditure on education per pupil improves from 20.54% in 2007 to 23.15% in Singapore In the overall ranking, Singapore experiences an increase from the 10 th spot in 2005, peaking at 2 nd place in 2008 then descending to 9 th in 2009 and 16 th in The country s scores in the investment and development factor seem low and cost of living is high suggesting that Singapore currently has a large pool of talent that it has nurtured and attracted, but that this pool may shrink slightly in the future. While the total public expenditure on education peaks at 3.72% in 2005, it reaches its lowest (2.80%) in The primary school pupil-teacher ratio peaks at in 2006 and steadily improves to in The female percentage of the labor force criterion experiences a similar pattern, improving from 41.30% in 2005 to 44.68% in In the implementation of apprenticeship programs, Singapore s scores of 5.26 in 2013 and 5.25 in 2014 are somewhat low when compared with those of countries that have moved up the overall ranking. For example, Denmark obtains 6.50 in 2013 and 6.26 in In terms of the prioritization of employee training, Singapore s scores fluctuate from a high of 7.32 (2008) to a low of 6.27 in 2013 while Denmark remains above 7.32 throughout the decade with a highest of 8.24 in In the cost of living indicator, Singapore receives in 2005; living costs increase to in 2013 and in 2014 (the most expensive in the sample). Scores for the quality of life are consistently high (above 8.00) with a lowest value of 8.00 in 2005 and a highest of 8.96 in In the attracting and retaining indicator Singapore achieves the highest mark of the sample in 2008 with a value of Scores for the brain drain criterion are relatively high throughout. At the same time, Singapore s ability to attract foreign highly skilled people receives extremely high marks, albeit with a lowest score of 7.95 in 2013 from a high of 8.74 in Within the readiness factor, Singapore scores are consistently high for the educational system, science in schools, university education and management education criteria. Moreover, in all the years under study 10

13 Singapore achieves the highest scores for science in schools. In the period, Singapore dominates the educational system and university education indicators Switzerland In the years considered in this report, Switzerland ranks 1 st except in the 2006 ranking for which it reaches the 2 nd spot. Through the period, Switzerland excels in all factors particularly in the attraction/retention and readiness factors. It is worth mentioning that under the investment and development factor, in the female percentage of the labor force Switzerland experiences some fluctuation but sees an increase from 44.69% in 2005 to in Similarly, in the prioritization of employee training for companies, the country scores higher than 7.35 throughout, reaching top marks in 2012 (7.86) and 2014 (7.94). Switzerland achieves the top spot in the quality of life for five of the years in the decade under study, in worker motivation (three years) and in attracting foreign highly skilled people (seven years). It also important to mention, its scores in the brain drain as hindrance for the competitiveness of the economy are consistently high (above 7.00 from 2007 to 2014) reaching its lowest in 2009 at In other specific indicators, Switzerland dominates (in the majority of years analyzed) the rankings in the availability of finance skills, the significance of the international experience of senior managers, in the ability of university education to fulfil the demands of the labor market, and in the ability of the management education to meet the needs of the business community. In language skills it achieves top marks in 4 of the 10 years under consideration. Switzerland s lowest scores show in the labor force growth and cost of living indicators. 6. Observations The data suggest that countries that achieve a positive balance between investing and developing local talent and the ability to attract and retain overseas talent perform consistently well in the period , for example Switzerland. The country s results indicate that it is able to develop its home-grown talent while efficiently tapping into the overseas talent pipeline. In addition, the Malaysian example shows that a strategy aiming at improving both the home-grown and overseas talents has a positive impact on the country s performance in the overall talent ranking. Countries that experience imbalances in that strategy tend to experience a drop in their overall rankings. The overall ranking pattern exhibited by Singapore seems to be the outcome of the investment and development factor results in combination with other indicators such as the cost of living. In other words, Singapore s results show a fair degree of imbalance between the criteria covering the home-grown talent pipeline and the ability of the country to attract overseas talent. The county thus fluctuates in and out of the top 10 talent ranking during the period under study. The performances of Brazil and India show that imbalances across all talent competitiveness criteria are detrimental for the sustainability of an effective and dynamic talent pipeline. 11

14 Investment and development factor Appeal factor Readiness factor Overall IMD World Talent Report 2014 IMD World Talent Ranking Overall Ranking Country \ Year Argentina Australia Austria Belgium Brazil Bulgaria Canada Chile China Mainland Colombia Croatia Czech Republic Denmark Estonia Finland France Germany Greece Hong Kong Hungary Iceland India Indonesia Ireland Israel Italy Japan Jordan Kazakhstan Korea Latvia Lithuania Luxembourg Malaysia Mexico Netherlands New Zealand Norway Peru Philippines Poland Portugal Qatar Romania Russia Singapore Slovak Republic Slovenia South Africa Spain Sweden Switzerland Taiwan Thailand Turkey UAE Ukraine United Kingdom USA Venezuela no. countries

15 Factor 1: Investment and Development
16 Factor 2: Appeal

17 Factor 3: Readiness

18 2014 Criteria Factor 1: Investment and Development Total public expenditure on education (%) 2012 Total public expenditure on education per pupil 2011 Pupil-teacher ratio (primary education) 2011 Pupil-teacher ratio (secondary education) 2011 Apprenticeship (Survey 2014) Employee training (Survey 2014) Female labor force (%) 2013 Factor 2: Appeal Cost-of-living index 2013 Attracting and retaining talents (Survey 2014) Worker motivation (Survey 2014) Brain drain (Survey 2014) Quality of life (Survey 2014) Foreign high-skilled people (Survey 2014) Factor 3: Readiness Labor force growth 2013 Skilled labor (Survey 2014) Finance skills (Survey 2014) International experience (Survey 2014) Competent senior managers (Survey 2014) Educational system (Survey 2014) Science in schools (Survey 2014) University education (Survey 2014) Management education (Survey 2014) Language skills (Survey 2014) 16
 Finance skills (Survey 2014) International experience (Survey 2014) Competent senior managers (Survey 2014) Educational system (Survey 2014) Science in schools")
19 TOTAL PUBLIC EXPENDITURE ON EDUCATION (%) 2012 Percentage of GDP TOTAL PUBLIC EXPENDITURE ON EDUCATION PER PUPIL 2011 Percentage of GDP per capita Ranking % 1 ICELAND ISRAEL DENMARK SOUTH AFRICA UKRAINE SWEDEN USA FINLAND BELGIUM FRANCE SWITZERLAND UNITED KINGDOM NETHERLANDS MALAYSIA SLOVENIA PORTUGAL LITHUANIA AUSTRIA NEW ZEALAND LATVIA NORWAY POLAND LUXEMBOURG AUSTRALIA IRELAND CROATIA BRAZIL CZECH REPUBLIC ESTONIA HUNGARY COLOMBIA SPAIN KOREA TAIWAN KAZAKHSTAN GERMANY ITALY GREECE CHINA MAINLAND CHILE RUSSIA THAILAND SLOVAK REPUBLIC VENEZUELA INDIA JORDAN HONG KONG TURKEY JAPAN BULGARIA INDONESIA MEXICO PERU QATAR ROMANIA SINGAPORE PHILIPPINES UAE ARGENTINA - - CANADA - Ranking % 1 DENMARK UKRAINE 33 3 SWEDEN FINLAND BELGIUM AUSTRIA SLOVENIA UNITED KINGDOM PORTUGAL SWITZERLAND NORWAY ESTONIA FRANCE LATVIA ICELAND IRELAND ITALY NEW ZEALAND POLAND NETHERLANDS SPAIN HUNGARY BULGARIA CROATIA LITHUANIA MALAYSIA JAPAN KOREA TAIWAN CZECH REPUBLIC VENEZUELA USA AUSTRALIA ARGENTINA ROMANIA SLOVAK REPUBLIC RUSSIA HONG KONG ISRAEL MEXICO THAILAND COLOMBIA QATAR CHILE KAZAKHSTAN INDIA INDONESIA PHILIPPINES PERU BRAZIL - - CANADA - - CHINA MAINLAND - - GERMANY - - GREECE - - JORDAN - - LUXEMBOURG - - SINGAPORE - - SOUTH AFRICA - - TURKEY - - UAE - 17

20 PUPIL-TEACHER RATIO (PRIMARY EDUCATION) 2011 Ratio of students to teaching staff PUPIL-TEACHER RATIO (SECONDARY EDUCATION) 2011 Ratio of students to teaching staff Ranking ratio 1 SWEDEN LUXEMBOURG ICELAND NORWAY HUNGARY AUSTRIA POLAND PORTUGAL QATAR LATVIA ITALY DENMARK SPAIN BELGIUM LITHUANIA MALAYSIA GREECE ESTONIA FINLAND CANADA CROATIA HONG KONG VENEZUELA TAIWAN SWITZERLAND SLOVAK REPUBLIC USA IRELAND AUSTRALIA NETHERLANDS UKRAINE ISRAEL INDONESIA THAILAND SLOVENIA ROMANIA GERMANY NEW ZEALAND ARGENTINA KAZAKHSTAN UAE BULGARIA FRANCE JORDAN CHINA MAINLAND JAPAN SINGAPORE CZECH REPUBLIC PERU KOREA UNITED KINGDOM RUSSIA TURKEY BRAZIL CHILE COLOMBIA MEXICO SOUTH AFRICA PHILIPPINES INDIA Ranking ratio 1 PORTUGAL GREECE CROATIA LATVIA VENEZUELA LITHUANIA RUSSIA KAZAKHSTAN BELGIUM SWEDEN LUXEMBOURG AUSTRIA NORWAY HUNGARY QATAR JORDAN POLAND ARGENTINA SLOVENIA SPAIN ICELAND CZECH REPUBLIC SWITZERLAND DENMARK SLOVAK REPUBLIC ESTONIA UKRAINE AUSTRALIA BULGARIA ISRAEL ITALY UAE ROMANIA FRANCE FINLAND JAPAN MALAYSIA GERMANY IRELAND HONG KONG INDONESIA SINGAPORE NEW ZEALAND CHINA MAINLAND USA CANADA TAIWAN UNITED KINGDOM BRAZIL PERU NETHERLANDS KOREA MEXICO THAILAND TURKEY CHILE SOUTH AFRICA COLOMBIA INDIA PHILIPPINES

21 APPRENTICESHIP EMPLOYEE TRAINING Apprenticeship Employee training is not sufficiently implemented is sufficiently implemented is not a high priority in companies is a high priority in companies Ranking 1 GERMANY SWITZERLAND AUSTRIA MALAYSIA JAPAN DENMARK INDONESIA LITHUANIA UAE NETHERLANDS UKRAINE TURKEY LUXEMBOURG IRELAND SINGAPORE TAIWAN CANADA NORWAY KAZAKHSTAN COLOMBIA QATAR FINLAND HONG KONG JORDAN CHINA MAINLAND ICELAND THAILAND LATVIA PHILIPPINES PORTUGAL AUSTRALIA INDIA ESTONIA BRAZIL RUSSIA MEXICO POLAND ISRAEL CHILE KOREA SWEDEN USA UNITED KINGDOM VENEZUELA PERU BELGIUM HUNGARY FRANCE NEW ZEALAND GREECE ITALY ARGENTINA CROATIA SPAIN SLOVAK REPUBLIC CZECH REPUBLIC SLOVENIA SOUTH AFRICA BULGARIA ROMANIA 1.49 Ranking 1 SWITZERLAND GERMANY JAPAN MALAYSIA AUSTRIA DENMARK ROMANIA FINLAND IRELAND UAE NORWAY SWEDEN NETHERLANDS ESTONIA LITHUANIA LUXEMBOURG SINGAPORE TAIWAN CHINA MAINLAND THAILAND BELGIUM KOREA COLOMBIA ICELAND KAZAKHSTAN BRAZIL SLOVAK REPUBLIC CANADA ISRAEL UKRAINE PHILIPPINES USA QATAR TURKEY AUSTRALIA INDONESIA HONG KONG JORDAN LATVIA FRANCE MEXICO UNITED KINGDOM SOUTH AFRICA VENEZUELA CZECH REPUBLIC INDIA CHILE POLAND RUSSIA SLOVENIA NEW ZEALAND HUNGARY ITALY PERU ARGENTINA CROATIA PORTUGAL GREECE SPAIN BULGARIA
22 FEMALE LABOR FORCE (%) Percentage of total labor force 2013 COST-OF-LIVING INDEX 2013 Index of a basket of goods & services in major cities, including housing (New York City = 100) Ranking % 1 LATVIA LITHUANIA KAZAKHSTAN ESTONIA HONG KONG FINLAND FRANCE UKRAINE ICELAND DENMARK CANADA PORTUGAL SWEDEN NEW ZEALAND NORWAY ISRAEL USA BULGARIA AUSTRIA RUSSIA NETHERLANDS UNITED KINGDOM CROATIA SWITZERLAND HUNGARY SPAIN GERMANY BELGIUM SLOVENIA AUSTRALIA THAILAND SOUTH AFRICA POLAND SINGAPORE SLOVAK REPUBLIC IRELAND ROMANIA PERU TAIWAN BRAZIL COLOMBIA GREECE JAPAN ITALY KOREA CHILE CZECH REPUBLIC VENEZUELA PHILIPPINES MEXICO LUXEMBOURG INDONESIA MALAYSIA TURKEY INDIA JORDAN QATAR UAE ARGENTINA - - CHINA MAINLAND - Ranking index 1 SOUTH AFRICA BULGARIA INDIA ROMANIA QATAR MEXICO POLAND SLOVENIA LITHUANIA CROATIA HUNGARY ESTONIA USA UNITED KINGDOM PERU MALAYSIA GERMANY PORTUGAL PHILIPPINES UKRAINE KAZAKHSTAN SLOVAK REPUBLIC GREECE JORDAN CANADA LATVIA TURKEY UAE SPAIN LUXEMBOURG CZECH REPUBLIC INDONESIA BELGIUM THAILAND NEW ZEALAND CHILE TAIWAN IRELAND COLOMBIA FRANCE ARGENTINA FINLAND NETHERLANDS AUSTRIA CHINA MAINLAND ITALY SWEDEN BRAZIL ISRAEL AUSTRALIA VENEZUELA DENMARK KOREA NORWAY JAPAN RUSSIA SWITZERLAND HONG KONG SINGAPORE ICELAND - 20
23 ATTRACTING AND RETAINING TALENTS WORKER MOTIVATION Attracting and retaining talents Worker motivation in companies is is not a priority in companies is a priority in companies low high Ranking 1 SWITZERLAND ROMANIA GERMANY IRELAND DENMARK NORWAY JAPAN USA BELGIUM UAE AUSTRIA KOREA MALAYSIA SINGAPORE SWEDEN ISRAEL AUSTRALIA CANADA BRAZIL THAILAND NETHERLANDS HONG KONG ESTONIA FINLAND UKRAINE LITHUANIA ICELAND LUXEMBOURG INDIA UNITED KINGDOM CHINA MAINLAND TAIWAN TURKEY QATAR INDONESIA PHILIPPINES FRANCE NEW ZEALAND SOUTH AFRICA SLOVAK REPUBLIC VENEZUELA KAZAKHSTAN CHILE JORDAN LATVIA CZECH REPUBLIC MEXICO ITALY COLOMBIA ARGENTINA PERU PORTUGAL SPAIN GREECE HUNGARY RUSSIA BULGARIA CROATIA POLAND SLOVENIA 4.22 Ranking 1 SWITZERLAND DENMARK MALAYSIA IRELAND AUSTRIA JAPAN NORWAY FINLAND GERMANY SWEDEN TAIWAN CANADA LUXEMBOURG SINGAPORE HONG KONG ICELAND NETHERLANDS USA UAE ISRAEL INDONESIA LATVIA NEW ZEALAND PHILIPPINES UNITED KINGDOM AUSTRALIA THAILAND TURKEY BELGIUM MEXICO CHINA MAINLAND COLOMBIA LITHUANIA CHILE QATAR KAZAKHSTAN ESTONIA BRAZIL CZECH REPUBLIC PERU UKRAINE SLOVAK REPUBLIC JORDAN INDIA ITALY FRANCE SPAIN PORTUGAL KOREA ARGENTINA POLAND HUNGARY SLOVENIA RUSSIA GREECE SOUTH AFRICA ROMANIA CROATIA VENEZUELA BULGARIA
24 BRAIN DRAIN QUALITY OF LIFE Brain drain (well-educated and skilled people) Quality of life is hinders competitiveness in your economy does not hinder competitiveness in your economy low high Ranking 1 NORWAY SWITZERLAND FINLAND USA DENMARK GERMANY SWEDEN UAE NETHERLANDS MALAYSIA UKRAINE UNITED KINGDOM IRELAND HONG KONG CANADA LUXEMBOURG ISRAEL AUSTRALIA SINGAPORE BELGIUM CHILE INDIA TURKEY QATAR INDONESIA THAILAND FRANCE ICELAND AUSTRIA ARGENTINA CZECH REPUBLIC JAPAN BRAZIL JORDAN LATVIA PERU POLAND GREECE MEXICO COLOMBIA SPAIN KAZAKHSTAN ITALY PHILIPPINES CHINA MAINLAND KOREA NEW ZEALAND ESTONIA PORTUGAL TAIWAN SOUTH AFRICA SLOVENIA SLOVAK REPUBLIC LITHUANIA RUSSIA ROMANIA CROATIA VENEZUELA HUNGARY BULGARIA 1.35 Ranking 1 SWITZERLAND AUSTRIA NORWAY SWEDEN GERMANY NETHERLANDS DENMARK NEW ZEALAND AUSTRALIA CANADA FINLAND IRELAND LUXEMBOURG ICELAND BELGIUM UAE FRANCE SINGAPORE USA JAPAN SPAIN UNITED KINGDOM ISRAEL CZECH REPUBLIC MALAYSIA QATAR HONG KONG TAIWAN CHILE ITALY PORTUGAL THAILAND INDONESIA LATVIA LITHUANIA SLOVENIA SLOVAK REPUBLIC ESTONIA SOUTH AFRICA GREECE KOREA TURKEY CROATIA MEXICO PHILIPPINES KAZAKHSTAN PERU ARGENTINA JORDAN CHINA MAINLAND INDIA BRAZIL RUSSIA HUNGARY COLOMBIA POLAND ROMANIA UKRAINE BULGARIA VENEZUELA
25 FOREIGN HIGH-SKILLED PEOPLE Foreign high-skilled people 2014 Percentage change LABOR FORCE GROWTH 2013 are not attracted to your country's business environment are attracted to your country's business environment Ranking 1 SWITZERLAND USA SINGAPORE UAE CANADA IRELAND LUXEMBOURG UNITED KINGDOM HONG KONG CHILE AUSTRALIA MALAYSIA QATAR NETHERLANDS GERMANY KAZAKHSTAN PERU CHINA MAINLAND THAILAND NORWAY AUSTRIA NEW ZEALAND INDONESIA COLOMBIA SWEDEN MEXICO DENMARK BRAZIL BELGIUM TURKEY PHILIPPINES JORDAN SPAIN RUSSIA FRANCE LITHUANIA LATVIA ISRAEL INDIA PORTUGAL ESTONIA SOUTH AFRICA KOREA CZECH REPUBLIC TAIWAN FINLAND UKRAINE JAPAN SLOVAK REPUBLIC HUNGARY POLAND ROMANIA ARGENTINA ICELAND ITALY GREECE SLOVENIA BULGARIA CROATIA VENEZUELA 1.02 Ranking % 1 QATAR UAE VENEZUELA MEXICO PERU TURKEY ARGENTINA SOUTH AFRICA ICELAND SINGAPORE MALAYSIA ROMANIA ISRAEL HONG KONG CHILE LUXEMBOURG AUSTRALIA KOREA SWITZERLAND NEW ZEALAND AUSTRIA BELGIUM SWEDEN NORWAY UNITED KINGDOM CZECH REPUBLIC TAIWAN IRELAND PHILIPPINES COLOMBIA BULGARIA NETHERLANDS BRAZIL KAZAKHSTAN INDIA POLAND CHINA MAINLAND GERMANY HUNGARY JAPAN SLOVAK REPUBLIC USA INDONESIA JORDAN GREECE THAILAND RUSSIA DENMARK UKRAINE ITALY ESTONIA FRANCE FINLAND SLOVENIA LITHUANIA SPAIN LATVIA CROATIA PORTUGAL CANADA
26 SKILLED LABOR FINANCE SKILLS Skilled labor Finance skills is not readily available is readily available are not readily available are readily available Ranking 1 IRELAND FINLAND DENMARK NETHERLANDS PHILIPPINES MALAYSIA ICELAND SWEDEN UAE SWITZERLAND GREECE CANADA ISRAEL INDONESIA USA SPAIN RUSSIA NORWAY FRANCE AUSTRALIA UNITED KINGDOM TURKEY TAIWAN ROMANIA ITALY KAZAKHSTAN HONG KONG CZECH REPUBLIC JAPAN SLOVENIA INDIA KOREA PORTUGAL LATVIA JORDAN SINGAPORE GERMANY POLAND BELGIUM THAILAND SLOVAK REPUBLIC MEXICO AUSTRIA CROATIA CHINA MAINLAND COLOMBIA LUXEMBOURG HUNGARY NEW ZEALAND QATAR ARGENTINA LITHUANIA UKRAINE VENEZUELA CHILE PERU ESTONIA BRAZIL BULGARIA SOUTH AFRICA 2.96 Ranking 1 SWITZERLAND IRELAND CANADA DENMARK FINLAND SWEDEN USA HONG KONG NETHERLANDS ISRAEL UNITED KINGDOM FRANCE NORWAY AUSTRALIA MALAYSIA ICELAND GERMANY SINGAPORE UAE INDIA TURKEY NEW ZEALAND LUXEMBOURG LATVIA AUSTRIA CHILE KAZAKHSTAN PHILIPPINES TAIWAN GREECE JAPAN BELGIUM POLAND INDONESIA RUSSIA THAILAND SPAIN KOREA JORDAN SLOVAK REPUBLIC ARGENTINA ITALY MEXICO QATAR ROMANIA SLOVENIA VENEZUELA CHINA MAINLAND HUNGARY PORTUGAL COLOMBIA CZECH REPUBLIC SOUTH AFRICA BRAZIL LITHUANIA ESTONIA CROATIA PERU UKRAINE BULGARIA
27 INTERNATIONAL EXPERIENCE COMPETENT SENIOR MANAGERS International experience of senior managers is generally Competent senior managers low significant are not readily available are readily available Ranking 1 SWITZERLAND NETHERLANDS LUXEMBOURG MALAYSIA HONG KONG IRELAND UAE GERMANY SWEDEN SINGAPORE QATAR JORDAN INDONESIA FINLAND AUSTRIA ISRAEL UNITED KINGDOM BELGIUM CANADA POLAND SLOVAK REPUBLIC CHILE PHILIPPINES KAZAKHSTAN PERU DENMARK USA TURKEY LATVIA AUSTRALIA THAILAND CZECH REPUBLIC INDIA HUNGARY UKRAINE LITHUANIA ARGENTINA GREECE TAIWAN MEXICO ROMANIA COLOMBIA VENEZUELA ICELAND ESTONIA NORWAY ITALY KOREA SOUTH AFRICA BRAZIL FRANCE NEW ZEALAND SPAIN PORTUGAL SLOVENIA BULGARIA CHINA MAINLAND RUSSIA JAPAN CROATIA 2.86 Ranking 1 MALAYSIA NETHERLANDS IRELAND DENMARK USA HONG KONG CANADA SWITZERLAND FINLAND SWEDEN NORWAY UNITED KINGDOM UAE PHILIPPINES INDONESIA AUSTRALIA SINGAPORE ICELAND ISRAEL JORDAN GERMANY TURKEY FRANCE KAZAKHSTAN BELGIUM AUSTRIA INDIA TAIWAN CHILE GREECE THAILAND LUXEMBOURG NEW ZEALAND QATAR CZECH REPUBLIC ROMANIA POLAND ITALY RUSSIA KOREA LATVIA SPAIN PORTUGAL CHINA MAINLAND ARGENTINA LITHUANIA MEXICO SLOVAK REPUBLIC SLOVENIA SOUTH AFRICA COLOMBIA VENEZUELA HUNGARY PERU ESTONIA JAPAN UKRAINE BRAZIL CROATIA BULGARIA
28 EDUCATIONAL SYSTEM SCIENCE IN SCHOOLS The educational system Science in schools does not meet the needs of a competitive economy meets the needs of a competitive economy is not sufficiently emphasized is sufficiently emphasized Ranking 1 SWITZERLAND FINLAND SINGAPORE CANADA IRELAND GERMANY DENMARK NETHERLANDS NEW ZEALAND AUSTRALIA MALAYSIA ICELAND UAE BELGIUM NORWAY HONG KONG FRANCE QATAR AUSTRIA INDONESIA USA LUXEMBOURG UNITED KINGDOM ISRAEL TAIWAN ESTONIA JAPAN POLAND KOREA SWEDEN PHILIPPINES PORTUGAL JORDAN CZECH REPUBLIC INDIA KAZAKHSTAN LATVIA LITHUANIA SPAIN SLOVENIA ITALY RUSSIA HUNGARY ROMANIA UKRAINE TURKEY GREECE CHINA MAINLAND THAILAND COLOMBIA CHILE SLOVAK REPUBLIC CROATIA MEXICO ARGENTINA PERU VENEZUELA BULGARIA BRAZIL SOUTH AFRICA 1.71 Ranking 1 SINGAPORE SWITZERLAND FINLAND CANADA MALAYSIA UAE HONG KONG TAIWAN DENMARK JAPAN FRANCE NETHERLANDS IRELAND INDIA INDONESIA QATAR POLAND GERMANY ESTONIA BELGIUM AUSTRALIA CHINA MAINLAND KAZAKHSTAN ISRAEL LUXEMBOURG ICELAND NEW ZEALAND USA RUSSIA JORDAN UNITED KINGDOM PHILIPPINES KOREA NORWAY PORTUGAL HUNGARY ROMANIA SLOVENIA CZECH REPUBLIC SWEDEN GREECE ITALY LATVIA THAILAND LITHUANIA SPAIN AUSTRIA UKRAINE SLOVAK REPUBLIC TURKEY CHILE MEXICO COLOMBIA CROATIA BULGARIA PERU VENEZUELA ARGENTINA BRAZIL SOUTH AFRICA
29 UNIVERSITY EDUCATION MANAGEMENT EDUCATION University education Management education does not meet the needs of a competitive economy meets the needs of a competitive economy does not meet the needs of the business community meets the needs of the business community Ranking 1 SWITZERLAND CANADA FINLAND SINGAPORE DENMARK GERMANY USA IRELAND ISRAEL NETHERLANDS BELGIUM UAE HONG KONG MALAYSIA AUSTRIA AUSTRALIA ICELAND NEW ZEALAND SWEDEN INDONESIA NORWAY UNITED KINGDOM QATAR FRANCE LUXEMBOURG PORTUGAL ESTONIA PHILIPPINES LATVIA POLAND TAIWAN CHILE INDIA LITHUANIA RUSSIA CZECH REPUBLIC JORDAN SOUTH AFRICA ITALY ROMANIA JAPAN UKRAINE HUNGARY KAZAKHSTAN VENEZUELA SPAIN MEXICO THAILAND ARGENTINA TURKEY GREECE COLOMBIA KOREA SLOVENIA CHINA MAINLAND SLOVAK REPUBLIC PERU BRAZIL CROATIA BULGARIA 2.25 Ranking 1 SWITZERLAND USA SINGAPORE DENMARK FINLAND CANADA GERMANY NORWAY NETHERLANDS MALAYSIA ICELAND IRELAND HONG KONG UAE ISRAEL SWEDEN AUSTRALIA PORTUGAL AUSTRIA UKRAINE NEW ZEALAND BELGIUM LATVIA TAIWAN PHILIPPINES INDONESIA INDIA UNITED KINGDOM ESTONIA FRANCE QATAR CZECH REPUBLIC POLAND SOUTH AFRICA TURKEY LUXEMBOURG GREECE HUNGARY SLOVENIA KAZAKHSTAN LITHUANIA THAILAND ITALY RUSSIA CHINA MAINLAND JORDAN KOREA ROMANIA JAPAN SLOVAK REPUBLIC CHILE MEXICO SPAIN COLOMBIA BRAZIL CROATIA VENEZUELA ARGENTINA PERU BULGARIA
30 LANGUAGE SKILLS 2014 Language skills are not meeting the needs of enterprises are meeting the needs of enterprises Ranking 1 LUXEMBOURG DENMARK NETHERLANDS SWITZERLAND FINLAND UAE ICELAND CANADA SINGAPORE SWEDEN GREECE NORWAY LATVIA ISRAEL MALAYSIA BELGIUM PORTUGAL PHILIPPINES GERMANY SLOVENIA POLAND ROMANIA INDONESIA AUSTRIA LITHUANIA ESTONIA QATAR INDIA HONG KONG KOREA CROATIA SLOVAK REPUBLIC UKRAINE CZECH REPUBLIC TAIWAN AUSTRALIA KAZAKHSTAN JORDAN SOUTH AFRICA USA IRELAND NEW ZEALAND TURKEY CHINA MAINLAND ARGENTINA MEXICO BULGARIA FRANCE RUSSIA UNITED KINGDOM THAILAND ITALY PERU JAPAN HUNGARY SPAIN COLOMBIA VENEZUELA CHILE BRAZIL
31 Notes and Sources Collaboration with 55 Partner Institutes worldwide helps us gather complete, up-to-date and reliable statistics. The date shown in the criteria table is the reference year of the data. When statistical data is not available the name appears at the bottom of the statistical table and a dash is shown. When the data is one-year old, a 1 is shown next to the criterion value, a 2 represents data from two previous years, etc. Total public expenditure on education (%) Government Finance Statistics Yearbook 2013 Eurostat April 2014 National sources Jordan, Chile and Luxembourg: Budgetary central government. Total public expenditure on education per pupil Government Finance Statistics Yearbook 2013 National sources Croatia: Sum of expenditure from central government and local governments. Jordan, Chile and Luxembourg: Budgetary central government. Pupil-teacher ratio (primary education) UNESCO OECD Education at a Glance 2013 National sources For public and private institutions, based on full-time equivalent. Primary education (ISCED level 1): level of which the main function is to provide the basic elements of education at such establishments as elementary schools, primary schools. The ratio of students to teaching staff is calculated as the total number of full-time equivalent students divided by the total number of full-time equivalent educational personal. Teaching staff refers to professional personnel directly involved in teaching students. The classification includes classroom teachers; special education teacher; and other teachers who work with students as a whole class in a classroom, in small groups in a resource room, or in one-to-one teaching inside a regular classroom. Teaching staff also includes chairpersons of departments whose duties include some amount of teaching, but it does not include non-professional personnel who support teachers in providing instructions to students, such as teacher s aides and other paraprofessional personnel. Data are UNESCO or OECD estimates and from national statistics. Australia, Israel, Italy, Norway, and Russia: public institutions only. Hong Kong: figures refer to the position as at mid-september of the respective years (i.e. the beginning of an academic year spanning two calendar years). Teaching staff includes teachers as well as principles; figures cover local schools, special and international schools. Pupil-teacher ratio (secondary education) UNESCO OECD Education at a Glance 2013 National sources For public and private institutions, based on full-time equivalent. Secondary education (ISCED levels 2 and 3): level providing general and/or specialized instruction at middle schools, secondary schools, high schools, teacher training schools and schools of a vocational or technical nature. The ratio of students to teaching staff is calculated as the total number of full-time equivalent students divided by the total number of full-time equivalent educational personal. Teaching staff refers to professional personnel directly involved in teaching students. The classification includes classroom teachers; special education teacher; and other teachers who work with students as a whole class in a classroom, in small groups in a resource room, or in one-to-one 29
32 teaching inside a regular classroom. Teaching staff also includes chairpersons of departments whose duties include some amount of teaching, but it does not include non-professional personnel who support teachers in providing instructions to students, such as teacher s aides and other paraprofessional personnel. Data are UNESCO or OECD estimates and from national statistics. Australia, Canada, Ireland, Israel, Italy, Jordan, Norway and Russia: public institutions only. Australia: includes only programs in upper secondary education. Belgium: excludes independent private institutions. Hong Kong: figures refer to the position as at mid- September of the respective years (i.e. the beginning of an academic year spanning two calendar years). Teaching staff includes teachers as well as principles; figures cover local schools, special and international schools. Female labor force (%) OECD (2014), Main Economic Indicators - complete database National sources Estimate for Austria: break in series in Denmark: break in series in Indonesia: as of August for Malaysia: break in series in Portugal: methodological change in Romania: break in series in 2002, third quarter for Spain: break in series in Labor force growth OECD (2013), Main Economic Indicators - complete database National sources Estimates for Austria: break in series in Denmark: break in series in Lithuania: break in series census revised labor force figure downwards by 10% (emigration to EU over past decade). Latvia: break in series in Malaysia: break in series in Romania: break in series in 2002, third quarter for Portugal: methodological change in Spain: break in series in Lithuania: break in series census revised labor force figure downwards by 10% (emigration to EU over past decade). Cost-of-living index MERCER Cost of Living survey, March The Mercer survey covers 214 cities across five continents and measures the comparative cost of over 200 items in each location, including housing, transport, food, clothing, household goods and entertainment. It is the world s most comprehensive cost of living survey and is used to help multinational companies and governments determine compensation allowance for their expatriate employees. New York is used as the base city (=100) for the index and all cities are compared against New York. Currency movements are measured against the US dollar. The cost of housing often the biggest expense for expats - plays an important part in determining where cities are ranked. Mercer data is shown for cities (sometimes several data per country). Therefore, the WCC team made an average for each WCY country. Data is not always comparable over years (money fluctuations in 2010 and 2011). Executive Opinion Survey Every year, for our flagship publication, The IMD World Competitiveness Yearbook, we conduct an Executive Opinion Survey in order to complement the statistics that we use from international, national and regional sources. Whereas the Hard Data shows how competitiveness is measured over a specific period of time, the Survey Data measures competitiveness as it is perceived. The survey was designed to quantify issues that are not easily measured, for example: management practices, labor relations, corruption, environmental concerns or quality of life. The survey responses reflect present and future perceptions of competitiveness by business executives who are dealing with international business situations. Their responses are more recent and closer to reality since there is no time lag, which is often a problem with Hard Data that shows a picture of the past. The Executive Opinion Survey is sent to executives in top- and middle management in all of the economies covered by the WCY. In order to be statistically representative, we select a sample size which is proportional 30
33 to the GDP of each economy. The sample of respondents are representative of the entire economy, covering a cross-section of the business community in each economic sector: primary, manufacturing and services, based on their contribution to the GDP of the economy. The survey respondents are nationals or expatriates, located in local and foreign enterprises in the economy and which, in general, have an international dimension. They are asked to evaluate the present and expected competitiveness conditions of the economy in which they work and have resided during the past year, drawing from the wealth of their international experience, thereby ensuring that the evaluations portray an in-depth knowledge of their particular environment. We try to contact most IMD alumni and all responses returned to IMD are treated as confidential. The surveys are sent in January and are returned in April; in 2014, we received 4,300 responses from the 60 economies worldwide. The respondents assess the competitiveness issues by answering the questions on a scale of 1 to 6. The average value for each economy is then calculated and converted into a 0 to 10 scale. 31
34 Partner Institutes Argentina Economic Development and Institutions Research Program Faculty of Economic Science Catholic University of Argentina, Buenos Aires Dr. Carlos G. Garaventa, Dean Dr. Marcelo F. Resico, Senior Economist Dr. Ernesto A. O Connor, Senior Economist Ms. Sofía Ahualli, Research Assistant Australia CEDA - Committee for Economic Development of Australia, Melbourne Professor the Hon. Stephen Martin, Chief Executive Officer Ms. Roxanne Punton, National Communications and Marketing Manager Ms. Sarah-Jane Derby, Senior Research Analyst Austria Federation of Austrian Industries, Vienna Austrian Institute of Economic Research, Vienna Dr. Christian Helmenstein, Chief Economist Ms. Helena Zwickl Mr. Michael Oliver Belgium FEB - Federation of Enterprises in Belgium, Brussels Ms. Morgane Haid, Economist Brazil Fundação Dom Cabral, Minas Gerais, Innovation Center Professor Carlos Arruda, Associate Dean of Business Partnership and Professor of Innovation and Competitiveness at FDC Ms. Herica Righi, Assistant Professor at FDC Ms. Ludmila Pimenta, Economics Student and Intern at FDC Innovation Center Bulgaria Center for the Study of Democracy, Sofia Mr. Ruslan Stefanov, Director, Economic Program Ms. Daniela Mineva, Research Fellow, Economic Program Mr. Martin Tsanov, Analyst, Economic Program Canada Institute for Competitiveness & Prosperity, Toronto Mr. Jamison Steeve, Executive Director Ms. Dorinda So, Policy Analyst Intifin Group, Toronto Mr. Brett Berman, Managing Director 32
35 Chile Universidad de Chile, School of Economics and Business Dr. Enrique Manzur, Vice Dean Dr. Sergio Olavarrieta, Graduate Dean Mr. Pedro Hidalgo, Department Head China Hong Kong Hong Kong Trade Development Council Mr. Daniel Poon, Principal Economist Ms. Wenda Ma, Economist China Mainland China Institute for Development Planning, Tsinghua University Prof. Youqiang Wang, Executive Director Dr. Yongheng Yang, Associate Professor, Assistant Director Dr. Yizhi Xiong, Associate Professor Mr. Pu Gong, PhD Student Mr. Haoyuan Li, MPhil Student Ms. Liang Li, MPhil Student Colombia National Planning Department, Bogota Mrs. Tatyana Orozco de la Cruz, General Director Mr. Rodrigo Moreira, Enterprise Development Director Mr. John Rodríguez, Project Manager Mrs. Sara Patricia Rivera, Research Analyst Croatia National Competitiveness Council, Zagreb Ms. Jadranka Gable, Advisor Mr. Kresimir Jurlin, PhD, Researcher Czech Republic CERGE-EI, Prague Mr. Daniel Münich Dr. Vilem Semerak Denmark Confederation of Danish Industry (DI) Mr. Allan Sorensen Estonia Estonian Institute of Economic Research, Tallinn Ms. Marje Josing Ms. Ingrid Niklus Mr. Koit Nilson, Researcher Enterprise Estonia, Tallinn Mr. Ülari Alamets, Head of the Board 33
36 Finland ETLA, The Research Institute of the Finnish Economy, Helsinki Mr. Petri Rouvinen, Research Director Mr. Markku Kotilainen, Head of the Forecasting Group Mr. Vesa Vihriälä, Managing Director France Invest in France Agency, Paris Ms. Sylvie Montout, Economist Germany Federation of German Industries (BDI), Berlin Ms. Soveigh Jaeger, Department of Economic and Industrial Policy Greece Federation of Industries of Northern Greece, Thessaloniki Dr. Christos Georgiou, Director, Research and Documentation Department Mr. Constantinos Styliaras, MBA, Economist, Research and Documentation Department Foundation for Economic and Industrial Research (FEIR/IOBE), Athens Dr. Aggelos Tsakanikas, Research Director Hungary ICEG European Center, Budapest Ms. Renata Anna Jaksa, Director Mr. Oliver Kovacs, Research Fellow Iceland Icelandic Chamber of Commerce, Reykjavik Mr. Leifur Porbergsson India National Productivity Council, New Delhi Dr. K.P.Sunny, Group Head (Economic Services & Administration), Project Director Mr. Deepak Gupta, Assistant Director (Economic Services), Project Associate Indonesia Center for Strategic and International Studies, Jakarta Dr. Yose Rizal Damuri, Head of Department of Economics Ms. Pratiwi Kartika Mr. Dandy Rafitrandi, Research Assistant Ireland IDA Ireland, Investment and Development Agency, Dublin Israel The Federation of Israeli Chambers of Commerce, Tel-Aviv Ms. Israela Many, Deputy Managing Director of Economy and Tax Mr. Aviad Toub, Economist 34
37 Italy CONFINDUSTRIA, Economic Research Department, Rome Dr. Luca Paolazzi, Director Research Centre Dr. Pasquale Capretta, Senior Economist Japan Mitsubishi Research Institute, Inc., Tokyo Research Center for Policy and Economy Mr. Hirotsugu Sakai, Research Director Jordan Ministry of Planning and International Cooperation Jordan National Competitiveness Team Dr. Mukhallad Al-Omari, Director of Policies and Strategies Department Kawthar Al-Zubi, Team Leader Basma Arabiyat, Researcher Kazakhstan Economic Research Institute JSC of the Ministry of Economy and Budget Planning of the Republic of Kazakhstan, Astana Mr. Maksat Mukhanov, Chairman of the Board of the Economic Research Institute JSC Dr. Shakharbanu Zhakupova, Director of the Center for Strategic Development and Economic Research Ms. Sholpan Ibraimova, Head of the Department for Competitiveness Research Ms. Ardak Beisenova, Senior Expert of the Department for Competitiveness Research Ms. Rufinat Bissekenova, Senior Expert of the Department for Competitiveness Research Korea Korea Institute for International Economic Policy (KIEP) Dr. Heungchong Kim, Director, Department of Planning and Research Coordination Ms. Nayoun Park, Researcher Lithuania Enterprise Lithuania, Vilnius Mrs. Jurgita Butkeviciene, Export Department Manger Ms. Rasa Narusaityte, Senior Project Manager Luxembourg Chamber of Commerce of the Grand Duchy of Luxembourg Mr. Marc Wagener, Member of the Managing Board Ms. Annabelle Dullin, Economist Malaysia Malaysia Productivity Corporation (MPC), Petaling Jaya Dato Mohd Razali Hussain, Director General Ms. Lee Saw Hoon, Senior Director 35
38 Mexico Strategic Studies Center for Competitiveness, Saltillo Ing. Carlos Maroto Cabrera, General Director Lic. Carlos Maroto Espinosa, Project & Relationship Manager Lic. Natalia Maroto Espinosa, Administration Manager Netherlands Confederation of Netherlands Industry and Employers (VNO-NCW), The Hague. Mr. Paul van Kempen, Advisor Economic policy New Zealand New Zealand Institute of Management Inc, Wellington Mr. Garry Sturgess, Chief Executive Ms. Fiona Zhou, Administration & Registry Manager Norway Confederation of Norwegian Enterprise, Oslo Mr. Aslak Larsen Molvar, Senior Economist Mr. Morten Trasti, Advisor Peru CENTRUM Católica Graduate Business School, Lima Mr. Fernando D Alessio, Director General Mr. Luis Del Carpio, Director Center of Competitiveness Philippines Asian Institute of Management Policy Center, Makati City Ronald U. Mendoza, Executive Director Tristan A. Canare, Economist Mari Chrys R. Pablo, Economist Jean Rebecca D. Labios, Program Associate Charles Irvin S. Siriban, Research Associate Poland Warsaw School of Economics, Warsaw Dr. Bogdan A. Radomski, Associate Professor of Finance Dr. Marcin Nowakowski, Professor of International Business and Prorector Portugal FORMEDIA European Institute of Entrepreneurs and Managers, Lisbon Manuel Valle Manuel Costa Reis Duarte Harris Cruz 36
39 Qatar Ministry of Development Planning and Statistics, Department of Economic Development, Doha Dr. Frank Harrigan, Director, Department of Economic Development Dr. Issa Ibrahim, Economic Expert (Project Manager), Department of Economic Development Mr. Hassan Al-Sokary, Researcher, Ministry of Development Planning and Statistics / Statistics Sector Miss Shaikha Salem Al Hmoud, Statistical Researcher, Ministry of Development Planning / Statistics Sector Romania IRECSON Romanian Institute for Economic-Social Research and Polls, Bucharest Prof. Dumitru Porojan PhD, President Mr. Bogdan Ciocanel, Executive Director Russia Moscow Business School Ms. Elina Pechonova Singapore Economics Division, Ministry of Trade and Industry, Singapore Ms Yong Yik Wei, Director Mr Tan Kok Kong, Lead Economist Mr Kenny Goh, Senior Economist Mr Kuhan Harichandra, Senior Economist Dr Andy Feng, Senior Economist Singapore Business Federation Ms. Cheryl Kong, Assistant Executive Director Slovak Republic The F. A. Hayek Foundation, Bratislava Mr. Martin Kapko, Project Manager Slovenia Institute for Economic Research, Ljubljana Prof. Peter Stanovnik Ms. Sonja Uršic, M.A. University of Ljubljana, Faculty of Economics, Ljubljana Prof. Mateja Drnovšek Prof. Aleš Vahcic 37
40 South Africa Productivity SA, Midrand Mr. Bongani Coka, CEO Mr. Sello Mosai, Executive Manager, Knowledge Management, Value Chain Competitiveness Department Ms. Keneuoe Mosoang, Chief Economist, Value Chain Competitiveness Department Spain Spanish Confederation of Employers, Madrid Ms. Edita Pereira, Head of Economic Research Unit Ms. Paloma Blanco, Economic Research Unit Taiwan National Development Council, Taipei Dr. Chen, Chien-Liang, Deputy Minister Mr. Chen, Pao-Jui, Director of Economic Development Department Ms. Lee, Cho-Jin, Senior Economist Thailand Thailand Management Association, Bangkok Ms. Wanweera Rachdawong, Chief Executive Officer Ms. Pornkanok Wipusanawan, Director, TMA Center for Competitiveness Turkey Turkish Industrialists and Businessmen s Association (TUSIAD), Istanbul Economic Research Department Mr. Cem Dogan, Economist Ukraine International Management Institute (MIM-Kyiv) Dr. Iryna Tykhomyrova, President Dr. Volodymyr Danko, Professor Ms. Oksana Kukuruza, External Relations Director United Arab Emirates Emirates Competitiveness Council H.E Abdulla Nasser Lootah, Secretary General Venezuela National Council to Investment Promotion (CONAPRI) Mr. Eduardo Porcarelli, Executive Director Ms. Litsay Guerrero A, Economic Affairs & Investor Services Manager 38
41 PIONEERS IN COMPETITIVENESS SINCE 1989 IMD World Competitiveness Center
42 We are dedicated to the advancement of knowledge on world competitiveness by offering benchmarking services for countries and companies using the latest and most relevant data on the subject. There is no single nation in the world that has succeeded in a sustainable way without preserving the prosperity of its people. Competitiveness refers to such objective: it determines how countries, regions and companies manage their competencies to achieve long-term growth, generate jobs and increase welfare. Competitiveness is therefore a way towards progress that does not result in winners and losers: when two countries compete, both are better off. ARTURO BRIS Director IMD World Competitiveness Center Professor of Finance
43 IMD WORLD COMPETITIVENESS CENTER FOR OVER 25 YEARS IMD WORLD COMPETITIVENESS CENTER HAS PIONEERED RESEARCH ON HOW NATIONS AND ENTERPRISES COMPETE TO LAY THE FOUNDATIONS FOR FUTURE PROSPERITY. THE COMPETITIVENESS OF NATIONS IS PROBABLY ONE OF THE MOST SIGNIFICANT DEVELOPMENTS IN MODERN MANAGEMENT AND IMD INTENDS TO REMAIN A LEADER IN THIS FIELD. The IMD World Competitiveness Center is dedicated to the advancement of knowledge on world competitiveness by gathering the latest and most relevant data on the subject and by analyzing the policy consequences. The Center conducts its mission in cooperation with a network of 55 partner institutes worldwide to provide the government, business and academic community with the following services:»» Competitiveness Assessment & Education»» Programs/Workshops/Conferences on Competitiveness»» Special country/regional competitiveness reports»» World Competitiveness Online In our efforts to match the dynamism of competitiveness, we are committed to further our cutting-edge research and to broadening our activities portfolio.
44 IMD WORLD COMPETITIVENESS YEARBOOK 2014 THE REFERENCE ON THE MARKET The IMD World Competitiveness Yearbook is the leading annual report on the competitiveness of nations and has been published by IMD since The yearbook benchmarks the performance of 60 countries based on 338 criteria (2/3 statistical data and 1/3 survey data). It measures the different facets of competitiveness, grouped into four factors (economic performance, government efficiency, business efficiency and infrastructure). The main sections in the IMD World Competitiveness Yearbook: Rankings, Country Profiles and Statistical Tables. The IMD World Competitiveness Yearbook is considered an invaluable research tool for benchmarking competitiveness performance and is used by: Business: To determine investment plans and location assessment. Government: Leaders use our essential information to benchmark policies. Academics: Professors and students use our exceptional wealth of data to analyze the complex mechanism of world competitiveness.
45 IMD WORLD COMPETITIVENESS ONLINE Online access to the latest competitiveness data find, compare and customize! World Competitiveness Online (WCO) is an interactive and regularly updated website that provides access to the world s largest competitiveness database, news, videos and our monthly newsletter. COUNTRY PROFILES View a country s overall performance, learn about its evolution, its strengths and weaknesses and access all criteria used to assess its competitiveness. SELECT DATA Based on the World Competitiveness Yearbook s methodology you can view any selection of countries, rankings and data, over 19-year time series for most criteria. Key Figures»» 60 countries assessed»» 338 criteria measuring different facets of competitiveness»» 2/3 hard statistical data (international/ national sources)»» 1/3 survey data (Executive Opinion Survey)»» Earliest data on the market every year»» Online database (World Competitiveness Online) regularly updated Data can be viewed in tables or charts and downloaded in Excel and CSV. IMD WORLD COMPETITIVENESS PACKAGE Immediate access to the IMD World Competitiveness Online, the largest database on world competitiveness for customized research, regularly updated. The IMD World Competitiveness Yearbook + CD (available in June), the reference report on the competitiveness of nations since 1989.
46 CUSTOMIZED SOLUTIONS COMPANY COMPETITIVENESS SOLUTIONS The IMD World Competitiveness Center supports businesses in their efforts to strengthen their competitiveness by providing them with analytical tools including company specific competitiveness analyses and by developing customized programs for enterprises. Competitiveness Programs: Our Competitiveness programs focus on assessing and enhancing your company s competitiveness by focusing on the factors that drive market leadership. The programs facilitate the executives to understand their role in improving the competitiveness of the company by:»» Discussing the main trends that are shaping the world economy today.»» Thinking from the outside-in in terms of the implications for your company, customers and business partners.»» Identifying strategies to win the market and create value for your company and your customers.»» Highlighting the success factors found in the most competitive environments.»» Discussing best practices to enhance competitiveness.»» Examining results and priorities for your company. In our efforts to match the dynamism of competitiveness, we are committed to further our cutting-edge research and to broadening our activities portfolio.
47 COUNTRY AND REGIONAL COMPETITIVENESS ASSESSMENT Benchmark your economy against the World Competitiveness Yearbook countries! The IMD World Competitiveness Center supports governments highlight competitive advantages and uncover opportunities. In addition to its flagship publication, the IMD World Competitiveness Yearbook, the IMD World Competitiveness Center also aids governments to meet their needs through various customized solutions, including workshops and conferences. The report helps you to better assess the competitiveness of your country or region and to pursue insightful decision making. Special Competitiveness Reports Special reports are produced for governments that wish to assess their international competitiveness and benchmark their performance. These reports:»» Analyze competitiveness on the basis of over 300 criteria, using the Center methodology.»» Allow cross-country comparisons on a regional and global scale.»» Provide insights that can inform decisionmaking.»» Help to establish priorities and policies.»» Are used to promote investment in a country, state or region. Special reports are developed in cooperation with a local Partner Institute. Special projects, reports and workshops have been completed for these governments: United Arab Emirates Oman Kuala Lumpur Kazakhstan Abu Dhabi (Emirate) Saudi Arabia Qatar Dubai (Emirate) Sabah (State of Malaysia) Selangor (State of Malaysia) Ile-de-France (Region in France) Klang Valley (Region in Malaysia) Galicia (Region in Spain) Terengganu (State of Malaysia) Mongolia
48 CONTACT US: IMD World Competitiveness Center Chemin de Bellerive 23, P.O. Box 915, CH-1001 Lausanne - Switzerland Central tel: [email protected] GET IN CONTACT WITH THE IMD WORLD COMPETITIVENESS CENTER: THE IMD DIFFERENCE IMD is a top-ranked business school. We are the experts in developing global leaders through high impact executive education. Why IMD?»» We are 100% focused on real-world executive development»» We offer Swiss excellence with a global perspective»» We have a flexible, customized and effective approach FOLLOW US ON Chemin de Bellerive 23 Central tel: P.O. Box 915 Central fax: CH-1001 Lausanne [email protected] Switzerland IMD, IMD INTERNATIONAL and IMD INTERNATIONAL REAL WORLD. REAL LEARNING are trademarks of IMD International Institute for Management Development. position of your company. With a long-term focus and want to understand the driving forces of competitiveness in the business world.»» If you are a government official or a member of an international agency and need access to the most comprehensive study of world competitiveness; if you need to assess the competitiveness of a particular country or region; if you want to learn from other countries success stories.»» If you are a researcher and want to access the largest database of competitiveness factors worldwide, spanning 60 economies in the last 25 years. Photography: Régis Colombo, Nate Henderson, Richard Juilliart, Oliver O Hanlon, Thierry Porchet, Yves Ryncki, Jean Scheim (Black and White) IMD 2014»» If you are a corporate executive interested in the market
IMD World Talent Report. By the IMD World Competitiveness Center
 2015 IMD World Talent Report By the IMD World Competitiveness Center November 2015 IMD World Talent Report 2015 Copyright 2015 by IMD Institute for Management Ch. de Bellerive 23 P.O. Box 915 CH-1001 Lausanne
World Consumer Income and Expenditure Patterns
 World Consumer Income and Expenditure Patterns 2014 14th edi tion Euromonitor International Ltd. 60-61 Britton Street, EC1M 5UX TableTypeID: 30010; ITtableID: 22914 Income Algeria Income Algeria Income
41 T Korea, Rep. 52.3. 42 T Netherlands 51.4. 43 T Japan 51.1. 44 E Bulgaria 51.1. 45 T Argentina 50.8. 46 T Czech Republic 50.4. 47 T Greece 50.
 Overall Results Climate Change Performance Index 2012 Table 1 Rank Country Score** Partial Score Tendency Trend Level Policy 1* Rank Country Score** Partial Score Tendency Trend Level Policy 21 - Egypt***
Foreign Taxes Paid and Foreign Source Income INTECH Global Income Managed Volatility Fund
 Income INTECH Global Income Managed Volatility Fund Australia 0.0066 0.0375 Austria 0.0045 0.0014 Belgium 0.0461 0.0138 Bermuda 0.0000 0.0059 Canada 0.0919 0.0275 Cayman Islands 0.0000 0.0044 China 0.0000
Appendix 1: Full Country Rankings
 Appendix 1: Full Country Rankings Below please find the complete rankings of all 75 markets considered in the analysis. Rankings are broken into overall rankings and subsector rankings. Overall Renewable
Reporting practices for domestic and total debt securities
 Last updated: 4 September 2015 Reporting practices for domestic and total debt securities While the BIS debt securities statistics are in principle harmonised with the recommendations in the Handbook on
How To Get A New Phone System For Your Business
 Cisco Phone Systems Telemarketing Script Cold Call 1. Locate Contact: Name listed Owner General Manager / Office Manager Chief BDM (Business Decision Maker) Note: Avoid talking to IT since this is not
Triple-play subscriptions to rocket to 400 mil.
 Triple-play criptions to rocket to 400 mil. Global triple-play criptions will reach 400 million by 2017; up by nearly 300 million on the end-2011 total and up by 380 million on the 2007 total, according
Consolidated International Banking Statistics in Japan
 Total (Transfer Consolidated cross-border claims in all currencies and local claims in non-local currencies Up to and including one year Maturities Over one year up to two years Over two years Public Sector
Supported Payment Methods
 Supported Payment Methods Global In the global payments market, credit cards are the most popular payment method. However, BlueSnap expands the payment selection by including not only the major credit
SunGard Best Practice Guide
 SunGard Best Practice Guide What Number Should I Use? www.intercalleurope.com Information Hotline 0871 7000 170 +44 (0)1452 546742 [email protected] Reservations 0870 043 4167 +44 (0)1452
July 2015. Figure 1. 1 The index is set to 100 in 2000. House prices are deflated by country CPIs in most cases.
 July 2015 Globally, house prices continue a slow recovery. The Global House Price Index, an equally weighted average of real house prices in nearly 60 countries, inched up slowly during the past two years
Supported Payment Methods
 Sell Globally in a Snap Supported Payment Methods Global In the global payments market, credit cards are the most popular payment method. However, BlueSnap expands the payment selection by including not
Global Effective Tax Rates
 www.pwc.com/us/nes Global s Global s April 14, 2011 This document has been prepared pursuant to an engagement between PwC and its Client. As to all other parties, it is for general information purposes
International Call Services
 International Call Services Affordable rates for business calls. Wherever you are in the world. We ve got plenty to say when it comes to staying in touch when you re overseas. We have agreements with 443
Global Dialing Comment. Telephone Type. AT&T Direct Number. Access Type. Dial-In Number. Country. Albania Toll-Free 00-800-0010 888-426-6840
 Below is a list of Global Access Numbers, in order by country. If a Country has an AT&T Direct Number, the audio conference requires two-stage dialing. First, dial the AT&T Direct Number. Second, dial
GfK PURCHASING POWER INTERNATIONAL
 GfK PURCHASING POWER INTERNATIONAL 1 Agenda 1. Europe 3 2. Americas 45 3. Asia & Near East 54 4. Afrika 66 5. Australia 68 6. Overview of countries and available levels 70 2 2 EUROPE 4 GfK
PISA FOR SCHOOLS. How is my school comparing internationally? Andreas Schleicher Director for Education and Skills OECD. Madrid, September 22 nd
 PISA FOR SCHOOLS How is my school comparing internationally? Andreas Schleicher Director for Education and Skills OECD Madrid, September 22 nd PISA in brief Over half a million students representing 28
Global Network Access International Access Rates
 Global Network Access International Access Rates We know that you need to communicate with your partners, colleagues and customers around the world. We make every effort to understand the difficulties
The Role of Banks in Global Mergers and Acquisitions by James R. Barth, Triphon Phumiwasana, and Keven Yost *
 The Role of Banks in Global Mergers and Acquisitions by James R. Barth, Triphon Phumiwasana, and Keven Yost * There has been substantial consolidation among firms in many industries in countries around
Know the Facts. Aon Hewitt Country Profiles can help: Support a decision to establish or not establish operations in a specific country.
 Aon Hewitt Country Profiles Your eguide to employment requirements and practices Profiles for nearly 90 countries worldwide Risk. Reinsurance. Human Resources. Know the Facts Whether you are a newcomer
Brochure More information from http://www.researchandmarkets.com/reports/1339929/
 Brochure More information from http://www.researchandmarkets.com/reports/1339929/ The 2011 World Forecasts of Machine Tools That Remove Material by Laser or Light, Photon, Ultrasonic, Electro-Discharge,
The big pay turnaround: Eurozone recovering, emerging markets falter in 2015
 The big pay turnaround: Eurozone recovering, emerging markets falter in 2015 Global salary rises up compared to last year But workers in key emerging markets will experience real wage cuts Increase in
GE Grid Solutions. Providing solutions that keep the world energized Press Conference Call Presentation November 12, 2015. Imagination at work.
 GE Grid Solutions Providing solutions that keep the world energized Press Conference Call Presentation November 12, 2015 Press Conference Call Recording: Toll Free: +1 (855) 859-2056 Toll: +1 (404) 537-3406
DSV Air & Sea, Inc. Aerospace Sector. DSV Air & Sea, Inc. Aerospace
 DSV Air & Sea, Inc. Aerospace Sector DSV Air & Sea, Inc. Aerospace Introduction to DSV DSV is a global supplier of transport and logistics services. We have offices in more than 70 countries and an international
BT Premium Event Call and Web Rate Card
 BT Managed Event and BT Self-Managed Event (also referred to as Express, Plus and Premium) Conference Bridge and Call for Booked Audio Conferencing Services will comprise the following for each phone-conference:
Region Country AT&T Direct Access Code(s) HelpLine Number. Telstra: 1 800 881 011 Optus: 1 800 551 155
 HelpLine Number. Telstra: 1 800 881 011 Optus: 1 800 551 155") Mondelēz International HelpLine Numbers March 22, 2013 There are many ways to report a concern or suspected misconduct, including discussing it with your supervisor, your supervisor s supervisor, another
Mondelēz International HelpLine Numbers March 22, 2013 There are many ways to report a concern or suspected misconduct, including discussing it with your supervisor, your supervisor s supervisor, another
MAUVE GROUP GLOBAL EMPLOYMENT SOLUTIONS PORTFOLIO
 MAUVE GROUP GLOBAL SOLUTIONS PORTFOLIO At Mauve Group, we offer a variety of complete employee management services such as Global Employment Solutions (GES), Professional Employment Outsourcing (PEO),
Verdict Financial: Wealth Management. Data Collection and Forecasting Methodologies
 Verdict Financial: Wealth Management Data Collection and Forecasting Methodologies April 2014 Contents Global Wealth Markets Methodology Methodology Methodology 2 Global Wealth Markets Section 1: Global
E-Seminar. Financial Management Internet Business Solution Seminar
 E-Seminar Financial Management Internet Business Solution Seminar Financial Management Internet Business Solution Seminar 3 Welcome 4 Objectives 5 Financial Management 6 Financial Management Defined 7
Senate Committee: Education and Employment. QUESTION ON NOTICE Budget Estimates 2015-2016
 Senate Committee: Education and Employment QUESTION ON NOTICE Budget Estimates 2015-2016 Outcome: Higher Education Research and International Department of Education and Training Question No. SQ15-000549
2015 Country RepTrak The World s Most Reputable Countries
 2015 Country RepTrak The World s Most Reputable Countries July 2015 The World s View on Countries: An Online Study of the Reputation of 55 Countries RepTrak is a registered trademark of Reputation Institute.
EMEA BENEFITS BENCHMARKING OFFERING
 EMEA BENEFITS BENCHMARKING OFFERING COVERED COUNTRIES SWEDEN FINLAND NORWAY ESTONIA R U S S I A DENMARK LITHUANIA LATVIA IRELAND PORTUGAL U. K. NETHERLANDS POLAND BELARUS GERMANY BELGIUM CZECH REP. UKRAINE
CMMI for SCAMPI SM Class A Appraisal Results 2011 End-Year Update
 CMMI for SCAMPI SM Class A 2011 End-Year Update Software Engineering Institute Carnegie Mellon University Pittsburgh, PA 15213 1 Outline Introduction Current Status Community Trends Organizational Trends
Global AML Resource Map Over 2000 AML professionals
 www.pwc.co.uk Global AML Resource Map Over 2000 AML professionals January 2016 Global AML Resources: Europe France Italy Jersey / Guernsey 8 Ireland 1 Portugal 7 Luxembourg 5 United Kingdom 1 50 11 Spain
Consumer Credit Worldwide at year end 2012
 Consumer Credit Worldwide at year end 2012 Introduction For the fifth consecutive year, Crédit Agricole Consumer Finance has published the Consumer Credit Overview, its yearly report on the international
DIR Contract #DIR-TSO-2610 Amendment #1 Appendix C Price Index
 CONFERENCING SERVICES Customer Price Price per minute/hour/mont h etc. Comment Audio Conferencing Operator Assisted Dial-Out $0.1530 Per Minute OADI Toll-Free Dial-In (Operator Assisted) $0.0816 Per Minute
Cisco IOS Public-Key Infrastructure: Deployment Benefits and Features
 Data Sheet Cisco IOS Public-Key Infrastructure: Deployment Benefits and Features Introduction to Public Key Infrastructure Public Key Infrastructure (PKI) offers a scalable method of securing networks,
Digital TV Research. http://www.marketresearch.com/digital-tv- Research-v3873/ Publisher Sample
 Digital TV Research http://www.marketresearch.com/digital-tv- Research-v3873/ Publisher Sample Phone: 800.298.5699 (US) or +1.240.747.3093 or +1.240.747.3093 (Int'l) Hours: Monday - Thursday: 5:30am -
Table 1: TSQM Version 1.4 Available Translations
 Quintiles, Inc. 1 Tables 1, 2, & 3 below list the existing and available translations for the TSQM v1.4, TSQM vii, TSQM v9. If Quintiles does not have a translation that your Company needs, the Company
OCTOBER 2010. Russell-Parametric Cross-Sectional Volatility (CrossVol ) Indexes Construction and Methodology
 Indexes Construction and Methodology") OCTOBER 2010 Russell-Parametric Cross-Sectional Volatility (CrossVol ) Indexes Construction and Methodology SEPTEMBER 2010 Russell-Parametric Cross-Sectional Volatility (CrossVol) Indexes Construction
OCTOBER 2010 Russell-Parametric Cross-Sectional Volatility (CrossVol ) Indexes Construction and Methodology SEPTEMBER 2010 Russell-Parametric Cross-Sectional Volatility (CrossVol) Indexes Construction
Audio Conferencing Service Comprehensive Telecommunications Services Group Number 77017 Award Number 20268 Contract Number PS63110
 Audio Conferencing Comprehensive Telecommunications s Number PS63110 Audio Conferencing, Function or Device Reservationless Conferencing Solution Setup Meeting Center Multimedia Minute - Self-, Automated
A Nielsen Report Global Trust in Advertising and Brand Messages. April 2012
 A Nielsen Report Global Trust in Advertising and Brand Messages April 2012 CONSUMER TRUST IN EARNED ADVERTISING GROWS IN IMPORTANCE Earned media sources remain most credible Trust in traditional paid advertising
relating to household s disposable income. A Gini Coefficient of zero indicates
 Gini Coefficient The Gini Coefficient is a measure of income inequality which is based on data relating to household s disposable income. A Gini Coefficient of zero indicates perfect income equality, whereas
CISCO METRO ETHERNET SERVICES AND SUPPORT
 SERVICES OVERIVEW CISCO METRO ETHERNET SERVICES AND SUPPORT In the ever-changing communications market, incumbent service providers are looking for ways to grow revenue. One method is to deploy service
Editorial for Summer Edition
 Editorial for Summer Edition of the SOCIETAS ET IURISPRUDENTIA 2015 Dear readers and friends, let me introduce the second issue of the third volume of SOCIETAS ET IURISPRUDENTIA, an international scientific
Ninth United Nations Survey of Crime Trends and Operations of Criminal Justice Systems POLICE
 Indicators as defined by the (- ) POLICE 2. Crimes recorded in criminal (police) statistics, by type of crime including attempts to commit crimes 2.2 Total recorded intentional homicide, completed (c)
Composition of Premium in Life and Non-life Insurance Segments
 2012 2nd International Conference on Computer and Software Modeling (ICCSM 2012) IPCSIT vol. 54 (2012) (2012) IACSIT Press, Singapore DOI: 10.7763/IPCSIT.2012.V54.16 Composition of Premium in Life and
Report on Government Information Requests
 Report on Government Information July 1 - December 31, 2014 apple Apple takes our commitment to protecting your data very seriously and we work incredibly hard to deliver the most secure hardware, software
How many students study abroad and where do they go?
 From: Education at a Glance 2012 Highlights Access the complete publication at: http://dx.doi.org/10.1787/eag_highlights-2012-en How many students study abroad and where do they go? Please cite this chapter
Enterprise Mobility Suite (EMS) Overview
 Overview") Enterprise Mobility Suite (EMS) Overview Industry trends driving IT pressures Devices Apps Big data Cloud 52% of information workers across 17 countries report using 3+ devices for work Enable my employees
Enterprise Mobility Suite (EMS) Overview Industry trends driving IT pressures Devices Apps Big data Cloud 52% of information workers across 17 countries report using 3+ devices for work Enable my employees
Building a Global Internet Company: Driving Traffic to Your Site. Benjamin Edelman Harvard Business School
 Building a Global Internet Company: Driving Traffic to Your Site Benjamin Edelman Harvard Business School Mumbai, India January 20, 2012 About me Assistant Professor, Harvard Business School Teaching:
2012 Country RepTrak Topline Report
 2012 Country RepTrak Topline Report The World s View on Countries: An Online Study of the Reputation of 50 Countries RepTrak is a registered trademark of Reputation Institute. Global Reputation Knowledge
U.S. Trade Overview, 2013
 U.S. Trade Overview, 213 Stephanie Han & Natalie Soroka Trade and Economic Analysis Industry and Analysis Department of Commerce International Trade Administration October 214 Trade: A Vital Part of the
Expenditure and Outputs in the Irish Health System: A Cross Country Comparison
 Expenditure and Outputs in the Irish Health System: A Cross Country Comparison Paul Redmond Overview This document analyzes expenditure and outputs in the Irish health system and compares Ireland to other
THE CISCO CRM COMMUNICATIONS CONNECTOR GIVES EMPLOYEES SECURE, RELIABLE, AND CONVENIENT ACCESS TO CUSTOMER INFORMATION
 CUSTOMER SUCCESS STORY THE CISCO CRM COMMUNICATIONS CONNECTOR GIVES EMPLOYEES SECURE, RELIABLE, AND CONVENIENT ACCESS TO CUSTOMER INFORMATION EXECUTIVE SUMMARY CUSTOMER NAME Coleman Technologies INDUSTRY
Cisco Blended Agent: Bringing Call Blending Capability to Your Enterprise
 DATA SHEET Cisco Blended Agent: Bringing Call Blending Capability to Your Enterprise Cisco ICM software has traditionally enabled companies to distribute inbound service volume to a variety of termination
Accuracy counts! SENSORS WITH ANALOG OUTPUT
 Accuracy counts! SENSORS WITH ANALOG OUTPUT OTHER APPLICATIONS: KEY ADVANTAGES: Distance measurement Positioning Profile detection Deformation monitoring Vibration monitoring Process monitoring Detection
Cisco Conference Connection
 Data Sheet Cisco Conference Connection Cisco IP Communications a comprehensive system of powerful, enterprise-class solutions including IP telephony, unified communications, IP video/audio conferencing,
COST Presentation. COST Office Brussels, 2013. ESF provides the COST Office through a European Commission contract
 COST Presentation COST Office Brussels, 2013 COST is supported by the EU Framework Programme ESF provides the COST Office through a European Commission contract What is COST? COST is the oldest and widest
Clinical Trials. Local Trial Requirements
 Clinical Trials Clinical trials insurance covers the legal liabilities of the insured in respect of clinical trials for bodily injury arising from the trial. The coverage provided by Newline is on the
NORTHERN TRUST GLOBAL TRADE CUT OFF DEADLINES
 Argentina T+3 Only Govt Tsy Bills (Letes) have a settlement cycle of T+1, other fixed income securities have a T+3 settlement cycle. T+0 OTC Market (MAE) SD 1200 9amSD-2 9am SD T+3 T+0 SD 1500 9am SD 9am
Fall 2015 International Student Enrollment
 Fall 2015 International Student Enrollment Prepared by The Office of International Affairs Nova Southeastern University Nova Southeastern University International Student Statistics Fall 2015 International
What Is the Total Public Spending on Education?
 What Is the Total Public Spending on Education? Indicator On average, OECD countries devote 12.9% of total public expenditure to, but values for individual countries range from less than 10% in the Czech
HP Technology Services HP NonStop Server Support
 Reference guide HP Technology Services HP NonStop Server Support HP Global NonStop Solution Center (GNSC) Table of contents Global NonStop Solution Center... 2 Product support for HP NonStop and Neoview
CISCO IP PHONE SERVICES SOFTWARE DEVELOPMENT KIT (SDK)
") DATA SHEET CISCO IP PHONE SERVICES SOFTWARE DEVELOPMENT KIT (SDK) Cisco Systems IP Phone Services bring the power of the World Wide Web to Cisco IP Phones. An integral part of a Cisco AVVID (Architecture
DATA SHEET CISCO IP PHONE SERVICES SOFTWARE DEVELOPMENT KIT (SDK) Cisco Systems IP Phone Services bring the power of the World Wide Web to Cisco IP Phones. An integral part of a Cisco AVVID (Architecture
TOWARDS PUBLIC PROCUREMENT KEY PERFORMANCE INDICATORS. Paulo Magina Public Sector Integrity Division
 TOWARDS PUBLIC PROCUREMENT KEY PERFORMANCE INDICATORS Paulo Magina Public Sector Integrity Division 10 th Public Procurement Knowledge Exchange Platform Istanbul, May 2014 The Organization for Economic
Introducing GlobalStar Travel Management
 Introducing GlobalStar Travel Management GlobalStar is a worldwide travel management company owned and managed by local entrepreneurs. In total over 80 market leading enterprises, representing over US$13
FDI performance and potential rankings. Astrit Sulstarova Division on Investment and Enterprise UNCTAD
 FDI performance and potential rankings Astrit Sulstarova Division on Investment and Enterprise UNCTAD FDI perfomance index The Inward FDI Performance Index ranks countries by the FDI they receive relative
The investment fund statistics
 The investment fund statistics Narodowy Bank Polski (NBP) publishes data reported by investment funds which have been defined in Art. 3 section 1 of the Act of 27 May 2004 on investment funds (Journal
Overview menu: ArminLabs - DHL Medical Express Online-Pickup: Access to the Online System
 Access to the Online System Overview menu: Create shipment: Preselected - Here you can order your shipment including the Pickup 0049 821 78093150 ArminLabs DHL Medical Express Online-Pickup-Manual DHL
Credit & Debit Card Payments. Factsheet
 Credit & Debit Card Payments Factsheet Contents 1. Card Types... 2 2. Supported countries... 2 3. First Funding via Credit / Debit Card... 3 4. Transaction Currencies... 4 5. Currency Conversion... 4 6.
2014 UXPA Salary Survey. November 2014
 2014 UXPA Salary Survey November 2014 Summary 1355 Total Responses from 58 Countries Salary Data converted to US Dollars Median Salary decreased 2% (in constant US Dollars) to $92,500 Median US Salary
NetFlow Feature Acceleration
 WHITE PAPER NetFlow Feature Acceleration Feature Description Rapid growth in Internet and intranet deployment and usage has created a major shift in both corporate and consumer computing paradigms. This
Introducing Clinical Trials Insurance Services Ltd
 Introducing Clinical Trials Insurance Services Ltd Important Staff Richard Kelly Managing Director Richard joined CTIS in 2006 having previously managed the Pharmaceutical wholesale division at Heath Lambert
CISCO CONTENT SWITCHING MODULE SOFTWARE VERSION 4.1(1) FOR THE CISCO CATALYST 6500 SERIES SWITCH AND CISCO 7600 SERIES ROUTER
 FOR THE CISCO CATALYST 6500 SERIES SWITCH AND CISCO 7600 SERIES ROUTER") PRODUCT BULLETIN NO. 2438 CISCO CONTENT SWITCHING MODULE SOFTWARE VERSION 4.1(1) FOR THE CISCO CATALYST 6500 SERIES SWITCH AND CISCO 7600 SERIES ROUTER NEW FEATURES New features of the Cisco Content Switching
PRODUCT BULLETIN NO. 2438 CISCO CONTENT SWITCHING MODULE SOFTWARE VERSION 4.1(1) FOR THE CISCO CATALYST 6500 SERIES SWITCH AND CISCO 7600 SERIES ROUTER NEW FEATURES New features of the Cisco Content Switching
The World Market for Medical, Surgical, or Laboratory Sterilizers: A 2013 Global Trade Perspective
 Brochure More information from http://www.researchandmarkets.com/reports/2389480/ The World Market for Medical, Surgical, or Laboratory Sterilizers: A 2013 Global Trade Perspective Description: This report
It looks like your regular telephone.
 It looks like your regular telephone. But it s a lot better. CISCO PHONE SYSTEM SOLUTIONS FOR SMALL AND MEDIUM BUSINESSES Between the increased productivity and administrative savings we ve experienced,
Dial 00-800-0010, when prompted to enter calling number, enter 800-544-6666 American Samoa 1-800-544-6666 Number can be dialed directly Angola 0199
 National Financial Services International Calling Instructions Albania 00-800-0010 Dial 00-800-0010, when prompted to enter American Samoa 1-800-544-6666 Number can be dialed directly Angola 0199 Dial
Global Economic Briefing: Global Inflation
 Global Economic Briefing: Global Inflation August 7, Dr. Edward Yardeni -97-7 eyardeni@ Debbie Johnson -- djohnson@ Mali Quintana -- aquintana@ Please visit our sites at www. blog. thinking outside the
Business Phone. Product solutions. Key features
 Product solutions Enjoy free calls and significant savings on your business landline bills with from International. Set-up is simple and you don t need to change your existing telephone numbers, plus there
List of tables. I. World Trade Developments
 List of tables I. World Trade Developments 1. Overview Table I.1 Growth in the volume of world merchandise exports and production, 2010-2014 39 Table I.2 Growth in the volume of world merchandise trade
International Higher Education in Facts and Figures. Autumn 2013
 International Higher Education in Facts and Figures Autumn 2013 UK Higher Education International Unit International higher education in facts and figures covers the majority of the UK higher education
Trends in Digitally-Enabled Trade in Services. by Maria Borga and Jennifer Koncz-Bruner
 Trends in Digitally-Enabled Trade in Services by Maria Borga and Jennifer Koncz-Bruner Digitally-enabled are those for which digital information and communications technologies (ICT) play an important
World Leasing Yearbook 2016
 Brochure More information from http://www.researchandmarkets.com/reports/3687603/ World Leasing Yearbook 2016 Description: The 2016 edition provides valuable reference data for all players in the field,
Cisco IT Data Center and Operations Control Center Tour
 Cisco IT Data Center and Operations Control Center Tour Inside the Build Room Page 1 of 8 5. Inside the Build Room Introduction Figure 1. Inside the Build Room Ian: The purpose of the Build room is for
How To Calculate Euro Area Competitiveness Indicators
 JULY 2012 EURO AREA EXCHANGE RATE-BASED COMPETITIVENESS INDICATORS: A COMPARISON OF METHODOLOGIES AND EMPIRICAL RESULTS by Bernadette Lauro and Martin Schmitz, 1 This paper will be presented at the Sixth
Student performance in mathematics, reading and science
 NORWAY Key findings Norway performs around average in mathematics, above average in reading, but below average in science. Norway s mean performance in mathematics declined since the previous PISA assessment
SUPPLEMENTAL EXECUTIVE RETIREMENT PLANS IN CANADA
 HEALTH WEALTH CAREER SUPPLEMENTAL EXECUTIVE RETIREMENT PLANS IN CANADA KEY FINDINGS FROM THE MERCER SERP DATABASE (2014 UPDATE) APRIL 2015 b CONTENTS 1. Introduction...2 2. Highlights of the Mercer SERP
THE ADVANTAGES OF A UK INTERNATIONAL HOLDING COMPANY
 THE ADVANTAGES OF A UK INTERNATIONAL HOLDING COMPANY Ideal Characteristics for the Location of an International Holding Company Laurence Binge +44 (0)1372 471117 [email protected] www.woolford.co.uk
The Determinants of Global Factoring By Leora Klapper
 The Determinants of Global Factoring By Leora Klapper Factoring services can be traced historically to Roman times. Closer to our own era, factors arose in England as early as the thirteenth century, as
Chapter 4A: World Opinion on Terrorism
 1 Pew Global Attitudes Project, Spring 2007 Now I m going to read you a list of things that may be problems in our country. As I read each one, please tell me if you think it is a very big problem, a moderately
CISCO MDS 9000 FAMILY PERFORMANCE MANAGEMENT
 WHITE PAPER CISCO MDS 9000 FAMILY PERFORMANCE MANAGEMENT As storage area networks (SANs) grow, so do the challenges for monitoring and resolving performance issues. Summary views of networkwide historical
CISCO NETWORK CONNECTIVITY CENTER
 DATA SHEET CISCO NETWORK CONNECTIVITY CENTER The Cisco Network Connectivity Center (NCC) delivers end-to-end management across multiple tools, technologies, and silos. From networks and applications to
Configuring DHCP for ShoreTel IP Phones
 Configuring DHCP for ShoreTel IP Phones Network Requirements and Preparation 3 Configuring DHCP for ShoreTel IP Phones The ShoreTel server provides the latest application software and configuration information
What Proportion of National Wealth Is Spent on Education?
 Indicator What Proportion of National Wealth Is Spent on Education? In 2008, OECD countries spent 6.1% of their collective GDP on al institutions and this proportion exceeds 7.0% in Chile, Denmark, Iceland,
TRANSFERS FROM AN OVERSEAS PENSION SCHEME
 PENSIONS PROFILE DECEMBER 2011 TRANSFERS FROM AN OVERSEAS PENSION SCHEME = Summary A simplified guide to the process: 1. Individual requests transfer from their overseas pension scheme to their UK registered