CIS 467/602-01: Data Visualization
|
|
|
- Kelley Warren
- 10 years ago
- Views:
Transcription
1 CIS 467/602-01: Data Visualization Maps Dr. David Koop

2 Assignment 3 ~dkoop/cis467/assignment3.html Networks and Maps Little East Women's Basketball data Network of games with forcedirected layout Mapping all schools Mapping UMassD games (602-01) Tournament Partition Map Sample Solution Posted CORS Issue Fixed Due Wednesday, April 1 2

3 Geometry Shape information that is not determined by an attribute Data is often derived from realworld positions - Medical scans - Earth boundaries We use the geometry because we are familiar with the existing layout Geometry (Spatial) Position [Munzner (ill. Maguire), 2014] Tables Networks & Trees Fields Geometry Clusters, Sets, Lists Items Items (nodes) Grids Items Items Attributes Links Positions Positions Attributes Attributes 3
, 2014] Tables Networks & Trees Fields Geometry Clusters, Sets, Lists Items Items (nodes) Grids")
4 Geographic Data Spatial data Cartography: the science of drawing maps - Lots of history and well-established procedures - May also have non-spatial attributes associated with items - Thematic cartography: integrate these non-spatial attributes (e.g. population, life expectancy, etc.) Goals: - Respect cartographic principles - Understand data with geographic references with the visualization principles 4
 Goals: - Respect cartographic principles - Understand data with geographic references with the")
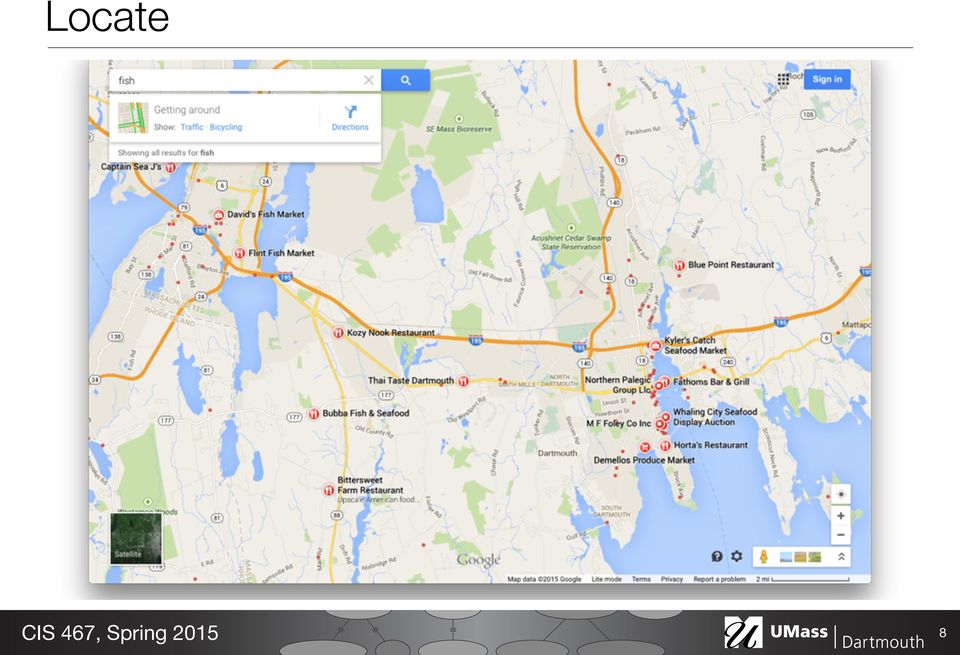
5 Search Tasks Location known Location unknown Target known Lookup Locate Target unknown Browse Explore [Munzner (ill. Maguire), 2014] 5

6 Lookup 6

7 Route Maps Rendering Effective Route Maps: Improving Usability Through Generalization Maneesh Agrawala Chris Stolte Stanford University Figure 1: Three route maps for the same route rendered by (left) a standard computer-mapping system, (middle) a person, and (right) LineDrive, our route map rendering system. The standard computer-generated map is difficult to use because its large, constant scale factor causes the short roads to vanish and because it is cluttered with extraneous details such as city names, parks, and roads that are far away from the route. Both the handdrawn map and the LineDrive map exaggerate the lengths of the short roads to ensure their visibility while maintainaing a simple, clean design that emphasizes the most essential information for following the route. Note that the handdrawn map was created without seeing either the standard computer-generated map or the LineDrive map. (Handdrawn map courtesy of Mia Trachinger.) Abstract Route maps, which depict a path from one location to another, have emerged as one of the most popular applications on the Web. Current computer-generated route maps, however, are often very difficlarity of the map and to emphasize the most important information [16, 21]. This type of generalization, performed either consciously or sub-consciously, is prevalent both in quickly sketched maps and in professionally designed route maps that appear in print advertisements, invitations, and subway schedules [25, 13]. [Agrawala & Stolte, 2001] 7

8 Locate 8
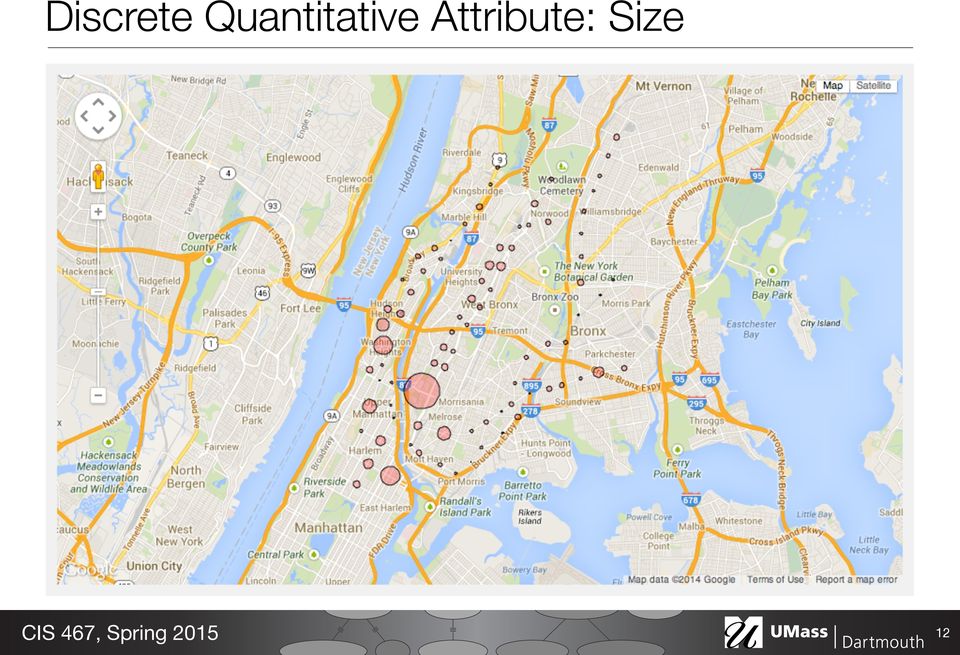
9 Adding Data Discrete: a value is associated with a specific position - Size - Color Hue - Charts Continuous: each spatial position has a value (fields) - Heatmap - Isolines 9
 - Heatmap - Isolines 9")
10 Discrete Categorical Attribute: Shape [Acadia NP, National Park Service] 10

11 Discrete Categorical Attribute: Shape [Acadia NP, National Park Service] 10

12 Discrete Quantitative Attribute: Color Saturation 11

13 Discrete Quantitative Attribute: Size 12
14 Discrete Quantitative Attributes: Bar Chart [ 13

15 Continuous Quantitative Attribute: Color Hue [ 14

16 Time as the attribute [ 15

17 Isolines [USGS via Wikipedia] 16
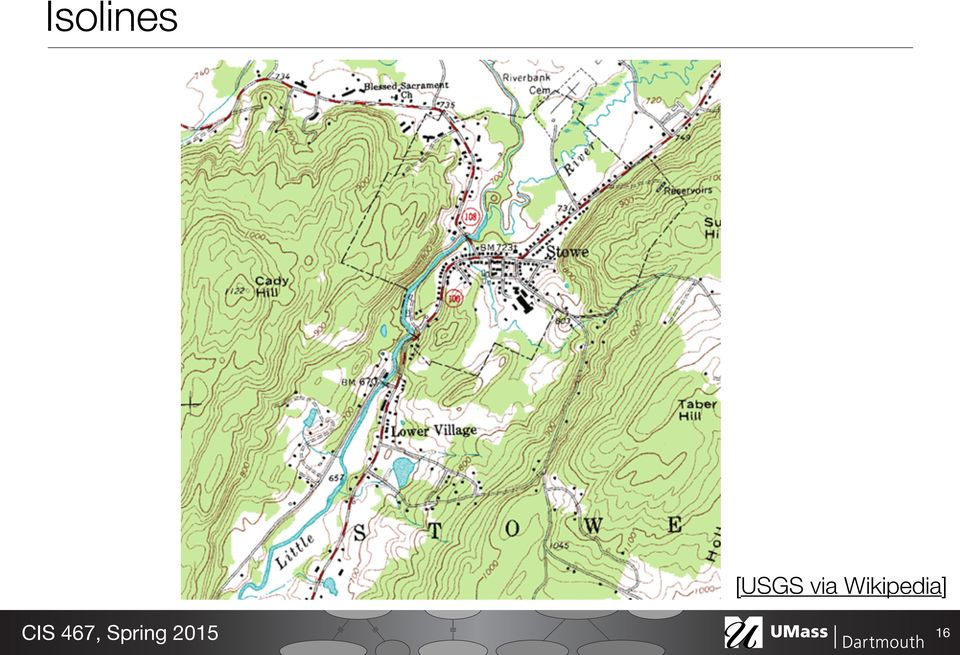
18 Isolines Scalar fields: - value at each location - sampled on grids Isolines use derived data from the scalar field - Interpret field as representing continuous values - Derived data is geometry: new lines that represent the same attribute value Scalability: dozens of levels Other encodings? 17

19 Choropleths 18

20 Area Marks and Color Hue & Saturation 19

21 Map Projection [P. Foresman, Wikimedia] 20
22 Flattening the Sphere? [USGS Map Projections] 21
23 Lambert Conformal Conic Projection [USGS Map Projections] 22
24 Map Projections [ 23
25 Midterm Fairly Difficult CIS467: Possible: 100, Median: 70, Mean: 66.85, Std. Dev.: CIS602: Possible: 115, Median: 69, Mean: 71.04, Std. Dev: Specific Questions: - D3 Update/Enter/Exit - Adding Extra Attribute: Separability - Why Bar/Line Chart? Quantitative & Categorical - Color: Hue or Saturation or Luminance? 24
CS171 Visualization. The Visualization Alphabet: Marks and Channels. Alexander Lex [email protected]. [xkcd]
![CS171 Visualization. The Visualization Alphabet: Marks and Channels. Alexander Lex alex@seas.harvard.edu. [xkcd]](/thumbs/39/19465011.jpg "CS171 Visualization. The Visualization Alphabet: Marks and Channels. Alexander Lex alex@seas.harvard.edu. [xkcd]") CS171 Visualization Alexander Lex [email protected] The Visualization Alphabet: Marks and Channels [xkcd] This Week Thursday: Task Abstraction, Validation Homework 1 due on Friday! Any more problems
CS171 Visualization Alexander Lex [email protected] The Visualization Alphabet: Marks and Channels [xkcd] This Week Thursday: Task Abstraction, Validation Homework 1 due on Friday! Any more problems
Best Practices in Data Visualizations. Vihao Pham 2014
 Best Practices in Data Visualizations Vihao Pham 2014 Agenda Best Practices in Data Visualizations Why We Visualize Understanding Data Visualizations Enhancing Visualizations Visualization Considerations
Best Practices in Data Visualizations. Vihao Pham January 29, 2014
 Best Practices in Data Visualizations Vihao Pham January 29, 2014 Agenda Best Practices in Data Visualizations Why We Visualize Understanding Data Visualizations Enhancing Visualizations Visualization
Information visualization examples
 Information visualization examples 350102: GenICT II 37 Information visualization examples 350102: GenICT II 38 Information visualization examples 350102: GenICT II 39 Information visualization examples
Visualization Techniques for Geospatial Data IDV 2015/2016
 Interactive Data Visualization 07 Visualization Techniques for Geospatial Data IDV 2015/2016 Notice n Author t João Moura Pires ([email protected]) n This material can be freely used for personal or academic
Thematic Map Types. Information Visualization MOOC. Unit 3 Where : Geospatial Data. Overview and Terminology
 Thematic Map Types Classification according to content: Physio geographical maps: geological, geophysical, meteorological, soils, vegetation Socio economic maps: historical, political, population, economy,
DATA VISUALIZATION GABRIEL PARODI STUDY MATERIAL: PRINCIPLES OF GEOGRAPHIC INFORMATION SYSTEMS AN INTRODUCTORY TEXTBOOK CHAPTER 7
 DATA VISUALIZATION GABRIEL PARODI STUDY MATERIAL: PRINCIPLES OF GEOGRAPHIC INFORMATION SYSTEMS AN INTRODUCTORY TEXTBOOK CHAPTER 7 Contents GIS and maps The visualization process Visualization and strategies
Visualization. For Novices. ( Ted Hall ) University of Michigan 3D Lab Digital Media Commons, Library http://um3d.dc.umich.edu
 University of Michigan 3D Lab Digital Media Commons, Library http://um3d.dc.umich.edu") Visualization For Novices ( Ted Hall ) University of Michigan 3D Lab Digital Media Commons, Library http://um3d.dc.umich.edu Data Visualization Data visualization deals with communicating information about
Visualization For Novices ( Ted Hall ) University of Michigan 3D Lab Digital Media Commons, Library http://um3d.dc.umich.edu Data Visualization Data visualization deals with communicating information about
All Visualizations Documentation
 All Visualizations Documentation All Visualizations Documentation 2 Copyright and Trademarks Licensed Materials - Property of IBM. Copyright IBM Corp. 2013 IBM, the IBM logo, and Cognos are trademarks
Visualizing Historical Agricultural Data: The Current State of the Art Irwin Anolik (USDA National Agricultural Statistics Service)
") Visualizing Historical Agricultural Data: The Current State of the Art Irwin Anolik (USDA National Agricultural Statistics Service) Abstract This paper reports on methods implemented at the National Agricultural
Visualizing Historical Agricultural Data: The Current State of the Art Irwin Anolik (USDA National Agricultural Statistics Service) Abstract This paper reports on methods implemented at the National Agricultural
Data Visualization Handbook
 SAP Lumira Data Visualization Handbook www.saplumira.com 1 Table of Content 3 Introduction 20 Ranking 4 Know Your Purpose 23 Part-to-Whole 5 Know Your Data 25 Distribution 9 Crafting Your Message 29 Correlation
GEO-VISUALIZATION SUPPORT FOR MULTIDIMENSIONAL CLUSTERING
 Geoinformatics 2004 Proc. 12th Int. Conf. on Geoinformatics Geospatial Information Research: Bridging the Pacific and Atlantic University of Gävle, Sweden, 7-9 June 2004 GEO-VISUALIZATION SUPPORT FOR MULTIDIMENSIONAL
GEOGRAPHIC INFORMATION SYSTEMS CERTIFICATION
 GEOGRAPHIC INFORMATION SYSTEMS CERTIFICATION GIS Syllabus - Version 1.2 January 2007 Copyright AICA-CEPIS 2009 1 Version 1 January 2007 GIS Certification Programme 1. Target The GIS certification is aimed
Introduction to GIS (Basics, Data, Analysis) & Case Studies. 13 th May 2004. Content. What is GIS?
 & Case Studies. 13 th May 2004. Content. What is GIS?") Introduction to GIS (Basics, Data, Analysis) & Case Studies 13 th May 2004 Content Introduction to GIS Data concepts Data input Analysis Applications selected examples What is GIS? Geographic Information
Introduction to GIS (Basics, Data, Analysis) & Case Studies 13 th May 2004 Content Introduction to GIS Data concepts Data input Analysis Applications selected examples What is GIS? Geographic Information
What is GIS? Geographic Information Systems. Introduction to ArcGIS. GIS Maps Contain Layers. What Can You Do With GIS? Layers Can Contain Features
 What is GIS? Geographic Information Systems Introduction to ArcGIS A database system in which the organizing principle is explicitly SPATIAL For CPSC 178 Visualization: Data, Pixels, and Ideas. What Can
an introduction to VISUALIZING DATA by joel laumans
 an introduction to VISUALIZING DATA by joel laumans an introduction to VISUALIZING DATA iii AN INTRODUCTION TO VISUALIZING DATA by Joel Laumans Table of Contents 1 Introduction 1 Definition Purpose 2 Data
Microsoft Business Intelligence Visualization Comparisons by Tool
 Microsoft Business Intelligence Visualization Comparisons by Tool Version 3: 10/29/2012 Purpose: Purpose of this document is to provide a quick reference of visualization options available in each tool.
Objective of this chapter is;
 Making Maps With GIS Objective of this chapter is; Getting Started with GIS Chapter 7 Good maps made by GIS follow the accepted rules of cartographic representation and symbolization. Maps terminology
Improving Data Mining of Multi-dimension Objects Using a Hybrid Database and Visualization System
 Improving Data Mining of Multi-dimension Objects Using a Hybrid Database and Visualization System Yan Xia, Anthony Tung Shuen Ho School of Electrical and Electronic Engineering Nanyang Technological University,
Intro to GIS Winter 2011. Data Visualization Part I
 Intro to GIS Winter 2011 Data Visualization Part I Cartographer Code of Ethics Always have a straightforward agenda and have a defining purpose or goal for each map Always strive to know your audience
THREE-DIMENSIONAL CARTOGRAPHIC REPRESENTATION AND VISUALIZATION FOR SOCIAL NETWORK SPATIAL ANALYSIS
 CO-205 THREE-DIMENSIONAL CARTOGRAPHIC REPRESENTATION AND VISUALIZATION FOR SOCIAL NETWORK SPATIAL ANALYSIS SLUTER C.R.(1), IESCHECK A.L.(2), DELAZARI L.S.(1), BRANDALIZE M.C.B.(1) (1) Universidade Federal
Topic Maps Visualization
 Topic Maps Visualization Bénédicte Le Grand, Laboratoire d'informatique de Paris 6 Introduction Topic maps provide a bridge between the domains of knowledge representation and information management. Topics
Visualizations. Cyclical data. Comparison. What would you like to show? Composition. Simple share of total. Relative and absolute differences matter
 Visualizations Variable width chart Table or tables with embedded charts Bar chart horizontal Circular area chart per item Many categories Cyclical data Non-cyclical data Single or few categories Many
CS 207 - Data Science and Visualization Spring 2016
 CS 207 - Data Science and Visualization Spring 2016 Professor: Sorelle Friedler [email protected] An introduction to techniques for the automated and human-assisted analysis of data sets. These
Introduction to Map Design
 Introduction to Map Design Introduction This document is intended to help people without formal training in map design learn to produce maps for publication or electronic display using ArcView, a desktop
MAP GENERALIZATION FOR OSMASTERMAP DATA IN LOCATION BASED SERVICES & MOBILE GIS APPLICATIONS
 Geoinformatics 2004 Proc. 12th Int. Conf. on Geoinformatics Geospatial Information Research: Bridging the Pacific and Atlantic University of Gävle, Sweden, 7-9 June 2004 MAP GENERALIZATION FOR OSMASTERMAP
Department of Geography University of Idaho. GEOG 390: Geographic Visualization January to May 2010 COURSE OUTLINE. (subject to change)
") Department of Geography University of Idaho GEOG 390: Geographic Visualization January to May 2010 COURSE OUTLINE (subject to change) Instructor Classes meet Mondays, Wednesdays 3:30 5:45 pm at MCCL 206
Department of Geography University of Idaho GEOG 390: Geographic Visualization January to May 2010 COURSE OUTLINE (subject to change) Instructor Classes meet Mondays, Wednesdays 3:30 5:45 pm at MCCL 206
Data Visualization. Prepared by Francisco Olivera, Ph.D., Srikanth Koka Department of Civil Engineering Texas A&M University February 2004
 Data Visualization Prepared by Francisco Olivera, Ph.D., Srikanth Koka Department of Civil Engineering Texas A&M University February 2004 Contents Brief Overview of ArcMap Goals of the Exercise Computer
Utilizing spatial information systems for non-spatial-data analysis
 Jointly published by Akadémiai Kiadó, Budapest Scientometrics, and Kluwer Academic Publishers, Dordrecht Vol. 51, No. 3 (2001) 563 571 Utilizing spatial information systems for non-spatial-data analysis
Hierarchical Data Visualization
 Hierarchical Data Visualization 1 Hierarchical Data Hierarchical data emphasize the subordinate or membership relations between data items. Organizational Chart Classifications / Taxonomies (Species and
Computer Graphics with OpenGL 3e
 Computer Graphics with OpenGL 3e Chapter1 A surveys of Computer Graphics Computer Graphics Applications Graphs and Charts Computer-Aided Design Virtual-Reality Environments Data Visualizations Educations
Business Intelligence and Process Modelling
 Business Intelligence and Process Modelling F.W. Takes Universiteit Leiden Lecture 2: Business Intelligence & Visual Analytics BIPM Lecture 2: Business Intelligence & Visual Analytics 1 / 72 Business Intelligence
DESIGN PATTERNS OF WEB MAPS. Bin Li Department of Geography Central Michigan University Mount Pleasant, MI 48858 USA (517) 774-1165 bin.li@cmich.
 774-1165 bin.li@cmich.") DESIGN PATTERNS OF WEB MAPS Bin Li Department of Geography Central Michigan University Mount Pleasant, MI 48858 USA (517) 774-1165 [email protected] Abstract Web maps have reached the level of depth and
DESIGN PATTERNS OF WEB MAPS Bin Li Department of Geography Central Michigan University Mount Pleasant, MI 48858 USA (517) 774-1165 [email protected] Abstract Web maps have reached the level of depth and
Making a Choropleth map with Google Fusion Tables
 Making a Choropleth map with Google Fusion Tables Choropleth map is a thematic map based on predefined aerial units. Its areas are coloured or shaded to show the measurement of the statistical variables
Data Visualization. Brief Overview of ArcMap
 Data Visualization Prepared by Francisco Olivera, Ph.D., P.E., Srikanth Koka and Lauren Walker Department of Civil Engineering September 13, 2006 Contents: Brief Overview of ArcMap Goals of the Exercise
Visualization Software
 Visualization Software Maneesh Agrawala CS 294-10: Visualization Fall 2007 Assignment 1b: Deconstruction & Redesign Due before class on Sep 12, 2007 1 Assignment 2: Creating Visualizations Use existing
Buckets: Visualizing NBA Shot Data CPSC 547 Project Proposal
 Buckets: Visualizing NBA Shot Data CPSC 547 Project Proposal [email protected] This game has always been, and will always be, about buckets. Bill Russell, 11-time NBA champion Domain, Task, Dataset Sports
GIS. Digital Humanities Boot Camp Series
 GIS Digital Humanities Boot Camp Series GIS Fundamentals GIS Fundamentals Definition of GIS A geographic information system (GIS) is used to describe and characterize spatial data for the purpose of visualizing
SUMA K4205 GIS for Sustainability Management. Instructor Information: Dara Mendeloff GIS Specialist, CIESIN
 SUMA K4205 GIS for Sustainability Management Instructor Information: Dara Mendeloff GIS Specialist, CIESIN Course Description Geographic Information Systems (GIS) are a system of computer software, data
Introduction to Geographical Data Visualization
 perceptual edge Introduction to Geographical Data Visualization Stephen Few, Perceptual Edge Visual Business Intelligence Newsletter March/April 2009 The important stories that numbers have to tell often
ART A. PROGRAM RATIONALE AND PHILOSOPHY
 ART A. PROGRAM RATIONALE AND PHILOSOPHY Art education is concerned with the organization of visual material. A primary reliance upon visual experience gives an emphasis that sets it apart from the performing
PERSONALIZED WEB MAP CUSTOMIZED SERVICE
 CO-436 PERSONALIZED WEB MAP CUSTOMIZED SERVICE CHEN Y.(1), WU Z.(1), YE H.(2) (1) Zhengzhou Institute of Surveying and Mapping, ZHENGZHOU, CHINA ; (2) North China Institute of Water Conservancy and Hydroelectric
Introduction to ArcView 3.2a
 Introduction to ArcView 3.2a Training Center U.S. Geological Survey Center for Earth Resources Observation and Science (EROS) Sioux Falls, South Dakota, USA Introduction to ArcView 3.2a Introduction to
DKAN. Data Warehousing, Visualization, and Mapping
 DKAN Data Warehousing, Visualization, and Mapping Acknowledgements We d like to acknowledge the NuCivic team, led by Andrew Hoppin, which has done amazing work creating open source tools to make data available
Principles of Data Visualization for Exploratory Data Analysis. Renee M. P. Teate. SYS 6023 Cognitive Systems Engineering April 28, 2015
 Principles of Data Visualization for Exploratory Data Analysis Renee M. P. Teate SYS 6023 Cognitive Systems Engineering April 28, 2015 Introduction Exploratory Data Analysis (EDA) is the phase of analysis
Unit 1 Maps, Time, and World History
 Unit 1 Maps, Time, and World History Introduction to Unit This unit specifically focuses on the spatial and temporal frameworks world historians use to organize their discipline. Through an exploration
Visualizing Multidimensional Data Through Time Stephen Few July 2005
 Visualizing Multidimensional Data Through Time Stephen Few July 2005 This is the first of three columns that will feature the winners of DM Review's 2005 data visualization competition. I want to extend
Innovative Information Visualization of Electronic Health Record Data: a Systematic Review
 Innovative Information Visualization of Electronic Health Record Data: a Systematic Review Vivian West, David Borland, W. Ed Hammond February 5, 2015 Outline Background Objective Methods & Criteria Analysis
Learning about GPS and GIS
 Learning about GPS and GIS Standards 4.4 Understand geographic information systems (G.I.S.). B12.1 Understand common surveying techniques used in agriculture (e.g., leveling, land measurement, building
Applications of Dynamic Representation Technologies in Multimedia Electronic Map
 Applications of Dynamic Representation Technologies in Multimedia Electronic Map WU Guofeng CAI Zhongliang DU Qingyun LONG Yi (School of Resources and Environment Science, Wuhan University, Wuhan, Hubei.
Digital Cadastral Maps in Land Information Systems
 LIBER QUARTERLY, ISSN 1435-5205 LIBER 1999. All rights reserved K.G. Saur, Munich. Printed in Germany Digital Cadastral Maps in Land Information Systems by PIOTR CICHOCINSKI ABSTRACT This paper presents
Gephi Tutorial Visualization
 Gephi Tutorial Welcome to this Gephi tutorial. It will guide you to the basic and advanced visualization settings in Gephi. The selection and interaction with tools will also be introduced. Follow the
STATE OF NEVADA Department of Administration Division of Human Resource Management CLASS SPECIFICATION
 STATE OF NEVADA Department of Administration Division of Human Resource Management CLASS SPECIFICATION TITLE PHOTOGRAMMETRIST/CARTOGRAPHER V 39 6.102 PHOTOGRAMMETRIST/CARTOGRAPHER II 33 6.110 PHOTOGRAMMETRIST/CARTOGRAPHER
Assessment Tasks Pass theory exams at > 70%. Meet, or exceed, outcome criteria for projects and assignments.
 CENTRAL OREGON COMMUNITY COLLEGE: GEOGRAPHIC INFORMATION SYSTEM PROGRAM 1 CENTRAL OREGON COMMUNITY COLLEGE Associate Degree Geographic Information Systems Program Outcome Guide (POG) Program Outcome Guide
Graph/Network Visualization
 Graph/Network Visualization Data model: graph structures (relations, knowledge) and networks. Applications: Telecommunication systems, Internet and WWW, Retailers distribution networks knowledge representation
Unresolved issues with the course, grades, or instructor, should be taken to the point of contact.
 Graphics and Data Visualization CS1501 Fall 2013 Syllabus Course Description With the advent of powerful data-mining technologies, engineers in all disciplines are increasingly expected to be conscious
Choosing a successful structure for your visualization
 IBM Software Business Analytics Visualization Choosing a successful structure for your visualization By Noah Iliinsky, IBM Visualization Expert 2 Choosing a successful structure for your visualization
Visualizing the Top 400 Universities
 Int'l Conf. e-learning, e-bus., EIS, and e-gov. EEE'15 81 Visualizing the Top 400 Universities Salwa Aljehane 1, Reem Alshahrani 1, and Maha Thafar 1 [email protected], [email protected], [email protected]
GEOGRAPHIC INFORMATION SYSTEMS
 GIS GEOGRAPHIC INFORMATION SYSTEMS FOR CADASTRAL MAPPING Chapter 6 2015 Cadastral Mapping Manual 6-0 GIS - GEOGRAPHIC INFORMATION SYSTEMS What is GIS For a long time people have sketched, drawn and studied
USING SELF-ORGANIZING MAPS FOR INFORMATION VISUALIZATION AND KNOWLEDGE DISCOVERY IN COMPLEX GEOSPATIAL DATASETS
 USING SELF-ORGANIZING MAPS FOR INFORMATION VISUALIZATION AND KNOWLEDGE DISCOVERY IN COMPLEX GEOSPATIAL DATASETS Koua, E.L. International Institute for Geo-Information Science and Earth Observation (ITC).
Descriptive statistics Statistical inference statistical inference, statistical induction and inferential statistics
 Descriptive statistics is the discipline of quantitatively describing the main features of a collection of data. Descriptive statistics are distinguished from inferential statistics (or inductive statistics),
DEVELOPMENT OF THE PLANETARY CARTOGRAPHY WEB-SITE WITH OPEN SOURCE CONTENT MANAGEMENT SYSTEM
 CO-131 DEVELOPMENT OF THE PLANETARY CARTOGRAPHY WEB-SITE WITH OPEN SOURCE CONTENT MANAGEMENT SYSTEM ROZHNEV I. Moscow State University of Geodesy and Cartography, PUSHKINO, RUSSIAN FEDERATION Considerable
JavaScript and jquery for Data Analysis and Visualization
 Brochure More information from http://www.researchandmarkets.com/reports/2766360/ JavaScript and jquery for Data Analysis and Visualization Description: Go beyond design concepts build dynamic data visualizations
A Short Introduction on Data Visualization. Guoning Chen
 A Short Introduction on Data Visualization Guoning Chen Data is generated everywhere and everyday Age of Big Data Data in ever increasing sizes need an effective way to understand them History of Visualization
Visualizing Data from Government Census and Surveys: Plans for the Future
 Censuses and Surveys of Governments: A Workshop on the Research and Methodology behind the Estimates Visualizing Data from Government Census and Surveys: Plans for the Future Kerstin Edwards March 15,
Creating 2D Drawings from 3D AutoCAD Models
 Creating 2D Drawings from 3D AutoCAD Models David Piggott CrWare, LP GD205-2P This class explores the various techniques in creating 2D part and assembly drawings from 3D AutoCAD models. As part of the
GEOGRAPHIC INFORMATION SYSTEMS
 GEOGRAPHIC INFORMATION SYSTEMS WHAT IS A GEOGRAPHIC INFORMATION SYSTEM? A geographic information system (GIS) is a computer-based tool for mapping and analyzing spatial data. GIS technology integrates
Citizen participation has become an increasingly
 Ground Truthing Policy Using Participatory Map-Making to Connect Citizens and Decision Makers Shalini P. Vajjhala Citizen participation has become an increasingly important component of development planning
VISUALIZING HIERARCHICAL DATA. Graham Wills SPSS Inc., http://willsfamily.org/gwills
 VISUALIZING HIERARCHICAL DATA Graham Wills SPSS Inc., http://willsfamily.org/gwills SYNONYMS Hierarchical Graph Layout, Visualizing Trees, Tree Drawing, Information Visualization on Hierarchies; Hierarchical
OBI 11g Data Visualization Best Practices
 OBI 11g Data Visualization Best Practices Tim Vlamis Vlamis Software Solutions 816-781-2880 http://www.vlamis.com Dan Vlamis Vlamis Software Solutions 816-781-2880 http://www.vlamis.com Copyright 2012,
This project is an opportunity to create a unique logo for a fictional
 Logo Design For record Company Dr. Paula DiMarco [email protected] This project is an opportunity to create a unique logo for a fictional record company. Objective: To create a logo for record,
COM CO P 5318 Da t Da a t Explora Explor t a ion and Analysis y Chapte Chapt r e 3
 COMP 5318 Data Exploration and Analysis Chapter 3 What is data exploration? A preliminary exploration of the data to better understand its characteristics. Key motivations of data exploration include Helping
Information Visualization Multivariate Data Visualization Krešimir Matković
 Information Visualization Multivariate Data Visualization Krešimir Matković Vienna University of Technology, VRVis Research Center, Vienna Multivariable >3D Data Tables have so many variables that orthogonal
Vector storage and access; algorithms in GIS. This is lecture 6
 Vector storage and access; algorithms in GIS This is lecture 6 Vector data storage and access Vectors are built from points, line and areas. (x,y) Surface: (x,y,z) Vector data access Access to vector
Raster: The Other GIS Data
 04-Raster_Tutorial_Arcgis_93.Doc Page 1 of 11 Raster: The Other GIS Data Objectives Understand the raster format and how it is used to model continuous geographic phenomena Understand how projections &
NEW MEXICO Grade 6 MATHEMATICS STANDARDS
 PROCESS STANDARDS To help New Mexico students achieve the Content Standards enumerated below, teachers are encouraged to base instruction on the following Process Standards: Problem Solving Build new mathematical
UTM Zones for the US UTM UTM. Uniform strips Scalable coordinates
 UTM UTM Uniform strips Scalable coordinates Globally consistent, most popular projection/coordinate system for regional to global scale geospatial data (i.e. satellite images global scale datasets USGS/EDC)
A Correlation of. to the. South Carolina Data Analysis and Probability Standards
 A Correlation of to the South Carolina Data Analysis and Probability Standards INTRODUCTION This document demonstrates how Stats in Your World 2012 meets the indicators of the South Carolina Academic Standards
An example. Visualization? An example. Scientific Visualization. This talk. Information Visualization & Visual Analytics. 30 items, 30 x 3 values
 Information Visualization & Visual Analytics Jack van Wijk Technische Universiteit Eindhoven An example y 30 items, 30 x 3 values I-science for Astronomy, October 13-17, 2008 Lorentz center, Leiden x An
SPATIAL ANALYSIS IN GEOGRAPHICAL INFORMATION SYSTEMS. A DATA MODEL ORffiNTED APPROACH
 POSTER SESSIONS 247 SPATIAL ANALYSIS IN GEOGRAPHICAL INFORMATION SYSTEMS. A DATA MODEL ORffiNTED APPROACH Kirsi Artimo Helsinki University of Technology Department of Surveying Otakaari 1.02150 Espoo,
4.1 Exploratory Analysis: Once the data is collected and entered, the first question is: "What do the data look like?"
 Data Analysis Plan The appropriate methods of data analysis are determined by your data types and variables of interest, the actual distribution of the variables, and the number of cases. Different analyses
TOP New Features of Oracle Business Intelligence 11g
 10 TOP New Features of Oracle Business Intelligence 11g TABLE OF CONTENTS Feature 1 New Chart Choices Funnel Chart 2 Trellis Chart 3 Waterfall 4 Tile Diagram 5 Feature 2 Recommended Visualization 6 Feature
3D Modeling Principles
 3D Modeling Principles These modeling principles are fundamental standards 3D artists need to think about EVERY time they sit down to model something. Use of these principles will lead to great looking
Project Setup and Data Management Tutorial
 Project Setup and Heavy Construction Edition Version 1.20 Corporate Office Trimble Navigation Limited Engineering and Construction Division 5475 Kellenburger Road Dayton, Ohio 45424-1099 U.S.A. Phone: