Thematic Map Types. Information Visualization MOOC. Unit 3 Where : Geospatial Data. Overview and Terminology
|
|
|
- Christiana Gilbert
- 8 years ago
- Views:
Transcription
1 Thematic Map Types Classification according to content: Physio geographical maps: geological, geophysical, meteorological, soils, vegetation Socio economic maps: historical, political, population, economy, cultural, voting, epidemics Technical maps: navigation, cadastre (shows boundaries and ownership of land parcels), civil engineering 9 Information Visualization MOOC Unit 3 Where : Geospatial Data Overview and Terminology Relevant Research Disciplines: Geography, Cartography, Statistics, Information Visualization

2 General Map Types Emphasis on location: General reference maps Topographic maps Thematic maps Focus here is on thematic maps that emphasize the spatial distribution of one or more geographic variables. 11 Thematic Map Types Classification according to content: Physio geographical maps: geological, geophysical, meteorological, soils, vegetation Socio economic maps: historical, political, population, economy, cultural, voting, epidemics Technical maps: navigation, cadastre (shows boundaries and ownership of land parcels), civil engineering 12

3 Representation of Geospatial Data Addresses US Zip codes, see US Census blocks US Congressional districts US States Countries Latitude/Longitude 13 Terminology Geocode: Location of a record (e.g., address, census tract, postal code, geographic coordinates). Geographic coordinates: Locations on the surface of the Earth expressed in degrees of latitude and longitude. Geodesic: The shortest distance between two points on the surface of a spheroid. Great Circle: Shortest distance between two points on Earth i.e., a circular line which runs around the Earth at its fattest point. Gazetteers: Lists of geographic places and their coordinates, along with other information such as area, population, and cultural statistics used to geocode see Yahoo! Geocoder in Hands on. 14

4 Map Types Proportional symbol map Represents data variables by symbols that are sized, colored, etc. according to their amount. Data is (or can be) aggregated at points within areas. Do NOT use for densities, ratios, or scales, which should be rendered as choropleth map. Choropleth map Represents data variables such as densities, ratios, or rates by proportionally colored or patterned areas. Each artificial collection unit is called a chronogram and has a distinctive color or shading

5 Map Types cont. Heat (isopleth) maps represent continuous data variable values by colors. While choropleth maps color predefined regions, heat maps might show color based contour lines that connect points of equal value or value by area maps. Cartograms are not drawn to scale. Instead, they distort geographical areas in proportion to data values. Familiarity with regions is necessary. Mostly used for world, continental, and country maps US presidential election results States are colored in Red if majority of their voters voted for the Republican candidate, Mitt Romney, and Blue if they voted for the Democratic candidate, Barack Obama. The Cartogram sizes of states according to their population. personal.umich.edu/~mejn/election/2012/ 18

6 2012 US presidential election results The presidential election is decided not on the basis of the number of people who vote for each candidate but on the basis of the electoral college with a small but deliberate bias in favor of less populous states. personal.umich.edu/~mejn/election/2012/ US presidential election results Election results by county. Red, blue, and shades of purple in between are used to indicate percentages of votes. Color scale ranges from red for 70% or more Republican, to blue for 70% or more Democrat. personal.umich.edu/~mejn/election/2012/ 20

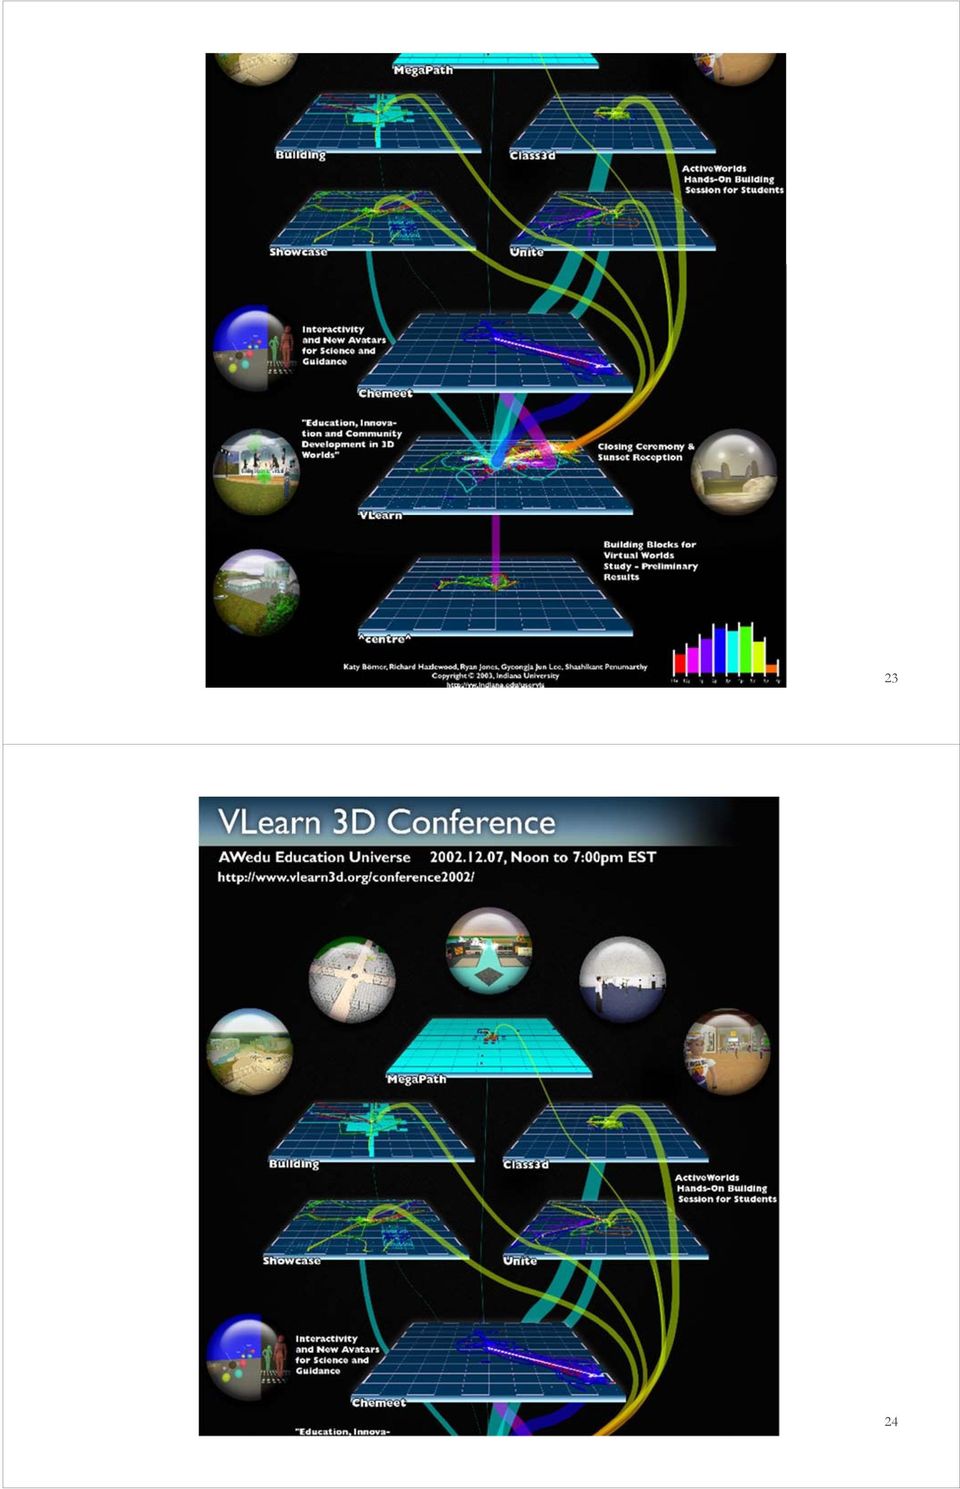
7 2012 US presidential election results personal.umich.edu/~mejn/election/2012/ 21 Map Types cont. Flow maps show the paths that (in)tangible objects take to get from one geospatial place to another. Variables such as capacity or maximum speed are encoded proportionally by line width or color. Space time cubes Display entities, locations, and events over time. 22

8 23 24
Visualization Techniques for Geospatial Data IDV 2015/2016
 Interactive Data Visualization 07 Visualization Techniques for Geospatial Data IDV 2015/2016 Notice n Author t João Moura Pires (jmp@fct.unl.pt) n This material can be freely used for personal or academic
Utah State General Records Retention Schedule SCHEDULE 1 GEOSPATIAL DATA SETS
 Utah State General Records Retention Schedule SCHEDULE 1 BIOTA RECORDS (Item 1-26) These are geospatial records that depict wildlife use areas in the state of Utah as determined by wildlife biologists
GEOGRAPHIC INFORMATION SYSTEMS
 GEOGRAPHIC INFORMATION SYSTEMS WHAT IS A GEOGRAPHIC INFORMATION SYSTEM? A geographic information system (GIS) is a computer-based tool for mapping and analyzing spatial data. GIS technology integrates
Intro to GIS Winter 2011. Data Visualization Part I
 Intro to GIS Winter 2011 Data Visualization Part I Cartographer Code of Ethics Always have a straightforward agenda and have a defining purpose or goal for each map Always strive to know your audience
GEOGRAPHIC INFORMATION SYSTEMS CERTIFICATION
 GEOGRAPHIC INFORMATION SYSTEMS CERTIFICATION GIS Syllabus - Version 1.2 January 2007 Copyright AICA-CEPIS 2009 1 Version 1 January 2007 GIS Certification Programme 1. Target The GIS certification is aimed
Social Media and Voting
 NOVEMBER 6, 2012 Social Media and Voting 22% of registered voters have announced their vote for president on social media like Facebook or Twitter Lee Rainie Director, Pew Internet Project Pew Research
Illinois 8th Congressional District Survey Results
 Illinois 8th Congressional District Survey Results Q1 Q2 Q3 Q4 Q5 The candidates for President are Democrat Barack Obama and Republican Mitt Romney. If the election was today, who would you vote for? Barack
Geocoding in Law Enforcement Final Report
 Geocoding in Law Enforcement Final Report Geocoding in Law Enforcement Final Report Prepared by: The Crime Mapping Laboratory Police Foundation August 2000 Report to the Office of Community Oriented Policing
A quick overview of geographic information systems (GIS) Uwe Deichmann, DECRG <udeichmann@worldbank.org>
 Uwe Deichmann, DECRG <udeichmann@worldbank.org>") A quick overview of geographic information systems (GIS) Uwe Deichmann, DECRG Why is GIS important? A very large share of all types of information has a spatial component ( 80
A quick overview of geographic information systems (GIS) Uwe Deichmann, DECRG Why is GIS important? A very large share of all types of information has a spatial component ( 80
DATA VISUALIZATION GABRIEL PARODI STUDY MATERIAL: PRINCIPLES OF GEOGRAPHIC INFORMATION SYSTEMS AN INTRODUCTORY TEXTBOOK CHAPTER 7
 DATA VISUALIZATION GABRIEL PARODI STUDY MATERIAL: PRINCIPLES OF GEOGRAPHIC INFORMATION SYSTEMS AN INTRODUCTORY TEXTBOOK CHAPTER 7 Contents GIS and maps The visualization process Visualization and strategies
A Cardinal That Does Not Look That Red: Analysis of a Political Polarization Trend in the St. Louis Area
 14 Missouri Policy Journal Number 3 (Summer 2015) A Cardinal That Does Not Look That Red: Analysis of a Political Polarization Trend in the St. Louis Area Clémence Nogret-Pradier Lindenwood University
Cancer Mapper: Michigan s Interactive Mapping Tool
 Cancer Mapper: Michigan s Interactive Mapping Tool Mike Carr, M.A. Michigan WISEWOMAN, BCCCP 8/28/2014 These slides are the property of the presenter. Do not reproduce without express written consent.
Send all inquiries to: Glencoe/McGraw-Hill 8787 Orion Place Columbus, Ohio 43240-4027 ISBN 0-07-824996-1. Printed in the United States of America
 Copyright by The McGraw-Hill Companies, Inc. All rights reserved. Permission is granted to reproduce the material contained herein on the condition that such material be reproduced only for classroom use;
GIS. Digital Humanities Boot Camp Series
 GIS Digital Humanities Boot Camp Series GIS Fundamentals GIS Fundamentals Definition of GIS A geographic information system (GIS) is used to describe and characterize spatial data for the purpose of visualizing
Appendix 11.2 Use of Geographic Information Systems (GIS) to Map Data
 to Map Data") Appendix 11.2 Use of Geographic Information Systems (GIS) to Map Data The application of Geographic Information Systems (GIS) methods has become an integral component of aggregating, analyzing, and evaluating
Appendix 11.2 Use of Geographic Information Systems (GIS) to Map Data The application of Geographic Information Systems (GIS) methods has become an integral component of aggregating, analyzing, and evaluating
Geovisualization. Geovisualization, cartographic transformation, cartograms, dasymetric maps, scientific visualization (ViSC), PPGIS
, PPGIS") 13 Geovisualization OVERVIEW Using techniques of geovisualization, GIS provides a far richer and more flexible medium for portraying attribute distributions than the paper mapping which is covered in Chapter
13 Geovisualization OVERVIEW Using techniques of geovisualization, GIS provides a far richer and more flexible medium for portraying attribute distributions than the paper mapping which is covered in Chapter
Introduction to Geographical Data Visualization
 perceptual edge Introduction to Geographical Data Visualization Stephen Few, Perceptual Edge Visual Business Intelligence Newsletter March/April 2009 The important stories that numbers have to tell often
Raising Taxes on Rich Seen as Good for Economy, Fairness
 MONDAY, JULY 16, Just Over Half Know Where the Candidates Stand Raising Taxes on Rich Seen as Good for Economy, Fairness FOR FURTHER INFORMATION CONTACT: Andrew Kohut President, Pew Research Center Carroll
Data Visualization Techniques and Practices Introduction to GIS Technology
 Data Visualization Techniques and Practices Introduction to GIS Technology Michael Greene Advanced Analytics & Modeling, Deloitte Consulting LLP March 16 th, 2010 Antitrust Notice The Casualty Actuarial
Quick and Easy Web Maps with Google Fusion Tables. SCO Technical Paper
 Quick and Easy Web Maps with Google Fusion Tables SCO Technical Paper Version History Version Date Notes Author/Contact 1.0 July, 2011 Initial document created. Howard Veregin 1.1 Dec., 2011 Updated to
What is GIS? Geographic Information Systems. Introduction to ArcGIS. GIS Maps Contain Layers. What Can You Do With GIS? Layers Can Contain Features
 What is GIS? Geographic Information Systems Introduction to ArcGIS A database system in which the organizing principle is explicitly SPATIAL For CPSC 178 Visualization: Data, Pixels, and Ideas. What Can
Digital Cadastral Maps in Land Information Systems
 LIBER QUARTERLY, ISSN 1435-5205 LIBER 1999. All rights reserved K.G. Saur, Munich. Printed in Germany Digital Cadastral Maps in Land Information Systems by PIOTR CICHOCINSKI ABSTRACT This paper presents
MUHLENBERG COLLEGE /MORNING CALL. 2008 Presidential Tracking Poll
 MUHLENBERG COLLEGE /MORNING CALL 2008 Presidential Tracking Poll RELEASE #20 October 16, 2008 FIELDING PERIOD October 11-15, 2008 SAMPLE 595 Likely Voters in Pennsylvania MARGIN OF ERROR - +/- 4.0% at
Implementation Planning
 Implementation Planning presented by: Tim Haithcoat University of Missouri Columbia 1 What is included in a strategic plan? Scale - is this departmental or enterprise-wide? Is this a centralized or distributed
Is North Carolina a Red or Blue State? Politics and Men s College Basketball
 Is North Carolina a Red or Blue State? Politics and Men s College Basketball Elon University Poll October 21-26, 2012 Kenneth E. Fernandez, Ph.D. Director of the Elon University Poll Assistant Professor
Cartographic and Geospatial Materials
 LIBRARY OF CONGRESS COLLECTIONS POLICY STATEMENTS ±² Collections Policy Statement Index Cartographic and Geospatial Materials This document consolidates and replaces the former Maps, Atlases, and Remote
Improving Data Mining of Multi-dimension Objects Using a Hybrid Database and Visualization System
 Improving Data Mining of Multi-dimension Objects Using a Hybrid Database and Visualization System Yan Xia, Anthony Tung Shuen Ho School of Electrical and Electronic Engineering Nanyang Technological University,
Searching Land Records thru the BLM General Land Office Records.
 Searching Land Records thru the BLM General Land Office Records. Land Records can be an exciting addition to your family history search. The United States Government transferred ownership of land to millions
The UCC-21 cognitive skills that are listed above will be met via the following objectives.
 Master Syllabus Department of Geography GEOG 265: Introduction to Geographic Information Systems Course Description Fundamentals of geographic information systems (GIS). How to visualize geographic information
SESSION 8: GEOGRAPHIC INFORMATION SYSTEMS AND MAP PROJECTIONS
 SESSION 8: GEOGRAPHIC INFORMATION SYSTEMS AND MAP PROJECTIONS KEY CONCEPTS: In this session we will look at: Geographic information systems and Map projections. Content that needs to be covered for examination
Institute of Natural Resources Departament of General Geology and Land use planning Work with a MAPS
 Institute of Natural Resources Departament of General Geology and Land use planning Work with a MAPS Lecturers: Berchuk V.Y. Gutareva N.Y. Contents: 1. Qgis; 2. General information; 3. Qgis desktop; 4.
NBC News/WSJ/Marist Poll Florida November 3, 2012 Presidential Election Questionnaire
 Screener Are you 18 years of age or older? Do you consider your permanent home address to be in Florida? HH SELECTION LANDLINE FRAME ONLY GENDER GUESS NBC News/WSJ/Marist Poll
Making a Choropleth map with Google Fusion Tables
 Making a Choropleth map with Google Fusion Tables Choropleth map is a thematic map based on predefined aerial units. Its areas are coloured or shaded to show the measurement of the statistical variables
ESRI Experience in the Use of GIS for Census Mapping Applications
 United Nations Statistical Division Workshop on Census Mapping with GIS ESRI Experience in the Use of GIS for Census Mapping Applications Pieter van Jaarsveld (GIMS) And Peter Kelly (Kelly + Kelly) kenna@kellyandkelly.co.zm
Data Visualization. Prepared by Francisco Olivera, Ph.D., Srikanth Koka Department of Civil Engineering Texas A&M University February 2004
 Data Visualization Prepared by Francisco Olivera, Ph.D., Srikanth Koka Department of Civil Engineering Texas A&M University February 2004 Contents Brief Overview of ArcMap Goals of the Exercise Computer
Introduction to GIS (Basics, Data, Analysis) & Case Studies. 13 th May 2004. Content. What is GIS?
 & Case Studies. 13 th May 2004. Content. What is GIS?") Introduction to GIS (Basics, Data, Analysis) & Case Studies 13 th May 2004 Content Introduction to GIS Data concepts Data input Analysis Applications selected examples What is GIS? Geographic Information
Introduction to GIS (Basics, Data, Analysis) & Case Studies 13 th May 2004 Content Introduction to GIS Data concepts Data input Analysis Applications selected examples What is GIS? Geographic Information
Design/build and visualization of political and social-statistics. statistics geodatabase by open source tools
 Design/build and visualization of political and social-statistics statistics geodatabase by open source tools Ferenc Speiser Post-graduate distance learning course in Geoinformatics Contents The goals
GIS 101 - Introduction to Geographic Information Systems Last Revision or Approval Date - 9/8/2011
 Page 1 of 10 GIS 101 - Introduction to Geographic Information Systems Last Revision or Approval Date - 9/8/2011 College of the Canyons SECTION A 1. Division: Mathematics and Science 2. Department: Earth,
The Electoral Process STEP BY STEP. the worksheet activity to the class. the answers with the class. (The PowerPoint works well for this.
 Teacher s Guide Time Needed: One class period Materials Needed: Student worksheets Projector Copy Instructions: Reading (2 pages; class set) Activity (3 pages; class set) The Electoral Process Learning
Marist College Institute for Public Opinion Poughkeepsie, NY 12601 Phone 845.575.5050 Fax 845.575.5111 www.maristpoll.marist.edu
 Marist College Institute for Public Opinion Poughkeepsie, NY 12601 Phone 845.575.5050 Fax 845.575.5111 www.maristpoll.marist.edu NBC News/Marist Poll: Romney with Wide Lead in Florida *** Complete Tables
Plotting Earthquake Epicenters an activity for seismic discovery
 Plotting Earthquake Epicenters an activity for seismic discovery Tammy K Bravo Anne M Ortiz Plotting Activity adapted from: Larry Braile and Sheryl Braile Department of Earth and Atmospheric Sciences Purdue
Geographic Information Systems
 Jan Coyne, William C. Bell, Mary Maureen Brown, Chad Rupert, and James Nolan Geographic Information Systems A geographic information system (GIS) combines database management and analysis functions with
Geographical Information Systems (GIS) and Economics 1
 and Economics 1") Geographical Information Systems (GIS) and Economics 1 Henry G. Overman (London School of Economics) 5 th January 2006 Abstract: Geographical Information Systems (GIS) are used for inputting, storing,
Geographical Information Systems (GIS) and Economics 1 Henry G. Overman (London School of Economics) 5 th January 2006 Abstract: Geographical Information Systems (GIS) are used for inputting, storing,
Association of Public Data Users Annual Conference September 21, 2011
 Data Visualization in the NEW American FactFinder Association of Public Data Users Annual Conference September 21, 2011 After viewing this presentation, you will be able to: 1. Create a Reference Map 2.
VOTE! GET OUT THE. Using MimioStudio and MimioVote This Election Season
 GET OUT THE VOTE! Using MimioStudio and MimioVote This Election Season It s election year a great year to teach social studies, and a great time to use MimioStudio classroom software and MimioVote assessment
IL: KERRY LEADS BUSH BY 13 PTS; OBAMA ON TOP OF RYAN BY 11 PTS
 IL: KERRY LEADS BUSH BY 13 PTS; OBAMA ON TOP OF RYAN BY 11 PTS DEMOCRATS POISED TO PICK-UP U.S. SENATE SEAT BEING VACATED BY FITZGERALD IN AN ELECTION TODAY, JOHN KERRY CARRIES IL & BARACK OBAMA IS ELECTED
REGIONAL CENTRE FOR TRAINING IN AEROSPACE SURVEYS (RECTAS) MASTER IN GEOINFORMATION PRODUCTION AND MANAGEMENT
 MASTER IN GEOINFORMATION PRODUCTION AND MANAGEMENT") REGIONAL CENTRE FOR TRAINING IN AEROSPACE SURVEYS (RECTAS) MASTER IN GEOINFORMATION PRODUCTION AND MANAGEMENT PROGRAMME DESCRIPTION October 2014 1. The programme The academic programme shall be referred
REGIONAL CENTRE FOR TRAINING IN AEROSPACE SURVEYS (RECTAS) MASTER IN GEOINFORMATION PRODUCTION AND MANAGEMENT PROGRAMME DESCRIPTION October 2014 1. The programme The academic programme shall be referred
Data Visualization. Brief Overview of ArcMap
 Data Visualization Prepared by Francisco Olivera, Ph.D., P.E., Srikanth Koka and Lauren Walker Department of Civil Engineering September 13, 2006 Contents: Brief Overview of ArcMap Goals of the Exercise
Modifying Colors and Symbols in ArcMap
 Modifying Colors and Symbols in ArcMap Contents Introduction... 1 Displaying Categorical Data... 3 Creating New Categories... 5 Displaying Numeric Data... 6 Graduated Colors... 6 Graduated Symbols... 9
WHAT IS GIS - AN INRODUCTION
 WHAT IS GIS - AN INRODUCTION GIS DEFINITION GIS is an acronym for: Geographic Information Systems Geographic This term is used because GIS tend to deal primarily with geographic or spatial features. Information
Technology Trends In Geoinformation
 Technology Trends In Geoinformation Dato Prof. Sr Dr. Abdul Kadir Bin Taib Department of Survey and Mapping Malaysia (JUPEM) Email: drkadir@jupem.gov.my www.jupem.gov.my NGIS 2008 3 rd. National GIS Conference
SECOND GRADE 1 WEEK LESSON PLANS AND ACTIVITIES
 SECOND GRADE 1 WEEK LESSON PLANS AND ACTIVITIES UNIVERSE CYCLE OVERVIEW OF SECOND GRADE UNIVERSE WEEK 1. PRE: Discovering stars. LAB: Analyzing the geometric pattern of constellations. POST: Exploring
Presidential Nominations
 SECTION 4 Presidential Nominations Delegates cheer on a speaker at the 2008 Democratic National Convention. Guiding Question Does the nominating system allow Americans to choose the best candidates for
WEST VIRGINIA SCHOOLS Updating the Geographic Names Information System
 WEST VIRGINIA SCHOOLS Updating the Geographic Names Information System By: Laura Cathers West Virginia GIS Technical Center West Virginia University April 2005 Purpose The Geographic Names Information
Election 2012: Real- Time Monitoring of Election Results
 Election 2012: Real- Time Monitoring of Election Results A simulation using the Syncfusion PivotGrid control. by Clay Burch and Suriya Prakasam R. Contents Introduction... 3 Ticking Pivots... 3 Background
National Diploma in Surveying (Level 6) with an optional strand in Mine Surveying Level 6
 with an optional strand in Mine Surveying Level 6") NZQF Ref 0453 Version 7 Page 1 of 17 National Diploma in Surveying (Level 6) with an optional strand in Mine Surveying Level 6 Credits 250 This qualification has been reviewed. The last date to meet the
NZQF Ref 0453 Version 7 Page 1 of 17 National Diploma in Surveying (Level 6) with an optional strand in Mine Surveying Level 6 Credits 250 This qualification has been reviewed. The last date to meet the
Objective of this chapter is;
 Making Maps With GIS Objective of this chapter is; Getting Started with GIS Chapter 7 Good maps made by GIS follow the accepted rules of cartographic representation and symbolization. Maps terminology
Maps A Primer for Content & Production of Topographic Base Maps For Design Presented by SurvBase, LLC
 Maps A Primer for Content & Production of Topographic Base Maps For Design Presented by Definition and Purpose of, Map: a representation of the whole or a part of an area. Maps serve a wide range of purposes.
DISASTER DISASTER MANAGEMENT CRISIS INFORMATICS GIS IN DIFFEERENT STAGES OF DISASTER MANAGEMENT
 APPLICATION OF GIS AND REMOTE SENSING IN DISASTER PRONE AREAS: A CASE STUDY IN COASTAL KERALA DISASTER Disaster is an unpleasant event than occurs with little or no warning which results in economic disruption,
Using Map Views and Spatial Analytics in OBI 11g. BIWA Summit 2014
 Using Map Views and Spatial Analytics in OBI 11g BIWA Summit 2014 Tim Vlamis Dan Vlamis Vlamis Software Solutions 816-781-2880 http://www.vlamis.com Vlamis Software Solutions Vlamis Software founded in
Florida Poll Results Trump 47%, Clinton 42% (Others 3%, 8% undecided) Rubio re-elect: 38-39% (22% undecided)
 Rubio re-elect: 38-39% (22% undecided)") Florida Poll Results Trump 47%, Clinton 42% (Others 3%, 8% undecided) Rubio re-elect: 38-39% (22% undecided) POLLING METHODOLOGY Our philosophy about which population to use depends on the election, but
Florida Poll Results Trump 47%, Clinton 42% (Others 3%, 8% undecided) Rubio re-elect: 38-39% (22% undecided) POLLING METHODOLOGY Our philosophy about which population to use depends on the election, but
Learning about GPS and GIS
 Learning about GPS and GIS Standards 4.4 Understand geographic information systems (G.I.S.). B12.1 Understand common surveying techniques used in agriculture (e.g., leveling, land measurement, building
Title 10 DEPARTMENT OF NATURAL RESOURCES Division 35 Land Survey Chapter 1 Cadastral Mapping Standards
 Title 10 DEPARTMENT OF NATURAL RESOURCES Division 35 Land Survey Chapter 1 Cadastral Mapping Standards 10 CSR 35-1.010 Application of Standards PURPOSE: These minimum standards provide the digital mapper
DKAN. Data Warehousing, Visualization, and Mapping
 DKAN Data Warehousing, Visualization, and Mapping Acknowledgements We d like to acknowledge the NuCivic team, led by Andrew Hoppin, which has done amazing work creating open source tools to make data available
Chapter Contents Page No
 Chapter Contents Page No Preface Acknowledgement 1 Basics of Remote Sensing 1 1.1. Introduction 1 1.2. Definition of Remote Sensing 1 1.3. Principles of Remote Sensing 1 1.4. Various Stages in Remote Sensing
Everything You Wanted To Know About Zip Code Use in Public Health and Were Afraid To Ask
 Everything You Wanted To Know About Zip Code Use in Public Health and Were Afraid To Ask Svetlana Smorodinsky WREN 2010 Overview Summarize ZIP code use in public health Define ZIP codes and outline challenges
Introduction to Map Design
 Introduction to Map Design Introduction This document is intended to help people without formal training in map design learn to produce maps for publication or electronic display using ArcView, a desktop
CITY OF SUFFOLK, VIRGINIA GIS DATA DISTRIBUTION AND PRICING POLICY
 CITY OF SUFFOLK, VIRGINIA GIS DATA DISTRIBUTION AND PRICING POLICY 1 The City of Suffolk has invested a large amount of effort into the development of a Citywide Geographic Information System (GIS). The
GIS on Drupal in 2008. Where we ARRR
 GIS on Drupal in 2008 Where we ARRR At the DrupalCon in Boston, we talked a lot about plans. This time, let's talk about what we can do right now. We do mapping right now using the Location and GMap modules.
GEOGRAPHIC INFORMATION SYSTEMS
 GIS GEOGRAPHIC INFORMATION SYSTEMS FOR CADASTRAL MAPPING Chapter 6 2015 Cadastral Mapping Manual 6-0 GIS - GEOGRAPHIC INFORMATION SYSTEMS What is GIS For a long time people have sketched, drawn and studied
Creating Figure Ground Maps in ArcMap 10.x: Basic procedures to download, open, manipulate and print spatial data
 Creating Figure Ground Maps in ArcMap 10.x: Basic procedures to download, open, manipulate and print spatial data These procedures outline: A. Retrieving Property Data B. Uncompressing the Downloaded Files
COUNTY OF LOS ANGELES CHIEF INFORMATION OFFICE 500 West Temple Street 493 Kenneth Hahn Hall of Administration Los Angeles, CA 90012
 COUNTY OF LOS ANGELES CHIEF INFORMATION OFFICE 500 West Temple Street 493 Kenneth Hahn Hall of Administration Los Angeles, CA 90012 RICHARD SANCHEZ ACTING CHIEF INFORMATION OFFICER Telephone: (213) 974-2008
Dealing with continuous variables and geographical information in non life insurance ratemaking. Maxime Clijsters
 Dealing with continuous variables and geographical information in non life insurance ratemaking Maxime Clijsters Introduction Policyholder s Vehicle type (4x4 Y/N) Kilowatt of the vehicle Age Age of the
Bachelor s Degree in Technical Architecture. 2 nd YEAR. 6446 Materials II ECTS credits: 6 Semester: 1. Teaching objectives
 2 nd YEAR 6446 Materials II Learn about the origin, formation and usefulness of aggregates in producing concrete, as well as their properties and the uses they offer in terms of construction. Understand
Chapter 8: Political Parties
 Chapter 8: Political Parties Political Parties and their Functions Political party: an organization that sponsors candidates for public office under the organization s name True political parties select
Final Project Wastewater Treatment Facility
 HUMBOLDT STATE UNIVERSITY GEOSPATIAL STUDIES GSP 270 - INTRODUCTION TO GIS Final Project Wastewater Treatment Facility Camila Ribeiro Matos Jéssica Sangiorgi Ricardo Jordan Adair Arcata - CA December 2014
Analyzing Radon Risk Using Geographic Information System (GIS) Software. Ü Radon and GIS
 Software. Ü Radon and GIS") Analyzing Radon Risk Using Geographic Information System (GIS) Software Ü Radon and GIS Introduction Radon testing data is submitted by licensees to the Illinois Emergency Management Agency One way they
Analyzing Radon Risk Using Geographic Information System (GIS) Software Ü Radon and GIS Introduction Radon testing data is submitted by licensees to the Illinois Emergency Management Agency One way they
Department of Geography University of Idaho. GEOG 390: Geographic Visualization January to May 2010 COURSE OUTLINE. (subject to change)
") Department of Geography University of Idaho GEOG 390: Geographic Visualization January to May 2010 COURSE OUTLINE (subject to change) Instructor Classes meet Mondays, Wednesdays 3:30 5:45 pm at MCCL 206
Department of Geography University of Idaho GEOG 390: Geographic Visualization January to May 2010 COURSE OUTLINE (subject to change) Instructor Classes meet Mondays, Wednesdays 3:30 5:45 pm at MCCL 206
THE PAN ATLANTIC SMS GROUP 54 th OMNIBUS POLL The Benchmark of Maine Public Opinion
 THE PAN ATLANTIC SMS GROUP 54 th OMNIBUS POLL The Benchmark of Maine Public Opinion 3 rd Maine Gubernatorial Election Poll Fall 2014 1 6 City Center, Suite 200, Portland, Maine 04101 207-871-8622 www.panatlanticsmsgroup.com
DIABLO VALLEY COLLEGE CATALOG 2015-2016
 GEOGRAPHY GEOG Tish Young, Dean Physical Sciences and Engineering Division Physical Sciences Building, Room 263 Possible career opportunities Geography is an interdisciplinary study focusing on the spatial
behavior research center s
 behavior research center s behavior research center s NEWS RELEASE [RMP 2012-III-01] Contact: Earl de Berge Research Director 602-258-4554 602-268-6563 OBAMA PULLS EVEN WITH ROMNEY IN ARIZONA; FLAKE AND
Assessment Tasks Pass theory exams at > 70%. Meet, or exceed, outcome criteria for projects and assignments.
 CENTRAL OREGON COMMUNITY COLLEGE: GEOGRAPHIC INFORMATION SYSTEM PROGRAM 1 CENTRAL OREGON COMMUNITY COLLEGE Associate Degree Geographic Information Systems Program Outcome Guide (POG) Program Outcome Guide
LEOworks - a freeware to teach Remote Sensing in Schools
 LEOworks - a freeware to teach Remote Sensing in Schools Wolfgang Sulzer Institute for Geography and Regional Science University of Graz Heinrichstrasse 36, A-8010 Graz/Austria wolfgang.sulzer@uni-graz.at
My City Map Viewer Glossary, 2.1
 My City Map Viewer Glossary, 2.1 The City of Houston Date Modified: May 20, 2015 Glossary Address: A designation of the location of a person's residence or workplace, an organization, or a building, consisting
Conducting a Land Use Inventory
 Chapter 3 Conducting a Land Use Inventory Included in this chapter: Determining Current Land Use Conditions Preparing a Base Map Deciding on Land Use Categories Collecting Current Land Use Data Preparing
Basic Steps to Using the Wildlife Application
 Basic Steps to Using the Wildlife Application The intent of the Wildlife Application (http://gisweb1.serm.gov.sk.ca/wildlifelogin/form.asp) is to provide a tool to search an area in the province of Saskatchewan
Supporting statistical, graphic/cartographic, and domain literacy through online learning activities: MapStats for Kids
 Supporting statistical, graphic/cartographic, and domain literacy through online learning activities: MapStats for Kids Alan M. MacEachren, Mark Harrower, Bonan Li, David Howard, Roger Downs, and Mark
Spotfire v6 New Features. TIBCO Spotfire Delta Training Jumpstart
 Spotfire v6 New Features TIBCO Spotfire Delta Training Jumpstart Map charts New map chart Layers control Navigation control Interaction mode control Scale Web map Creating a map chart Layers are added
Michigan Tech Research Institute Wetland Mitigation Site Suitability Tool
 Michigan Tech Research Institute Wetland Mitigation Site Suitability Tool Michigan Tech Research Institute s (MTRI) Wetland Mitigation Site Suitability Tool (WMSST) integrates data layers for eight biophysical
GIS: Geographic Information Systems A short introduction
 GIS: Geographic Information Systems A short introduction Outline The Center for Digital Scholarship What is GIS? Data types GIS software and analysis Campus GIS resources Center for Digital Scholarship
Barack Obama won the battle on social media too!
 Think... Special Edition Barack Obama won the battle on social media too! On the 4th of April 2011, Barack Obama announced his candidacy for the 2012 US Presidential election on Youtube* Yesterday evening
Hampshire). In the general election swing states, an overwhelming majority (87%) supports at least one proposal.
. In the general election swing states, an overwhelming majority (87%) supports at least one proposal.") Oxfam America and McLaughlin & Associates today released the results of a series of surveys in key 2016 presidential election states that show voter support for an increase in the federal minimum wage.
Oxfam America and McLaughlin & Associates today released the results of a series of surveys in key 2016 presidential election states that show voter support for an increase in the federal minimum wage.
Understanding Raster Data
 Introduction The following document is intended to provide a basic understanding of raster data. Raster data layers (commonly referred to as grids) are the essential data layers used in all tools developed
CIS 467/602-01: Data Visualization
 CIS 467/602-01: Data Visualization Maps Dr. David Koop Assignment 3 http://www.cis.umassd.edu/ ~dkoop/cis467/assignment3.html Networks and Maps Little East Women's Basketball data Network of games with
Stage 4. Geography. Blackline Masters. By Karen Devine
 1 Devine Educational Consultancy Services Stage 4 Geography Blackline Masters By Karen Devine Updated January 2010 2 This book is intended for the exclusive use in NSW Secondary Schools. It is meant to
COUNTRY REPORT GEOSPATIAL INFORMATION MANAGEMENT IN NEPAL
 COUNTRY REPORT ON GEOSPATIAL INFORMATION MANAGEMENT IN NEPAL Government of Nepal Ministry of Land Reform and Management SURVEY DEPARTMENT PO Box 9435 Min Bhavan, Kathmandu Nepal Tel : + 977 1 4622713 +
Inside the Obama Analytics Cave Andrew Claster, Deputy Chief Analytics Officer Obama for America 2011-2012 W INNING K N OWLEDGE T M
 Inside the Obama Analytics Cave Andrew Claster, Deputy Chief Analytics Officer Obama for America 2011-2012 W INNING K N OWLEDGE T M Political Landscape Obama faced the highest unemployment rate of any
Mapping Your Land: An Overview for Landowners
 Mapping Your Land: An Overview for Landowners Online Mapping and Spatial Resources for the Private Forest Landowner Tutorials by John C. Gilbert 1 and John S. Kush 1 Design and Layout by Elizabeth P. Bowersock
FOR RELEASE: MONDAY, SEPTEMBER 10 AT 4 PM
 Interviews with 1,022 adult Americans conducted by telephone by ORC International on September 7-9, 2012. The margin of sampling error for results based on the total sample is plus or minus 3 percentage