Regulation of the floral transition at the shoot apical meristem of Arabidopsis as studied by genetics and next generation sequencing
|
|
|
- Loreen Richard
- 8 years ago
- Views:
Transcription
1 Regulation of the floral transition at the shoot apical meristem of Arabidopsis as studied by genetics and next generation sequencing Inaugural-Dissertation zur Erlangung des Doktorgrades der Mathematisch-Naturwissenschaftlichen Fakultät der Universität zu Köln vorgelegt von Stefano Torti aus Narni (Italien) Köln, April 2010
 Köln, April")
2 Die vorliegende Arbeit wurde am Max-Planck-Institut für Pflanzen Züchtungsforschung in Köln, in der Abteilung für Entwicklungsbiologie der Pflanzen (Direktor Prof. Dr. George Coupland) angefertigt. Prüfungsvorsitzender: Prof. Dr. Martin Hülskamp Berichterstatter: Prof. Dr. George Coupland Prof. Dr. Wolfgang Werr Tag der mündlichen Prüfung: 9. Juni 2010

3 Abstract The floral transition is the process by which flowering plants switch from vegetative growth to the production of flowers. Consistent with the importance of this developmental transition, flowering is highly regulated through several genetic pathways, some of which respond to environmental cues. Arabidopsis thaliana flowers earlier under long-days (LD) of spring than under short-days (SD) of winter, and day-length, or photoperiod, is one of the most important environmental stimuli influencing the flowering response. Photoperiod is perceived in the leaves, while the floral transition occurs at the shoot apical meristem (SAM). In LD, a genetic cascade is activated in the leaf vasculature, so that a key transcriptional regulator called CONSTANS activates the genes FLOWERING LOCUS T (FT) and its homolog TWIN SISTER OF FT (TSF). FT protein is then transported through the phloem, eventually reaching the SAM, where it triggers the floral transition. By forming a complex with FD, a bzip transcription factor, FT activates target genes, such as SUPPRESSOR OF OVEREXPRESSION OF CO (SOC1), FRUITFULL (FUL) and later APETALA1 (AP1), all of which encode MADS-box transcription factors. However, the floral transition involves a dramatic transcriptional reprogramming of the shoot meristem, and a complete picture of the global changes in gene expression occurring specifically in the SAM is still missing. Therefore, in the first part of this work, SAMs were specifically collected by the use of laser microdissection from plants experiencing a shift from SD to LD. RNA isolated from the meristems was converted to cdna and gene expression quantified through next-generation sequencing by RNA-seq. Genes were grouped according to those increased or reduced in expression, with a particular focus on novel genes that were up-regulated similarly to SOC1 or FUL. Among them, the expression of a selected set of genes was tested by in situ hybridisation on wild-type apices to confirm their activation at the SAM, and to uncover their spatial pattern of mrna expression. Several novel genes were confirmed to be induced by transferring plants to LD and they showed specific spatial patterns of expression in various regions of the SAM. Moreover, apices of ft tsf double mutants were also hybridised, to reveal whether those genes are induced by the photoperiodic cascade downstream of FT/TSF. Surprisingly, while many genes were induced only in the presence of FT/TSF, similarly to SOC1, some of them still respond to photoperiod in the ft tsf double mutants, suggesting that additional unknown signals may play a role in response to inductive day-length independently of FT and TSF. Further preliminary studies on a set of these novel genes are described in this study. In the second part, genetic approaches were employed to address the function of SHORT VEGETATIVE PHASE (SVP), which encodes a floral repressor of the MADS-box family, I
.")
4 demonstrating new interactions with floral promoter genes and distinct roles of the SVP gene in the leaves and in the meristem. II

5 Zusammenfassung Der Vorgang bei welchem Angiospermen von vegetativem Wachstum zur Bildung von Blüten übergehen wird als Übergang zur Blüte ( floral transition ) bezeichnet. Dieser entwicklungsbiologische Vorgang ist von großer Bedeutung und wird streng durch ein genetisches Netzwerk reguliert, wobei einige Komponenten des Netzwerkes auf Umweltfaktoren reagieren. Arabidopsis thaliana blüht früher unter Langtagbedingungen (LD) des Frühlings als unter den Kurztagbedingungen (SD) des Winters. Die Tageslänge oder Photoperiode ist einer der wichtigsten Umweltfaktoren welcher die Blühantwort beeinflusst. Die Photoperiode wird über die Blätter wahrgenommen während der Übergang zur Blüte im apikalen Sprossmeristem (SAM) stattfindet. Unter Langtagbedingungen wird eine genetische Kaskade im Leitgewebe des Blattes angestoßen, woraufhin ein Schlüsseltranskriptionsregulator mit dem Namen CONSTANS das Gen mit dem Namen FLOWERING LOCUS T (FT) und sein Homolog TWIN SISTER OF FT (TSF) aktiviert. Das FT Protein wird daraufhin durch das Phloem transportiert und erreicht schlussendlich das SAM wo es den Übergang zur Blüte auslöst. Durch Bildung eines Komplexes mit FD, einem bzip Transkriptionsfaktor, aktiviert FT Zielgene wie SUPPRESSOR OF OVEREXPRESSION OF CO (SOC1), FRUITFULL (FUL) und später APETALA1 (AP1), welche für MADS-Box Transkriptionsfaktoren codieren. Der Übergang zur Blüte erfordert jedoch im SAM eine dramatische Neuprogrammierung der Transkriptionsvorgänge. Ein vollständiges Bild der Genexpression welche spezifisch im SAM stattfindet fehlt bislang. Daher wurden im ersten Teil dieser Arbeit apikale Sprossmeristeme durch Lasersezierung aus Pflanzen ausgeschnitten, welche von SD nach LD überführt worden waren. RNA, welche aus den Meristemen isoliert worden war, wurde in cdna umgeschrieben und die Genexpression durch Next-Generation Sequencing durch RNA-seq quantifiziert. Die Gene wurden nach gesteigerter oder verringerter Expression sortiert, wobei ein besonderes Augenmerk auf neue Gene gelegt wurde deren Expression ähnlich der von SOC1 und FUL gesteigert wurde. Ein Teil dieser Gene wurde über in situ Hybridisierung in Wildtyp-Apizes getestet um ihre Aktivierung im SAM zu bestätigen und ihr räumliches Expressionsmuster aufzuklären. Für mehrere neue Gene konnte die Induktion durch Transfer der Pflanzen in LD bestätigt werden; auch zeigten sie spezifische räumliche Expressionsmuster in zahlreichen Regionen des apikalen Sprossmeristems. Es wurden auch Apizes von ft tsf Doppelmutanten hybridisiert um aufzudecken ob die neuen Gene an der von der Photoperiode abhängige Kaskade folgend auf FT/TSF beteiligt sind. Während viele Gene ähnlich wie SOC1 nur in Anwesenheit von FT/TSF induziert wurden, fanden sich erstaunlicherweise auch Gene welche auch in ft tsf Doppelmutanten noch auf die Photoperiode reagierten. Dies legt nahe, dass zusätzliche III

6 unbekannte Signale eine Rolle in der Antwort auf eine induzierende Tageslänge unabhängig von FT und TSF spielen. In der vorliegenden Arbeit werden auch weitere Untersuchungen neuer Gene beschrieben. Im zweiten Teil der vorliegenden Arbeit wurden genetische Ansätze verwendet um die Funktion von SHORT VEGETATIVE PHASE (SVP), einem Blührepressor aus der MADS-Box Familie, zu untersuchen. Hierbei wurden neue Interaktionen mit die Blüte fördernden Genen und spezifische Rollen des SVP Gens in Blättern und Meristem aufgedeckt. IV

7 Table of contents Abstract... I Zusammenfassung... III Table of contents... V 1. Introduction 1.1 Plant development and the floral transition Flowering pathways Vernalisation pathway Autonomous pathway Gibberellin pathway 1.3 Photoperiodic pathway and activation of flowering Circadian clock The photoperiodic cascade GIGANTEA CONSTANS FT and TSF 1.4 The repression of flowering by FLC The repression of flowering by SVP The early floral transition: from vegetative meristem to inflorescence meristem The floral pathway integrators: classical and new members FT as an integrator FT and FD SOC AGL LFY as an integrator FUL in the floral transition SPL genes: another chapter in the floral transition? 1.7 The later phase of the floral transition: from inflorescence meristem to floral meristem Floral meristem identity genes LFY AP1 and CAL V

8 FUL TFL Flower development and the ABC model Flowering time genes regulate floral patterning 1.8 The shoot apical meristem: balance between stem cell maintainance and organ production Genomics approaches to study the floral transition Single cell technology Next-generation-sequencing technologies and gene expression analysis Recent genomics studies on SAM Objectives Materials and methods Global gene expression analysis of the floral transition at the SAM collected by LCM using next-generation sequencing Defining the floral transition in Arabidopsis thaliana Shift and double shift experiments to study the floral transition In situ hybridisation on marker genes Double shift experiments to link expression of flowering time genes to floral commitment 3.2 Laser microdissection of shoot apical meristems Calculation of the material needed and choice of the techniques Optimization of the protocol Collection of the SAMs RNA extraction from the captured material and RNA amplification Single strand cdna synthesis to test the RNA extracted from the meristems Double strand cdna synthesis for sequencing 3.3 Next-generation sequencing for gene expression analysis in the SAM Deep sequencing with Illumina-Solexa and mapping of the short-sequence reads Quality controls and reliability of the replicates Use of housekeeping genes for the normalization Expression values for known genes Data analysis: identification of differentially expressed genes VI

9 3.3.6 GO term enrichment analysis 4. Characterization of novel genes induced during the floral transition selected from gene expression analysis Selection of the genes Validation of the gene expression data: in situ hybridisations on candidate genes The use of mutants to test the response of the candidate genes to flowering pathways D13: a lipid desaturase induced by photoperiod independently of FT and TSF On the expression pattern of D13: possible interactions with TFL On the signal inducing D13: triggering flowering without LD Modulation of D13 expression with transgenic approaches 4.5 C11: a homeo-domain transcription factor which is dependent on FT/TSF C11 has close homologues which might play redundant roles with it 4.6 C19: a LRR protein responding to FT/TSF Loss of function of C19 may influence flowering 4.7 Some bzip transcription factors partially respond to FT/TSF Several genes are related to the growth of the meristem in response to FT/TSF An unknown protein induced in the center of the SAM by FT/TSF The role of SVP in leaf and meristem and the control of flowering time Loss of function of single floral promoter genes does not overcome the early flowering phenotype of svp mutants SVP and the leaf: genetic and spatial interactions Role of SVP in the leaf and its relationship to FT and TSF SOC1 in relation to SVP, FT and TSF Mis-expression of SVP in the leaf vasculature 5.3 SVP and the meristem: genetic and spatial interactions Role of SVP in the SAM and relation to SOC1 and FUL Mis-expression of SVP in the meristem Double shift experiments with mutants in flowering time genes 5.4 Dual role of SVP: leaf and meristem Quintuple mutant Combined effect of mis-expression 5.5 Mis-expression of SVP.2 in different tissues VII

10 6. Discussion Known genes and novel mechanisms that regulate the floral transition Next-generation sequencing for global gene expression analysis Comparison with available microarray data General features of the data 6.3 Classification of the genes selected from the dataset Time of the response to the inducing photoperiod Spatial pattern of expression Biological and molecular functions of the genes up-regulated during the floral transition Transcription factors and proteins involved in signaling C C Additional layers of regulation Genes involved in metabolism Growth is a key process for the floral transition Meristem growth FT, florigen, and growth 6.7 Response to FT/TSF and responsiveness of ft tsf A novel signal identified in response to shift in photoperiod SVP represses many genes Is SVP a general repressor or is it downstream of photoperiodic induction? Double action leaf-meristem SVP and FLC A quintuple mutant reveals additional targets of SVP Conclusions Perspectives References Appendix I Appendix II Appendix III Acknowledgments Erklärung Lebenslauf VIII

11 Introduction 1. Introduction 1.1 Plant development and the floral transition Plants differ from animals in many aspects of their biology and have evolved different strategies to adapt to the environment. For example, plants cannot move and therefore have evolved an extraordinary variety of mechanisms to respond to diverse environmental stimuli and to adapt to changes in their surroundings. Moreover, plants use a distinct developmental strategy, because while animals undergo major developmental changes during embryogenesis, plants can also undertake dramatic changes in their morphology post-embryonically (Weigel and Jürgens, 2002). One of the best examples of post-embryonic plant developmental changes is the floral transition, which drives a switch from vegetative growth to reproductive development. This process is regulated by a number of different components, including not only internal changes but also environmental factors, because plants need to synchronize the production of flowers with the most favorable conditions and season of the year. This switch in development involves a structure that is located at the apex of the plant shoot, called the shoot apical meristem (SAM). This is a group of undifferentiated cells formed during embryogenesis that is ultimately responsible for producing all above-ground organs of the plant. The SAM must change its identity and shift from the stage of a vegetative meristem, which produces leaves, to the stage of an inflorescence meristem, which produces flowers. This change in identity is a prerequisite for reproductive development to occur. The timing of flowering is clearly very important to ensure the production of seeds and the perpetuation of a plant species. It is also important in agriculture as for many crop plants the seeds are harvested. Therefore a large effort has been made in recent years to understand the mechanisms of regulation of flowering processes and flowering time in plants. Most of this knowledge has been obtained by studying the model plant Arabidopsis thaliana (Arabidopsis), through genetic analyses, biochemical and physiological approaches. Arabidopsis is a particularly suitable system to study flowering. The life cycle of many accessions of this plant is fast, around three months in total. After germination, a seedling starts the cycle with an initial phase called vegetative. When the plant is old enough it is then able to respond to inductive stimuli and to switch to a phase called reproductive in which it develops flowers. These in turn produce fruits, in this case called siliques. Fruits contain and finally release the seeds, while the plant becomes senescent and then dies. The seeds generate new plants, re-starting the cycle from the beginning. Arabidopsis is an 1

12 Introduction annual plant, completing its life cycle within one year, and upon floral transition all the shoot meristems which are generated in the individual plant are induced to flower so that the entire plant starts the senescence process and cannot survive to the following year. Arabidopsis has a number of additional features which are especially useful for dissecting the genetics of flowering and of other processes in general (Koornneef and Meinke, 2010), such as a relatively small genome size compared to most of the other higher plant species. The genome has been fully sequenced (The Arabidopsis genome initiative, 2000). Also, natural variation within the species regarding flowering time produced an even richer scenario to study the genetic basis of flowering regulation. For some accessions, also the genome sequences are becoming available (Ossowski et al. 2008a). Arabidopsis is a diploid organism, is self pollinating, and relatively easy to use for genetic crosses. It is also easy to transform in a stable manner with exogenous DNA. Several collections of mutants were generated, and several genetic and genomic tools are also available (O Malley and Ecker, 2010). On the other hand, some aspects of development at the level of the shoot apical meristem have been hindered so far by the small size of this organ in Arabidopsis. Therefore, this disadvantage resulted in a delay of the study of this particular aspect within flowering, and the developmental biology of the floral transition, especially at the genomic level, still needs to be elucidated. 1.2 Flowering pathways Five major genetic pathways controlling flowering have been described in Arabidopsis (Boss et al., 2004): the photoperiodic pathway, the vernalisation pathway, the autonomous pathway, the gibberellin pathway and the age-related pathway (Fornara and Coupland, 2009) (Fig. 1 and Fig. 2). In addition other factors and less characterized pathways also play a role in the regulation of flowering, such as ambient temperature (Blázquez et al., 2003; Halliday et al., 2003; Lee et al., 2007b), light quality (Cerdan and Chory, 2003) and several other hormones (Davis, 2009). Interestingly, while new aspects of flowering time regulation are continuously uncovered, rendering these networks more and more detailed and inter-connected, some of the key genes and mechanisms are shared even among distantly related species, whereas others are not conserved and give rise to important differences between plant species. Arabidopsis is a facultative long-day plant, which means it flowers earlier in long day (LD) and later in short days (SD). The mechanism by which plants flower in response to day-length, or photoperiod, resides in the so-called photoperiodic pathway. 2
.")
13 Introduction Another pathway responding to an external stimulus, in this case extended exposure to low temperature for several weeks, is the vernalisation pathway. Vernalisation is a prolonged period of cold that some plant species and some winter-annual accessions of Arabidopsis have to experience in order to be able to flower. Together with the photoperiod, this pathway enables a plant to initiate the flowering process soon after winter, and it prevents premature flowering which would cause the reproductive structures to be damaged by the cold. The other three pathways respond to endogenous signals. The autonomous pathway controls flowering via fundamental mechanisms of gene expression such as 3 -end site selection, the gibberellin pathway in relation to endogenous hormonal levels, and the ageing pathway through a microrna whose level falls as the plant gets older. Importantly, the pathways are not entirely separate, but they have some genes in common, and they finally converge in a small set of key floral-promoting genes, which for that reason are called floral pathway integrators (Fig. 1). Fig. 1. Flowering pathways in Arabidopsis thaliana. A general scheme of the most characterized genetic pathways influencing flowering is shown in the figure. Genes marked in red color are floral pathway integrators. 3

14 Introduction Vernalisation pathway The vernalisation pathway allows flowering after the plant is exposed to an extended period of low temperature (vernalisation), preventing flowering during the unfavourable winter season. In Arabidopsis, winter-annual accessions respond to vernalisation because they carry active alleles at two loci, FRIGIDA (FRI) and FLOWERING LOCUS C (FLC). Commonly used Arabidopsis ecotypes Columbia (Col) and Landsberg erecta (Ler) are null mutants of FRI. FRI encodes a nuclear protein present only in plants (Johanson et al., 2000), and it increases FLC expression by a mechanism that remains unclear (Michaels and Amasino, 1999; Michaels and Amasino, 2001). In plants having an obligate vernalisation requirement FLC is expressed at high level and strongly delays flowering because it represses key floral promoter genes, such as FLOWERING LOCUS T (FT) and SUPPRESSOR OF OVEREXPRESSION OF CONSTANS (SOC1). When the plant experiences vernalisation, FLC mrna expression is reduced (Michaels and Amasino, 1999) and thus flowering is permitted. The reason for this reduction in expression is related to chromatin modifications at the FLC locus. Indeed, the FLC gene is under epigenetic regulation, so after proper exposure to cold it is stably maintained in a silent state, and even after a return to warm temperature this gene is not re-activated in Arabidopsis. This phenomenon requires the activity of proteins such as VERNALIZATION INSENSITIVE 3 (VIN3), VERNALIZATION1 (VRN1), VRN2, VRN5/VIN3-LIKE1 (VIL1) (Kim et al, 2009 for a review). VIN3, which encodes a PHD protein, is expressed during vernalisation, but its expression drops once plants are returned to warm temperature, so that it seems to be involved in the first part of the repression mechanism of FLC (Sung and Amasino, 2004). Vernalisation results in the increase in methylation of lysine 9 and lysine 27 of histone H3, which are repressive histone modifications, at the FLC locus (Bastow et al., 2004; Sung and Amasino, 2004). In vin3 and vrn2 mutants, and partially in vrn1 mutants, these methylation events do not occur at the FLC locus, and the FLC gene is not repressed upon vernalisation (Bastow et al., 2004; Sung and Amasino, 2004). VRN2 encodes a component of Polycomb repression complex 2 (PRC2) (Gendall et al., 2001), while VRN1 is a DNA-binding protein with B3 domains. VRN5/VIL1, another PHD protein, is also required for these modifications (Greb et al., 2007; Sung et al., 2006). Other specific chromatin modifications are associated with FLC activation (Kim et al., 2009). Interestingly, in the related perennial species Arabis alpina the orthologue of Arabidopsis FLC, PEP1, is also repressed by vernalisation but this repression in not stably maintained when plants return to warm temperature the following year (Wang et al., 2009b). This mechanism is related to 4
 and Landsberg erecta (Ler) are null mutants of FRI. FRI encodes a nuclear protein present only in plants (Johanson et al.")
15 Introduction the different life strategy of this plant. In pep1 mutants, indeed, both the requirement for vernalisation and the seasonal flowering behavior are lost Autonomous pathway A group of mutants not belonging to the other pathways were grouped into a so-called autonomous pathway. Their common feature is being later flowering than wild-type both in LD and SD (Koornneef et al., 1991). The late flowering behavior of these mutants is similar to FRI-active accessions (Michaels and Amasino, 2001), because they present a high FLC expression level, and they are accelerated in flowering-time upon vernalisation treatment. Indeed, the autonomous pathway promotes flowering by decreasing the level of the mrna of the FLC transcriptional repressor. Rather than a linear pathway, this pathway is a collection of at least eight genes, FCA, FY, FPA, FVE, FLOWERING LOCUS D (FLD), FLK, LUMINIDEPENDENS (LD) and RELATIVE OF EARLY FLOWERING 6 (REF6), which converge on FLC regulation (Simpson, 2004; Noh et al., 2004). They encode mainly proteins associated with chromatin structure or RNA-binding proteins. FLD encodes a protein homologous to a member of a human histone deacetylase complex, which would be involved in deacetylation of FLC chromatin to prevent its transcription and promote flowering (He et al., 2003). FVE encodes a WD-repeat protein, also associated with histone deacetylation (Ausin et al., 2004). REF6 encodes a jumonji/zinc-finger-class transcription factor, also required for histone deacetylation of FLC locus (Noh et al., 2004). FCA (Macknight et al., 1997), FPA (Schomburg et al., 2001) and FLK (Lim et al., 2004; Mockler et al., 2004) proteins contain putative RNA binding domains. FY encodes a protein homologous to Pfs2p, a poly-adenylation and 3 -end processing factor in yeast. FCA has a complex but well studied regulation. Its transcripts have alternative forms, and FCA itself negatively regulates its own expression, promoting the inactive splicing form with an internal poly-adenylation site (Quesada et al., 2003; Macknight et al., 2002). This mechanism is FY-dependent, and FY and FCA proteins physically interact (Simpson et al, 2003). LD encodes a homeodomain protein with unknown function (Lee et al., 1994) Gibberellin pathway Gibberellins (GAs) are plant hormones required for plant growth. They act through promotion of cell division and elongation, and they also promote developmental switches, including flowering. 5
, because they present a high FLC expression level, and they are accelerated in")
16 Introduction The effect of GAs on flowering is more pronounced in SD, and the GA pathway has been shown to be particularly important in the absence of the activation of the photoperiodic pathway (Reeves and Coupland, 2001). Indeed, for example ga1 mutants, which lack the first step of GA biosynthesis, never flower in SD. gai mutants, which instead are insensitive to GA, are also late flowering in SD (Wilson et al., 1992). ga1-3, a highly GA-deficient mutant (Koornneef and Van der Veen, 1980), is severely dwarfed, regardless of photoperiod, since bolting in Arabidopsis is absolutely dependent on GA signaling (Mutasa-Göttgens and Hedden, 2009). Conversely, spindly mutants, which have constitutively active GA signaling, are early flowering (Jacobsen and Olszewski, 1993). Fig. 2. Genes involved in the control of the floral transition. Some relevant genes involved in flowering and their relationships are shown. Details are given in the text. The scheme was kindly provided by Fabio Fornara. 6
, is severely dwarfed, regardless of photoperiod, since bolting in Arabidopsis is absolutely dependent on GA signaling")
17 Introduction 1.3 Photoperiodic pathway and activation of flowering The photoperiodic pathway acts in response to the photoperiod, or day length. Day length is one of the major environmental factors regulating flowering time. Indeed, the characteristic of many plant species to flower in response to changes in photoperiod synchronises flowering with the favourable season. For example Arabidopsis flowers in response to increased day lengths of spring, whereas rice flowers in response to short days to avoid drought periods. Interestingly, the perception of photoperiod in plants takes place in the leaves, while the floral transition happens in the SAM, where the floral structures will arise, and although this has been known for a long time, the molecular mechanism underlying this phenomenon have been revealed only recently (Turck et al., 2008 for a review). The ability of plants to measure day length and respond to its changes is based on the interaction of light with an internal housekeeping mechanism that plants use to measure time, the so-called circadian clock Circadian clock Plants are able to generate circadian rhythms, with a period of approximately 24 hours. This system is composed of the clock core or central oscillator, which generates the timing, of input pathways that synchronise the clock oscillator to daily cycles of light and dark, and of output pathways regulating various specific processes that are under circadian influence (Salome and McClung, 2004; Strayer and Kay, 1999). One of the rhythmic outputs generated by the circadian clock is the photoperiodic regulation of flowering (Imaizumi, 2010 for a review). Input pathways synchronising the clock are mediated for example by the photoreceptors. Some of the families of photoreceptors participating in clock entrainment are phytochromes, cryptochromes and the ZTL family (Ausin et al., 2005). Proteins that have been shown to be at the centre of the circadian oscillator are CCA1, LHY, TOC1, which create a feedback loop of approximately 24 hours (Alabadi et al., 2001). Their mrnas are expressed in a circadian rhythm, but LHY and CCA1 mrna levels peak at dawn, while TOC1 mrna level peaks at dusk. CCA1 and LHY repress the expression of TOC1. TOC1 activates LHY and CCA1. Mathematical models postulated additional loops to account for the real complexity of the data (Locke et al., 2005). Experimental studies supported this hypothesis. Another loop includes TOC1, CCA1, LHY and a Y component, which has been suggested to be the GI gene (Locke et al., 2005). Finally, PRR7 and PRR9, two proteins similar to TOC1 containing a CCT motif, form together with CCA1 and LHY an additional loop (Zeilinger et al., 2006). Therefore the 7

18 Introduction plant circadian clock is composed of three interlocked transcriptional feedback loops (Fig. 2), and additional regulation is provided to the clock at the post-transcriptional level (Harmer, 2009 for a review) The photoperiodic cascade Classically, the three key genes GIGANTEA (GI), CONSTANS (CO) and FLOWERING LOCUS T (FT) were all assigned to the photoperiodic pathway in Arabidopsis. This was shown by genetic analysis (Redei, 1962; Koornneef et al., 1991; Koornneef et al., 1998), since the loss-of-function of these genes delays flowering under long days (LD) but not in short days (SD). Other studies demonstrated that the hierarchy of activation is GI-CO-FT (Kardailsky et al., 1999; Kobayashi et al., 1999; Samach et al., 2000; Suárez-López et al., 2001). Nowadays a linear model GI-CO-FT is only a simplified version of a more complex situation. This main branch still accounts for the major contribution to the photoperiodic pathway, but at the molecular level many other details and players have been revealed (Fig. 2) GIGANTEA A gene called GIGANTEA (GI) plays a role both in the circadian system itself, and in controlling flowering as an output of the circadian clock, and it has been shown that these functions are distinct (Mizoguchi et al., 2005). gi mutants for example are altered in period length of the circadian rhythm, they have reduced amplitude of LHY and CCA1 mrna (Fowler et al., 1999; Park et al., 1999; Mizoguchi et al., 2002) and some alleles cause a long hypocotyl in deetiolated seedlings particularly under red light, because they are impaired in phyb signaling (Huq et al., 2000). GI, as an output of the clock, is circadian regulated with a peak of expression of its mrna 10 hours after dawn (Fowler et al 1999, Park et al 1999). gi mutants are late flowering in LD, and in this background the mrna of CO is reduced (Suárez-López et al., 2001). Conversely, plants overexpressing GI from the 35S promoter are early flowering both in LD and SD (Mizoguchi et al., 2005) and express CO and FT mrna at higher level. GI promotes the transcription of CO, and connects in this way the circadian clock to the photoperiodic pathway. Nevertheless, in co or ft background 35S::GI can still partially accelerate flowering, possibly through other pathways independent of CO and FT (Mizoguchi et al., 2005). For example, a mechanism in which GI controls FT independently of CO was reported, where a microrna, mir172, is involved in the pathway (Jung et al., 2007). 8

19 Introduction GI encodes a nuclear protein (Huq et al., 2000), with a large size, composed of 1173 amino acids. Though the molecular and biochemical functions of GI remained for a long time unknown, lately some progress has revealed new aspects of this protein. Interaction of GI protein with the F-box protein ZEITLUPE (ZTL) is necessary to establish and sustain circadian oscillations of ZTL, through a post-translational mechanism (Kim et al., 2007). ZTL protein then sustains the circadian clock by mediating the ubiquitination and degradation of TOC1. One mechanism that has been proposed to explain the promotion of CO transcription is based on the interaction of GI protein with the FLAVIN-BINDING, KELCH REPEAT, F-BOX1 (FKF1) and CYCLING DOF FACTOR1 (CDF1) proteins, which associate on CO chromatin (Sawa et al., 2007). Interaction of GI protein with FKF1 protein would promote the FKF1-dependent degradation of CDF1 protein, which is a repressor of CO, leading to CO transcription (Sawa et al., 2007). Recently, other members of the DOF transcription factor family were shown to redundantly repress CO expression. The abundance of CDF2 protein is also regulated by GI (Fornara et al., 2009). CDF1, CDF2, CDF3 and CDF5 when over-expressed in phloem companion cells delay flowering and decrease CO expression, while a quadruple mutant lacking all four genes is early flowering both in LD and SD and photoperiodic-insensitive, with CO expressed at higher level but still following the circadian pattern (Fornara et al., 2009). Interestingly, when also GI is mutated in this background, both the response to photoperiod and the circadian pattern of CO are restored in the quintuple mutant (Fornara et al., 2009). Therefore, it seems that GI is not essential for the transcription and for the diurnal oscillation of CO, but rather required to enhance it by removing the repression exerted by the CDF proteins CONSTANS CO encodes a nuclear protein containing two zinc-finger domains (Putterill et al., 1995; Samach et al., 2000; Robson et al., 2001). According to expression studies based mainly on GUS reporter constructs, CO mrna is expressed in vascular tissue, in hypocotyl, cotyledons and leaves, and also at the apex (Takada and Goto, 2003; An et al 2004). However, it has been shown that CO acts in the phloem companion cells, activating its target gene FT in a cell-autonomous manner, and then resulting in activation of floral development at the apex (An et al., 2004). A systemic signal activated by CO crosses graft junctions, and does not require movement of CO protein, as shown by analysis of CO:GFP fusion (An et al., 2004). CO is a central regulator of flowering time, and not only the gene itself is finely regulated at the 9

20 Introduction transcriptional level (see previous paragraph) but also the protein is regulated at the posttranscriptional level through multiple mechanisms (Fig. 2). CO expression is under circadian regulation, with a marked peak of its mrna level at the end of the day (Suarez-Lopez et al., 2001) (Fig. 3). In this way, this gene mediates between the circadian clock and photoperiodic control of flowering time. Nevertheless, CO protein level depends not only on the relative RNA pattern but also on the light condition, because exposure to light is necessary to activate CO protein function (Valverde et al., 2004). If the plants grow in SD, the peak of CO falls in the dark period (night), when CO protein is not stabilized and it is degraded. In LD, this peak is at dusk (Suarez-Lopez et al., 2001; Yanovsky and Kay, 2002; Imaizumi et al., 2003). In this condition CO protein, in response to light, is stabilized, and it directly activates the expression of FT (Kardailsky et al., 1999; Kobayashi et al., 1999; Samach et al., 2000; Valverde et al., 2004) thus triggering flowering. The so-called external coincidence model was formulated decades ago (Bünning, 1936; Pittendrigh and Minis, 1964), before knowing any molecular mechanisms underlying flowering, to explain the photoperiodic response. This model seems to fit with the current model of CO regulation. In this view, a coincidence of the peak of expression of CO mrna with the exposure to an external condition (light), has to be fulfilled to have an active function and activate flowering (Fig. 3). White light, blue light and far-red light stabilize CO protein, while red light and dark promote its degradation through the proteasome (Valverde et al., 2004). CRYPTOCHROME1 (CRY1), CRY2 and PHYTOCHROME A (PHYA) photoreceptors are involved in the stabilization of CO protein (Yanovsky and Kay, 2002; Valverde et al., 2004). The two cryptochromes (CRY1 and CRY2) stabilize CO in blue light and both at the beginning and at the end of the day. PHYA stabilizes CO in far-red light, and similarly to the cryptochromes during the day. Conversely, PHYB photoreceptor is responsible for the reduction of CO protein level, in red light and during the morning (Valverde et al., 2004). In 35S::CO background, cry1 cry2 and phya mutations delay flowering while phyb mutation accelerates flowering, in agreement with the previous observations on the effects of the various photoreceptors on CO abundance and with the relative levels of FT expression, as an output of CO activity (Valverde et al., 2004). Recently, SUPPRESSOR OF PHYA (SPA) proteins have been implicated in the control of stability of CO protein (Laubinger et al., 2006). spa1 mutants are early flowering in SD, and spa1 spa3 spa4 even earlier, because of a dramatic up-regulation of FT expression. The co mutation suppresses the early flowering of spa1 10

21 Introduction mutation. However, in absence of SPA1 the expression of CO mrna is not altered, but there is a high increase of CO protein abundance. Moreover, SPA proteins have been shown to physically interact with CO protein, both in vitro and in vivo (Laubinger et al., 2006). More recently, it has been shown that an ubiquitin ligase called CONSTITUTIVE PHOTOMORPHOGENIC 1 (COP1) promotes the degradation of CO protein in the dark (Jang et al., 2008). Indeed, cop1 mutants are early flowering, they also show an increase in FT expression, and they are even able to flower in darkness. Mutation in CO partially suppresses the early flowering of cop1. Indeed, in cop1 mutant CO protein is stabilized in the night period, but not in the morning. Moreover, CO and COP1 proteins have been shown to physically interact (Jang et al., 2008). This provides additional molecular details on how flowering response to day length is achieved. Fig. 3. Expression patterns of CO and FT mrna. A schematic representation shows the expression pattern of the mrnas of these two genes during a 24 hours daily cycle FT and TSF FT encodes a small protein with similarity to RAF-kinase inhibitor proteins in animals (also known as phosphatidyl ethanolamine-binding proteins) (Chardon and Damerval, 2005). Over-expression of FT causes a dramatic early flowering, both in LD and SD (Kardailsky et al., 1999; Kobayashi et al., 1999), while ft loss of function mutants are late flowering in LD (Koornneef et al., 1991). Under LD this gene is activated by CO and it is transcribed in the vascular tissue of leaves (Kardailsky et al., 1999; Kobayashi et al., 1999; An et al., 2004; Wigge et al., 2005; Samach et al., 2000). As an output of CO, FT is also diurnally regulated, with a peak toward the end of the day, around ZT16 (Suarez-Lopez et al., 2001) (Fig. 3). Over-expressing CO in phloem companion cells with SUC2 promoter causes early flowering through the activation of FT. SUC2::FT, similarly, results in early flowering. Using KNAT1 11
22 Introduction promoter to express FT in the shoot apical meristem also causes early flowering, while using this promoter to drive expression of CO does not accelerate flowering (An et al., 2004). So, although both CO and FT genes are expressed in leaves, CO protein acts in the phloem while FT protein acts in the apical meristem to induce gene expression and promote flowering in this tissue. Since the 1930s it was proved that photoperiod is perceived by the leaf, whereas flowering takes place in the shoot apical meristem (Knott, 1934; Zeevaart, 1976). It was also demonstrated that an hypothetical long-distance signal, the so-called florigen, has to be transferred from the leaf to the apical meristem to promote flowering. It was then postulated for long time that FT is a plausible candidate for the florigen, although it was not clear whether this signal would travel as FT mrna or FT protein. Convincing experiments coming from different groups recently solved the debate (reviewed by Kobayashi and Weigel, 2007; Turck et al., 2008). It has been proposed that FT protein is the molecule moving from the leaf to the SAM inducing flowering in Arabidopsis (Corbesier et al., 2007). In plants containing a SUC2::FT:GFP construct, which is also able to cause early flowering, FT:GFP signal was detected not only in the vascular tissue of the shoot, but also in the provasculature at the shoot apex and at the base of the SAM, while no FT:GFP mrna was detected (Corbesier et al., 2007). FT:GFP was also graft-transmissible through the phloem to a ft-7 mutant shoot receiver, accelerating its flowering. GAS1 promoter was also used to drive the expression of FT in the phloem companion cells of the minor veins of leaves. In the ft-7 background, GAS1::FT causes early flowering, while GAS1::GFP:FT does not accelerate flowering, although the protein is still active in the leaf and there promotes up-regulation of FT target genes (Corbesier et al., 2007). Therefore, the GFP fusion prevents flowering because it does not allow the export of the FT protein from the minor veins of the leaf to the apex. Other groups supported the same conclusions with complementary experiments (Jaeger and Wigge, 2007; Mathieu et al., 2007). In one report, an epitope-tagged version of FT was constructed fusing Myctags to FT. Using specific antibodies, Myc:FT protein was detected on the route from the vasculature to the organ primordia through the provasculature (Jaeger and Wigge, 2007). Then, a nuclear localization signal (NLS) was used to target FT protein constitutively to the nucleus. Myc:NLS:FT expressed in the ft-10 mutant background causes early flowering when expressed with 35S promoter, while it does not accelerate flowering when expressed with SUC2 promoter, because the FT protein is blocked in the leaf nuclei and cannot traffic to the SAM anymore (Jaeger and Wigge, 2007). Similarly, another group made use of FT fused to three copies of YFP and a NLS, and a recognition site for a virus protease between FT and the rest of the tag. Expression of this 12
23 Introduction tagged version of FT with 35S or FD (specific for the SAM) promoters promoted flowering, while expression with SUC2 promoter did not promote flowering because the protein was trapped into the companion cells, preventing FT to reach the meristem (Mathieu et al., 2007). Releasing FT protein through a construct expressing the specific protease was sufficient to cause early flowering. Moreover, artificial microrna (amirna) against FT mrna expressed by SUC2 promoter caused late flowering, while by FD promoter did not delay flowering demonstrating that the mrna is not required at the meristem (Mathieu et al., 2007). Similar results were found also in rice for the homologue of FT (Tamaki et al., 2007), and in Cucurbits (Lin et al., 2007). However, the florigen might be a set of additive signals, and FT protein would be one part of this set (Corbesier and Coupland, 2005; Corbesier and Coupland, 2006; Giakountis and Coupland, 2008). A gene with similar features to FT is TWIN SISTER OF FT (TSF). FT in Arabidopsis is part of a gene family which includes six members (Chardon and Damerval, 2005), and TSF is the closest to FT. 35S::TSF promotes early flowering like FT (Kobayashi et al., 1999). tsf mutant is not late flowering, but enhances the late flowering of ft mutant in the ft tsf double mutant (Michaels et al., 2005; Yamaguchi et al., 2005), so that these two related genes have overlapping roles, but FT is predominant. TSF is regulated by CO, as its expression is lower in co mutants and induced by LD and by CO activation through an inducible system (Yamaguchi et al., 2005). In agreement with that, the early flowering phenotype of SUC2::CO is only partially suppressed by the ft mutation (An et al., 2004), while it is completely suppressed in a ft tsf double mutant background (Jang et al., 2009). Also the diurnal pattern of TSF is similar to the one of FT, with a peak at dusk in LD (Yamaguchi et al., 2005). However, the spatial expression patterns of TSF and FT do not seem to completely overlap in young seedlings, since TSF was shown to be expressed in the vascular tissue of hypocotyl and petiole, in the basal part of cotyledons and near the SAM. Later in the development their expression patterns are more similar (Yamaguchi et al., 2005). Over-expression of TSF in the phloem with SUC2 promoter causes early flowering also in the absence of FT, and the same effect is obtained by SUC2::FT in tsf mutant (Jang et al., 2009). Anyway, it is not yet clear whether TSF is part of the florigen signal as movement of the protein has not been tested (Turck et al., 2008). 1.4 The repression of flowering by FLC FLOWERING LOCUS C (FLC) encodes a MADS-box transcription factor that is a potent floral 13
24 Introduction repressor, with a central role in flowering, because, as discussed previously, the vernalisation and autonomous pathways converge on this gene (see paragraphs and 1.2.2). To repress flowering, FLC reduces the expression of floral promoter genes, like SOC1, FT, FD and possibly TSF (Yamaguchi et al, 2005). Loss-of-function mutations in FLC cause early flowering (Michaels and Amasino, 1999), while over-expression of this gene causes late flowering (Michaels and Amasino, 2001). Ectopic expression of FLC with the 35S promoter causes down-regulation of SOC1 and FT in seedlings (Hepworth et al., 2002; Michaels et al., 2005). FLC represses also FD expression (Searle et al., 2006). Indeed, FLC protein directly binds, in specific CArG boxes, SOC1 promoter (Hepworth et al., 2002), the first intron of FT (Helliwell et al., 2006) and FD promoter (Searle et al., 2006). In this way, it has been demonstrated that FLC acts by repressing both systemic flowering signals produced in the leaves (such as FT) and the response to these signals at the meristem (SOC1 and FD), until vernalisation reduces FLC expression in both tissues and allows flowering to occur (Searle et al., 2006). Recently, some reports revealed new interesting aspects of the FLC transcription factor. One aspect is the physical and functional interaction with SVP, another potent floral repressor (see next paragraph). Another one is the possible involvement of FLC in the regulation of seed germination (Chiang et al., 2009). Finally, the role of antisense transcripts of FLC in the regulation of this gene and its impact on flowering time regulation showed an additional mechanism that plants use to finely regulate gene expression (Swiezewski et al., 2009; Liu et al., 2010). 1.5 The repression of flowering by SVP Another gene that acts as a floral repressor is SHORT VEGETATIVE PHASE (SVP). SVP belongs to the MADS-box transcription factor family. Loss of function of this gene in Arabidopsis causes an early flowering phenotype, both in LD and SD (Hartmann et al., 2000). svp mutants are still sensitive to photoperiod, which means that in SD they are earlier flowering than wild-type but still later than the mutant in LD. Moreover, plants heterozygous for svp mutation show an intermediate phenotype between wild-type and homozygous, suggesting a dosage effect for the product of this gene. SVP expression is present during the vegetative phase in young leaves and apical meristems, until the early stages of bolting. Then it is not present in the inflorescence meristem, and it rises again in flower primordia (Hartmann et al., 2000). This pattern suggests a role for this gene in maintaining the vegetative phase, before flowering occurs, and another distinct, later function in the 14
25 Introduction flower. Several reports proved that SVP represses the expression of FT. The FT mrna level is elevated in svp mutants, and FT::GUS shows ectopic expression in the leaf (Lee et al., 2007b). Expression of FT is up-regulated in svp mutants during the whole diurnal cycle of 24 hours, and the same happens to TSF (Jang et al., 2009, and this study). Another gene that is repressed by SVP is SOC1. SOC1 expression is higher in svp mutant and lower in 35S::SVP, compared to wild-type (Li et al., 2008). In addition, SOC1 mrna increases in svp largely independently of FT and AGL24 (Li et al., 2008). ft or soc1 mutations partially delay flowering in svp mutant background (Lee et al., 2007b), and also when combined in the ft soc1 double mutant still cannot completely suppress the effect of svp mutation (Li et al., 2008; Fujiwara et al., 2008). The svp mutation in ft tsf double mutant background again causes early flowering. In this triple mutant SOC1 is still transcribed as in wildtype (Jang et al., 2009, and this study). Therefore, SVP plays a role in repressing SOC1 transcription strongly in the shoot apex, independently of FT and TSF, while it modulates also FT and TSF expression in the leaf (Li et al, 2008; Jang et al., 2009, and this study). Direct binding of SVP protein to both FT and SOC1 loci has been reported. By ChIP, SVP protein was shown to bind to a CArG motif in the promoter of FT in protoplasts (Lee et al., 2007b), and to bind to the promoter of SOC1 (Li et al., 2008). This last observation was confirmed also by mutating the putative binding site in the SOC1 promoter, which abolished SOC1 repression (Li et al., 2008). The targets of SVP tightly links this gene to another MADS-box gene, FLC. Both SVP and FLC are floral repressors, and both FT in the leaf and SOC1 in the SAM are also directly regulated by FLC, as discussed in the previous section. Mutations in FLC or increase in its expression by the use of FRI FLC alleles does not affect SVP expression level, and also altering the expression of SVP does not change FLC expression level (Lee et al., 2007b). Conversely, late flowering of plants carrying active FRI FLC is largely suppressed by svp mutation, suggesting that FLC needs SVP as a partner to exert its repressing function (Lee et al., 2007b), while loss of FLC does not completely rescue the late flowering of 35S::SVP (Li et al., 2008). Moreover, flc svp flowers earlier than svp (Li et al., 2008), although the difference is very subtle. Finally, it has been shown that FLC and SVP proteins physically interact, both in vitro and in vivo (Li et al, 2008; Fujiwara et al., 2008). However, SVP mrna transcription does not change with vernalisation treatment (Li et al., 2008). SVP expression level is not affected in photoperiodic mutants, while it has been shown that this gene responds to endogenous signals from the autonomous pathway and from the gibberellin pathways, since it is 15
26 Introduction reduced by gibberellin treatment and increased in fve and ga1 mutants (Li et al., 2008). In a previous report it was also proposed that SVP mediates ambient temperature signalling in Arabidopsis (Lee et al., 2007b). svp mutants do not alter their flowering time in response to different temperatures, which suggests a role for this gene in response to temperature changes. SVP was indeed proposed to act in the thermosensory pathway, downstream of the genes FCA and FVE, which are in this pathway (Blázquez et al., 2003), since the svp mutation was also epistatic to both fca and fve mutations (Lee et al., 2007b). Very recently a study reported a mirna responsive to temperature changes, mir172, to be more expressed in svp mutant compared to wild-type, and some of the mirna targets to be consequently decreased in expression (Lee et al., 2010). Since mir172 promotes flowering, this provides a possible link between SVP and mirnas to regulate flowering in response to changes in ambient temperature. Therefore, SVP is a floral repressor controlling floral pathway integrators in response to various endogenous and environmental signals. Finally, an additional further role for SVP was recently discovered. This role would be downstream of two genes involved in the regulation of the circadian clock: LHY and CCA1. lhy cca1 double mutants accumulate SVP protein, and a role for these genes was proposed in reducing the abundance of SVP protein, which would result in flowering acceleration (Fujiwara et al., 2008). This effect could be mediated by ELF3, since ELF3 protein interacts in yeast two-hybrid experiments both with CCA1 and SVP proteins (Yoshida et al., 2009). Moreover, SVP protein abundance increases in ELF3 over-expressors, while elf3 mutants show a delayed phase of SVP protein accumulation (Yoshida et al., 2009). The closest paralogous gene to SVP is AGAMOUS-LIKE 24 (AGL24). Nevertheless, despite the close relationship between them in term of sequence similarity, they have opposite effects on flowering time, and svp mutation is epistatic to agl24 mutation (Gregis et al., 2006). Another MADS-box gene that represses flowering is FLOWERING LOCUS M (FLM). Mutation in FLM results in early flowering, both in LD and SD, while over-expression of FLM by the 35S promoter causes late flowering, similarly to the SVP gene (Scortecci el al., 2001). The expression pattern of SVP and FLM is also similar. flm svp double mutants flower like the single mutants, both in LD and SD, and both the effect of 35S::FLM and 35S::SVP are suppressed by mutations in SVP and FLM respectively, although FLM expression levels do not affect SVP expression levels, suggesting that SVP and FLM act as partners in the same pathway (Scortecci el al., 2003). Although FLM is closer to FLC in terms of sequence similarity, it is not affected by FRI, vernalisation 16
27 Introduction treatment, and mutations in genes of the autonomous pathway (Scortecci el al., 2001; Scortecci el al., 2003). FLM could be involved in the modulation of the sensitivity to temperature, as was shown in a recent report (Balasubramanian et al., 2006). 1.6 The early floral transition: from vegetative meristem to inflorescence meristem The floral pathway integrators: classical and new members Signals from the different flowering pathways converge to a restricted group of genes that for this reason have been classically named floral pathway integrators (Simpson and Dean, 2002). Therefore, they are somehow responsible for the final part of the decision to undergo the floral transition. These genes are all floral promoters and include FT, LEAFY (LFY) and SOC FT as an integrator FT has a central role in the induction of flowering in response to photoperiod. However, also several other factors control FT expression. The balance between the main activator CO and the various repressors determines the activation of flowering by FT. The role of some repressors of FT transcription belonging to the MADS-box family, like FLC and SVP, has been already discussed (see above). Some other transcription factors that have been shown to repress FT activity are comprised in a family containing one or more DNA-binding AP2-domains. TEMPRANILLO1 (TEM1) and TEM2 genes encode two related RAV transcription factors, with one AP2/ERF domain and one B3 domain, and they have been shown to repress FT expression (Castillejo and Pelaz, 2008). FT and TEM1 have an opposite trend of expression during development. Over-expressing TEM1 results in lower FT mrna level and late flowering, while the tem1 mutant shows higher FT expression, and the tem1 tem2 double mutant is early flowering. Additionally, TEM1 protein was shown to directly bind a region at the 5 UTR of the FT locus (Castillejo and Pelaz, 2008). Based on the effects on FT mrna level of manipulating the relative expression levels of CO and TEM1, it was proposed that the balance of expression levels of these two genes contributes to determining FT expression and the time to flower (Castillejo and Pelaz, 2008). Another six related transcription factors contain two AP2-domains, and they are targets of mir172 (Aukerman and Sakai, 2003; Schmid et al., 2003): APETALA2 (AP2), TARGET OF EAT1-3 (TOE1-3), SHLAFMÜTZE (SMZ) and SCHNARCHZAPFEN (SNZ). Within this family, only toe1 mutant has a phenotype, which results in early flowering, and which is enhanced in toe1 toe2 17
28 Introduction double mutants (Aukerman and Sakai, 2003). TOE1 function has been associated with repression of FT (Jung et al., 2007). Also SMZ has been proposed to be a repressor of FT (Mathieu et al., 2009). Plants over-expressing SMZ are late flowering (Schmid et al., 2003), and although both smz single mutants and smz snz double mutants do not have a phenotype, smz snz toe1 toe2 is earlier flowering than toe1 toe2 (Mathieu et al., 2009). FT transcription is repressed by over-expression of SMZ. Interestingly, both the late flowering and the FT mrna decrease were suppressed by flm mutation, suggesting that FLM is needed for SMZ activity and maybe participates in the regulation of FT repression (Mathieu et al., 2009). TERMINAL FLOWER 2 (TFL2), a protein involved in epigenetic repression, is also a repressor of FT. Loss of function mutants of this gene are early flowering (Larsson et al., 1998). The increased level of FT mrna in tfl2 mutants is the main cause of early flowering, since the ft mutation completely suppresses the early flowering phenotype (Kotake et al., 2003). co tfl2 double mutants flowered as early as tfl2, although the CO-independent FT up-regulation was present only in the basal part of leaves, while FT expression in the apical part requires CO (Takada and Goto, 2003). The tfl2 mutation further accelerated the flowering time of 35S::CO and increased the level of FT mrna, suggesting that TFL2 counteracts the activity of CO on FT expression (Takada and Goto, 2003). Like FT, TSF has also been shown to be induced by vernalisation and negatively regulated by FLC (Yamaguchi et al., 2005), by SVP (Jang et al., 2009, and this study), and repressed by overexpression of SMZ (Mathieu et al., 2009), so that it could also be considered as an integrator. TSF is not repressed by TFL2 (Yamaguchi et al., 2005) FT and FD Once FT is transcribed at high enough level and its protein is transported to the SAM, a series of downstream genes are activated to trigger flowering at the SAM (Fig. 4). In the current model FT protein directly interacts with a bzip transcription factor encoded by a gene called FLOWERING LOCUS D (FD), forming a protein complex which is able to directly activate the gene APETALA1 (AP1) (Abe et al., 2005; Wigge et al., 2005). AP1 is a floral meristem identity gene which encodes a MADS-box transcription factor involved in flower formation, and which marks the beginning of floral meristem formation (Bowman et al., 1993; Irish and Sussex, 1990; Mandel et al., 1992). Two main reports suggested this model on the basis of very similar results (Abe et al., 2005; Wigge et 18
29 Introduction al., 2005). First of all, loss of function of FD results in late flowering and strongly suppresses the early flowering phenotype of 35S::FT over-expression. Interaction between FT and FD proteins was also detected in yeast-two hybrid and other methods (Abe et al., 2005; Wigge et al., 2005). In one report, FD was found to interact also with the FT-homolog TFL1 (Wigge et al., 2005), while in the other the interaction was barely detectable (Abe et al., 2005). FD protein was localized in the nucleus of cells at the shoot apex (Abe et al., 2005). FD mrna is expressed in the SAM, and part of this domain overlaps with AP1 expression domain (Abe et al., 2005). In agreement with that, AP1 mrna appearance in the apex is delayed in the fd single mutant (Wigge et al., 2005). Moreover, ft lfy double mutants show a very similar phenotype to fd lfy double mutants, and the expression of AP1 mrna is in both cases strongly reduced (Abe et al., 2005; Wigge et al., 2005). 35S::FD causes ectopic expression of AP1 and FUL, which does not occur under SD or in ft mutant background (Abe et al., 2005; Wigge et al., 2005). Finally, ChIP experiments using 35S::FD and antibodies for FT showed that AP1 promoter sequences were enriched in LD but not in SD (Wigge et al., 2005). Interestingly, FD expression seems to decrease in floral primordia once AP1 is expressed in that domain (Wigge et al., 2005), suggesting that FD is not longer required once AP1 has been already activated. Clearly, AP1 is not the only target of FT, since ap1 mutants do not suppress the early flowering of 35S::FT (Kardailsky et al., 1999). SOC1 has been demonstrated to be downstream of FT in several reports (Yoo et al., 2005; Searle et al., 2006), and is an earlier acting gene than AP1. In addition, two other two MADS-box genes shown to be induced by FT are FUL and SEP3, although this was not investigated in the meristem so far. In leaves, FUL and SEP3 are up-regulated in 35S::FT and down-regulated in ft mutant, compared to wild-type (Teper-Bamnolker and Samach, 2005). The fd mutation resulted in reduction in expression level of these genes similarly to ft mutation. Moreover, ful slightly delayed the early flowering of 35S::FT (Teper-Bamnolker and Samach, 2005). Moreover, FUL is induced by shift to LD (Hempel et al., 1997) but this increase is strongly delayed in ft mutants (Schmid et al., 2003). Also TSF protein has been shown to physically interact with FD protein by yeast two-hybrid (Jang et al., 2009). Indeed, fd ft double mutants flower later than ft, and similarly to ft tsf and fd ft tsf, suggesting that both the FT-FD and TSF-FD protein interactions are biologically relevant (Jang et al., 2009). However, ft tsf is remarkably later flowering than fd mutant. Therefore, FT and TSF must act also independently of FD to promote flowering. 19
30 Introduction Fig. 4. FT protein moves to the shoot apical meristem to induce flowering. Genes acting to promote flowering in the early phases of the floral induction are indicated SOC1 SOC1 or AGAMOUS-LIKE 20 (AGL20) encodes a MADS-box transcription factor promoting flowering. It was isolated in a mutagenesis screen where soc1 mutation partially suppressed the early flowering caused by over-expression of CO with 35S promoter (Onouchi et al., 2000). Coherently, SOC1 expression was strongly increased by inducing CO activity with a 35S::CO:GR inducible system (Samach et al., 2000). The soc1 mutation alone delays flowering, both under LD and SD, and the mutant is still sensitive to photoperiod (Samach et al., 2000; Lee et al., 2000). Over-expression of SOC1 through 35S promoter causes early flowering (Samach et al., 2000; Borner et al., 2000). SOC1 responds to photoperiod, as its expression is remarkably lower in SD than in LD (Lee et al., 2000; Borner et al., 2000). It is induced at the SAM and leaf primordia, already 16 hours after shift from SD to continuous light (Samach et al., 2000) or to LD (Borner et al., 2000). It is expressed in the inflorescence meristem, but excluded from floral primordia, and 20
31 Introduction reappears in flowers at stage 2 and 3 of flower development (Samach et al. 2000; Borner et al., 2000). The activation of SOC1 by CO is mediated by FT (Yoo et al., 2005). Indeed, not only SOC1 is upregulated in 35S::FT and down-regulated in ft mutant, but also the ft mutation suppresses the induction of SOC1 by 35S::CO (Yoo et al., 2005). Up-regulation of SOC1 at the meristem is dependent on both FT and FD, since in ft and fd mutants SOC1 increase is strongly delayed (Searle et al., 2006). TSF, like FT, also promotes SOC1 transcription (Michaels et al., 2005; Yamaguchi et al., 2005). However, SOC1 over-expression in the meristem is not sufficient to overcome the effect of the co and ft mutation (Searle et al., 2006). Moreover soc1 mutation, which indeed does not result in a strong late flowering in LD, only partially suppresses the early flowering of 35S::FT (Yoo et al., 2005), confirming that FT has additional target genes other than SOC1. In addition to the photoperiod, SOC1 integrates also the signals from the other pathways. Its expression increases with the age of the plant, and it is influenced by the autonomous pathway (Samach et al. 2000; Borner et al., 2000; Lee et al., 2000). This gene indeed was also isolated with another screen by activation-tagging in which over-expressed SOC1 suppressed the late flowering phenotype of a FRI-introgressed line (Lee et al., 2000). The repression exerted by FLC, which is direct, and mediates the effect of the autonomous and vernalisation pathway, has been already discussed (see paragraph 1.4). Interestingly, SOC1 increases upon vernalisation also independently of FLC (Moon et al., 2003). The repression exerted by SVP has also been mentioned (see paragraph 1.5). Finally, SOC1 integrates the signals from the gibberellin pathway (Moon et al., 2003). SOC1 expression increases upon GA treatments (Borner et al., 2000), and the over-expression of SOC1 overcomes the late flowering of ga1-3, a mutant in the gibberellin pathway, while the soc1 mutant is less responsive to GA (Moon et al., 2003). Not so much is known about how SOC1 activates flowering, and so far the only well documented target is LFY (see next paragraphs). Surprisingly, over-expression of SOC1 by the 35S promoter, which causes early flowering, also results in an increase of FT (Michaels et al., 2005). Indeed, the over-expression of SOC1 causes early flowering not only when is targeted in the meristem through KNAT1 promoter, but also when is targeted in phloem companion cell through SUC2 promoter, although with a very small difference in terms of leaf number (Searle et al., 2006). A possible explanation for this phenomenon comes from a recent report, in which a role of SOC1 in reducing FLC mrna level is proposed (Seo et al., 2009), which could explain the promotive effect 21
32 Introduction of SOC1 on FT. Microarray analysis comparing wild-type, loss of function and over-expressor of SOC1 revealed that this gene negatively regulates a set of cold-regulated (COR) genes (Seo et al., 2009). This repression is not direct, but acts through the CRT/DRE binding factors (CBFs), which are key regulators of the cold response pathway in Arabidopsis and positively regulate the COR genes (Thomashow, 1999). SOC1 protein binds to the promoters of the CBF1-3 genes, as shown by ChIP (Seo et al., 2009). On the other hand, over-expression of the CBFs with 35S promoter causes an increase in FLC expression. Therefore, there is a feedback loop, so that transient cold would promote CBFs, and consequently FLC expression and SOC1 repression, while floral induction would activate SOC1 that represses the cold-response and FLC, further promoting flowering AGL24 AGAMOUS-LIKE24 (AGL24) encodes another MADS-box transcription factor that promotes the floral transition. Its expression is also regulated by different floral pathways, such as photoperiod, gibberellin, autonomous and vernalisation pathways, so that it has been proposed as another floral pathway integrator (Yu et al., 2002; Michaels et al., 2003; Liu et al., 2008). agl24 mutants are moderately late flowering, both in LD and SD, so that they are still photoperiodsensitive. The effect of this gene is dosage-dependent, since plants heterozygous for the mutation present an intermediate flowering phenotype (Michaels et al., 2003), and the late flowering degree in plants harboring RNAi against AGL24 depends on the remaining expression level of this gene (Yu et al., 2002). It is expressed in many tissues, but especially in inflorescence meristems, in young floral primordia until stage 2 (Michaels et al., 2003), and in other floral organs (Yu et al., 2002). AGL24 is affected by photoperiod. In co mutants its expression level is decreased compared to wild-type, although not affected in ft mutant (Yu et al., 2002). AGL24, like SOC1, increases in expression during development (Liu et al., 2008), and it is also upregulated upon vernalisation (Yu et al, 2002), although its mrna level is not regulated by FLC (Michaels et al., 2003). Moreover, the late flowering of agl24 is not suppressed by vernalisation, and it is not dependent on FLC (Michaels et al., 2003). SOC1 and AGL24 directly activate each other, and they are mutually dependent. In 35S::SOC1 there is an increase in AGL24 mrna, and in 35S::AGL24 an increase in SOC1 mrna (Yu et al., 2002; Michaels et al., 2003). SOC1 is activated directly by AGL24, as shown by an inducible system, and in agl24 mutants less SOC1 mrna is present at the SAM during floral transition (Liu et al, 2008). Moreover, over-expression of AGL24 with 35S promoter causes early flowering, 22
33 Introduction although soc1 mutation partially suppresses this effect, so that AGL24 should promote flowering in part through SOC1. Similarly, over-expression of SOC1 with 35S promoter is also partially suppressed by agl24 mutation (Yu et al., 2002; Michaels et al., 2003). Indeed, ChIP experiments confirmed that AGL24 binds to SOC1 promoter and that SOC1 binds to AGL24 promoter (Liu et al., 2008). Binding sites in the identified CArG boxes were mutated and proved to be biologically relevant for the transcriptional activation (Liu et al., 2008). Interestingly, GA treatment induces both SOC1 and AGL24, but in agl24 and soc1 mutants the expected up-regulation of SOC1 and AGL24 respectively are abolished (Liu et al, 2008). Moreover, GA does not accelerate flowering on soc1 agl24 double mutant, while it still can accelerate flowering in the single mutants (Liu et al., 2008) LFY as an integrator LFY encodes a plant-specific transcription factor, which does not belong to a gene family (Parcy et al., 1998). It is expressed in young leaf primordia and its mrna increases until a maximum in young floral meristems, gradually under SD condition or more sharply upon shift to LD (Hempel et al., 1997; Blázquez et al., 1997). LFY is a pathway floral integrator, it specifies floral identity and it also promotes determinacy (Weigel et al., 1992). As a floral integrator, a correlation was shown between the number of copies of LFY introduced in Arabidopsis and an effect on acceleration of flowering time (Blázquez et al., 1997). It is activated not only by the photoperiodic pathway, but also by the gibberellin pathway. It has been also shown that regions of LFY promoter that are activated by gibberellins are distinct from the ones that respond to photoperiod (Blázquez and Weigel, 2000). Moreover, recent findings proposed SPL3 to be directly upstream of LFY (Yamaguchi et al., 2009; see paragraph 1.6.3). It was already shown that activation of CO protein through an inducible system driven by 35S promoter leads to rapid up-regulation of LFY (Simon et al., 1996). This effect is probably not direct, and the activation by the photoperiodic pathway is mediated via SOC1 (Lee et al., 2000; Moon et al., 2003; Samach et al., 2000). ChIP analysis showed that SOC1 protein directly binds to the LFY promoter (Liu et al., 2008; Lee et al., 2008). LFY expression level is also reduced in agl24 mutants (Yu et al., 2002), and even in this case, binding of AGL24 protein to the LFY promoter has been proven by ChIP, also in regions that overlap with SOC1 binding sites (Lee et al., 2008). Recently it has been proposed that a physical interaction between SOC1 and AGL24 proteins would be relevant for the direct activation of LFY (Lee et al., 2008b) (Fig. 5, A). SOC1 23
34 Introduction protein expressed in protoplasts was localized in the cytoplasm, while AGL24 protein in the nucleus. When AGL24 was co-transfected with SOC1 in protoplasts, they both co-localized in the nucleus (Lee et al., 2008b). LFY is also activated by gibberellins (Blázquez et al., 1998). In the ga1 mutant, which has dramatic reduction of endogenous GA level, LFY promoter activity is strongly reduced, and treatment with GA 3 restores the activity of LFY (Blázquez et al., 1998). 35S::LFY in ga1 recovers the ability to flower in SD, but does not completely complement for the early flowering phenotype, suggesting that GAs regulate not only LFY expression but also the competence to respond to LFY (Blázquez et al., 1998). Another report proved also GA 4 to be able to induce flowering and to activate LFY promoter (Eriksson et al., 2006). At the same time, a sharp increase of GA 4 was observed during floral transition at the apex. This, together with the fact that the expression of several GA biosynthetic enzymes did not change at the apex, and with some evidence of transport of GA 4 from leaves to apex, suggests that gibberellins may also act as a transported signal (Eriksson et al., 2006). A factor that could mediate the activation of LFY by gibberellins is AtMYB33, a transcriptional activator of a large gene family (Gocal et al., 2001). AtMYB33 has a very similar pattern of expression to the one of LFY in response to GA, and its protein product binds to the LFY promoter in vitro (Gocal et al., 2001) FUL in the floral transition Several functions of the FUL gene have been described. FUL has a key role in carpel and fruit development, since loss of function of this gene largely affects development of the siliques, which fail to elongate (Gu et al., 1998). It has a further role in the floral transition, although the ful mutant has only a very subtle late flowering phenotype, depending on the conditions (Ferrándiz et al., 2000). Finally it has been shown to be involved in some aspects of meristem determinacy (Melzer et al, 2008). The mrna of this gene accumulates in two distinct phases. In the first phase, it is very similar to SOC1, as it is present in inflorescence meristems, where it shows a sharp increase during the floral transition (Mandel and Yanofsky, 1995a; Hempel et al., 1997), and not in flower primordia at stages 1 and 2, while it reappears in stage 3. AP1 represses FUL in stages 1 and 2, since in ap1 mutant FUL is also expressed in those stages (Mandel and Yanofsky, 1995a). In the second phase, it is expressed in the carpel walls, reflecting its function in carpel development (Mandel and Yanofsky, 1995a). FUL is also expressed in cauline leaves, and the ful mutant presents also wider 24
35 Introduction cauline leaves, due to problems in their development and their cellular organization (Gu et al., 1998). FUL and SOC1 induction by LD at the shoot apex is strongly decreased in ft and co mutants (Schmid et al., 2003), delayed in fd mutant and increased in 35S::FD (Wang et al., 2009a). A clearer function for FUL in the floral transition has been uncovered through the use of soc1 ful double mutants (Melzer et al., 2008). Indeed, ful mutation enhances the late flowering of soc1 mutation, and while the single mutants only partially suppress the early flowering of 35S::FT constructs, the double mutant almost completely suppresses the effect of FT over-expression. This suggests that SOC1 and FUL have a redundant and crucial role downstream of FT during the floral transition (Melzer et al., 2008). Unexpectedly, over-expression of FUL causes early flowering not only when it is driven by 35S and FD promoter, but also when SUC2 promoter is used (Wang et al., 2009a). Moreover, ft mutation suppresses the early flowering of SUC2::FUL, suggesting that the early flowering may be caused by an increase in FT mrna, similarly to the cases of SOC1 (Michaels et al., 2005; Searle et al., 2006) and SPL3 (Wang et al., 2009a). However, the major effect of FUL on floral transition seems to be through the meristem, since amir-ful constructs driven by SUC2 promoter have a minor effect on flowering in soc1 mutant, while under the FD promoter they render the soc1 mutant as late flowering as soc1 ful double mutants (Wang et al., 2009a) SPL genes: another chapter in the floral transition? A family of transcription factors that are named SQUAMOSA PROMOTER BINDING PROTEIN- LIKE (SPL) is characterized by the presence of a SBP-box domain (for SQUAMOSA PROMOTER BINDING PROTEIN), and is encoded by 16 genes in Arabidopsis. Among them, 10 members of this family are regulated by mirna156 (Rhoades et al, 2002). This family of genes has been implicated in several processes, particularly plant phase transitions (Cardon et al., 1997; Cardon et al., 1999; Chuck et al., 2007; Schwartz et al., 2008; Wu and Poethig, 2006; Xie et al., 2006). Plants experience several developmental transitions during their life cycle (Bäurle and Dean, 2006; Poethig, 2003). The vegetative phase change is the transition from the juvenile to the adult vegetative stage, and it has to be achieved to undergo the subsequent reproductive phase change (or floral induction), which is the transition from the vegetative to reproductive phase. MicroRNAs mir156 and mir172 play a role in these transitions. mir156 is expressed highly early in development and decreases with time (Wu and Poethig, 2006), while mirna172 shows the opposite trend (Aukerman and Sakai 2003; Jung et al., 2007). Over-expressing mirna156 results 25
36 Introduction in longer expression of juvenile vegetative traits and delay in flowering (Wu and Poethig, 2006; Schwab et al., 2005). Over-expressing mirna172 results in acceleration of flowering (Aukerman and Sakai 2003; Chen 2004; Jung et al., 2007). Some of the targets of these mirnas have also been involved in floral transition. For example, some of the SPL factors whose mrnas are targeted by mirna156, such as SPL3, SPL4, and SPL5, are also involved in the floral transition, since their over-expression results in early flowering, especially when the regions targeted by the mirna are eliminated or mutated (Cardon et al., 1997; Wu and Poethig, 2006). A specific sequence at the 3 UTR of SPL3 mediates translational inhibition of the mirna (Gandikota et al., 2007). These three related genes act downstream of CO and FT at the shoot apex, because they increase in expression upon transfer to LD, but the induction is reduced in the co and ft mutants (Schmid et al., 2003). Recently, a set of reports shed more light on the involvement of the SPLs in the floral transition and into their complex regulation. SPL3 was shown to activate directly the genes LFY, FUL and AP1 (Yamaguchi et al., 2009). Transgenic plants carrying 35S::miR156 showed reduced level of LFY, FUL, and AP1 mrnas, while in 35S::SPL3Δ plants (SPL3 mrna without the mirna target site at the 3 UTR) the expression of LFY, FUL, and in some condition AP1, is increased. Moreover, single loss of function mutations in LFY, FUL, and AP1 were, to different extents and each for different aspects, all partially epistatic to 35S::SPL3Δ (Yamaguchi et al., 2009). ChIP experiments proved direct binding of SPL3 protein to LFY, FUL, and AP1 genomic loci (Yamaguchi et al., 2009). Another report confirmed the same results for SPL3 protein with the FUL gene (Wang et al., 2009a). 35S::SPL4Δ and 35S::SPL5Δ resulted in a similar phenotype, suggesting redundant roles for SPL3-4-5 (Yamaguchi et al., 2009). Surprisingly, SPLs act both in the phloem and in the SAM. Plants carrying FD::MIR156 flower very late, carrying SUC2::MIR156 slightly late, and the combination of the two transgenes cause an additive effect (Wang et al., 2009a). Also the non-targeted version of SPL3 driven by SUC2 or FD promoters causes early flowering. Interestingly, ft mutation suppresses the effect of SPL expressed in the phloem (Wang et al., 2009a). When FD::MIR156 is introduced into the fd mutant, so that LFY and AP1 mrna levels are strongly decreased (Wang et al., 2009a), the resulting phenotype resembles ft lfy, fd lfy and lfy ap1 double mutants (Ruiz-Garcia et al., 1997; Abe et al., 2005; Wigge et al., 2005). SPL9 was shown to be involved, redundantly with SPL15, in the juvenile-to-adult transition, and the loss of function of one of these genes also slightly delays flowering, while spl9 spl15 double 26
37 Introduction mutants enhance this late flowering (Schwartz et al., 2008). SPL9 is expressed stronger in apices exposed to LD, and it is localized at the provascular strands below the meristem and in floral anlagen and early floral primordia (Wang et al., 2008; Wang et al., 2009a). Interestingly, SPL9 still increased during floral transition in ft tsf double mutants, so that in addition to photoperiod, an agedependent pathway independent of photoperiod regulates SPL9 (Wang et al., 2009a). Similarly, the level of SPL3 expression was increased in 35S::FT:GFP plants, but 35S::miR156 was not epistatic to 35S::FT:GFP and 35S::SPL3Δ enhanced its effect, suggesting both a response to FT and another pathway parallel to FT (Yamaguchi et al., 2009). In addition, over-expressing SPL3 accelerates flowering of fd mutants, and FD::MIR156 increases the late flowering of 35S::amiR-FT/TSF (Wang et al., 2009a), so that FD and SPL3 would act also in parallel. Given the redundancy of SPL factors, one of the reports showed that several MADS-box genes, particularly FUL, SOC1 and AGL42 were increased in 35S::MIM156 (a target mimic of mir156), in which SPLs levels are higher, and decreased in 35S::MIR156 (Wang et al., 2009a). While induction of SPL9 by a GR inducible system led to a strong increase of FUL expression, ChIP experiments showed that SPL9 binds to SOC1 and AGL42 loci (Wang et al., 2009a). Recently it was also reported that mir156 acts upstream of mir172 to regulate its expression (Wu et al., 2009). This control is achieved via SPL9 that, redundantly with SPL10, promotes transcription of mir172. Since SPL9 and other SPLs promote mir156 transcription, a negative loop is established, in which the mirnas are positively regulated by the transcription factors they target, which could be a way to keep a certain developmental phase more stable and avoid abrupt changes (Wu et al., 2009). 1.7 The later phase of the floral transition: from inflorescence meristem to floral meristem Floral meristem identity genes Upon integration of the flowering signals, the floral pathway integrators eventually induce a set of genes called floral meristem identity genes, which initiate a developmental patterning program for the generation of floral organs (Long and Barton, 2000). This group comprises the genes LEAFY (LFY), APETALA1 (AP1), CAULIFLOWER (CAL), and to a certain extent also FRUITFULL (FUL) (Blázquez et al., 2006). During the transition to the reproductive phase a reprogramming of the primordia takes place at the apex, and these genes are responsible for establishing a robust network which irreversibly starts to confer floral identity on the meristem. 27
38 Introduction Fig. 5. Transcriptional loops mediating floral commitment. VM: vegetative meristem. IM: inflorescence meristem. FM: floral meristem. See text for details LFY LFY as a floral pathway integrator has been discussed in previous paragraphs. Upon floral transition, this gene has also two essential functions in conferring floral meristem identity and determining floral organ patterning (Weigel et al., 1992), and these two functions are distinct (Parcy et al., 1998). Loss of function of LFY causes conversion of the floral meristem into inflorescence shoots (Schultz and Haughn, 1991; Weigel et al., 1992). Conversely, ectopic expression of LFY causes conversion of the inflorescence meristem into a terminal flower (Weigel and Nilsson, 1995). The mechanism by which LFY determines floral meristem identity and organ patterning is based on the induction of floral homeotic genes. To define floral meristem identity LFY directly activates AP1 and CAULIFLOWER (CAL) (Mandel and Yanofsky, 1995b; Wagner et al., 1999; William et al., 2004). Moreover, LFY activates the gene encoding the homeodomain-zipper transcription factor LATE MERISTEM IDENTITY 1 (LMI1), 28
39 Introduction which is also a positive regulator of CAL, since loss of function of LMI1 in weak lfy alleles reduces CAL expression and enhances the lfy phenotype (Saddic et al., 2006). Both LFY and LMI1 proteins directly bind to the promoter of CAL (William et al., 2004; Saddic et al., 2006) (Fig. 5, B). To define floral patterning, LFY activates genes such as AP3 and AGAMOUS (AG) (Parcy et al., 1998). The activation of AP3 needs UNUSUAL FLORAL ORGANS (UFO) as a co-activator (Parcy et al., 1998), while the activation of AG needs the homeodomain transciption factor WUSCHEL (WUS) as a co-activator (Lenhard et al., 2001; Lohmann et al, 2001) AP1 and CAL AP1 is a floral meristem identity gene which encodes a MADS-box transcription factor. AP1 and CAL are expressed in young flower primordia that rise from the inflorescence meristem, and they act in a redundant way to specify floral meristem identity (Mandel et al., 1992; Kempin et al., 1995). AP1 expression rises later than LFY, and it is an indicator of floral determination (Hempel et al., 1997). CAL is the closest relative of the AP1 gene, and it plays redundant functions with it (Kempin et al., 1995). Loss of AP1 gene causes defects in floral meristem identity and floral organ identity (Irish and Sussex, 1990), while cal mutation does not show a phenotype, but it strongly enhances the ap1 mutation, so that in ap1 cal double mutants the floral meristems are completely transformed into inflorescence meristems, and instead of flowers produce new meristems that re-iterate the pattern (Bowman et al., 1993). Later in development even these structures achieve floral identity. Over-expression of AP1 causes conversion of the inflorescence meristem into a terminal flower (Mandel and Yanofsky, 1995b). AP1 and CAL, which are activated by LFY, also positively regulate LFY (Bowman et al., 1993; Liljegren et al., 1999) creating a feedback loop that establish a stable floral determination (Fig. 5, B) FUL As a floral meristem identity gene, FUL is maybe responsible for the residual floral fate that ap1 cal double mutants eventually show, because ap1 cal ful triple mutants never acquire floral fate, they fail to flower and produce leafy shoots (Ferrándiz et al., 2000). However, it could also be that the up-regulation of FUL in the ap1 background (Mandel and Yanofsky, 1995a) would lead this gene to partially take over the function of the AP1 and CAL in their absence, since these three genes are closely related in terms of sequence (Mandel and Yanofsky, 1995a). Alternatively, FUL could 29
40 Introduction have a function in positively regulating LFY activation, because in the ap1 cal ful triple mutant LFY expression is reduced compared to ap1 cal double mutants, and 35S::LFY partially overcomes the loss of floral determination of the triple mutants (Ferrándiz et al., 2000). Finally, a recent report suggests a new perspective in which SOC1 and FUL affect meristem determinacy (Melzer et al., 2008). The soc1 ful double mutant shows a peculiar inflorescence reversion phenomenon (see Tooke et al., 2005, for a definition), which allows further vegetative growth after flowering, which again proceeds to another flowering phase. This cycle is repeated several times. This behaviour, together with the marked secondary growth and the extreme longevity of these double mutants, resembles the perennial plant life style (Melzer et al., 2008) TFL1 A gene with an opposite role to genes like LFY or AP1, and which conversely specifies inflorescence shoot identity, is TERMINAL FLOWER1 (TFL1). Loss of function of this gene causes the inflorescence shoot to be converted into a floral meristem, with resulting terminal flowers (Shannon and Meeks-Wagner, 1991). TFL1 is expressed in the center of the SAM (Bradley et al., 1997), where it prevents the expression of AP1 and LFY, and consequent termination of the floral meristem (Fig. 5, C). Indeed, the transformation of the inflorescence meristem into a floral meristem in tfl1 mutant is caused by ectopic expression of AP1 and LFY (Weigel et al., 1992; Bowman et al., 1993; Gustafson-Brown et al., 1994; Bradley et al., 1997). Over-expression of TFL1 with 35S promoter causes late flowering, enhanced in SD, by delaying the expression of LFY and AP1, but without a direct block on them (Ratcliffe et al., 1998). In contrast, LFY represses TFL1 (Ratcliffe et al., 1999; Parcy et al., 2002), while AP1 and CAL negatively regulate TFL1 (Liljegren et al., 1999; Ratcliffe et al., 1999). Moreover, TFL1 protein was shown to be mobile, and to spread beyond the site where its mrna is synthesized. A signal from LFY would promote the movement of TFL1 protein, as in lfy mutant the protein localization is restricted similarly to one of the mrna (Conti and Bradley, 2007). TFL1 plays a role also in flowering time as a repressor of the floral transition, since tfl1 mutants are early flowering (Shannon and Meeks-Wagner, 1991; Bradley et al., 1997). However, the two functions in shoot identity and flowering do not seem to be separate, but rather based on a general mechanism this gene employs to regulate the transition at the SAM (Ratcliffe et al., 1998). TFL1 does not encode a transcription factor, but has homology to phosphatidyl ethanolamine- 30
41 Introduction binding proteins (Bradley et al., 1997), like FT. It is quite surprising that, despite the high sequence similarity (about 59% amino acid sequence identity) and almost an identical three-dimensional structure between these proteins (Ahn et al., 2006), they have opposing functions. In one report, an external loop was proposed to be responsible for the antagonistic activity between the two proteins (Ahn et al., 2006). In another report, it has been shown that even a single amino acid is important for their distinct roles, since exchanging this residue between the two proteins results in almost a complete switch between the activities of FT and TFL1 proteins (Hanzawa et al., 2005). This similarity would suggest common biochemical properties and similar molecular function, such as the interaction with the same partners. TFL1 may then interact with FD to compete with FT. However, a recent report suggested that TFL1 protein has a function in the transport of proteins to the protein storage vacuoles, proposing an alternative biochemical function for TFL1 (Sohn et al., 2007) Flower development and the ABC model Flowers in Arabidopsis, as in other eudicots, are composed of four whorls of organs: sepals, petals, stamens and carpels (from the outermost whorl to the center of the flower). The stamens are the male reproductive organs, while the carpels are the female structures that once fertilized will produce the fruit. Genetic studies in Arabidopsis and Antirrhinum majus led to the proposal of a model for flower development called the ABC model (Coen and Meyerowitz, 1991). The combination of the different A, B, and C activities give the specific organs of the flower whorls: A for the sepals, A and B together for the petals, B and C for the stamens and C for the carpels (Krizek and Fletcher, 2005, for a review). The homeotic genes belonging to the ABC functions are all MADS-box genes, except for AP2. In Arabidopsis the A function genes are AP1 and AP2, B function genes AP3 and PISTILLATA (PI), and the C function gene is AGAMOUS (AG). Modifications of the model were included with the discovery of SEPALLATA (SEP) genes, which are necessary for the development of all the four whorls of organs. It has been suggested that A, B, C and SEP proteins act as multimeric complexes to activate downstream genes (Jack, 2001; Theißen and Saedler, 2001, for reviews) Flowering time genes regulate floral patterning AP1 as a transcription factor has an additional role as a repressor, and it was demonstrated that it controls AGL24 (Yu et al., 2004), SVP, SOC1 (Liu et al., 2007) and FUL (Mandel and Yanofsky, 31
42 Introduction 1995a) genes by repressing their transcription in floral meristems. This sort of feedback loop is probably needed to repress these genes in the floral meristem once the floral transition has occurred. At that point reversion to an inflorescence or vegetative meristem must be avoided, and repression of flowering time genes by AP1 is believed to be one of the mechanisms that avoids floral reversion (Fig. 5, A). All these four genes are ectopically expressed in ap1 mutant, and the three genes SVP, AGL24 and SOC1 are down-regulated upon activation of AP1 (Liu et al., 2007; Yu et al., 2004). It has been demonstrated by use of ChIP that AP1 protein binds to cis-regulatory regions of all these three genes (Liu et al., 2007). This, together with the fact that over-expression of SVP (Masiero et al., 2004), AGL24 (Yu et al., 2004), or SOC1 in combination with one of the other two, leads to partial reversion of the floral meristem into inflorescence shoots, and that mutations in SVP, AGL24 or SOC1 alleviates the inflorescence character of the flowers of ap1 mutants, suggests they have a role in inflorescence identity (Liu et al, 2007). However, recently an additional role for AGL24, SVP and SOC1 in floral meristem determination has been hypothesized (Liu et al., 2009a for a review). AGL24 and SVP redundantly control flower meristem identity with AP1 (Gregis et al., 2006; Gregis et al., 2008). After floral transition, AGL24 and SVP proteins, in agreement with the mrna pattern, are localized in floral meristems during stages 1 and 2 of flower development, and disappear at stage 3 (Gregis et al., 2009). AP1-AGL24 and AP1-SVP protein dimers interact with the LUG-SEU co-repressor complex (Gregis et al., 2006), which regulates AG (Sridhar et al., 2004). Indeed, in agl24 svp double mutant, which has a temperature-dependent floral phenotype, the class B and C genes AP3 and AG are deregulated (Gregis et al., 2006), and LUG down-regulation in agl24 svp enhances the floral defects of the double mutant (Gregis et al., 2009). ap1 mutation enhances the floral phenotype of the double mutant, and ap1 svp agl24 triple mutants resemble ap1 cal double mutants (Kempin et al., 1995, Bowman et al., 1993; Gregis et al., 2006). In the triple mutant FUL is up-regulated, and in the ap1 agl24 svp ful quadruple mutants the vegetative characters are increased, so that FUL may take over a function in flower formation in the triple mutant (Gregis et a., 2008). A role for SOC1 has also been proposed in the context of floral development. soc1 agl24 svp triple mutant has more floral defects than the svp agl24 double mutant, so that SOC1, AGL24 and SVP would redundantly regulate flower development (Liu et al., 2009b). However, in agl24 svp double mutant SOC1 is ectopically expressed in floral meristems at stage 1-2 floral development, where it should not be expressed (Gregis et al., 2009), therefore SOC1 could take over a function in the flower when the other two MADS-box genes are missing. In 32
43 Introduction the soc1 agl24 svp triple mutant, class B (AP3 and PI) and C (AG) genes are deregulated (Liu et al., 2009b). By ChIP, both SVP and AP1 proteins has been shown to bind genomic regions of AG, AP3, PI and SEP3 in the same fragments, and AGL24 protein binds when SVP is not present. SOC1 protein binds to AG, AP3 and PI when AGL24 and SVP are not present (Gregis et al., 2009). AGL24, SVP and SOC1 redundantly repress SEP3, which is up-regulated in svp mutant and even more in combinations of double or triple mutants of these genes, depending on the developmental stage (Liu et al., 2009b). In an another report, SVP protein was also shown to bind SEP3 promoter by ChIP, and again AGL24 and SOC1 also bind but only in absence of SVP (Liu et al., 2009b). Interestingly, SVP could recruit TFL2 protein to SEP3 genomic region. The interaction between SVP and TFL2 proteins was detected by yeast two-hybrid, and with other methods in vitro and in vivo (Liu et al., 2009b). Moreover, they bind to the same region of SEP3, and TFL2 binding is decreased in the svp mutant (Liu et al., 2009b). Fig. 6. The cellular structure of the shoot apical meristem. The division in layers (L1, L2 and L3) is depicted on the left side. The division in domains is depicted on the right side. CZ: central zone. PZ: peripheral zone. RZ: rib zone. SC: stem cells. OC: organizing center. 1.8 The shoot apical meristem: balance between stem cell maintainance and organ production Plant meristems are the source of new cells for the plant growth. Almost all the growth of a plant after embryogenesis is due to the action of two apical meristems: the shoot apical meristem (SAM), which is responsible for the formation of the aerial part of the plant, or above-ground part, and the root apical meristem (RAM), which forms the below-ground structures. At the SAM, three layers of cells can be distinguished: the L1, at the very tip of the apex, in which cells only divide in anticlinal plane, gives rise to the epidermis; the L2, in which the cells also divide in anticlinal plane, gives rise to mesophyll cells; the L3, in which the cells divide in more 33
44 Introduction random planes, anticlinally and periclinally, gives rise to the central tissue of the leaf and stem (Fig. 6). Moreover, three zones have been classically described based on functional and cyto-histological point of view: the central zone (CZ), which contains pluripotent stem cells; the peripheral zone (PZ), where the differentiation into lateral organs takes place; the rib zone (RZ), which provides multipotent cells for the differentiating stem that supports the SAM (Fig. 6). The SAM is responsible to keep the balance between a pool of stem cells that are maintained in that state and the production of differentiated tissues incorporated into the organs. The mechanism by which meristems remain undifferentiated is based on a pathway in which the main actors are the gene WUSCHEL (WUS) and the CLAVATA (CLV) family genes (Carles and Fletcher, 2003; Dodsworth, 2009, for a review). The homeodomain transcription factor WUS promotes stem cell production through a non-cell-autonomous signal to activate cell division (Laux et al., 1996). In wus mutants, after formation of a few organs premature termination of the SAM and floral meristem occurs (Laux et al., 1996; Mayer et al., 1998). CLV1, CLV2 and CLV3 genes are components of an extracellular signaling pathway that acts to limit the expansion of the undifferentiated stem cell population in the SAM and floral meristems (Clark, 2001). WUS is expressed in the so-called organizing center (OC) while CLV3 is expressed by the stem cells region (SC) (Fig. 6). WUS activates CLV3, and the CLV pathway represses WUS restricting its expression and therefore negatively regulates stem cell production (Schoof et al, 2000). The result of this loop is a balance in the meristem homeostasis so that the loss of cells going to new organs is counteracted by the gain of new stem cells. SHOOTMERISTEMLESS (STM) is another gene expressed in the SAM that plays a role in maintaining the meristem in an indeterminate state (Long et al., 1996). It acts independently of the WUS/CLV pathway, preventing cell differentiation in the meristem. STM encodes a homeodomain transcription factor, and it is part of the family of KNOX (KNOTTED1-like HOMEOBOX) genes, a group including also KNAT1, KNAT2, and KNAT6, which are also expressed in the SAM and play redundant functions with STM (Carles and Fletcher, 2003; Dodsworth, 2009). The floral transition, which marks the critical passage from vegetative to reproductive phase, and eventually commits the plant to the production of flowers, is reflected in a change in the apical meristem identity (Fig. 7). Initially, the meristem at the shoot apex of a plant functions as a vegetative meristem, which is responsible for the vegetative growth of the plant and produces leaves and shoots. When the decision to flower has been taken, the meristem undergoes the floral transition and becomes an inflorescence meristem, which in turn produces floral meristems. Floral 34
45 Introduction meristems arise on the flanks of the inflorescence meristem, and all the floral organs composing the flowers are ultimately derived from this meristem. In Arabidopsis, both vegetative and inflorescence meristems are indeterminate meristems, which means that they are maintained through a pool of self-renewing cells. Conversely, floral meristems are determinate meristems. They produce flowers, which are predetermined structures, and they eventually terminate the stemcell activity (Sablowski, 2007). Interaction between LFY and the WUS pathway eventually causes termination of the meristem. LFY, together with WUS, activates the floral homeotic gene AGAMOUS (AG) by direct binding to its regulatory sequences (Lenhard et al. 2001; Lohmann et al. 2001; Hong et al. 2003). Upon activation, AG mediates termination of the meristem by repression of WUS, thus blocking indeterminate growth of the floral meristem (Lohmann et al. 2001; Lehnard et al., 2001) (Fig. 5, D). Indeed, WUS is expressed in the floral meristem in early phases, but decreases when AG is activated and disappears when carpel primordia initiate (Mayer et al. 1998). Therefore, in ag mutants WUS is expressed constitutively and a stem cell population is produced in the flower, resulting in continuous production of leaf-like organs (Lenhard et al. 2001; Lohmann et al. 2001). Conversely, wus mutants show premature termination of floral meristems similar to the over-expression phenotype of AG (Laux et al. 1996; Mizukami and Ma 1997; Mayer et al. 1998). Fig. 7. Phase transition at the shoot apical meristem. A schematic representation of the change in identity of the meristem during the floral transition is indicated in the figure. Green color represents vegetative tissues (vegetative meristem and leaves), red color the transition meristem, light blue the floral meristem and dark blue the inflorescence meristem Genomics approaches to study the floral transition The transition from vegetative to reproductive growth is a dramatic change requiring a stepwise reprogramming of the shoot apical meristem. Upon inductive conditions, in a few days a set of 35
46 Introduction molecular events transforms a vegetative meristem into an inflorescence meristem and eventually floral meristems arise. Given the biological importance of this switch, several groups reported studies on global gene expression during the floral transition at the shoot apex. Pioneer work was performed already in the 90s on the plant Sinapis alba (Melzer et al., 1990). At that time microarray technology was not available, and subtraction hybridisation was used to enrich the extracted RNA in transcripts specifically isolated from the shoot apical meristems. cdna libraries from apical meristems before the induction (vegetative), during the transition (inflorescence), and after the transition (floral) were compared. This approach successfully led to the identification of new genes involved in the floral transition in Sinapis (Melzer et al., 1990). More recently (Schmid et al., 2003), a global gene expression study at the shoot apex using microarray analysis focused on the floral transition of Arabidopsis thaliana (both Landsberg and Columbia ecotypes). Expression levels of the whole transcriptome were followed and analysed in plants that were shifted from SD to LD to induce floral transition. Loss of function mutants were included in this study (co, ft, and lfy) and compared to wild-type. These experiments provided a systematic and complete expression dataset for SAM-enriched apices during floral transition. The expression pattern of known genes was largely consistent with previously published data. The only limitation of these experiments was the use of entire shoot apices. Indeed, meristems were isolated using a razor under a microscope, leading to unavoidable contamination by surrounding leaf tissues, so that genes that are expressed in leaves were also analyzed. Moreover, genes expressed at low level in the meristem or in small subsets of it could be diluted in the whole apical tissue, while a highly specific collection of meristem tissue would enhance the sensitivity to detect these genes (Jiao et al., 2009, for an example in leaf cell types) Single cell technology Many techniques are available to collect and work on specific cells, without contamination from the surrounding tissues. In same cases, a level of single cell technology has been reached (Kehr, 2003). Among these approaches Laser Capture Microdissection (LCM) is particularly powerful (Fig. 8). LCM was developed for research in the human and medical field, and the application to plant science followed later (Nelson et al., 2006, for a review). Particularly, some specific features of plant cells have led to the necessity of some modifications, resulting in a further delay. Fortunately, there was a growing interest in recent years for the use of LCM in plants, and there are several reports to which it is possible to refer to set up experiments (Asano et al., 2002; Nakazono et 36
47 Introduction al., 2003; Kerk et al., 2003; Inada and Wildermuth, 2005; Yu et al, 2007). LCM technology allows to collect specific tissues or cell types. With dedicated protocols the tissue material is prepared in order to retrieve nucleic acids or even proteins from the collected tissue. It is then possible to study the presence of specific molecules in the tissue under study. In order to enhance the power of the tissue specificity with the characterization of the global gene profiling of specific tissues or cell types, LCM has been also often coupled to microarray analysis, with very good results in terms of detailed gene expression of several tissues with extraordinary specificity, even in the case of very small and hidden tissues. This has been successful also in the case of plant tissues (Nakazono et al., 2003; Zhang et al., 2007; Jiao et al., 2009), and because in these experiments normally the amount of tissue recovered is very low, special procedures of RNA amplification have been often associated with the RNA extracted from samples processed with LCM. For example, the RNA linear amplification with the T7 polymerase has been shown not to affect relevantly the proportion of the different transcripts, that means that the amplification, defined linear amplification, is balanced (Nygaard and Hovig, 2006; Ginsberg, 2005). So, in the case of critically small amounts of RNA extracted from small tissues, this is normally the best choice so far. Fig. 8. Laser capture microdissection technology. The LMPC (Laser Microdissection optionally coupled to laser Pressure Catapulting) device form P.A.L.M. is shown in panel A. A scheme of how the sample is collected by the use of a catapulting laser beam is shown in panel B. A scheme of the samples adhered to the glass slides that are used for the laser microdissection is shown in panel C. 37
48 Introduction Next-generation-sequencing technologies and gene expression analysis Recently new technologies have been introduced for DNA sequencing. These so-called nextgeneration sequencing methods are based on massive scale DNA sequencing (see Mardis, 2008, for a review). Besides the application for sequencing or re-sequencing genomes, and to reveal the sites where proteins bind to DNA at the genomic level ( Chip-Seq ), these techniques have been successfully applied to sequence cdna derived from RNA samples (also called RNA-Seq ), in order to characterize gene expression at a certain stage and/or in a certain tissue. There are already several variations on this method, and different platforms are available on the market, with features and costs depending on the requirements of the investigator. Two examples are technologies developed by 454 (Margulies et al., 2005) and Illumina (formerly Solexa sequencing) (Bennet et al., 2005). The Illumina Genome Analyzer for example has been used to sequence cdna from different organisms, including plants (Danilevskaya et al., 2008; Peiffer et al., 2008). An example of an application is the so-called MPSS (massively parallel signature sequencing) (Brenner et al., 2000) coupled with Illumina sequencing, which uses nucleotide signatures, and allows the identification of the different transcripts in a cdna library of a given sample. This approach has been used to perform large-scale gene expression analyses in Arabidopsis (Meyers et al., 2004), for example for the floral transcriptome (Peiffer et al., 2008). Methods are being developed to quantify the number of transcripts for all the genes and to compare these numbers in different experiments, giving rise to an alternative to microarray analyses for global comparisons of gene expression (Cloonan et al., 2008; Mortazavi et al., 2008; Marioni et al., 2008). Studies comparing the results from microarray and sequencing platforms confirmed that the two methods are highly comparable, and the general trend of the gene expression data is very similar (Marioni et al., 2008). Nevertheless, sequencing methods have several advantages compared to microarray methods. Indeed, available microarrays do not contain complete transcriptomes, they suffer from artifacts of hybridisation, and they need several replicates (normally 3 replicate series). Sequencing methods allow a complete identification of the genetic material contained in the biological sample, they have no hybridisation artifacts and they do not imply a strict need of technical replicates since the repetition of sequencing has been shown to be extremely reliable (Marioni et al., 2008). Sequencing allows also discrimination of different splicing variants of genes and permits the discovery of new un-annotated genes or the correction of mis-annotated gene models. Moreover, microarray experiments can be very demanding in terms of quantity of RNA to perform hybridisations. Some sequencing technologies require quantities well below one 38
49 Introduction microgram of DNA. Moreover, next-generation sequencing methods open up the possibility to characterize the gene expression profile of other organisms in addition to model species. Indeed, microarrays can be performed only when the corresponding chips are produced, while RNA-Seq can be applied in principle to all organisms, even when the genome sequence is not available Recent genomics studies on SAM Very recently, a series of reports were published in which these new technologies described above were used in various combinations. These studies are applied also to other plants than Arabidopsis, taking advantage of the fact that sequencing technologies are less dependent on fully-sequenced genomes or availability of dedicated microarray chips. Some of these studies using global gene expression analysis are related to the floral transition, or simply to the specific gene expression patterns of the shoot apical meristem. In all cases, other techniques have been used to validate some of the genes identified by these high-throughput analysis, like RT-PCR and in situ hybridisation. In garden pea, cdna libraries specific for the shoot apical meristem were generated, and a microarray has been designed based on these libraries which has been used to compare global gene expression between SAM and non-meristematic tissues (Wong et al., 2008a). In maize, several reports describe how, by means of LCM and amplification of the extracted RNA, shoot apical meristem gene expression has been characterized by microarray. In one case, wild-type and a mutant for a specific homeobox gene have been compared by means of a specifically designed microarray (Zhang et al., 2007). In another one, both microarray analysis and 454 sequencing technology have been used to compare the gene expression between SAM and entire seedlings (Ohtsu et al., 2007). Finally, a global gene expression comparison has been done between two sub-compartments of the SAM, leading to the identification of a novel gene involved in maize shoot and leaf development (Brooks III et al., 2009). Moreover, another group collected SAMs from maize in vegetative and early reproductive stages, compared their gene expression through MPSS, identified two MADS-box genes that were up-regulated upon floral transition, and proved with further experiments the involvement of one of these genes in the floral transition (Danilevskaya et al., 2008). In soybean, two papers report global gene expression analysis of shoot apical meristem using soybean GeneChip microarrays. In one case, a comparison of the global gene expression profile was performed among SAM, non meristematic tissues and axillary meristems (Haerizadeh et al., 2008). In the other one, SAMs were collected before and during the floral transition, induced by shifting 39
50 Introduction the plants from LD to SD (flowering in soybean is induced by SD), and global gene expression analysis has been performed, with the resulting data suggesting a possible role of auxin and abscisic acid in floral induction (Wong et al., 2008b). Altogether, these reports testify that we are gradually moving into a new scenario, in which a global knowledge of the gene expression profiles occurring at the shoot apical meristem will unravel a more complete understanding of the floral transition in plants. 40
51 Introduction OBJECTIVES Flowering is a complex trait and many studies using several different approaches uncovered a large number of genes involved in this process and also a large number of interactions among these genes. From a spatial point of view, leaves perceive the change in photoperiod whereas shoot apical meristems produce flowers, so that these two tissues are responsible for triggering distinct genetic cascades. While most of the mechanisms regulating the gene cascade responding to the photoperiod in the leaves has been elucidated during the past years, the gene cascade which responds early to the florigenic signal at the SAM is less well known. This has been caused by the technical problem of reaching enough specificity to collect only cells from the apical meristems, which limited the study of gene expression on this tissue. We chose two main approaches to characterize the genes involved in the floral transition at the meristem. One approach is to make use of Laser Capture Microdissection (LCM) technique to achieve the spatial tissue specificity on SAM and to avoid contamination of other surrounding tissues. We want to set up a system which allows collection of specifically cells from the SAM, and a protocol to extract RNA out of this tissue and to perform global gene expression analysis to study the gene expression during floral transition induced by photoperiod. This would lead to identification of the genes that show a significant increase or decrease in expression during this process, and new genes that would be likely involved in the switch from the vegetative to the inflorescence meristem. We want to confirm the expression pattern of these genes by means of independent expression studies and then place them in the flowering network using other genetic analysis. The other approach aims at the characterization of SHORT VEGETATIVE PHASE (SVP), a gene involved in repressing the floral transition. Because not too much is known about its spatial regulation, we want to test the hypothesis that SVP has different functions, regulating transcription not only in leaves but also in meristems. Because loss of function of this gene leads to early flowering, we want to find which genes are de-regulated in this mutant and are responsible for the premature floral transition at the SAM, in order to identify the possible direct targets of SVP transcriptional repressor. Finally, analysis of the genetic interactions of SVP with other flowering time genes together with tissue-specific mis-expression studies of this gene will help to clarify and separate the functions of SVP in different tissues and to place it in the flowering network. 41
52 Materials and methods 2. Materials and methods Plant material Plants used in this study were Arabidosis thaliana accession Columbia (Col), or Landsberg erecta (Ler) in some cases where specified in the text. The alleles carrying the mutations for SOC1, CO, FT, TSF, FUL, SVP and TFL1 in Col background were: soc1-2, co-10, ft-10, tsf-1, ful-2, svp-41, svp-31, svp-32, tfl1-18. The alleles carrying the mutations for SOC1, FT, FUL, and SVP in Ler background were: soc1-1, ft-1, ful-1, svp-3. 35S::SVP line in Col background is from Peter Huijser (described in Masiero et al., 2004). 35S::CO:GR line (described in Simon et al, 1996) is in co-2 background (in Ler). Insertion lines from the SALK collection were: SALK_ for the C19 candidate gene; SALK_ for D13 candidate gene. Plants were genotyped using specific primers (see the list of primers in Appendix I). Growth conditions Seeds before the experiments were treated with stratification on soil at 4 C for 3 days in the dark. Plants for the experiments were grown in growth cabinets (unless specified in the greenhouse). Long days (LD) were 16 hours of light and 8 hours of dark, short days (SD) were 8 hours of light and 16 hours of dark. The temperature in the growth cabinet was 18 C. Flowering time measurements Flowering time was scored as number of leaves at the bolting time. The number of rosette leaves was counted until the bolting shoot reached around 1 cm of length. Cauline leaves were counted when they were all visible on the shoot. Formula to calculate the percentage of induction For each population (a distinct genotype or a population with a certain time of vegetative growth in SD) the following formula was used to calculate the degree of induction in the double shift experiments: 42
53 Materials and methods percentage of induction (X) = NSD X NSD NLD x 100 Where NSD is the number of leaves at flowering for the plants in SD, NLD is the number of leaves at flowering for the plants shifted from SD to LD, and X is the number of leaves at flowering of the plants for which the percentage of induction is calculated. NSD, NLD and X are total leaf number (rosette plus cauline leaves), calculated as average of the population grown in the same condition. Vectors and constructs To express the gene products of SVP, FT and D13, their complete coding sequence was specifically amplified from cdna by PCR, using primers with Gateway extensions, and it was inserted into Gateway p201 (for SVP) or p207 (for all the others) pdonr vectors by BP reaction, to generate ENTRY vectors. An ENTRY clone with SVP.2 was already obtained from the REGIA collection in the pdonr. The coding sequence was then inserted into different Gateway pdest vectors by LR reaction. The pdest vectors were: - psuc2 Gateway, with the SUC2 promoter, which carries the resistance for spectinomycin in bacteria and for BASTA in planta. - pknat1 Gateway, derived from pgreen with KNAT1 promoter - pfd Gateway, derived from pgreen with FD promoter - pleela, with Gateway and 35S promoter The last three vectors carry the resistance for Ampicillin in E. coli, for Carbenicillin in Agrobacterium, and for BASTA in planta. For the knock-down constructs using double-strand RNA interference, a region of mrna from the gene of interest (SVP or D13) of around 200 bp was amplified from cdna with specific primers (see List of primers) including Gateway extensions and was cloned into a Gateway p207 DONOR, and then transferred through LR reaction into different pdest vectors derived from pjawohl17- RNAi 2000 containing SUC2, KNAT1, and UFO promoters in the case of SVP, and pjawohl8.2 containing 35S promoter in the case of D13. The 35S vector contains resistance to BASTA while the others to Kanamycin in planta. In this vector the fragment is cloned in two opposite orientations, with an intron in between, in order to create a hairpin loop of a specific region of the gene of interest that triggers the RNA interference processes and silence specifically the target mrna (Ossowski et al., 2008b). 43
54 Materials and methods For artificial microrna (amirna) (Schwab et al., 2006) constructs the MIR319a precursor was engineered replacing the original mir319a with an artificial sequence (21mer) specific for the target genes and the mir319a* with a sequence that pairs to the amirna. The amirna was designed with the WMD tool (Ossowski et al., 2008b), and primers were generated with this tool and used for the site-directed mutagenesis PCR reactions using prs300 plasmid as template. The amirna precursors were then cloned into a Gateway p207 DONOR, and then transferred through LR reaction into the pdest vector pleela containing the 35S promoter. Agrobacterium (strain GV3101 pmp90 RK) was transformed with the various pdest vectors described above. E. coli transformation Use DH5α competent cells. - Add DNA to the cells (aliquot of cells: 50 μl) - put on ice for 30 minutes - 42 C in waterbath for 90 seconds - put on ice for 1-2 minutes - add 400 μl LB medium - put at 37 C in the shaker for 1 hour - spin at 5000g for 2 minutes to collect the cells - discard the supernatant and replace it with 100 μl of fresh LB. Resuspend the pellet - transfer to agar plates (LB+antibiotic) - leave at room temperature until there is no liquid on the plate - incubate 37 C, overnight Agrobacterium transformation (heat shock) Use Agrobacterium GV3101 pmp90 RK, which requires Gentamycin, Rifampicin, Kanamycin antibiotics to be selected. - Use 3-5 μl (500 ng-3 μg) of plasmid in a 2 ml tube. - put DNA in competent cells - mix with the tip of the pipette 44
55 Materials and methods - leave on ice for 30 min - heat shock: 1 minute liquid nitrogen, then 5 min 37 C - add 500 μl of LB - put at 37 C in the shaker for 2 hours - plate on LB agar plates + the 3 antibiotics + antibiotic to select the vector, at 28 C, for 3 days - grow small liquid coltures of the colonies - make glycerol stocks Agrobacterium transformation (electroporation) Use Agrobacterium GV3101 pmp90 RK, which requires Gentamycin, Rifampicin, Kanamycin antibiotics to be selected. - Thaw competent cells on ice (50 μl) - add plasmid DNA (1 μl of E. coli miniprep) to the cells, and mix on ice - transfer to a pre-chilled electroporation cuvette. Use the following conditions: capacitance: 25 μf voltage: 2.4 kv resistance: 200 Ω pulse length: 5 msec - immediately after electroporation, add 1 ml of LB to the cuvette, and transfer the bacterial suspension to a 15 ml culture tube. - incubate for 4 hours at 28 C with gentle agitation - collect the cells by centrifugation, and spread them on LB agar plate containing the 3 antibiotics + antibiotic to select the vector - incubate for 3-4 days at 28 C - grow small liquid coltures of the colonies - make glycerol stocks Plant transformation Plants were transformed with Agrobacterium strain GV3101 pmp90 RK by floral dipping (Clough and Bent, 1998). Plants carrying the transgene were selected in two steps: first either with BASTA or kanamycin, according to the resistance in the vector, and then the insertion of the transgene was checked with specific primers by PCR on genomic DNA extracted from single leaves from the 45
56 Materials and methods independent lines. Finally, the T2 progeny was screened, and only plants segregating 3:1 for the resistance (plants carrying only one single insertion of the transgene) were kept for further analysis. These lines were segregated again in the T3 to select the plant with the insertion in homozygosis. Sample collection and fixation for in situ hybridisation and LCM experiments Seedlings were collected and fixed with 4% (w/v) paraformaldehyde (in PBS, plus 0.1% Tween-20 and 0.1% Triton X-100) for in situ hybridisation or Ethanol:Acetic acid in 3:1 ratio for laser capture. The vials with the samples were continuously kept on ice during the harvesting to preserve the RNA. To allow penetration of the fixative, after collection the tissue was vacuum infiltrated using a pump. The fixative was replaced with a fresh one, and the samples left at 4 C on ice overnight. The following day the fixative was replaced with a stepwise Ethanol: Water series, at 4 C. For in situ hybridisation samples: - 30% Ethanol, 1 hour - 40% Ethanol, 1 hour - 50% Ethanol, 1 hour - 60% Ethanol, 1 hour - 70% Ethanol, 1 hour - 85% Ethanol, over-night - 95% Ethanol, 4 hours - 100% Ethanol, over-night - 100% Ethanol, fresh. For the LCM samples: - 85% Ethanol, 4 hours - 95% Ethanol, 4 hours - 100% Ethanol, over-night - 100% Ethanol, fresh The samples were stored at 4 C in 100% ethanol Embedding and microtome sectioning Samples were stained with eosin (0.1% Eosin Y in 100% Ethanol) prior to embedding in parrafin. Embedding was performed with an automated system, the ASP300 tissue processor (Leica). The machine replaces the solution in which the samples are immersed (100% Ethanol) with liquid wax 46
57 Materials and methods at 60 C through a stepwise procedure. Paraplast Plus (McCormick) was used as embedding wax material. Wax blocks with eosin-stained samples were manually prepared with fresh wax at 60 C, cooled down in water at room temperature, and then stored at 4 C. The embedded plants were sectioned using a rotary microtome (Leitz 1512) at 7 micrometers thickness for in situ hybridisation and 10 micrometers thickness for laser capture. After microtome sectioning the tissue was distended on water on the glass slides, above a heatplate, and once the water was removed the samples were adhered on the slides overnight. Superfrost Plus (from Menzel Gläser) or Histobond (from Marienfeld) glass slides were used for in situ hybridisation, and PALM MembraneSlides (PEN-membrane, 1 mm) from P.A.L.M. were used for LCM. In situ hybridisation Templates for the RNA probes were amplified by PCR using specific primers (see List of primers). For AP1 a plasmid (from Mandel et al., 1992) was used to synthesize a probe of 720bp (map n. 45) For TFL1 the pjam2045 plasmid (map n. K4, in pgem-t) was used to synthesize a probe of 0,5Kb of TFL1. Probe synthesis. Reaction mix: 2.5 μl 10x RNA polymerase buffer, 1 μl RNAse inhibitor, 2.5 μl 5mM ATP, 2.5 μl 5mM GTP, 2.5 μl 5mM CTP, 2.5 μl 1mM DIG-UTP, x μl DNA template (50 ng of PCR product), 1 μl T7 polymerase, dh 2 O to 25 μl. Incubate for 60 min. at 37 C. To stop reaction add 75 μl 1X MS (10mM Tris-HCI ph 7.5, 10mM MgCl 2, 50mM NaCl), 2 μl trna (100 mg/ml), 1 μl DNase (RNase free). Incubate for 10 min. at 37 C. Precipitate with 100 μl 3.8M NH 4 Ac, 600 μl EtOH (ice cold). Leave at -80 C for 15 min. Spin down 15 min. at 4 C at rpm. Wash pellet with 200 μl 70% EtOH (ice cold). Spin again, remove supernate and air dry. Resuspend in 50 μl TE. Tissue pretreatment. Place slides in stainless steel racks and pass through the solutions in the following order: Histoclear 1 (10 ), Histoclear 2 (10 ), 100% ethanol 1 (1 ), 100% ethanol 2 (30 ), 95% ethanol (30 ), 85% ethanol, 0.85% NaCl (30 ), 50% ethanol, 0.85% NaCl (30 ), 30% ethanol, 0.85% NaCl (30 ), 0.85% NaCl (2 ), PBS 1 (2 ), Proteinase K (1μg/ml) in 100 mm Tris ph 8, 50 mm EDTA (30 at 37 C), Glycine 0.2% in PBS (2 ), PBS 1 (2 ), PBS 2 (2 ), 4% paraformaldehyde in PBS (10 ), PBS 2 (2 ), PBS 3 (2 ), acetic anhydride (3 ml in drops) in 0.1M triethanolamine ph 8 (10 ), PBS 3 (2 ), 0.85% saline (2 ). Dehydrate through the ethanol series up to 100% ethanol, wash in fresh 100% ethanol. Hybridization. Prepare hybridization buffer 50% formamide (32 μl per slide with 22 x 50 mm 47
58 Materials and methods coverslip + 8μl probe mix with 50% formamide) for 48 slides: 240 μl 10x salts (3M NaCl, 0.1M Tris-HCl ph 6.8, 0.1M NaPO 4 buffer, 50mM EDTA), 960 μl deionized formamide, 24 μl trna 100 mg/ml, 48 μl 50 x Denhardt s, 160 μl H 2 O, 480 μl 50% dextran sulphate. Vortex the hybridization buffer, spin down and leave at room temperature. Take the slides out of the rack, allow ethanol to evaporate completely. Heat the probe/50% formamide mix for 2 at 95 C, cool on ice and spin down. Mix the probe with hybridization buffer in a 4:1 buffer : probe ratio. Vortex, spin down and leave at room temperature. Draw around sections with a Pap pen and add buffer/probe to slide. Lower coverslip onto slides. The coverslips have to be previously washed 15 minutes in acetone and baked. Place the slides in sealed boxes (kept humid inside) and leave in 50 C waterbath overnight. Washing. Place the slides in wash buffer 0.1 X SSC (15 mm NaCI, 1.5 mm Na 3 Citrate) and let the coverslips to fall from the slides. Incubate at 50 C for 30 in wash buffer. Change wash buffer and incubate for 45 at 50 C. Change wash buffer and incubate for a further 45 at 50 C again. Wash in wash buffer 1 h at 50 C, then in PBS 5 at room temperature. Antibody staining. Incubate the slides for 5 in Buffer 1 (100 mm TRIS-HCl, 150 mm NaCl. Transfer the slides to square Petri dishes, flood with Buffer 2 (0.5% (w/v) blocking reagent in buffer 1) and incubate for 30 on a rocking platform. Incubate for 30 in Buffer 3 (1% BSA, 0.3% Triton X-100 in Buffer 1). Incubate in Buffer 4 (Anti-digoxigenin-AP FAB fragment 1:3000 in Buffer 3) for 1 h 30 on a rocking platform. Wash in Buffer 3 (20 4 times), Buffer 1 (5 ), Buffer 5 (100 mm Tris ph 9.5, 100 mm NaCl, 50mM MgCl 2 ) (5 ). Transfer slides to new Petri dishes and flood with Buffer 6 (150 μg/ml NBT, 75 μg/ml BCIP, 24 μg/ml levamisole, in Buffer 5). Cover the trays with a lid and leave in the dark. Check after 12 hours under a dissecting microscope. Washing and counter staining. To stop the enzyme reaction and to wash off background, put slides back in racks and wash for 30 with: distilled H 2 O, 70% ethanol, 95% ethanol, 100% ethanol, 95% ethanol, 70% ethanol, distilled H 2 O. Time of washes will depend on intensity of signal and background; if the background is high, wash for longer. Wash briefly in distilled H 2 O. Air dry slides, add 3 drops of 50% Glycerol, cover with coverslip and let it dry. Preparation of slides for LCM samples The slides for LCM were treated to remove possible RNase contamination, with dry heat at 180 C for 4 hours. This was followed by UV treatment, by irradiation with UV light at 254 nm for 30 minutes using a cross-linker UV Stratalinker 1800 (Stratagene). This allows a further sterilisation 48
59 Materials and methods and also the membranes to become more hydrophilic. Preparation of slides before LCM To dissolve the paraffin, the slides were exposed to histoclear solvent, and then to a series of ethanol/water solutions with increasing concentration of water: - 100% histoclear, 2 minutes - 100% histoclear, 2 minutes - 100% Ethanol, 1 minute - 96% Ethanol, 1 minute - 70% Ethanol, 1 minute - 50% Ethanol, 1 minute - Water, 1 minute. Let it dry. LCM LMPC (Laser Microdissection optionally coupled to laser Pressure Catapulting) was used, which is modification of the conventional LCM machine. This device is composed by a microscope connected to a computer interface, and a laser beam that can cut the samples that are horizontally stuck on a glass slide. The machine used was HAL 100 model (230 VZ) from P.A.L.M., equipped with "Axiovert 200 M" from Zeiss. Dedicated software directly controls the beam, and enables to draw the shape of the line that the laser will cut. After microdissection of the tissue, a laser catapultsystem can pull the sample into a small collection tube (PALM AdhesiveCaps from P.A.L.M.). Recovery of RNA after laser capture The samples were dissolves from the caps of the collection tubes, to extract the RNA. - Add RLT buffer (from RNeasy kit, Qiagen) + β-mercapto-ethanol (10 μl for 1 ml of buffer), 100 μl each tube. - set the tube upside-down minutes at room temperature - vortex for 10 minutes - spin with microfuge at rcf for 5 minutes - store at -80 C to avoid RNA degradation 49
60 Materials and methods RNA extraction For the samples processed by laser capture the total RNA has been extracted with PicoPure extraction kit (Arcturus). For all the other samples total RNA has been extracted with RNAeasy kit (Qiagen). The procedures were followed according to the manufacturer s manuals. RNA amplification RNA amplification was performed with RiboAmp HS amplification kit (Arcturus). The procedure was followed according to the manufacturer s manual. A general scheme of the procedure is provided in Fig. 16. RNA quality assessment The RNA quality tests were performed with the Agilent 2100 Bioanalyzer (Agilent Technologies). The kit used for the analysis of the RNA samples with the Bioanalyzer was the RNA 6000 Pico Assay (Agilent Technologies). cdna synthesis cdna synthesis was performed with SuperScript II kit (Invitrogen). In the case of the samples processed by laser capture the cdna synthesis was done using the RiboAmp kit where mentioned in the text. PCR The PCR were carried out with the following program: 94 C for 3 min. {94 C for 30 s C (depending on the annealing T of the primers) for 45 seconds 68 C for 30 s min. (depending on the size of the fragment) } repeated cycles (depending on the level of expression of the gene) 68 C for 5 min. 4 C for 10 min. PCR mix: template DNA 3 μl 50
61 Materials and methods primer F (10 μm) primer R (10 μm) dntps (10 mm) Brown Taq buffer (10X) Brown Taq polymerase water 0.5 μl 0.5 μl 0.5 μl 2 μl 0.2 μl 13.3 μl Quantitative real time PCR After total RNA extraction the DNA contamination was removed from the RNA samples with DNAseI treatment (DNaseI from Ambion). A total quantity of 3 μg of RNA per sample was used to synthesize cdna for quantitative real time PCR. The synthesized cdna was diluted to 150 μl with water, and 3 μl were used in the PCR reaction. Amplified products were detected using SyBR green I in a IQ5 (Bio-Rad) thermal cycler. ACTIN2 has been used as a housekeeping gene to normalize the expression of the genes investigated. Buffer for real-time: 10X buffer (from Invitrogen) 1.2 ml MgCl 2 1M 24 μl TRITON X μl SyBR green 19.6 mm (1/10 diluted in TE ph 7.5) 2 μl DNA extraction from plant tissue Genomic DNA was extracted from leaves using a modification of the Edwards method (Edwards et al., 1991). - Place about 20 mg of plant tissue in a tube - freeze it in liquid nitrogen - grind tissue with pellet pestle - add 400 μl of extraction buffer (200 mm TRIS-HCl ph 7.5, 250 mm NaCl, 25 mm EDTA, 0.5% SDS) 51
62 Materials and methods - Vortex for 30 seconds - centrifuge in table-top microfuge for 10 minutes at maximum speed - transfer supernatant to new tube (take around 250 μl) - add 1 volume of ice cold isopropanol and incubate on ice for 5 minutes - centrifuge in table-top microfuge at room temperature for 5 minutes at maximum speed - discard supernatant and dry pellet - add 500 μl of 70% ethanol - centrifuge in table-top microfuge at room temperature for 5 minutes at maximum speed - discard supernatant and dry pellet - resuspend pellet in 100 μl of TE (Tris HCl 10 mm ph 7.5, EDTA 1 mm ph 8) - store at -20 C Use 3 μl for PCR reactions DNA purification from gel DNA for cloning purposes or for synthesizing RNA probes from DNA templates was extracted from agarose gels using Qiaex II gel extraction kit (Qiagen) or Nucleospin extract II kit (Macherey- Nagel). Plasmids purification Plasmids were extracted from bacteria and purified using Nucleospin plasmid kit (Macherey- Nagel). Illumina-Solexa sequencing The sequencing has been performed by FASTERIS Life Sciences (Geneva, Switzerland). The method used for the next-generation sequencing for the samples of replicates A and B was based on genomic sample preparation performed by this company (see Fig. 21). For the samples of replicate C the method used was based on the protocol for mrna-seq transcriptome shotgun sequencing derived from Illumina, as performed by FASTERIS (see Fig. 21). 52
63 Materials and methods Analysis of short-sequence reads from Illumina-Solexa sequencing Trimming and Filtering The data were initially filtered using Seqclean (executable dated ). This program trims matches against user-specified target sequences (here: the primer sequences GACGGCCAGTGAATTGTAATACGACTCACTATAGGGAGATCTGTATGCTGG and CCAGCATACAGATCTCCCTATAGTGAGTCGTATTACAATTCACTGGCCGTC, and the UniVec_Core database (dated ), as well as poly-a tails and ends rich in undetermined bases. After trimming, a read may be trashed entirely for one of 3 reasons: (a) the sequence is shorter than the minimum length specified via the "-l" parameter (here, 30), (b) the percentage of undetermined bases is greater than 3%, and (c) less than 40nt of the sequence is left unmasked by the "dust" low-complexity filter. Mapping the reads Each dataset of reads was converted into a blast database using formatdb. Because interest was in matches to known genes, the TAIR8 cdna collection (TAIR8_cdna_ ) was then compared to the read databases using Megablast (settings: -v b 500 -a 4 -W16 -p 0.6 -e 1 -D3) The initial runs were performed using the (Mega)blast version BLASTN [Nov ]; the last runs were done with BLASTN [Jun ]. Determining raw expression counts of genes (loci) The Megablast output was converted to an expression count by the following 4 steps, in this order: (1) discard a match if its bitscore is 5 or more below the best bitscore that is reached by the respective read (2) discard a match if it is shorter than 20 bp, or if its edit distance (number of gaps + number of mismatches) is 4 or more, or if the match does not start within the first 3 bases of the read (rationale for the last condition: sequencing quality is best at the 5' end, therefore a true match should cover the 5' end) (3) discard all matches involving reads that map to more than a single locus (note that a locus can encompass more than a single transcript (cdna)) (4) for each locus, count the number of different reads that map to it (a single read can map multiple 53
64 Materials and methods times to a locus if the locus has multiple transcripts: yet, the read will be counted only once at this step) The count of step (4) is output as a raw expression count. P-value method for the identification of differentially expressed genes For the identification of the differentially expressed genes based on a p-value, the values were calculated according to the hypergeometrycal distribution (see Marioni et a., 2008), considering the replicates A and B. The method was implemented by Daniela Knoll. In order to be considered as differentially expressed between two time points (here an example between +0LD and +3LD), a gene had to fulfill the following criteria: P Value a0a3 / P value a0b0 0,1 P value (a0a3 / P value (a3b3 0,1 P value (b0b3 / P value (a0b0 0,1 P value (b0b3 / P value (a3b3 0,1 Where, for example, P-value(a0a3) is the p-value calculated for a gene between +0LD in replicate A and +3LD in replicate A ( intra-replicate ), and P-value a0b0 is the p-value calculated for a gene between +0LD in replicate A and +0LD in replicate B ( inter-replicates ). 54
65 Results 3. Global gene expression analysis of the floral transition at the SAM collected by LCM using next-generation sequencing 3.1 Defining the floral transition in Arabidopsis thaliana In order to collect samples of the shoot apical meristem (SAM) in a time course during the floral transition, preliminary experiments were done to define the temporal boundaries of this transition. The initial phase of this process was of most interest, to find which genes act in the early stages of the response to long photoperiods. I did not want to include floral meristems which are produced at the flanks of the inflorescence meristem when the transition is completed, because these primordia trigger another developmental program, and they would represent a contaminating tissue (Fig. 7 for a scheme of the tissues) Shift and double shift experiments to study the floral transition It is possible to induce flowering in Arabidopsis by shifting plants from short days (SD, 8 hours light) to long days (LD, 16 hours light). This approach represents a convenient way to induce flowering in a controlled and synchronized manner. With this approach it is possible to collect samples at the end of the SD period before induction, and then at different days after induction in LD, thereby placing events within a temporal framework. Moreover, double shift experiments were set up, in which plants were grown vegetatively in SD, then shifted transiently to LD, and shifted back to SD, to define the critical number of inductive long days required for the plants to be induced to flower. Arabidopsis from the Columbia ecotype (Col) were grown two weeks in SD, and then divided into 6 groups. 4 groups were each exposed to a different number of LD - in this case 1, 3, 5, or 7 LD - and then shifted back to SD. Another group was shifted from SD to LD and left in LD, as a positive control, and the last group was never shifted to LD, as a negative control. Flowering time was scored (Fig. 9, A). Both 7 LD and 5 LD of induction under these conditions were enough for the plants to be fully induced to flower, and these plants behave like plants shifted to LD permanently in terms of number of leaves produced before flowering. The condition in which a plant is fully induced, and irreversibly undergoes the floral transition, can be defined as floral commitment. Conversely, a transient exposure to 3 LD is not enough to induce a complete induction, but it nevertheless has a significant effect in accelerating flowering. Finally, 1 LD does not have a significant effect on floral induction, since it does not accelerate flowering compared to continuous SD exposure. 55
66 Results Genetic background has a pronounced influence on the results of these experiments. Natural variation in Arabidopsis thaliana is present at the level of responsiveness to photoperiod. It is known that the Landsberg erecta (Ler) accession responds earlier than Col to the floral induction. A previous report showed that in the case of Ler when plants were grown for 2 weeks in SD and shifted transiently to LD they responded already after 3 LD with complete floral induction (Corbesier et al., 2007). Fig. 9. Flowering time scored after double shift experiments. Plants were grown initially in short days (SD) for 2 weeks (Panel A), 3 weeks (Panel B) or 4 weeks (Panel C), shifted to long days (LD, the number of LDs is indicated in the X axis) and then shifted back to SD. Flowering time was scored as number of rosette leaves (RLN) plus number of cauline leaves (CLN). In panel D, experiment with plants initially grown in SD for 1, 2, 3 and 4 weeks are compared. Percentage of induction was calculated with a formula described in the Methods. All the shifts were performed at ZT8. Several other parameters can also be changed, affecting the susceptibility to floral commitment, such as light quality (Hempel et al., 1997; King et al., 2008), a different number of hours of light in the LD or a different amount of time in which the plants are grown in SD before the shift to LD (Corbesier et al., 1996). In fact, there is a developmental process that drives Arabidopsis to flower eventually in SD, so that older plants are more sensitive to floral induction and more responsive to 56
67 Results LD. For example, in the case of Col, for plants that are grown 3 weeks in SD, still 5 LD are necessary to have a complete induction, but also 3 LD are able to induce flowering in some individuals (Fig. 9, B). The fact that some of these plants are not fully induced by 3 LD causes a variation in flowering time that is reflected by the large standard deviation. Moreover, also 1 LD has already an effect in accelerating flowering of 3 week old plants. When plants were grown for 4 weeks in SD, also plants transiently exposed to 3 LD were almost fully induced, as indicated by the number of leaves before bolting, and 1 LD had a strong effect in accelerating flowering (Fig. 9, C). We can define the degree of induction of plants exposed to these double shift experiments, and we can express how much quickly the plant responds to LD depending on how much it grew before in SD, using experimental data. This value was then plotted as percentage of induction following a formula (see Methods) which takes into account the flowering time of the plants in continuous SD, which would have 0% induction, the flowering time of plants shifted from SD permanently to LD, which would have 100% induction, and computes the values of the other treatments based on those two extremes. The plot (Fig. 9, D) shows that the more the plants were grown in SD, the more they rapidly responded to LD induction. This plot is useful to compare how much a plant can be easily induced among different conditions, and how much the time window of the floral transition can be lengthened or shortened depending on the initial growth time in SD. In a previously reported study of global gene expression during floral transition in Arabidopis, plants were grown 4 weeks in SD before induction in LD, both for Col and Ler ecotypes (Schmid et al., 2003). Based on our data, 2 weeks in SD were instead chosen because at this stage plants have not yet started the flowering process, and the time window in which floral induction occurs is longer, allowing a better detection of the temporal activation of the different processes and genes at the SAM In situ hybridisation on marker genes In order to confirm the previous observations based on flowering time and to correlate them with the molecular events occurring at the SAM, in situ hybridisations were performed on wild-type Arabidopsis apices using probes for several flowering time genes. Known genes that can be used as markers were chosen, such as SOC1, SVP, FD and AP1, because they are expressed in meristems and they are associated with early events of the floral transition. Previous reports on the expression of some of these genes upon shifts to LDs in Ler and Col ecotypes (Searle et al., 2006; Wigge et al., 2005; unpublished data from our lab) were used as a guideline for our experiments in Col (Fig. 10). 57
68 Results Plants were grown for 2 weeks in SD and shifted to LD, and samples for in situ hybridisation were collected at +0LD (before the shift), +1LD, +3LD, and +5LD. All the samples were collected eight hours after dawn (ZT8), which is also the time when all the shifts were done. The same experiment was repeated, and the biological replicates showed the same results. As expected, SOC1 mrna is remarkably rapidly up-regulated upon exposure to LD. Before induction no signal was visible for this mrna by in situ hybridisation (Fig. 11, A). SOC1 mrna starts to be clearly detectable already from the first day after induction in LD (Fig. 11, B). After 3 LD the expression level increases even more (Fig. 11, C). Conversely SVP, which encodes a floral repressor, is strongly expressed in SD before induction and then decreases in expression upon LD induction (Fig. 11, D-F). Fig. 10. Collection of the samples for in situ hybridisation and LCM. Panel A: A general guideline for the temporal expression of flowering time genes is given by experiments previously performed on Landsberg erecta ecotype (see text). Panel B: Schematic representation of the results of in situ hybridisations on wild-type Columbia ecotype for flowering time genes that can be used as markers of the floral transition. 58
69 Results Fig. 11. In situ hybridisation of flowering time marker genes at the shoot apices of wild-type Columbia plants. RNA probes were used to detect SOC1 (A, B, C), SVP (D, E, F), FD (G, H, I) and AP1 (J, K, L) mrnas. Plants were grown 2 weeks in SD and collected before induction at ZT8 (+0 LD) (A, D, G, J), after 24 hours (+1 LD) (B, E, H, K) and 72 hours (+3 LD) (C, F, I, L) of induction in LD. Scale bar is 50 μm. In the case of FD, there is strong expression all along the time course, as observed previously (Fig. 11, G-I). Following the current model, this suggests that when FT protein reaches the SAM it can 59
70 Results immediately interact with FD protein and activate the floral transition. Moreover, there is a small change in the expression pattern of FD during the floral transition. In terms of level of expression, although difficult to quantify, it seems that there is a reproducible increase in FD mrna, as also reported previously (Wigge et al., 2005; Searle et al., 2006). Also the spatial pattern changes so that additional spots of strong expression appear in a region on the flanks of the SAM that is physically separated from it. Plants grown two weeks in SD do not show AP1 expression, and the same happens when they are shifted to LD after 1 and 3 LD of induction (Fig. 11, J-L). After 5 LD of induction AP1 mrna is clearly induced in the floral primordia, marking the beginning of floral development (see later, and Fig. 14, C). This correlates with the meristem being committed to flower at that stage, as demonstrated by the flowering time data of the double shift experiments (see above) and suggesting that the floral transition cannot be reverted once floral primordia are already present at the flanks of the SAM and AP1 is induced. Based on the results of in situ hybridisations and flowering time data of the double shift experiment, three time points were chosen for the global gene expression studies: two weeks SD + 0 LD (+0LD), two weeks SD + 1 LD (+1LD), and two weeks SD + 3 LD (+3LD). The first time point represents plants before photoperiodic induction; the second time point was included because although one transient LD does not affect flowering time it has been shown that SOC1 is already up-regulated as a first marker of molecular events connected to floral induction; the third time point corresponds to the condition in which the meristem has progressed to flowering but without floral meristems present in the apical tissue. For the gene expression analysis seedlings were collected in the same experiment in which samples were collected and tested by in situ hybridisation. This already provided a control test for the stage in which the material used for LCM was collected Double shift experiments to link expression of flowering time genes to floral commitment As it has been shown previously, when plants are shifted from SD to LD a set of genes changes expression level and pattern, at specific times and in specific places, and this is linked to molecular events triggering the floral transition at the SAM (Schmid et al., 2003; Searle et al., 2006; Wigge et al., 2005). Nevertheless, the expression response of these genes once the plants are shifted back to SD is not known. Presumably, this will depend not only on the specific function that each gene has in relation to the floral commitment, but also on how many days of induction in LD are given to the plants before shifting them back to SD, since different degrees of induction have a different 60

71 Results consequence in terms of flowering time and floral commitment. A similar experiment was reported for FT gene expression in leaves, in which it has been shown that upon shift from SD to LD FT is turned on immediately and its expression increases with progressive exposure to LD. When plants are shifted back to SD the level of FT expression drops again to the typical basal level of SD condition (Corbesier et al., 2007). The authors concluded that once the floral commitment has been reached, FT expression is not required any longer, as flower development occurs in SD when FT is not expressed. Fig. 12. Collection of samples for in situ hybridisation in double shift experiments. Shifts in photoperiod are represented in the figure. The red arrow represents the shift from SD to LD, the blue arrows shifts from LD to SD. + indicates 8 hours after dawn (ZT8). Here, the focus is on the events which act downstream of FT, in the SAM. Therefore a time course was set up and samples were collected for in in situ hybridisation at different time points. Wild-type Columbia plants were grown for two weeks in SD, then transferred to LD for 1 LD, 3 LD, and 5 LD and seedlings were collected. Plants were then transferred back to SD and seedlings collected after 1 SD, 2 SD, 3 SD, 4 SD, 5 SD (see Fig. 12 for a scheme). Treated plants were given specific names so that for example a plant that is exposed to 3 LD of induction and then shifted back to SD for 2 days is named 3LD 2SD. A not induced control, 0LD 0SD, was also included. ZT8 was used as a reference point both for the time of the shifts and for time of collection of the seedlings. The analysis focused on the early part after the induction, represented by not more than 8 total days (LD+SD) after the first shift. Shoot apices from these plants were hybridised with different RNA 61
72 Results probes. In situ hybridisation on a complete time course with probes for SOC1, FUL and SVP was carried out and it was also repeated. Additionally, some samples were hybridised with probes for AGL24, AP1 and FD. It was not always easy to quantify changes in gene expression among different samples from this kind of experiment, because of small variations in individual plants, and because this technique has a limited power of quantification, especially when the signal is weak or weakly changed. Nevertheless, it is possible to observe a clear general trend in expression for the genes examined. In situ hybridisation using SOC1 probe (Fig. 13, A) confirmed that the mrna of this gene is upregulated at the SAM in response to LD and that the signal increases with the number of LD. When the plants are shifted back to SD the level of SOC1 mrna slowly decreases, regardless of the number of LD to which the plants were exposed and of the degree of induction of this gene. This is particularly evident in the 3 LD and in the 5 LD samples. Hence, although 3 LD and 5 LD represent not-committed and fully-committed meristems respectively, SOC1 expression pattern follows the same decrease after return to SD. We can conclude that SOC1 expression quickly responds not only to shifts in photoperiod from SD to LD but also from LD to SD, and that flowering could occur independently of the level of expression of SOC1 once the meristem is committed to flower. Also, SOC1 level of expression at the SAM follows the level of FT in the leaf (Corbesier et al., 2007). The same time course was hybridised with a probe for another MADS box gene, FUL. This gene was chosen because its mrna expression pattern during photoperiodic induction is similar to the one of SOC1 and these genes are partially redundant in promoting the response to LD (Hempel et al., 1997; Melzer et al., 2008). In our experimental conditions FUL expression is activated upon photoperiodic induction by LD, and its expression increases with the number of LD, similar to SOC1 (Fig. 13, B). FUL expression also drops when plants are shifted back to SD after exposure to 1 LD or 3 LD, but after 5 LD its induction becomes stable, even if the plants are shifted back to SD. So, in contrast to SOC1, the expression of FUL is stably maintained once the meristem is committed to flowering. Fig. 13. (next page) Expression of flowering time genes at apices of wild-type plants during double shift experiments. In situ hybridisation was used to follow the expression of genes related to floral commitment at the SAM. RNA probes were used to detect SOC1 (panel A), FUL (panel B) and SVP (panel C) mrnas. Plants were initially grown for 2 weeks in SD. The number of LD and subsequent SD to which they were exposed before the sampling are indicated in the figure for each sample. Scale bar is 50 μm, and magnification same for all panels. 62
73 Results 63
74 Results Fig. 14. Expression of flowering time genes at apices of wild-type plants during double shift experiments. In situ hybridisation was used to follow the expression of genes related to floral commitment at the SAM. RNA probes were used to detect AGL24 (panel A), SVP (panel B), AP1 (panel C) and FD (panel D) mrnas. Plants were initially grown for 2 weeks in SD. The number of LD and subsequent SD to which they were exposed before the sampling are indicated in the figure for each sample. Scale bar is 50 μm, and magnification same for all panels. 64
75 Results The expression pattern of SVP, another marker of the floral transition, was also examined. In our experimental condition the expression of this MADS-box gene before LD exposure is very strong and broad in the whole SAM, while it decreases in the centre of the inflorescence meristem with progressive induction by LD (Fig. 13, C). This is in agreement with the role of this gene as a floral repressor. As it has also been shown previously (Hartmann et al., 2000), SVP is also strongly expressed in the floral primordia once they arise from the inflorescence meristem, after the transition. When plants induced by 1 LD or 3 LD are shifted back to SD the general level of expression of SVP does not dramatically decrease or increase, but seems to remain stable. After 5 LD of induction SVP expression clearly decreases, and does not rise again after shifting the plants to SD. This may indicate that after 5 LD floral commitment has been achieved, so that SVP mrna and its floral repressing function are reduced, while after 3 LD, in which the floral commitment has not been completed, SVP mrna is still expressed enough to prevent floral transition. The closest SVP homologous gene is AGL24. The expression pattern of this MADS-box gene in our experimental conditions was not very clear (Fig. 14, A). AGL24 mrna seemed to be expressed both before and after shift from SD to LD, although in LD it appeared to get stronger in intensity and broader in terms of spatial distribution. Compared to SVP mrna in the same condition (Fig. 14, B), it shows an overlapping pattern in the stages before and after the transition, while it has more a complementary pattern at the moment of floral commitment. This could be due to the proteins produced by these two genes physically interacting in certain developmental stages, while in others they have an opposite role (Gregis et al., 2006; Gregis et al., 2008; Liu et al., 2009). In situ hybridisation using AP1 probe showed that after 5 LD this gene is strongly expressed, confirming that the meristem is committed to flowering (Fig. 14, C). Even if the plant is shifted back to SD AP1 remains strongly expressed. Finally FD, a gene that marks the competence of the meristem to receive the flowering signal (through interaction of FD with FT), is strongly expressed already after 3 LD when the meristem is not fully committed, and this is maintained when the plant is shifted back to SD (Fig. 14, D), leading to the conclusion that these shifts probably do not have much effect on the expression of the FD gene. 3.2 Laser microdissection of shoot apical meristems Calculation of the material needed and choice of the techniques Before starting the experiment, a calculation of the amount of material needed was done, in order to have a reasonable estimation of the number of plants to sample for each time point. Based on the 65
76 Results expected number of cells in an average SAM, and on the quantity of RNA needed for analyzing global gene expression, the quantity of plants to be collected and dissected by laser capture microdissection (LCM) was calculated (see Fig. 15). Initially, a microarray chip experiment was planned for the global analysis of gene expression, which would need high quantities of highquality RNA. So the calculations were based on these requirements. Fig. 15. Scheme of the general strategy followed to collect the samples for LCM. Apices from wild-type Col were collected and fixed according to LCM procedures indicated in the text. The amount of samples for LCM was estimated before the collection (see text for details). The experiment was done three times, and the samples were used as three independent biological replicates of the same experiment. The SAM of Arabidopsis is very small (SAM diameter is about 50 micrometers for two-weeks old seedlings grown in SD, and almost double that after three long days of induction); thus not only many samples had to be laser-dissected, but also a step of RNA amplification had to be included, because of the low quantity of the starting material. To amplify the RNA extracted from SAM 66
77 Results tissue the so-called linear RNA amplification (based on T7 polymerase, with two rounds of amplification) was chosen (see Fig. 16 for a scheme, and Methods; Ginsberg, 2005). Fig. 16. RNA amplification process. This method performs RNA amplification of either one or two rounds, depending on the amount of the starting material. It is based on the use of a T7 RNA polymerase. It requires total RNA as input and generates amplified RNA (arna), which is the reverse complement of the mrna. The quantity of RNA required for an Affymetrix chip hybridisation is around 15 micrograms for each sample. Since the amplification step can give a yield ranging from one thousand to one million fold amplification, and the process starts with total RNA but specifically amplifies only the mrna, it was estimated that before the RNA amplification step 5-50 ng of total RNA was required. If an average shoot apical meristem of Arabidopsis is composed of around cells, the RNA contained should be around pg (for the calculations refer to: Nakazono et al., 2003; Kerk et al., 2003; Nygaard and Hovig, 2006; Ginsberg, 2005). Therefore, meristems from about 50 plants are needed for each time point, which consists of a total of around 2500 cells. This number, 67
78 Results compared with other experiments in the literature, seems to be more than sufficient for our purpose (Nakazono et al., 2003; Kerk et al., 2003). All of these calculations are obviously approximate, but they are important in providing a rough indication of the amount of material required. A. thaliana Columbia wild type plants were grown for two weeks in SD, after +0 LD, +1 LD and +3 LD of induction samples were collected (see Fig. 15) at ZT8 (see Fig. 10, B). In order to have independent biological replicates, the experiment was done in triplicate, in controlled conditions in growth chambers. For each replicate about 100 plants per time point were collected, 70 for LCM and 30 for in situ hybridisation. Apices from the seedlings were fixed and embedded in wax blocks, and sectioned with microtome Optimization of the protocol Before processing the meristem material, tests were carried out with other tissues, to set up and optimize the conditions for the LCM, RNA extraction, and the RNA amplification. To prevent the risk of compromising the valuable meristem material, some of the following trials were made with another tissue that was easier to collect. This permitted optimisation of the protocol for later procedure on the RNA and gave useful guidelines of how to proceed with the meristem samples. Therefore circular leaf discs were collected by LCM from the glass slides, both from young and mature leaves (Fig 17, A). Leaf tissue has different features than the meristematic tissue, which is composed of less differentiated cells that are smaller and more transcriptionally active. Leaf cells are less compact, due to larger vacuoles, and generally less rich in RNA, especially if compared with the meristems undergoing the floral transition. So, different quantities of leaf discs that could reasonably resemble the quantity of cells of the meristem samples were collected. Once leaf tissue was collected by LCM the RNA was extracted both with the RLT buffer of RNeasy kit (from Qiagen) and with the XB extraction buffer of Picopure kit (from Arcturus) and the RNA was purified both with the Qiagen and Arcturus kit (see Methods). To test the RNA extracted, it was converted into cdna and RT-PCR was performed. Primers for TUBULIN were tested. With RNA extracted from 100 leaf discs no PCR product was visible on agarose gel after RT-PCR, but with RNA from 300 leaf discs a weak band appeared on the gel, which was more visible using 40 cycles in the PCR reaction instead of 35 (Fig. 17, B). The best yield of RNA estimated from the results of the RT-PCRs resulted from the RLT buffer from Qiagen as extraction buffer with the PicoPure kit from Arcturus. 68
79 Results Fig. 17. Laser microdissection, RNA extraction and RNA amplification on a test tissue. Panel A: Circular leaf discs from Arabidopsis leaves were collected by laser microdissection on sectioned apices, and RNA extracted from the recovered tissue. Panel B and C: cdna was produced from RNA, and it was tested with primers for TUBULIN. Panel B: Different buffers were compared. XB1 and XB2 : RNA extracted with XB buffer. RLT1 and RLT2 : RNA extracted with RLT buffer. XB1/RLT1 and XB2/RLT2 were collected in two independent experiments, and the second ones were then diluted 50% more compared to the first ones. Control was cdna produced from high-amount RNA extracted with traditional methods. Water was used as a negative control. Panel C: Two different systems for the collection of the tissue catapulted from the laser beam were compared. Buffer : tissue collected on the RLT buffer. Dry : tissue collected directly on the matrix of the tube. Water : negative control with water. Panel D: Bioanalyzer analysis of the RNA that was extracted from leaf discs and then amplified with two-rounds of RNA amplification. Two different methods for collecting the material catapulted from the slide by the laser into the collection tube were also tested. The classical method which employs special tubes from P.A.L.M., equipped with a matrix to which the tissue adheres, was compared to another method using normal tubes with the cap filled with RLT buffer where the tissue is catapulted. 300 leaf discs were collected with each of the two methods. RNA was extracted and converted into cdna, and RT-PCR showed that the first method seems to give a better yield (Fig. 17, C). Therefore the classical method was used for the rest of the subsequent experiments. Then RNA linear amplification was performed on RNA extracted from 200 leaf discs using the RNA amplification method (See Fig. 16 and Methods). The RNA quantity after the first round of amplification was micrograms, while after the second round it was 4.59 micrograms. The overall quality of the RNA was assessed by analysis with the Agilent Bioanalyzer (Fig. 17, D). The quantity was similar to that estimated above, and the quality was good in terms of RNA integrity. The second round gave an amplification of about 5.7 fold. The fold of amplification for the first 69
80 Results round could not be estimated because the quantity of the initial RNA before the amplification could not be measured due to its low concentration. Nevertheless, considering that the final amount is composed of only amplified mrna, and that the initial material consisted of a few hundreds cells, we can conclude that this technique allows a useful amplification in mrna quantity Collection of the SAMs Once sure of the yields and quality of the amplified RNA, the meristem samples were processed in the same way explained above. Making use of LCM, shoot apical meristems were collected from plants harvested in the time course described above, in order to proceed afterwards with RNA extraction. All the meristems were pooled in a total of 9 samples (+0LD, +1LD and +3LD, in triplicates A, B and C). A set of pictures of apices from the three time points before and after the capture of the meristems, demonstrate that the laser was able to cut out precisely the area of the whole meristem dome, avoiding the surrounding tissues, and especially leaf vasculature that is important not to take in this case (Fig. 18). It was checked by visual inspection with the microscope that most of the meristems were really catapulted in the cap of the LCM collection tubes RNA extraction from the captured material and RNA amplification For each of the 9 samples the total RNA was extracted and two rounds of RNA amplification were performed on it. The RNA extractions and amplifications were carried out at three separate times for the three biological replicates. The resultant yields were in the range of 3-60 micrograms of amplified RNA (arna) depending on the sample (see Table 1). Remarkably, the quantity of RNA obtained was directly related to the level of floral induction, which probably reflects the larger size of florally-induced meristems. Indeed, in the case of replicates A and B, the second time point produced around double the amount of RNA of the first one, and the third time point produced around double the amount of the second one. Floral induction led to a visible growth of the meristem dome (Fig. 11, Fig. 18), resulting in both a larger area captured with the LCM and a higher number of sections captured per plant sample (about 2-4 sections for the +0LD, 4-6 for +1LD, and 6-9 for the +3LD). In addition to this increase in size, floral induction might contribute to a generally higher production of mrna in the later meristems. 70
81 Results Fig. 18. Laser microdissection on shoot apical meristems. Apices of wild-type Columbia, which were sectioned and fixed on glass slides for LCM, are shown. Each sample is shown on the left before (A, C and E) and on the right after (B, D, and F) laser capture of the meristem. Samples shown were collected after 2 weeks in SD (A and B), and then shifted to LD for 1 LD (C and D) or 3 LD (E and F). Magnification: 20X. 71
82 Results Table 1. RNA derived from the meristem collected by LCM and material used for the sequencing. Time points are from plants grown 2 weeks in SD and the collected at +0LD, +1LD or +3LD, as indicated in the table. RNA after amplification is arna. RNA for sequencing is the quantity of RNA used to prepare the cdna sent for sequencing (replicates A and B) or the quantity of RNA sent directly for the RNA-seq protocol to Fasteris (replicate C). DNA for sequencing is the quantity of DNA sent to make the library for the Solexa sequencing. In the case of replicate C, the yields are slightly different than replicates A and B, because less material was collected for the larger meristems and more material for the smallest, in order to try to compensate for the different sizes of the meristems. The quality of the arna was assessed using the Agilent Bioanalyzer. Also for this case, the distribution of transcript sizes demonstrates that the material is of an overall good quality (for replicate A and B, see Fig. 19), with only little RNA degradation, as for the leaf discs. Moreover, the size of the RNA molecules is in the range expected for mrna transcripts in Arabidopsis, where the average transcript is around 1500 bp (The Arabidopsis genome initiative, 2000) Single strand cdna synthesis to test the RNA extracted from the meristems Another method to assess the quality of the RNA is to check for the expression of some control genes by RT-PCR. Before proceeding to sequencing, some samples were tested in this way. Initially part of one of the arna samples (1,6 μg of RNA from induced +3LD, replicate B) was used to produce single stranded cdna, using random primers. Random primers were used to prime the retro-transcription because the arna is a so-called crna, in other words the complementary strand of mrna, which lacks the usual polya (Fig. 16). RT-PCR was performed on this cdna with 72
83 Results primers for various genes, such as ACTIN, TUBULIN, FD, and SOC1. At first no PCR products were obtained, although this sample was produced by amplification and would be expected to contain cdna from each of these genes. Also, a weak band (for TUBULIN) was obtained even from RNA before amplification, so the amplified RNA should give more product. However, the linear RNA amplification tends to shorten the RNA products in comparison with the initial templates, especially at the 5 -end (Fig. 16). After another subsequent cdna synthesis with random primers, probably the fragments are even shorter. In this condition the primers for the PCR might have few DNA molecules long enough to anneal to primers at each end of the cdna on the entire sequence. So, instead of primers that amplify a product of around 500 bp, primers for products of about 200 bp were introduced in the reaction. With these new primers, specific PCR products were obtained both for ACTIN and SOC1 cdna (see Fig. 20, A). This experiment therefore confirmed that the amplified cdna after LCM did contain cdnas of genes induced in expression during floral induction. Fig. 19. Analysis of the RNA amplified from shoot apical meristems collected by laser microdissection. The outputs from Agilent BioAnalyzer from all the samples of replicates A and B were combined in a single graph, which includes the RNA ladder to easily compare the distribution of the size of the RNA molecules within the samples. Migration time is a function of the size of the molecule, fluorescence indicates the quantity of RNA for a particular size. 1: replicate A, + 0 LD. 2: replicate A, + 1 LD. 3: replicate A, + 3 LD. 4: replicate B, + 0 LD. 5: replicate B, + 1 LD. 6: replicate B, + 3 LD. 73
84 Results Fig. 20. Amplification of cdna derived from the meristem samples collected by laser microdissection. RT-PCR was performed on cdna produced from amplified RNA extracted from the shoot apical meristems. A: material from replicate B. B: material from replicate A. C: material from replicate C. Control was cdna produced from a highamount of RNA extracted from seedlings without laser microdissection Double strand cdna synthesis for sequencing Some difficulty was encountered in using the RNA extracted from the meristem by LCM to successfully hybridise Affymetrix Arabidopsis microarrays. Although several attempts were made and quality controls were performed in several steps, no signal was detected upon hybridisation of the labelled RNA on Affymetrix microarray (data not shown). An alternative option to microarray hybridisation was based on next-generation sequencing technology. Short tags of DNA molecules derived from the cdna of each time point separately, can be massively sequenced using Illumina-Solexa sequencing technology. Identifying which transcripts correspond to the short tags and counting how many times they occur in the sample, would give an output which is conceptually similar to a microarray expression profile. This technique has the advantage that a huge number of the molecules that are present in the sample are 74
85 Results sequenced, with higher sensitivity compared to microarray technology and without the problems connected to hybridisation of nucleic acids (Wilhelm and Landry, 2009; Wang et al., 2009c). Moreover, whereas in the Affymetrix ATH1 array some genes of Arabidopsis are missing, by means of the sequencing method virtually all the expressed genes can be monitored. Hence, the amplified RNA was used to produce DNA that can be sequenced through nextgeneration sequencing technology. The amplified RNA samples from meristems were converted into cdna and then into double stranded DNA which is suitable for sequencing. Two different methods were used depending on the samples. For the replicates A and B (in total 6 samples) the arna was used for the synthesis of double stranded DNA. This was performed using part of the second round of RNA amplification, without subsequent in vitro transcription (Fig. 16). In the case of A and B, μg of arna were used to produce DNA (Table 1). The quality of the DNA was tested by RT-PCR using primers for ACTIN and SOC1 on the samples +0LD and +3LD, replicate A. The cdnas of these genes could clearly be detected in both samples, and the abundance of SOC1 cdna appeared higher in the +3 LD sample (Fig 20, B). A quantity of µg of cdna for each time point (Table 1), for a total of 6 samples (+0LD, +1LD and +3LD biological replicate A, and +0LD, +1LD and +3LD biological replicate B) was used for sequencing by the Illumina/Solexa method ( Genomic sample preparation, Fig. 21, A and Methods). Fig. 21. Methods to prepare the libraries used for transcriptome profiling of the meristem by next-generation sequencing. The protocol was followed by the company Fasteris, for replicates A and B (Panel A) and replicate C (Panel B). The sequencing technology used was Solexa-Illumina. 75
86 Results For replicate C (in total 3 samples), the RNA was sent directly to FASTERIS (Table 1), where it was converted into double-stranded cdna and sequenced with the protocol for mrna-seq transcriptome shotgun sequencing derived from Illumina (see Methods) (Fig. 21, B). For replicate C, the quality of the RNA was previously checked by Bioanalyzer (data not shown), and by RTPCR on cdna derived from this RNA. The expression of SOC1 appeared to increase upon exposure to LD (Fig. 20, C). Table 2. Data from the Solexa sequencing and mapping of the reads. Time points are from plants grown 2 weeks in SD and then collected at +0LD, +1LD or +3LD, as indicated in the table, for the three biological replicates. Raw sequences were received from Fasteris, and then analyzed. I and II in brackets refer to samples that were sequenced twice, and indicate first and second sequencing run, respectively. These reads were pooled in order to have a larger single dataset for each biological sample. f and r refer to the samples that were sequenced by paired-end method, and indicate the forward and the reverse strands respectively. 76
87 Results 3.3 Next-generation sequencing for gene expression analysis in the SAM Deep sequencing with Illumina-Solexa and mapping of the short-sequence reads The cdna obtained was sequenced with Solexa sequencing technology (Illumina, Genome Analyzer I and II). Short tag sequences were obtained as 35 base pair long reads. Each of the sequences was provided with another string which codes the quality scores for the relative sequence in each single position. A variable number of several millions of tags were obtained from the different samples (Table 2). Ulrike Göbel, Daniela Knoll and Heiko Schoof at MPIPZ analyzed the raw data and converted them into a measure of gene expression for all the Arabidopsis transcripts. A brief scheme of the procedure used is indicated in Fig. 22. A first filtering of the sequences was performed with SeqClean, a tool that removes vector sequences and some of the low quality sequences. Additionally, a large number of sequences were discarded because they corresponded to T7 polymerase primer sequence. Indeed, T7 polymerase primers were used during the RNA amplification procedure to prime the in vitro transcription (Fig. 16). For replicates A and B this occurred because the double-strand cdna that was sequenced was produced with the kit for the RNA amplification, which includes the primers of the T7 promoter which are incorporated into the DNA sequences. These reads might correspond to primers that were not incorporated into cdna or to transcripts that were sequenced from the starting point at the 3 end where the primer sequence is present. Because the cdna synthesis and especially the two rounds of RNA amplification tend to shorten the fragments (Fig. 16), many cdnas may be relatively small and therefore not produce many fragments after the cdna fragmentation prior to sequencing. In this case many of these fragments would contain the primer at the beginning. It would then be highly probable to sequence these type of fragments, and because of the short length of the Solexa reads, only the primer sequence would be obtained. Removal of the primer sequences caused a loss of around 50 percent in the number of sequences present in replicates A and B. In replicate C, this problem was avoided by producing the doublestranded cdna directly from the amplified RNA by another method (Fig. 21, B). This resulted in a larger number of cdna sequences for replicate C. In addition, more sequences were retrieved from this last replicate compared to A and B because of the use of an improved Illumina Sequencer, resulting in a generally higher number of reads. Moreover, for replicate C paired-end sequencing was used, where each transcript is sequenced both from the 5 and 3 end. This method increased the quality of the data, because it helped to assign the corresponding gene to each cdna, reducing 77
88 Results the number of ambiguities (Fullwood et al., 2009). The remaining valid sequences were blasted against the Arabidopsis transcriptome (TAIR8 cdna collection) with MEGABLAST (Altschul et al., 1997; Zhang et al., 2000), as described in Methods. During this process many sequences could not be assigned to any transcript and were removed from the analysis (Table 2). The origin of these non-aligned sequences could be due to poor sequence quality, contamination of DNA or artifacts created during the amplification process. Microarray hybridisation of RNA amplified by linear amplification showed reliable results in previous studies (Nygaard and Hovig, 2006), but there are not so far reports in the literature on RNA amplification procedures coupled with Solexa sequencing. So the amplification procedure could have affected the sequences, introducing for example point mutations. On the other hand, a large number of invalid tag sequences have been reported even with more conventional RNA preparations that do not involve amplification (Marioni et al., 2008). Fig. 22. Flow chart of the procedure used to analyze the short-sequence reads from Solexa sequencing. Blue boxes represent procedures, yellow boxes represent samples and data. Red boxes are the initial input and the final output of the analysis. Details are in the Methods section. 78
89 Results Each of the reads remaining after the filtering processes were assigned to a gene. Only the reads that match a unique transcript were considered, while the ones matching more than one possible transcript, called promiscuous tags, were discarded and not included in these first analyses. The coverage of the expressed genes detected was evaluated for each sample, as transcripts detected at least one time. Relative to the whole set of Arabidopsis transcripts described in TAIR, between 50% and 75% were detected depending on the samples. Another parallel approach employed another program, BWA (Li et al., 2009), to perform the alignment as an alternative to MEGABLAST. This program produced a slightly higher number of mapped reads, with the assigned parameters, with the exception of sample +0LD from replicate A. BWA is particularly useful in the case of the paired-end data. This program quantifies the number of expressed transcripts taking into account how the reads map on the exons of each gene. Therefore, in the case of paired-end data, because two independent reads coming from different positions of the same transcript give a more precise description of the distribution of the reads on the transcript, the full power of the BWA approach can be used. For each of the 9 samples (time points +0LD, +1LD, and +3LD, repeated in three biological replicates A, B and C) a transcriptome has been obtained, composed of the number of reads derived from each Arabidopsis transcript. In the case of samples sequenced twice, the reads were pooled together to produce a single dataset for each biological sample and to increase the resolution for these samples by having more reads. The number of assigned valid reads greatly varied among the different samples (see Table 2), spanning two orders of magnitude from about total assigned reads to more than 5 million. Hence, in order to be able to compare the expression of a gene between the different time points and biological replicates, these data were normalized. The number of counts for each expressed gene in each sample was considered in relation to the total number of valid reads within that sample. Each sample was therefore normalized as number of counted tags per million (TPM). TPM for each sample was calculated by dividing the raw counts by the total number of tags mapped to the transcripts for the corresponding sample and then multiplying the answer by 1 million Quality controls and reliability of the replicates A quality control was performed based on the quality score given as an output of the Genome analyzer. The quality was good enough for the short-sequence reads to be mapped to Arabidopsis genes. The quality of the reads decreases with the length of the read (data not shown). This is a 79
90 Results typical result for the current sequencing technology. Therefore, even if the entire length was considered, more weight was given to the initial bases of 35-mers of the reads (see Methods). Scatter plots were produced comparing for each gene, the values as raw counts or TPM (depending on the cases) coming from two samples in all possible combinations. Some of them are shown in Fig. 23. A scatter plot shows for each gene, as a dot in the graph, the relative expression for two compared datasets. Typically for microarray data, the distribution of the dots is expected to be as a cloud following a straight line (Gentleman et al., 2005). The majority of the genes should not show differential expression, while the outliers indicate the small percentage of genes that are expressed differently in the two samples. In the case of biological replicates of the same sample, the scatter plot should be distributed on a straight line, showing fewer deviations from the central line. Considering that microarray hybridisation data and RNA-seq data are highly correlated, the same kind of distribution is expected for both types of data. In our case, the scatter plots show a generally good distribution on a central straight line (Fig. 23, A for replicates A and B). However, for these biological replicates, a high number of genes deviate from the central line, especially for the earlier samples (+0LD and +1LD), while the correlation increases for the later samples (+3LD) (Fig. 23, A). This is well described by the correlation coefficient R, which is in the range for the comparisons of +0LD, for +1LD, and for the +3LD. A comparison between different time points of the same replicate shows a situation similar to the one considering the same time points for different replicates, with correlation coefficient around 0.5. In order to test whether the difference in the biological replicates is due to low accuracy of the Solexa technology, technical replicates were performed by re-sequencing a few samples. The resequenced samples look almost identical (Fig. 23, B for an example), even in the case of +0LD. The correlation coefficient R, between 0.94 and 1 for the different samples re-sequenced, confirms high reproducibility. This indicates that Solexa technology is highly reliable when performed on the same sample (see Marioni et al., 2008) and that the differences found in the biological replicates are probably due to differences in the different experiments. A likely reason for this difference is that the RNA amplification was not totally balanced for all the transcripts, especially if we consider the extremely low quantity of the starting material. Indeed, the lowest correlation is for samples derived from smaller meristems, while the best correlation is in the +3LD samples, those with the largest quantity of RNA material. Also the extremely high number of sequences identified as primers, if they were real transcripts of which the information was lost, could have biased the final result. 80
91 Results Fig. 23. Scatter plots for mapped reads. Panel A: All the different samples for replicates A and B are compared to each other as mapped with MEGABLAST. Panel B: comparison between two technical replicates of sample +3LD from replicate B as mapped with MEGABLAST. Panel C: comparison between the two strands of the paired-end sequences for sample +1LD from replicate C as mapped with MEGABLAST. Panel D: comparison between the reads mapped with MEGABLAST and BWA for sample +0LD from replicate A. The reads were in TPM (A) or raw counts (B, C, and D). 81
92 Results A comparison was done to assess the performance of the paired-end sequencing in replicate C. In this case the transcripts were sequenced twice, from the two ends, and the two corresponding short sequences for each transcript are stored in separate files. Therefore, the two files were compared. Both scatter plots (Fig. 23, C) and R values (between 0.9 and 1) show that there is a very high correlation, so that the paired-end sequencing is a very accurate and reliable system to identify transcripts as both ends are highly likely to identify the same transcripts. Therefore, the values used for the further analysis of the data for replicate C were calculated as averages between the two sequenced strands. Another comparison was done between the reads obtained with the separated strands in replicate C and the reads obtained with BWA considering the two strands together. Also in this case the correlation was high (between 0.9 and 1 depending of the cases). Finally, a comparison between MEGABLAST and BWA results was performed to assess whether there is a substantial difference between these two programs in mapping the reads onto the transcripts. From this comparison it emerged that the results are highly similar (Fig. 23, D for an example of a scatter plot). However there are large deviations in the case of a few genes, which render some of the R values lower than 0.7 in some cases. Because these genes show a large difference as outputs of the two programs (for example 0 counts with MEGABLAST and more than 4000 with BWA), while all the other genes have very similar numbers of counts, the increase of mapped reads with BWA is probably due to a few genes that were mapped as a result of an artifact. Therefore, the data mapped with MEGABLAST seemed more reliable and were used for further analysis Use of housekeeping genes for the normalization An alternative possibility to normalize the results of next-generation sequencing is to use the expression of housekeeping genes as a standard. According to recent studies based on large sets of data from available microarrays, some classical Arabidopsis genes used in the past as reference genes, such as ACTIN, are not the best choice because they still show significant variation in expression under different environmental conditions (Czechowski et al., 2005). We chose UBIQUITIN10 (UBQ), because it seemed to be the most constantly expressed gene among the classical genes used to normalize the mrna levels of other genes in quantitative real-time PCR experiments. UBQ expression was then used to normalize the datasets generated by Solexa sequencing. For each independent sample, the number of counts for each gene was divided by the number of counts for UBQ in that sample, and then multiplied by 100. Therefore, the values for the 82
93 Results expressed genes were expressed as a percentage of the level for UBQ. This method cannot change the correlation coefficients between different samples, because it only changes a multiplicative factor applied to all the genes in the sample. Nevertheless, the average values of the genes and the variation of their values along the time points are affected. The value of some genes was checked, and although variation still occurred between the biological replicates, the trend of expression patterns for known genes was generally constant, and the variation was less compared to the data normalized only as TPM for the majority of genes that I tested (see next section), although for a few other genes the data expressed in TPM was instead more stable. Therefore different methods can be used to normalize RNA-seq data, and these generally improve the analysis in comparison to using raw reads, however the results of the different methods vary making it difficult to assess at this time which method is the most appropriate Expression values for known genes As a first approach to assess the biological quality of the data, the number of tags (both in TPM and normalized with UBQ) for known meristem genes was checked in the dataset. In Fig. 24 the values for some of these genes are shown, as TPM or normalized with UBQ. mrnas of genes that should be expressed at the SAM, because they are important for its maintainance, such as CLV1, CLV3, STM, WUS, and KNAT1 were detected in our gene expression datasets (Fig. 24, A, B, below). Particularly, mrnas of genes that are expressed in a very restricted subset of the SAM tissue, like the CLVs and WUS, are easily detected. This demonstrates the value of specifically collecting SAMs, so the expression level of these genes was not diluted as would happen in entire apices, although WUS expression level is still low. STM and KNAT1 are strongly expressed because they are present in the whole SAM, and the former seems to increase in expression upon the shift to LD, as already reported previously for apical samples (Schmid et al., 2003). Another set of genes that are particularly important for this experiment comprises those involved in the floral transition at the SAM (Fig. 24, A, B, center). Particularly, SOC1 mrna shows a marked increase in the number of tags with the number of LD of induction in all three biological replicates (from 30 to 300 fold between +0LD and +3LD, in TPM). FUL mrna also shows an increase, but much less than for SOC1 (from 5 to 30 fold between +0LD and +3LD, in TPM) and it is delayed with respect to SOC1, which is also consistent with in situ hybridisation results (Fig. 11, Fig. 13). FD is already strongly expressed before the transition, and slightly increases after 3 LD, as is expected from our previous results. SVP is generally strongly expressed, and it appears to be 83
94 Results slightly up-regulated after 3 LD. This seems in contradiction to its role as a floral repressor and the expression pattern shown by in situ hybridisation (see sections and 3.1.3). This apparent contradiction might be reconciled because there is mainly a re-distribution of the mrna of SVP within the meristem during the floral transition. Rather than a net decrease, there is a downregulation of the mrna in the central part of the inflorescence meristem, and an up-regulation on its flanks (Fig. 11, Fig. 13, Fig. 14). Therefore, such a complex pattern cannot be fully described by the quantification of the mrna in the entire SAM. AGL24 is another gene that has been shown to be expressed before floral induction by LD in our conditions, and increase in expression upon induction (Liu et al., 2008; Michaels et al., 2003; Yu et al., 2002). This is consistent with the data from RNA-seq gene expression dataset. Genes involved in the floral transition, and controlled by mirnas were also checked (Fig. 24, A, B, center). SPL9 mrna was absent before induction and increases upon transfer to LD, as recently reported and shown by in situ hybridisation at the SAM (Wang et al., 2009a). SPL3 mrna was not detected, while SPL4 and SPL5 mrnas were detected at very low levels. This could be due to the fact that they are induced later, or to the similarity of their sequences, which creates ambiguities in the assignment of the reads to a unique gene causing the reads to be discarded. The two related genes SMZ and SNZ seem to decrease in expression, but their mrnas were detected only in one sample. These two genes were identified by microarray analysis (Schmid et al., 2003) as downregulated upon the shift to LD in shoot apices. Our approach, which is more specific for the meristematic tissue, suggests these genes are not expressed in the meristem, and this is in agreement with recent results indicating that they repress FT expression in the vascular tissue (Mathieu et al., 2009). Another control that was performed was to test for the expression of genes whose mrnas were not expected in these meristems (Fig. 24, A, B, on top). For example, mrnas of meristem identity genes and floral genes should be absent or very lowly expressed, because they should be only expressed in later stages. AP1 mrna, as for in situ hybridisation, is barely detectable. Also LFY and PI mrnas are not present at all or very lowly expressed. Conversely TFL1, which counteracts LFY and AP1, is expressed. Finally TSF mrna is also not expressed in the collected SAMs, as expected because it is expressed in the leaf tissue. 84
95 Results Fig. 24. Expression values of selected genes extracted from the gene expression dataset. The values are calculated as averages between the three biological replicates, as TPM (A and C) or normalized with UBQ10 (B and D). The bar represents the standard deviation. In panels A and B, values for known meristem expressed genes are indicated. In panels C and D, values for candidate genes identified in the datasets are indicated. The corresponding candidate genes are listed in Table 5. These controls provided important support for the RNA-seq method. Even although before sequencing the cdna was tested by RT-PCR (for example for the presence of SOC1 mrna in the induced samples), it was not known whether the quantity of such mrnas was still balanced in the 85
96 Results samples after RNA amplification. Also contamination by other tissues remained possible and that would disturb the general balance of the transcripts and include genes that should not be expressed. Based on these controls, we can conclude that next-generation sequencing applied as RNA-Seq on meristems collected by LCM produced a coherent dataset that detects several known mrnas that are specifically expressed in the SAM, and does not include several mrnas that are specifically expressed in floral meristems and leaves. Moreover, mrnas of flowering time genes like SOC1 and FUL seem to be up-regulated as they should be Data analysis: identification of differentially expressed genes The general approaches for global gene expression analysis using microarrays make use of biological replicates to provide an estimate of the variation in gene expression for all the genes present on the array (Allison et al, 2006; Grant et al., 2007). Statistical tests are used to decide whether a gene is considered to be differentially expressed between different samples. In the RNASeq data, the variability was relatively high between samples and there are genes that have a relatively large difference in TPM not only between different time points, but also within the same time point for different biological replicates. Therefore, different methods were applied to correct for the resulting noise and to identify genes differentially expressed between time points. Lists of genes considered up- or down-regulated during the shift to LD were generated with the different methods, and several candidates were tested for their expression levels by independent methods. This information was used also to validate and evaluate the different methods. A first set of genes was made using only replicate A, before the other datasets were available. The genes were selected simply by the largest up- or down- regulation between +0LD and +3LD. These genes were named C candidates, from C1 to C20. Another set of genes was compiled using replicates A and B, before the third replicate was available. These were named D candidates, from D1 to D60, and two approaches, a p-value approach and a log2 ratio approach were used. To make possible some of the calculations of these methods (e.g. to calculate ratios and log2 ratios), the 0 values (NULL) indicating the absence of expression of certain genes in certain time points, were converted to 1, which did not affect the general distribution of the data. In the p-value approach, a particular statistical method was applied, using the hypergeometrical distribution. A formula was used (modification from Marioni et al., 2008, see Methods) to calculate 86
97 Results for each gene a p-value, taking into account both its variation between time points and its variation between the two technical replicates. In this case the raw values (counts not normalized) were used to compute the calculations of the p-values. So for each gene a p-value is related to the probability that a gene is differentially expressed between two time points, for each comparison among the three time points +0LD/+1LD/+3LD (Fig. 25, A). The threshold has been set at 0.1 (p-value < 0.1), resulting in identification of 138 differentially expressed genes between +0LD and +1LD, 351 genes between +0LD and +3LD, and 232 genes between +1LD and +3LD (Fig. 25, A). In the log2 ratio approach, using the normalized values as TPM, the log2 ratio between each pair of time points for each gene was calculated, and the genes were ranked. After ranking the top 1000 genes both for replicate A and replicate B separately, the genes which were present in both replicates and which had the same trend in expression (up- or down- regulation) were considered. The small number of genes in this list (37 genes between +0LD and +1LD, 46 genes between +0LD and +3LD, and 50 genes between +1LD and +3LD, see Fig. 25, A) indicates that it is difficult to compare the two replicates only in terms of up- or down- regulation without taking into account the variation of these genes in all the dataset. A direct comparison between the two approaches was also done, and the majority of genes that are in the log2 ratio set are included in the p-value set for each comparison between time points (Fig. 25, A). SOC1 up-regulation was detected between +0LD and +1LD, and between +0LD and +3LD, with both the approaches. If we consider the three groups of transitions (among +0LD, +1 LD, and +3LD), it seems reasonable that some of the identified genes would belong to more than one group. Again, SOC1 is a good example, since it is up-regulated between +0LD and +1LD, and between +0LD and +3LD. For all the differentially expressed genes the ones that are present in more than one group were identified. These genes should represent a set showing a coherent and constant expression pattern during the floral induction (Fig. 25, A). A total of 107 genes is present in more than one group, while only 2 of these genes are present in all three groups. Finally, with a dataset including all three replicates, a clustering approach was used. When the data of all three replicates are compared, many genes show the same general trend in expression pattern (for example up- or down- regulation, or constant expression). However, the values expressed in TPM between replicates can be so different for certain genes that if the average is calculated, the standard deviation appears larger than the average. This could be due to the general distribution of the short-sequencing data, which does not follow the normal statistical distribution, or to the fact that the normalization in TPM is not accurate enough and another method is required. 87
98 Results Moreover, the C replicate is qualitatively different to A and B, because more sequences were provided for the analysis giving rise to a deeper detection of transcripts, and also the paired-end approach generated a better-quality dataset. This could result in difficulties to compare directly the values for certain genes between replicates A and B and replicate C. While alternative statistical distributions for the short-sequence data and alternative methods for normalization have still to be well established, here a clustering method was used, which directly compared the data expressed in TPM. Fig. 25. Approaches used to identify differentially expressed genes in the global gene expression dataset from Solexa sequencing. Panel A: The 3 possible comparisons between time points are indicated above. For each of the comparisons, the number of genes identified by the log2 ratio and p-value methods and the number of common genes are shown in the Venn diagrams. Panel B: The clustering method identified genes that were up-regulated (upper Venn diagram) or down-regulated (lower Venn diagram) in all biological replicates and the number of genes identified is shown at the intersection of the three sets in each Venn diagram. Rep A, B, and C represent the three biological replicates. 88
99 Results Fig. 26. A schematic representation of the possible relationships between the expression values of selected genes. +0LD, +1LD and +3LD represent the time points of the time course from the global gene expression dataset, for one hypothetical replicate. The red line represents the expression trend of a certain gene, up-regulated (A, B, C) or downregulated (D, E, F). A gene is considered coherently up- or down-regulated if the expression values fulfill the conditions indicated in the figure. The aim was to identify for each replicate the genes that are coherently up-regulated or downregulated (from +0LD to +1LD and from +1LD to +3LD), and then among those to select the genes common to all three replicates (Fig. 25, B). These genes should represent a reliable set, because they are up-or down- regulated in 3 independent experiments. First of all, in order to set a threshold of detectable expression, all the values that were lower than 10 TPM were excluded by setting them to 0, resulting in the exclusion of genes considered to be too lowly expressed to be reliable. Then, for each replicate, a threshold for fold change was imposed to be 3LD/0LD > 1.5 for the upregulated genes. However, because of the slight variation of the data, I wanted to include not only the genes for which the value of the +1LD is located between +0LD and +3LD (Fig. 26, A, for a 89
100 Results schematic example), but also the genes for which this value is slightly higher than +3LD (Fig. 26, B) or slightly lower than +0LD (Fig. 26, C). Therefore, two additional conditions were allowed for the up-regulated genes: 1LD/3LD < 1.5 and 0LD/1LD < 1.5. A similar approach was considered for the down-regulated genes (Fig. 26, D-F), where the first condition to be respected was 0LD/3LD > 1.5, and then two additional conditions were 3LD/1LD < 1.5 and 1LD/0LD < 1.5. The use of these parameters resulted in the recovery of genes that are generally up- or downregulated, without including genes that have a value in +1LD that is too deviating from the general trend. As an example, SOC1 in replicate A is 0, 400 and 300 TPM respectively, and it fulfills these conditions. The rationale to choose genes with this pattern was to have a set of genes that are co-expressed with SOC1 (responding already after the first LD) and FUL (responding mainly after +3LD), in the case of the up-regulated genes. As an output of this analysis, the overlap between all replicates for the up-regulated genes was 339, while the overlap for the down-regulated genes was far lower (Fig. 25, B). Another test was performed with the same method, but using the values of the genes normalized with UBQ (see above). The same criteria were applied for the fold ratios, while values lower than 1 (1% respect to UBQ) were considered 0. In this case, the common up-regulated genes were 447, although the down-regulated genes were 56, again very low. Moreover, the number of genes of the different replicates used for the intersection were very different to each other, in some case up to 3 fold. The overlap between the genes found starting with the TPM data and with the normalization with UBQ was 114 up-regulated genes and 29 down-regulated genes. From all these lists of genes, a set of candidate genes were chosen to be tested by other experimental procedures, and they will be described in the following sections GO term enrichment analysis The clustering approach identified differentially expressed genes using the data of three biological replicates, and therefore the lists of these up- and down- regulated genes were used for further analysis at the global gene expression level. In order to highlight the classes of processes characterizing the floral transition at a genomic level, GO term enrichment analysis was performed with the software FatiGO (Al-Shahrour et al., 2006). This program detects the GO terms that are over-represented in a sub-set of genes, in our case the up- or down- regulated genes, toward another list of genes, in our case composed of all the genes present in the list of transcripts used as a 90
101 Results reference for the mapping of the reads. The output of the program provides also a p-value and an adjusted p-value for each of the terms, which gives a statistical significance to the different terms listed. For the up-regulated genes, several terms were found to be statistically significant (Table 3). Strikingly, for the biological processes, the set of classes found gave a coherent scenario, because they are all connected to general biosynthetic and metabolic processes. Going up to more specific classes (higher levels), other terms are more connected to protein metabolic processes, ribosomes biogenesis and assembly, and translation. The only molecular function found to be significantly enriched in this dataset was the one connected to the structural constituents of ribosomes. For the down-regulated genes, a few terms were found to be statistically significant (Table 4), likely due to the fact that this list of genes is too restricted. Nevertheless, it seems that the category related to response to stress is over-represented, plus some processes related to specific metabolic pathways. 91
102 Results Table 3. GO term enrichment analysis for the 339 up-regulated genes identified by the clustering approach. Table 4. GO term enrichment analysis for the 82 down-regulated genes identified by the clustering approach. 92
103 Results 4. Characterization of novel genes induced during the floral transition selected from gene expression analysis 4.1 Selection of the genes A set of genes expressed in the SAM is expected, which should already restrict the number of genes identified as induced during the floral transition. Moreover, only the early stage of the induction has been selected in the experiment, and this should further restrict the number of induced genes detected. A dataset is already available for the floral transition in the Arabidopsis shoot apex (Schmid et al., 2003), so a direct comparison with these available data is also useful. Of particular interest will be the genes that were not identified by the previous approach because their pattern of expression was masked by a dilution in the apical tissue, but were identified by our highly tissuespecific approach. In situ hybridisation was selected to confirm the gene expression data. However, because this technique is not as sensitive as others such as RT-PCR, probing mrna of genes that are not strongly expressed can lead to absence of a visible signal. Therefore a first filter was used to select genes that are strongly expressed at least in one of the time points. A general threshold was set based on the values of known genes that are detected by in situ hybridisation, of around 100 TPM. Moreover, the genes were selected on the basis of the highest degree of up/down regulation, because in situ hybridisation is also not always suitable to discriminate small differences in gene expression. Therefore, sometimes candidates were chosen even if the expression value was under the set threshold, as long as the difference in expression was high between time points. Three lists of genes were selected using the three approaches described in the previous section: 1) C1-20 from the first analysis based on replicate A. 2) D1-60 from p-value and log2 ratio approaches, from replicates A and B. About one third of the genes were taken from the log2 ratio list, another third from the p-value list, and the remaining genes are present in both lists. This approach should give a chance to assess if one method is more reliable than the other (for the first 40 genes) and at the same time to screen the 20 genes that are in both lists, which should be the most reliable genes to test. 3) C21-30 from the clustering approach, from replicates A, B, and C. The only gene that can be used as a positive control is SOC1, because it is known to be involved in the floral transition at the SAM and is clearly differentially expressed during the floral transition in 93
104 Results our experimental conditions (Fig. 11). Up-regulated candidate genes were given emphasis because they showed a similar expression pattern to SOC1. Moreover, genes that are up-regulated only in the later phase, from +1LD to +3LD, were included in the set of genes to be analyzed. Indeed, these genes could be targets of SOC1/FUL, or of any other regulatory protein responding in the very early phase of the floral transition. Table 5. Candidate genes and their fold increase in expression after exposure to LDs. The fold changes 1LD/0LD and 3LD/0LD were calculated from the averages between the three replicates. In case of 0 values, they were converted to 0.1 to calculate the fold increase. The methods by which the genes were identified were the first preliminary method (1), the p-value and log2 ratio (2) and the clustering (3), described in the text. The fold change from microarray data is calculated from Schmid et al, 2003, considering the ratios between +3LD and +0LD in wild-type Col. 94
105 Results Some of the candidate genes were then analyzed by in situ hybridisation (see the following sections). A few of these genes are also plotted as they resulted originally from the global gene expression in the three replicates (see Fig. 24, C and D). 4.2 Validation of the gene expression data: in situ hybridisations on candidate genes In situ hybridisation is a very powerful technique if coupled with the LCM and employed to confirm the results of the gene expression analysis. Indeed, we wanted to follow the expression of meristem-specific genes, therefore we cannot rely heavily on RT-PCR on apices because we would loose the resolution on expression level due to dilution of the meristem tissue in the whole apex. Moreover, in situ hybridisation gives not only an idea of the expression level by the strength of the signal, but it also shows the spatial expression pattern of a gene, revealing specific subcompartments of the SAM in which that gene could exert a specific function. In order to check the expression patterns of selected candidate genes by in situ hybridisation, DNA templates for in situ probes were synthesized by PCR using specific primers for the selected candidates, and the relative RNA probes tested on apices. The total number of genes tested was 60 (see Appendix II for the complete list). A list of 22 of these genes, which are discussed in the following sections because they show expression patterns consistent with the RNA-Seq gene expression data, are indicated in Table 5. Around half of the probes tested did not give any visible signal, while a few others showed signal but were not easy to interpret in terms of differential expression between samples. In situ hybridizations with SOC1 probe were repeated several times, to provide a positive control in our experiments with the candidate genes (Fig. 27). 1) First series. The C4 candidate gene showed an interesting expression pattern in wild-type, as it is expressed specifically only in the SAM and its signal increases with longer exposure to LD (Fig. 27). It is predicted to encode a bzip transcription factor of unknown function. The C11 candidate gene does not show visible expression before induction, is only weakly expressed after +1LD and more strongly expressed after +3LD (Fig. 27). It is a gene encoding a zinc finger-homeodomain protein. In terms of spatial distribution, C11 mrna is detected at the flanks of the SAM, in regions which correspond to the positions at which organ primordia will form. C15 is expressed already before transition, but it seems to increase in expression upon transfer to LD. The pattern looks similar to genes like AGL24 (see Fig. 14), although it is expressed more broadly also outside of the SAM. 95
106 Results This gene encodes a leucine-rich repeat (LRR) family protein, with predicted kinase activity. C19 is strongly expressed, especially at the SAM but also in the young leaves surrounding the meristem (Fig. 27), and it seems to increase during the floral transition. It encodes a LRR protein of unknown function. C20 is strongly expressed in the apex, and particularly at the SAM. It is already present before induction in LD, and it seems to increase in intensity after induction, although the saturation of the signal makes the quantification quite difficult. It encodes a protein with RING finger-like zinc finger motif. 2) Second series. D3, D27 and D29 seem to be expressed already before the shift, but they increase in intensity. Their expression is also not specific for the SAM, since they are expressed in other tissues in the apex (Fig. 28 and Fig. 29). D3 encodes a protein of unknown function, D27 an ATP binding protein and D29 a glyceraldehyde-3-phosphate dehydrogenase. D19, D31, D35 and D37 seem to be very specifically expressed in the meristem, although the mrnas of the first three genes are very weakly detected. D19 encodes a protein involved in the β-oxidation of fatty acids, D31 a heptahelical transmembrane protein, D35 a nitrate reductase that was found to be also involved in flowering (Seligman et al., 2008) and D37 a Dof-type zinc finger protein. D55 has a pattern similar to SOC1. It encodes for a phospholipid/glycerol acyl transferase. D13 has an intriguing pattern of expression (Fig. 28). Before induction, it is expressed in the apex quite strongly and concentrated in the very young leaves near the meristem, on the most external cell layer of these leaves. After +3LD of induction another spot of expression appears in the center of the shoot apical meristem, spanning part of the rib zone and the central zone of the meristem, in a region that resembles TFL1 expression pattern. D13 encodes a stearoyl-acp desaturase. 3) Third series. Most of the genes of this series were also tested. The ones shown (Fig. 30) are all up-regulated after +3LD, although for some of them the in situ hybridisation signal is very weak. All of them are expressed mainly in the whole SAM, except for C23, which is specifically expressed only in the central part of the SAM (Fig. 30). C21 encodes a homeobox protein, which was shown to be involved in flowering (Wang et al., 2003), C22 encodes a putative hydrolase/lipase, C25 an uncoupling mitochondrial protein, C27 a putative calcium-dependent protein kinase, and C29 a GATA transcription factor. C23, C26, and C30 all encode proteins with unknown function. 96
107 Results Fig. 27. In situ hybridisations with candidate genes. These genes were initially selected using only data from replicate A (see text for details). Plants were grown for 2 weeks in SD and shifted to LD, as indicated in the figure. Samples were collected at ZT8. SOC1 is used as a positive control on the samples. The corresponding genes are listed in Table 5. Scale bar is 50 μm. 97
108 Results Fig. 28. In situ hybridisations with candidate genes. These genes were selected with the p-value and log2 ratio approaches using data from replicates A and B (see text for details). Plants were grown for 2 weeks in SD and shifted to LD, as indicated in the figure. Samples were collected at ZT8. D13_2 is an alternative probe for detection of D13 mrna. The corresponding genes are listed in Table 5. Scale bar is 50 μm. 98
109 Results Fig. 29. In situ hybridisations with candidate genes. These genes were selected with the p-value and log2 ratio approaches using data from replicates A and B (see text for details). Plants were grown for 2 weeks in SD and shifted to LD, as indicated in the figure. Samples were collected at ZT8. The corresponding genes are listed in Table 5. Scale bar is 50 μm. 99
110 Results Fig. 30. In situ hybridisations with candidate genes. These genes were selected with the clustering approach, using data from replicates A, B and C (see text for details). Plants were grown for 2 weeks in SD and shifted to LD, as indicated in the figure. Samples were collected at ZT8. SOC1 was used as a positive control and as a reference gene. The corresponding genes are listed in Table 5. Scale bar is 50 μm. All three methods of analysis lead to the identification of novel genes with interesting expression 100
111 Results patterns. However, the success rates of these methods were different. Although it is not easy to compare them directly, because a different number of genes was tested for each method. However, the most reliable method appears to be the third one, with a success rate of about 80% (8 positive genes out of 10 tested), followed by the first method with about 60% success rate (5 positive genes out of 8 tested), and finally the second method with about 21% (9 positive genes out of 42 tested). In the case of the second method, the p-value approach had more success than the log2 ratio approach, since D19, D27, D29, D31, D35 and D37 were in the p-value list, while only D55 was in the log2 ratio list, and finally D3 and D13 were in both lists. 4.3 The use of mutants to test the response of the candidate genes to flowering pathways In a first screen, in situ hybridisations were performed using probes for the candidate genes on apices from wild-type plants. To test whether the confirmed genes were activated by the photoperiodic flowering pathway they were analyzed by in situ hybridisation on a ft-10 tsf-1 double mutant (grown in the same condition as wild-type plants) and repeated in parallel on wild-type. Indeed, up- or down-regulation of a gene at the SAM driven by a shift from SD to LD in wild-type could be caused by many different reasons, such as developmental changes at the meristem due to its growth, or simply a response to light, temperature or stress. A plant carrying null mutations in both FT and TSF is extremely late flowering in LD because it does not respond to photoperiod (Jang et al., 2009), as the SAM of these plants does not receive the floral stimulus from the leaf upon induction because both the FT mobile signal and its homologue TSF are absent. If a gene responds to the inductive FT/TSF signal at the SAM in wild-type plants, it should not respond to LD in the double mutant. This is indeed the case for SOC1, which was used as a control gene (see Fig. 31). So ft tsf can be used to identify genes that respond to this known signal. In situ hybridisations show that SOC1 is not expressed in wild-type grown for two weeks in SD before induction (+0LD), starts to be up-regulated after +1LD and strongly increases at the SAM after +3LD (Fig. 31, A-C). In contrast, in the ft-10 tsf-1 double mutant the level of expression of SOC1 does not increase after induction, and remains at a very low level even after 3 LD (Fig. 31, D-F). In principle, three behaviors in relation to FT/TSF can be expected: total dependence, partial dependence, independence. D31 is an example of the first behavior. Indeed, expression of this gene is detected in wild-type in the whole SAM only after 3 LD, while it is absent in ft tsf (Fig. 31, G-L). 101
112 Results D27 is an example of the second behavior. Although its expression depends sometimes on the tissue sections, in general it is expressed quite strongly and in particular after +3LD, in wild-type, while in the double mutant its expression is clearly lower, during the entire time course (Fig. 32, A-F). It is surprising that also before induction the double mutant shows less expression than wild-type, because it should look very similar since FT and TSF are generally believed not to be expressed in SD. Surprisingly, the third behavior was also found. For D13, in the ft tsf double mutant the pattern appears similar to the one in wild-type both before and after induction (Fig. 32), which would imply that this gene is activated by a signal after 3 LD that is independent of FT or TSF action. Fig. 31. In situ hybridisations with SOC1 and a candidate gene. In situ hybridisations were carried out using probe for SOC1 mrna (A-F), or D31 (G-L) on apices from wild-type Col (A, B, C, G, H, I) and ft-10 tsf-1 (D, E, F, J, K, L). Plants were grown 2 weeks in SD and collected before induction at ZT8 as +0 LD (A, D, G, J), after +1 LD (B, E, H, K), after +3 LD (C, F, I, L) of induction in LD. Scale bar is 50 μm. 102
113 Results Fig. 32. In situ hybridisations with candidate genes. In situ hybridisations were carried out using probe for D27 mrna (A-F), or D13 (G-L) on apices from wild-type Col (A, B, C, G, H, I) and ft-10 tsf-1 (D, E, F, J, K, L). Plants were grown 2 weeks in SD and collected before induction at ZT8 as +0 LD (A, D, G, J), after +1 LD (B, E, H, K), after +3 LD (C, F, I, L) of induction in LD. Scale bar is 50 μm. 4.4 D13: a gene encoding a lipid desaturase induced by photoperiod independently of FT and TSF This gene was selected from the list of genes which were confirmed by in situ hybridisation for four main reasons. The first one is that its pattern of expression was unique among those tested. It is already expressed before induction, but only in the young leaves near to the meristem, specifically in the outer layer. Then upon exposure to LD it appears in the center of the inflorescence meristem with a strong signal after 3 days of induction (Fig. 28). The second reason is that in the global gene 103
114 Results expression dataset from the meristem this gene has one of the highest levels of up-regulation (more than 500 times for the values in TPM between +0LD and +3LD), and this is reflected in a strong and clearly visible signal by in situ hybridisation. The third reason is that this gene encodes an enzyme (lipid desaturase), involved in a pathway that has not been linked so far to the floral transition. The fourth reason is that the expression pattern of this gene in ft-10 tsf-1 double mutant is very similar to the one in wild-type plants (Fig. 32, G-L). This suggests that in the ft-10 tsf-1 double mutant there is still a response to photoperiod, which triggers a signal, and eventually a response at the SAM, which is independent of FT and TSF, a fact that has not been described so far. Another interesting feature of this gene is that it is a member of a family of 7 genes, but while the others are expressed in several distinct tissues in the plant, D13 expression could not be detected (Kachroo et al., 2007). This suggests that it may represent an isoform of this class of enzymes that is specific for the meristem. The expression pattern initially found for this gene was reproducible, in different hybridisations and using samples collected in independent experiments. Also an alternative RNA probe for in situ hybridisation was synthesized, designed in another region of the mrna, and using this second probe the pattern of expression for this gene was confirmed (Fig. 28). So the first probe was used for all the subsequent experiments, since it gave a slightly stronger signal. Fig. 33. Expression pattern of D13 in wild-type and ft tsf double mutant until 5 LD after shift. In situ hybridisations were carried out using probe for D13 mrna, on apices from wild-type Col (A, B, C, D) and ft-10 tsf-1 (E, F, G, H). Plants were grown 2 weeks in SD and collected before induction at ZT8 as +0 LD (A, E), after +1 LD (B, F), after +3 LD (C, G) and after +5LD (D, H) of induction in LD. Scale bar is 50 μm. 104
115 Results Fig. 34. Expression pattern of D13 as induced by LD and in relation to TFL1. In situ hybridisations were performed using probes for TFL1 (E) and D13 (all the others). Plants were grown for 10 LD (A, C, E), 12 LD (B, D), 2 weeks SD +0LD (G), 2 weeks SD +3LD (H), and 2 weeks SD +3LD +2SD (F). Plants were collected at ZT8. Scale bar is 50 μm. Picture E was kindly provided by Aimone Porri. Another in situ hybridisation experiment showed again that D13 is up-regulated after 3 LD in the central region of the inflorescence meristem, both for wild-type and ft tsf double mutants (Fig. 33). In this experiment the strength of the signal is slightly weaker for the double mutant, probably reflecting the biological variation of the sample (compare with Fig. 32, G-L). However, the signal is still clearly stronger than before the third LD. Moreover, after 5 LD of induction, the mrna of D13 is broadly expressed through all the inflorescence meristem, and this expansion of the 105
116 Results expression domain occurs both in wild-type and ft tsf double mutants (Fig. 33). In wild-type after 5 LD, there is a small domain in which D13 is not expressed, which could be the floral meristem forming on the flanks of the inflorescence meristem (Fig. 33). This domain, indeed, is not present in ft tsf double mutants, which are strongly delayed in floral meristem formation On the expression pattern of D13: possible interactions with TFL1 Because the portion of the D13 transcript which is expressed in the meristem after 3 LD of induction is similar to the pattern of expression of TFL1 gene upon induction (Fig. 34, E), it was tested whether there is any interaction between these two genes. A time courses of plants grown in LD, both for wild-type Col and tfl-18 mutant, was collected and hybridised with D13 probe. Meristems of tfl1 mutants grow slightly faster in LD compared to wildtype due to the effect of a slightly earlier flowering of the mutant (Fig. 34, A-D). In both genetic backgrounds D13 presents an increase of expression with the increasing number of LD in the florally-induced meristem. Nevertheless, D13 shows a stronger signal in tfl1 mutant compared to the corresponding wild-type control grown for the same number of LD (Fig. 34, A-D) On the signal inducing D13: triggering flowering without LD The expression of D13 mrna increases during floral induction triggered by LD, but is independent of FT and TSF, therefore it was of interest to separate floral induction from induction of flowering by photoperiod and assess whether D13 was still induced during flowering. One way to separate these two processes is to use an inducible system, in which the flowering cascade can be triggered without shifting the plants to LD. Moreover, the fact that D13 is increased in the absence of FT and TSF does not necessarily exclude that FT or TSF can also contribute to the induction of this gene and that they could induce it once they are strongly activated. Transgenic plants carrying a construct encoding the CO protein fused to the gluco-corticoid receptor (GR) ligand-binding domain driven by the 35S promoter were used. In these lines, treatment with dexamethasone (DEX) leads to a strong activation of CO function and induction of flowering (Simon et al., 1996). This construct is in co genetic background (in Ler), so CO is activated only in response to DEX. Therefore, this system can be used to activate flowering in SD upon treatment with DEX and the response can be studied in terms of gene expression. Plants were grown for 2 weeks in SD, and the ones carrying 35S::CO:GR either treated with DEX or with the mock, only one time at ZT8, while wild-type Ler was shifted to LD, as a positive 106
117 Results control for induction of floral promoting genes. Samples were collected at days +0, +1, +3, +5 after the treatment or the shift. Plants carrying 35S::CO:GR were monitored and the ones treated with DEX flowered significantly earlier than the ones treated with the mock, confirming the effect of the treatment. Apices enriched in meristem tissue were collected by removing the leaves with small tweezers. These samples still contain small parts of leaves, so it is still possible to monitor an increase in FT expression under strong inductive condition, such as the activation of the CO:GR system. The expression of FT was measured and a strong up-regulation of this gene was found in the samples treated with DEX from the first day after treatment, while no increase was detected in the mock-treated samples (Fig. 35, A). Wild-type Ler shifted to LD did not show a large increase in FT mrna, probably because there is not so much leaf tissue to detect the increase due to the shift in LD at this stage. SOC1 was used as a marker for the relative induction at the meristem. SOC1 induction upon DEX treatment reflects FT expression in these samples (Fig. 35, B), and it is even stronger than in wild-type shifted to LD, confirming that floral induction is being triggered in the samples treated with DEX. In wild-type samples there was no more increase of SOC1 mrna after the first long day. This could be due to the fact that after 3 LD Ler is already flowering, and there is not a significant increase of SOC1 after this stage. Finally, expression level of D13 was tested. First of all, because the expression pattern of D13 was described in Col in our previous experiments, and for the RT-PCR Ler ecotype was used, in situ hybridisation was carried out on apices of wild-type Ler grown 2 weeks in SD and then shifted to LD. This experiment confirmed an up-regulation of D13 upon exposure to LD (Fig. 34, G, H). The increase in the expression level of this gene seems even stronger in Ler, probably reflecting the faster induction occurring in this ecotype compared to Col. Therefore, expression level of D13 could also be measured by RT-PCR. In wild-type samples this gene was strongly up-regulated upon shift to LD (Fig. 35, C), similarly to previous results from the sequencing data and from in situ hybridisation (see above). But in the case of plants carrying 35S::CO:GR, no induction of D13 was detected upon treatment with DEX. From this experiment we can conclude that D13 is not influenced by the photoperiodic pathway activated by CO, and therefore that it is not activated by FT/TSF. Additionally, since possible interactions between D13 and TFL1 are being tested, TFL1 expression was also checked in those samples. TFL1 expression level increased in wild-type upon shift to LD, similarly to D13 (Fig. 35, D). In the case of plants carrying 35S::CO:GR, no induction of TFL1 expression was detected, as for D13. This last result seems to be in contradiction to what was published previously (Simon et al., 1996). Nevertheless, the general experimental and growth 107
118 Results condition were probably very different, and it is not easy to compare our RT-PCR data with previous in situ hybridisation data. Moreover, the spatial expression pattern of TFL1 is quite complex, because upon induction it starts to be expressed in different and separated zones of the SAM, and RT-PCR cannot take into account the contribution of these distinct parts on the general expression in the whole apex. Expression of D13 was also tested in plants that were grown 2 weeks in SD, shifted to LD for 3 LD and then shifted back to SD, in Col ecotype. In situ hybridisation shows that at 2 days after the shift back to SD, there is still strong expression (Fig. 34, F), comparable to that after 3 LD (Fig. 33, C). This would suggest that expression of D13 is not only sustained by LD, but once expressed it can stay on even after return to SD. Nevertheless its expression does not increase to the levels detected in plants shifted to LD for 5 days. Fig. 35. Quantitative real time PCR on RNA extracted from plants in which the photoperiodic pathway has been induced. Levels of expression of FT (A), SOC1 (B), D13 (C), and TFL1 (D) mrnas are measured at ZT8 in apices of seedlings enriched in meristem tissue. Plants were previously grown for two weeks in SD, then wild-type Ler (wt) was shifted to LD, while 35S::CO:GR in co-2 (COGR) was kept in SD and treated with dexamethasone (+DEX) or with mock (-DEX). 108
119 Results Fig. 36. Modulation of D13 expression level with transgenic approaches. Wild-type Columbia, a T-DNA line (see text) with an insertion in the promoter of D13, and several independent lines expressing RNAi against D13, are compared. Panel A: flowering time data. Total number of leaves (rosette plus cauline leaves) are scored both in LD and SD. Panel B: quantitative real time PCR to measure D13 RNA expression in apices (apices enriched in meristem tissue). Plants were grown in LD in growth chambers for 12 days and collected at ZT Modulation of D13 expression with transgenic approaches The SALK collection of plants carrying T-DNA insertions (Alonso et al., 2003) was searched to find a line of Arabidopsis with an insertion at the D13 locus. There was no line with a T-DNA insertion in exonic or intronic regions of this gene, but one with an insertion in the promoter region, just a few base pairs before the ATG start codon was detected. Therefore, it is not possible to predict the effect of this insertion. In parallel, the expression of this gene was modulated by transgenic approaches. Wild-type Col was transformed with a construct designed to target a specific region of the mrna of D13 by RNA interference (see Methods) driven by the 35S promoter. Six independent homozygous lines carrying one single insertion of the transgene were obtained. None of the RNAi lines nor the SALK line showed a flowering time phenotype or any other obvious phenotype (Fig. 36, A), except for a slight early flowering of line #3 (especially in SD) and line #9 (especially in LD). The RNA level of D13 in all these lines was measured in apices (Fig. 36, B). Compared to wild-type, most of the lines did not show a significant decrease in D13 expression. The only line with less detectable expression was line #7. Moreover, the SALK line showed higher D13 expression, confirming that it is a line over-expressing D13 presumably due to expression from a promoter within the T-DNA. However, there is no correlation between the resulting flowering time and level of expression of D13 in those lines. It seems quite likely that the RNAi approach in this case did not result in a significant reduction of the mrna of D
120 Results Wild-type Col was also transformed with a construct expressing D13 complete coding sequence, driven by 35S promoter or FD promoter. T1 plants selected on BASTA did not show any obvious phenotype. Fig. 37. Expression patterns of the C11 candidate gene and close related genes. In situ hybridisations were carried out on shoot apices with probes for C11 (A-I), ATHB21 (J, K, L) and ATHB25 (M, N, O). Apices were from wild-type Col (A, B, C, G-O) and ft-10 tsf-1 (D, E, F). Plants were grown 2 weeks in SD and collected at +0LD (A, D, J, M), +1LD (B, E, K, N), +3LD (C, F, L, O) and +5LD (G, H, I). G, H and I are pictures from three sections of the same plant. Plants were collected at ZT8. Scale bar is 50 μm. 110
121 Results 4.5 C11: a homeodomain transcription factor which is dependent on FT/TSF C11 is a gene encoding a homeodomain protein included in the zinc finger-homeodomain family. The gene that we identified as C11 corresponds to ATHB31. C11 mrna is not detected by in situ hybridisation on apices of wild-type Col grown for 2 weeks in SD. Upon induction, it is weakly visible after 1 LD and more strongly expressed after 3 LD (Fig. 27 and Fig. 37, A-C). The expression of this gene at +3LD seems to be restricted to regions at the flank of the SAM which correspond to the organ primordia. Although at this stage there are still leaf primordia, rather than floral primordia, this gene could be expressed just before the appearance of the floral primordium itself or during its formation. In addition, ft tsf double mutants do not express this gene at all during 3 LD of induction, demonstrating that it is downstream of the FT/TSF signal (Fig. 37, D-F). Furthermore, hybridisation on wild-type apices after 5 LD shows expression of C11 specifically at the boundary between the meristem and the organ primordia (Fig. 37, G-I). Fig. 38. Phylogenetic relationship in the Arabidopsis zinc finger-homeodomain gene family. The tree (from Tan and Irish, 2006) was constructed with Bayesean analysis, and posterior probabilities were indicated for each branch C11 has close homologues which might play redundant roles with it It was previously reported that loss of function alleles in each of the genes belonging to the same family as C11 do not confer any visible phenotype (Tan and Irish, 2006). The authors concluded that this is probably due to functional redundancy between the members of this family, since they 111
122 Results are quite similar in sequence. Also, in some cases the general expression pattern monitored by RTPCR was similar for some of the members. In addition, protein-protein interaction among some members of this family was detected by yeast two-hybrid (Tan and Irish, 2006). To study C11 further, the members of the gene family that were closer to this gene were chosen, according to their phylogenetic relationship (Fig. 38). RNA probes for these genes were then synthesized, and wild-type apices were hybridised by in situ hybridisation. The closest homologue to C11, which is ATHB21, did not show any visible signal (Fig. 37, J-L) in our conditions. These genes seem to be quite lowly expressed, so maybe it is difficult to detect the expression of some of them by in situ hybridisation. Indeed, in our dataset, ATHB21 is detected only at +3LD, and is extremely lowly expressed (2.3 and 0.8 TPM for replicate B and C respectively) and not detected at all in replicate A. Another gene tested was ATHB25, which is the next closest homologue. This gene is not visible before induction by LD, but its expression becomes visible after 3 LD on the primordia at the flanks of the SAM (Fig. 37, M-O). This pattern is very similar to the the one of C11, further suggesting a possible redundant role with C11. In agreement with this possibility, a strong interaction in the yeast two-hybrid system was found between ATHB31 and ATHB25 proteins. In our dataset, ATHB25 mrna is detected (range TPM), although not clearly up- or down- regulated. Given the possible redundant function played by these genes, and the overlapping pattern of expression of some of them, the strategy of using artificial microrna (amirna) to specifically knock down more than one gene of this family was chosen (Schwab et al., 2006). amirna constructs were designed (see Methods), and two constructs were generated: one targeting ATHB31 and ATHB21 (amirnah21/31), and the other one targeting ATHB25 and ATHB22 (amirnah22/25), both driven by the 35S promoter. At the stage of T1 several individuals, both from the first and the second construct, show a moderate later flowering time compared to the other individuals. A more precise screen, at the level of the homozygous T3 generation, including measuring RNA level for the targeted genes in comparison to wild-type plants, is needed to assign a possible function of this family of genes on flowering regulation. 112
123 Results Fig. 39. Expression pattern of C19 candidate gene. In situ hybridisations were carried out on shoot apices with probes for C19 (A-H) and PGIP2 (I). Apices were from wild-type Col (A, B, C, G, H, I) and ft-10 tsf-1 (D, E, F). Plants were grown 2 weeks in SD and collected at +0LD (A, D), +1LD (B, E), +3LD (C, F, I) and +5LD (G, H). G and H are pictures from two sections of the same plant. Plants were collected at ZT8. Scale bar is 50 μm. 4.6 C19: a LRR protein responding to FT/TSF C19 encodes a protein that was previously named FLOR1, because it was discovered in an assay to isolate proteins putatively expressed in flowers. It was isolated as a possible interactor of AGAMOUS, and the physical interaction between them was tested and confirmed with various techniques (Gamboa et al., 2001). The protein is composed of 326 amino acids and contains a LRR domain. The predicted LRR domain is composed of 10 leucine-rich tandem repeats. It is also annotated as an enzyme inhibiting protein, because of its similarity with a class of inhibitors named polygalacturonase inhibiting protein (PGIP). The signal detected for this gene by in situ hybridisation is very strong. It is present at the SAM, but also in young leaves surrounding the meristem (Fig. 39). The intensity of the signal clearly increases during the floral transition in wild-type plants (Fig. 39, A-C), while in ft tsf double 113
124 Results mutants it remains at a basal level that is comparable to the wild-type before induction (Fig. 27 and Fig. 39, D-F). Interestingly, while in wild-type the expression spreads all over the meristem dome at the third LD (Fig. 39, C), in the double mutant it seems to be restricted in the lower part at the base of the meristem (Fig. 39, F), like in wild-type before induction (Fig. 39, A). This would suggest that the photoperiodic signal also changes the spatial distribution of the C19 mrna causing a broader expression over the central zone and reaching the L1 layer. Interestingly, in wild-type after 5 LD the expression is still strong all over the inflorescence meristem, but the signal is absent from the floral primordia (Fig. 39, G, H). This last feature is also found for SOC1 and FUL transcripts (Samach et al. 2000; Mandel and Yanofsky, 1995a), which are excluded from the floral meristem and strongly expressed in the inflorescence meristem at this stage Loss of function of C19 may influence flowering A line which carries a T-DNA in the C19 locus (SALK_093764) was found in the SALK collection (Alonso et al., 2003). The T-DNA is inserted in the intron between the two exons composing the gene locus (Fig. 40, A). This insertion was confirmed by PCR on genomic DNA and plants homozygous for the insertion were obtained by segregation. RNA was extracted for the homozygous T-DNA line and wild-type Col, and RT-PCR was used to test for the expression of C19 transcript. When primers amplifying the segment of cdna downstream of the T-DNA insertion were used, no transcript was detected, even with high number of PCR cycles, while a clear band is visible for wild-type (Fig. 40, B). Conversely, when primers amplifying the segment of cdna upstream of the T-DNA insertion were used, a transcript was detected, with the same intensity of the product obtained for wild-type (Fig. 40, C). We can conclude that in this line the product of the C19 gene is not entirely transcribed, but is truncated before the second exon. However, we cannot conclude on whether the putative product of this gene is functional in this mutant. These plants do not have an obvious phenotype, although flowering occurs slightly later than wildtype Col, both in LD and SD. However, the difference is only approximately 1 leaf, and within the standard variation of the single individuals (Fig. 41), although reproducible in several experiments. The standard t-test was performed on three independent experiments, to test the statistical difference between the flowering time (as total number of leaves in LD) of wild-type and c19 plants. In one case the difference was not significant (p-value=0.2), while in the other two cases it was either highly significant (p-value=0.02) or nearly significant (p-value=0.055). 114
125 Results Fig. 40. A T-DNA insertion in the C19 locus. Panel A: a scheme of the insertion site in the genomic DNA of C19 locus for the line from the SALK collection. Panel B and C: Electrophoresis gels of products from RT-PCR reactions. wt : cdna from wild-type Columbia. T-DNA : cdna from the line homozygous for the insertion in C19 locus. Number of cycles for the PCR reactions are within parenthesis. Primers used to amplify cdna of C19 were designed downstream of the T-DNA insertion (B) or upstream of the T-DNA insertion (C). Plants were grown in LD and seedlings were collected after 10 days at ZT8, for RNA extraction. Because the pattern of expression of this gene by in situ hybridisation in the inflorescence meristem (Fig. 39) has similarities with the one of SOC1 and FUL, and because the product of this gene has been shown to interact with AGAMOUS, another MADS-box transcription factor, c19 putative mutant was crossed with soc1-2 ful-2 to obtain c19 soc1 ful triple mutant and the other mutant combinations. Flowering time has been scored in LD (Fig. 41). When combined with the loss of function of SOC1 and FUL, c19 mutant adds a slight delay in flowering time, so that c19 soc1 ful is slightly later flowering than soc ful in terms of number of rosette leaves at bolting. Again, this delay is small, but it appears to be enhanced compared to the one between c19 and wild-type. There were few plants to score in this population and the experiment will be repeated to confirm the difference in flowering time. Additionally, flowering time of double mutants c19 soc1 and c19 ful will be scored and compared to the ones of soc1 and ful single mutants, to test whether an effect on flowering is already visible in one of these combinations. A possible redundant function of this gene with homologue genes could mask a clear effect of the loss of function of C19. Nevertheless, PGIP2 and PGIP1, the closest paralogs to C19, are barely detected in the SAM based on our gene expression dataset. This would be in agreement with the role of these genes in pathogen response (Ferrari et al., 2006), therefore not related to flowering. A test was carried out with a probe for PGIP2 by in situ hybridisation on apices, which did not show a clear signal at the SAM (Fig. 39, I). 115
126 Results Fig. 41. Flowering times of Col wild-type and soc1 ful plants carrying c19 T-DNA insertion. Flowering times were scored in LD. RLN: number of rosette leaves. CLN: number of cauline leaves. 4.7 Some bzip transcription factors partially respond to FT/TSF The candidate gene C4 is annotated as a gene coding a bzip transcription factor. Interestingly, the pattern of expression of this gene is very specific for the SAM. Upon shift to LD, its expression level increases, and it is visible not only in the central part of the SAM but also continues laterally toward the pro-vascular tissue (Fig. 27 and Fig. 42, A-C). In ft tsf double mutants C4 mrna level does not show such an increase upon shift to LD, although there is a slight up-regulation (Fig. 42, D-F). Another gene encoding a bzip transcription factor, FD, is known to be important for the floral transition at the SAM, and it is also specifically expressed in this tissue. Therefore, in situ hybridisations were carried out in wild-type Col and ft tsf double mutant with a probe for FD. While in wild-type, as reported previously, there is an increase in expression of FD upon induction to LD (Fig. 42, G-I), in the double mutant the expression level of this gene remained almost constant (Fig. 42, J-L). It was previously shown that in the ft single mutant (in Ler ecotype) FD did not change its pattern compared to wild-type (Searle et al., 2006). It may be that FT and TSF redundantly contribute to up-regulation of FD at the SAM. However, the difference found between our experiment and the one in the ft mutant can be due to different experimental conditions, and to the different ecotype used. 116
127 Results Taken together, these data suggest that some bzip transcription factors are regulated in the meristem via FT/TSF. Fig. 42. Expression pattern of a bzip candidate gene. In situ hybridisations were carried out on shoot apices with probes for C4 (A-F) and FD (G-L). Apices were from wild-type Col (A, B, C, G, H, I) and ft-10 tsf-1 (D, E, F, J, K, L). Plants were grown 2 weeks in SD and collected at +0LD (A, D, G, J), +1LD (B, E, H, K), and +3LD (C, F, I, L). Plants were collected at ZT8. Scale bar is 50 μm. 117
128 Results Fig. 43. In situ hybridisations with candidate genes. In situ hybridisations were carried out using probes for C25 mrna (A-H), or C27 (I-P) on apices from wild-type Col (A-D, I-L) and ft-10 tsf-1 (E-H, M-P). Plants were grown 2 weeks in SD and collected before induction at ZT8 as +0 LD (A, E, I, M), after +1 LD (B, F, J, N), after +3 LD (C, G, K, O), and after +5 LD (D, H, L, P) of induction in LD. Scale bar is 50 μm. 4.8 Several genes are related to the growth of the meristem in response to FT/TSF RNA probes for three genes from the series of candidate genes identified with the clustering approach (see previous sections) were tested again by in situ hybridisation in wild-type Col and ft10 tsf-1 double mutants: C23 (described in the next section), C25, and C27. The time course was extended to +5LD for both genotypes. The expression patterns of C25 and C27 show some similarities. Indeed, upon shift they highly increase their expression progressively in LD, specifically at the SAM, in wild-type apices, while they show no or a very slight increase in the double mutant (Fig. 43). However, C27 is already expressed in the whole apex before shift to LD, while C25 is less expressed. As mentioned before, C25 encodes for an uncoupling mitochondrial 118
129 Results protein (called PUMP1), while C27 for a putative calcium-dependent protein kinase. Particularly, C25 is involved in photosynthesis and the loss of function mutant is impaired in some of the processes related to photosynthesis (Sweetlove et al., 2006). We have shown already several genes tested from the lists of candidates increasing their expression, and many of those are involved in metabolic processes. This is also in strong agreement with our analysis for GO term enrichment on the up-regulated genes. Possibly many genes increase their expression upon shift to LD and then progressively during the LD induction, in relation to the marked growth of the meristem in this condition. In the case of ft tsf, this double mutant is impaired in the response to photoperiod, and its meristem does not grow as much as the wild-type one in response to LD, and thus shows no increase in the expression of those genes. 4.9 An unknown protein induced in the center of the SAM by FT/TSF C23 showed an interesting pattern of expression, since its mrna gives a very strong hybridisation signal only after +3LD of induction, in a specific region at the center of the SAM (see Fig. 30). This region seems to overlap with the one in which WUSCHEL is expressed (Fig. 44, J, K) (Schoof et al., 2000). C23 probe was tested again by in situ hybridisation in wild-type Col and ft-10 tsf-1 double mutants, in a time course extended to +5LD. This experiment confirmed that C23 mrna becomes strongly detectable at +3LD in wild-type (Fig. 44, C, I). At +5LD its expression is also very similar to +3LD, and additionally other regions, most probably axillary meristems forming at the flanks of the main shoot, show detectable expression (Fig. 44, D). Interestingly, in the double mutant no expression is detected, even after +5LD of induction (Fig. 44, E-H). This suggests that C23 responds to a signal triggered by FT/TSF. 119
130 Results Fig. 44. In situ hybridisations with C23 candidate gene. In situ hybridisations were carried out using probes for C23 mrna (A-i), or WUS (J, K) on apices from wild-type Col (A-D, I-K) and ft-10 tsf-1 (E-H). Plants were grown 2 weeks in SD and collected before induction at ZT8 as +0 LD (A, E), after +1 LD (B, F, J, K), after +3 LD (C, G, I), and after +5 LD (D, H) of induction in LD. D and I are pictures of the same plants in different sections. J and K are pictures of the same plants in different sections. Scale bar is 50 μm. 120
131 Results 5. The role of SVP in leaf and meristem and the control of flowering time 5.1 Loss of function of single floral promoter genes does not overcome the early flowering phenotype of svp mutants. The first report of SVP was based on a mutant screen in which loss of function of this gene resulted in an early flowering phenotype (Hartmann et al., 2000). The SVP MADS-box transcription factor was therefore classified as a floral repressor. Later, it was proposed that SVP directly represses FT transcription (Lee et al., 2007b) and thereby prevents flowering. Because FT is transcribed in the leaf upon exposure to LD, SVP would then exert its function in the leaf. According to this hypothesis, mutations in FT should suppress the early flowering phenotype of svp mutants, but actually the effect of an ft mutation in a svp ft double mutant is very mild, and this was shown recently in Col (Li et al., 2008) and Ler (Fujiwara et al., 2008), although a previous report showed a larger effect (Lee et al., 2007b). This could be due to the use of different alleles for the mutants used by the different groups. I repeated these experiments with different and stronger alleles of the mutants. First of all, flowering time was scored for all the available mutants at the SVP locus, such as svp-41, svp-31, svp-32 (in Col) and svp-3 (in Ler), confirming that svp-41 is the strongest allele in Col in terms of early flowering phenotype (Fig. 45, A). Then svp-41 mutant was crossed with ft10 mutant, which carries the strongest loss of function allele for FT in Col, and this confirmed that svp-41 ft-10 double mutants flower only slightly later than svp-41 mutant (Fig. 45, B). This implies that there are other additional target genes regulated by SVP. CO is a key gene in the induction of flowering in the leaf. Loss of function of CO, which causes very late flowering, does not have a strong effect in an svp-41 mutant background (Fig. 45, B). The other plant tissue where SVP could have a role in controlling flowering in addition to the leaf is the shoot apical meristem (SAM). A suggestion that SVP could have a role outside of the leaf tissue comes from its expression pattern. Indeed SVP is also strongly expressed at the SAM, and its expression level in this tissue decreases upon floral transition (Fig. 11), raising the possibility of a role of SVP in blocking the floral transition at the meristem. SOC1, which induces flowering at the SAM, was also suggested to be target of SVP (Li et al., 2008). Nevertheless, loss of function of the SOC1 gene in soc1-2 background has a very mild effect of delaying flowering in the svp-41 mutant, similar to the loss of function of FT (Fig. 45, B). Even a triple mutant svp ft soc1, although flowering later than wild-type, flowers earlier than ft soc1 in Ler background (Fig. 45, C, and 121
132 Results similarly Fujiwara et al., 2008), and remarkably earlier in Col background (Li et al., 2008). Therefore, the scenario is far more complex than SVP having a small number of known targets, and it is probably necessary to combine several mutations in genes promoting flowering in the svp-41 mutant background to suppress its early flowering phenotype. Moreover, if SVP has a role not only in the leaf but also in the meristem, these two functions need to be clearly separated. Therefore, three parallel approaches were chosen: one is based on combining loss of function of SVP (in svp41 mutant background) with loss of function alleles of genes promoting flowering either in leaf or meristem; the second is performing expression analysis on specific genes in different mutant backgrounds; and the third is based on mis-expressing SVP in different tissues in the svp-41 mutant background in order to study the direct effect of this gene on flowering in specific tissues. Fig. 45. Flowering times of plants carrying svp mutant alleles in Col or in combination with other mutations affecting flowering. Flowering time is scored as number of leaves. Col carrying different mutant alleles of SVP (A), svp-41 in combination with ft, soc1 or co in Columbia background (B) and svp-3 in combination with ft and soc1 in Landsberg erecta background (C). RLN: number of rosette leaves. CLN: number of cauline leaves. 122
133 Results 5.2 SVP and the leaf: genetic and spatial interactions Role of SVP in the leaf and its relationship to FT and TSF As discussed before, SVP must have further targets in addition to FT. Particularly, if SVP has a role in repressing flowering in the leaf, an obvious candidate to test is TSF. This gene indeed shares many features with FT, as it is its closest homologue and it acts in part redundantly with FT (Michaels et al., 2005; Yamaguchi et al., 2005). It has been already reported that FT expression levels in svp mutants are higher than in wild-type (Lee et al., 2007b; Li et al, 2008). The levels of FT transcript were checked again by quantitative real-time PCR in the wild-type, svp-41, co-10 and co-10 svp-41 backgrounds using RNA from leaves collected from seedlings grown in LD condition for 12 days (Fig. 46, A). Then, also TSF transcript levels were measured (Fig. 46, B). In addition, a similar analysis was done for SOC1, because it is known that this gene is expressed in young leaves in addition to the shoot apical meristem (Fig. 46, C). In this case the levels of SOC1 transcript were measured by quantitative real-time PCR in wild-type, svp-41, and svp-41 ft-10 backgrounds, using RNA from leaves collected from 10 days-old seedlings grown in LD condition. In addition, the level of FT expression was measured by real-time PCR in meristems of wild-type and svp mutants grown in the same conditions, collecting apices enriched in SAM by manually removing as many leaves as possible, in order to check for the possibility of a direct effect in the meristem of FT upregulation in svp mutants. Under these conditions, FT expression is barely detectable both in wildtype and svp apices (Fig. 46, D). This suggests that the up-regulation of FT in svp seedlings only occurs in the leaf tissue. SOC1, FT and TSF show similar behavior in terms of their expression levels in the leaves (Fig. 46). In all cases, their expression decreases when genes promoting their expression are mutated: FT and TSF mrnas decrease in co mutant background, SOC1 mrna decreases in ft mutant background. Moreover, their expression increases in svp mutants, compared to wild-type. In double mutants, where both the promoter gene and the repressor gene (SVP) are mutated, FT, TSF, and SOC1 mrnas have an intermediate level between wild-type Col and the svp-41 mutant. These data are in agreement with the flowering time data of the corresponding genotypes. Nevertheless, this expression analysis takes into account only one particular time during the day (around ZT8), and does not reflect the complex diurnal expression patterns that all these genes have and therefore describes only a simplified scenario of a more complex situation. 123
134 Results Fig. 46. Quantitative real time PCR of mrna of genes whose expression is altered by SVP in different genetic backgrounds. Panel A and B: seedlings were grown in LD and leaves were collected after 12 days. Panel C and D: Seedlings were grown in LD and leaves or aerial parts enriched in meristems (apex) were collected after 10 days. All samples were collected at ZT8. To have a more precise description of the expression patterns of FT and TSF in the svp background, the diurnal expression patterns of these two genes during a 24 hours cycle under LD was followed in wild-type, svp-41, and svp-41 co-2, with a resolution of three hours (Fig. 47, A, B). FT and TSF show their expected diurnal expression pattern, with a peak at the end of the light period in LD, and another smaller peak just after dawn (Suárez-López e al., 2001; Yamaguchi et al., 2005). This pattern is conserved also in svp background, but the level of expression is higher, especially for the peak at ZT15 (for FT and TSF) and the lower peak at ZT3. Another two independent experiments were performed in the same conditions and they show essentially the same results (data not shown). 124
135 Results Fig. 47. Diurnal patterns of FT, TSF and CO mrna levels in presence or absence of a functional SVP allele, measured by quantitative real time PCR. Seedlings were grown in LD for 10 days and then collected during the following 24 hours. Aerial parts of the plants were used for RNA extraction. Samples at ZT8 were collected in light, samples at ZT24 were collected in dark. Samples at ZT16 (for panel A and B) were collected in light. 125
136 Results In one of these experiments, in which samples were collected at the resolution of 4 hours, CO expression pattern was also tested. No significant difference in the pattern of CO expression was found between wild-type and svp (Fig. 47, C). Therefore, the up-regulation of both FT and TSF is not due to a higher level of CO mrna in the svp background. In addition, FT and TSF expression in the svp co background is very low (Fig. 47, A, B), without the characteristic peaks, indicating that CO is needed for the up-regulation of FT and TSF in the svp mutant. Fig. 48. Flowering times of plants carrying loss of function alleles of SVP, FT, or TSF. Flowering time was scored as number of leaves both in long-days (LD) and short-days (SD). RLN: number of rosette leaves. CLN: number of cauline leaves. All these expression data suggest that SVP represses not only FT but also TSF in the leaf. In order to further test this hypothesis, svp-41 was crossed with ft-10 tsf-1 double mutant and svp41 ft-10 tsf-1 triple mutants were obtained, together with all the other double mutant combinations. Flowering time was scored both in LD and SD conditions (Fig. 48). The effect of the tsf mutation in svp background is minimal (similar to ft mutation), while ft tsf double mutant combinations cause a larger delay in flowering time in the svp background. Nevertheless, the triple mutant still flowers much earlier than the double mutant ft tsf, so the early flowering effect of svp is still very strong. Taken together, these results strongly suggest that SVP has a role in repressing the expression of FT and TSF in the leaf, but the effect of SVP cannot be explained only by repressing these two genes in the leaf. Therefore since activation of FT and TSF are the last known events in the leaf there is likely an additional effect that occurs at the apical meristem. Indeed, the triple mutant is 126
137 Results photoperiodic insensitive, and shows a flowering time similar to that of the svp mutant in SD, which suggests that the early flowering phenotype of svp ft tsf would be dependent on genes that are downstream of FT and TSF, such as SOC SOC1 in relation to SVP, FT and TSF. Because the increase of expression of SOC1 in svp background can be due either to a direct effect of the loss of function of SVP or to an indirect effect of the up-regulation of FT, or to a combination of both, the different contributions on SOC1 expression need to be separated using different genetic backgrounds. Therefore the pattern of expression of SOC1 was investigated in the svp ft tsf triple mutants and compared to that in wild-type, svp, and ft tsf. In situ hybridisations on wild-type Col, as described previously, show that when plants are shifted from SD to LD SOC1 expression in the meristem is dramatically increased, while SVP expression follows the opposite trend (see Fig. 11). The expression of these two genes was followed again by in situ hybridisation on wild-type Col during a time course in LD. Under these conditions SVP starts to decrease in expression in the inflorescence meristem (Fig. 49, A, B) and SOC1 starts to increase at the time of the floral transition (Fig. 49, D, E). At a later stage, SVP is also expressed in the floral meristems arising from the inflorescence, where SOC1 is excluded (Fig. 49, C, F). The two genes thus have an opposite pattern of expression. Fig. 49. SVP and SOC1 mrna expression patterns in wild-type Col plants grown in LD. In situ hybridisations were performed on apices using RNA probes for SVP (A, B, C) or SOC1 (C, D, E). Plants were grown in LD for 10 days (A, D), 12 days (B, E) and 15 days (C, E) and harvested at ZT8. Scale bar is 50 μm. 127
138 Results Fig. 50. Expression of SOC1 mrna in plants carrying loss of function alleles of SVP, FT or TSF. In situ hybridisations were performed on apices using RNA probes for SOC1. Wild-type Col (A, D), svp-41 (B, E), svp-41 ft10 tsf-1 (C, F, G, H) and ft-10 tsf-1 (I) were compared. Plants were grown in LD for 12 days (A, B, C), 15 days (D, E, F), 17 days (G), 20 days (H), and 24 days (I), and harvested at ZT8. Scale bar is 50 μm. Anyway, only from the expression pattern, it is not possible to conclude whether there is a direct interaction between SVP and SOC1, since the increase in SOC1 expression in the meristem could be an indirect effect caused by FT up-regulation in the leaves. It was already observed, both by in situ hybridisation and real-time-pcr (see above), that SOC1 mrna levels in svp ft double mutants are lower than in svp mutants, but even in the absence of FT they were higher than in wild-type (Fig. 46, C). Because this remaining activation could be due to the presence of TSF, svp ft tsf were tested in comparison with svp, wild-type, and ft tsf by in situ hybridization on a time course in LD (Fig. 50). This experiment showed that SOC1 is expressed in svp ft tsf with a delay (Fig. 50, C, F, G, H) in respect to wild-type (Fig. 37, A, D), and with less intensity than in svp single mutants (Fig. 50, B, E). Nevertheless in these triple mutants SOC1 mrna is still clearly detectable at the SAM, and increases progressively during the time course. On the contrary in ft tsf double mutants no SOC1 128
139 Results mrna is detected even later in the time course at 24 LD (Fig. 50, I), but it starts to be detectable at 30 LD (Fig. 51, I). The results from in situ hybridisation match with the flowering time data of the corresponding genotypes, suggesting that the cause of the residual early flowering of the svp ft tsf triple mutants compared to ft tsf both in LD and SD is due to SOC1 expression at the SAM. The svp single mutants flower even earlier in LD than the triple mutant likely because of the additional contribution of FT and TSF. All these results demonstrate that SOC1 is still up-regulated in svp mutant background even in the absence of both FT and TSF function and the photoperiodic cascade is not needed to activate SOC1 in absence of SVP repression. The down-regulation of SVP during the floral transition, coinciding with the up-regulation of SOC1, indicates the presence of a mechanism that represses specifically SVP. Whether this mechanism is based on a response to photoperiod or on developmental changes at the SAM is still not known. In order to get some insight into the mechanism repressing SVP, the expression of this gene was followed by in situ hybridisation comparing apices from wild-type Col with ft tsf double mutants (Fig. 51). In the case of plants grown 2 weeks in SD and then shifted to LD, SVP mrna level decreases during the first 3 LD of the shift (Fig. 11 and Fig. 51, A, B). This decrease does not occur in ft tsf double mutants (Fig. 51, C), and at the third LD the pattern of expression of SVP resembles the one before the shift to LD. However, this experiment focuses on a short time after the shift to LD, and since ft tsf double mutants are not responsive to LD, it could be that SVP does not decrease because these plants are still completely vegetative rather than because FT/TSF are upstream of SVP. Another experiment in which plants were grown directly in LD shows that while SVP clearly decreases in the center of the inflorescence meristem in wild-type Col between 10 and 15 days after germination (Fig. 51, D-F), there is still some remaining expression in the center of the ft tsf inflorescence meristem between 24 and 30 LD (Fig. 51, G, H), even when these mutants start to flower, and when SOC1 is still very weak (Fig. 51, I). However, SVP signal in this case is not very strong, and weaker than in the developing floral buds. Overall the data suggest that SVP repression does not occur as strongly in the absence of FT/TSF, however it is still difficult to determine how direct this effect is and there is clearly some down-regulation of SVP even in the absence of FT/TSF. 129
140 Results Fig. 51. Expression patterns of SVP and SOC1 mrnas in wild-type and ft tsf double mutants. In situ hybridisations were performed on apices using RNA probes for SVP (A-H) and SOC1 (I). Wild-type Col plants were grown for 2 weeks in SD and collected before induction (A) and after +3 LD (B), and ft-10 tsf-1 was also collected after +3 LD (C). Wild-type Col plants were grown in LD for 10 days (D), 12 days (E) and 15 days (F), while ft-10 tsf-1 plants were grown in LD for 24 days (G) and 30 days (H, I). All the samples were harvested at ZT8. Scale bar is 50 μm Mis-expression of SVP in the leaf vasculature In order to monitor the effect of mis-expressing SVP in the leaf, the gene was specifically expressed in the vascular tissue of svp-41 mutant using a heterologous promoter. A SUC2::SVP construct, which uses the SUC2 promoter to specifically express the gene in the companion cells of the phloem (Stadler and Sauer, 1996), was constructed and introduced into svp-41 using Agrobacterium. In Fig. 52, flowering times under LD and SD of 9 independent lines transformed with this construct are shown. There is some variability in the flowering time of those lines, but most of them flower slightly later than the svp mutant, while a few of the strongest ones flower at a similar time to wild-type Col under LD (Fig. 52, A). SUC2::SVP had a weaker effect under SD and most of the transgenic lines flowered at a similar time to svp-41 (Fig. 52, B). The effect of the mis- 130
141 Results expression is then not strong, especially if it is compared with the 35S::SVP line, which overexpresses the gene in every tissue and causes markedly late flowering (Fig. 52, A, B). Fig. 52. Effect of mis-expression of SVP in the leaves. Flowering times of SUC2::SVP mis-expression lines (in svp41 background) were scored in LD (Panel A) and SD (Panel B). SVP and FT mrna levels were measured by quantitative real time PCR (Panel C) in the same mis-expressing lines. The mrnas of the two genes were measured in two separate reactions and plotted in the same graph. Seedlings were grown in LD and collected after 10 days at ZT8 for RNA extraction. 131
142 Results Fig. 53. Effect of reducing SVP expression in the leaves. Flowering time of SUC2::SVP dsrnai lines (in wild-type Col background) was scored in LD (Panel A). SVP and FT mrna levels were measured by quantitative real time PCR (Panel B) in the same lines as in A. The two mrnas were measured in two separate reactions and plotted in the same graph. Seedlings were grown in LD for 10 days and leaves were collected at ZT15 for RNA extraction. Level of expression of SVP and FT has been checked under LD in some of these transformed lines (Fig. 52, C). SVP mrna levels are higher in the lines that show later flowering (e.g. lines 21 and 43), suggesting a direct effect of the mis-expression of SVP on flowering time. FT levels are generally higher in the earlier flowering lines, where the SVP levels are lower, confirming the inverse correlation between SVP and FT expression in the leaf tissue, with only line 39 being an exception to this rule. In general, the effect of SUC2::SVP on flowering was more pronounced in LD (Fig. 52, A), while in SD the effect is milder and very similar among all the independent lines (Fig. 52, B), which is also consistent with a direct effect on FT expression. The effect of decreasing the level of SVP gene expression only in leaf vasculature was also 132
143 Results monitored using RNA interference (dsrnai) constructs targeting SVP driven by the SUC2 promoter and transformed into wild-type Col. Nine independent transgenic lines were identified and some showed early flowering compared to wild-type in LD (Fig. 53) and SD (data not shown), but none were as early flowering as svp-41. SVP and FT mrna levels in leaves were measured from these plants, and again a negative correlation between the two gene products was found, although less clear than in the case of the SUC2::SVP mis-expressing lines and only in some lines. Therefore, the effect of increasing or decreasing SVP in the leaves trough transgenic approaches results in a direct effect on FT expression and on flowering time. However, it suggests that SVP does not only act in the vascular tissue to repress FT. These results are in agreement with genetic data shown in the previous sections SVP and the meristem: genetic and spatial interactions Role of SVP in the SAM and relation to SOC1 and FUL To explore the possibility that SVP also has a role in repressing flowering in the meristem, the effect of the svp mutation on expression of genes that act in the SAM to regulate flowering was also examined. As previously indicated, SOC1 has been already reported to be regulated by SVP (Li et al., 2008). A gene that shares some features with SOC1 is FRUITFULL (FUL). Both genes have been shown to increase at the SAM during the floral transition, around the time at which SVP is down-regulated. Moreover, redundant functions of these two genes were demonstrated by studying soc1 ful double mutants (Melzer et al., 2008). The expression of SOC1 and FUL mrnas were followed by in situ hybridisation on a time course in LD. Wild-type and svp-41 plants grown for LD were collected at ZT3 and hybridised with RNA probes (Fig. 54). Both SOC1 and FUL moderately increase in expression in wild-type Col during the time course, while they show a marked increase in expression in svp mutants for the corresponding time points. Because the mutants were already flowering, compared to wild-type that were still vegetative, and this increase in SOC1 and FUL expression could be indirect due to an increase of the FT levels in the svp background, the level of SOC1 and FUL were compared also in the svp ft double mutant, which flowers later and lacks an active FT. Nevertheless, even in this background the expression of SOC1 and FUL is higher than in wild-type (intermediate between wild-type and svp mutant), suggesting also a more direct effect of SVP on these two genes that is not mediated by FT. On the same genotypes, real time PCR was performed on RNA extracted from 133
144 Results apices (apices enriched in SAM removing older leaves) of seedlings grown under LD condition for 10 days, and the level of SOC1 mrna was measured. This independent experiment demonstrated the same trend as the in situ hybridisation, confirming a higher expression of SOC1 mrna in svp compared to wild-type, and an intermediate level in the svp ft double mutant (see Fig. 46, C). In order to test the effect of SVP on SOC1 and FUL gene expression in the meristem and to investigate the interaction among these MADS-box genes, crosses were done to obtain an svp soc1 ful triple mutant and all the combinations of the loss of function alleles of these genes, both in Col and Ler ecotypes. Double and triple mutants have been obtained and flowering time has been scored in LD and SD conditions for the Col genotypes (Fig. 55). In terms of flowering time, soc1-2 ful-2 double mutants flower as late as the soc1-2 single mutant in LD, therefore with a moderate late flowering phenotype, while in SD they flower extremely late (around 80 rosette leaves and 20 cauline leaves). For most of the individuals the number of cauline leaves in SD could not be scored, since in that condition the plants grow in a very bushy and compact architecture and do not extend the main stem enough before they die. They also show an additional unusual phenotype. When soc1 ful double mutants grow in LD, after they have already flowered and very late in development they show a sort of reversion to vegetative development. Once mature siliques are formed, instead of dying the plants start another vegetative phase on top of the main apex of the plant (Fig. 56), they flower again and repeat this cycle several times. The effect was also recently independently shown by another group (Melzer et al., 2008). The triple mutant svp soc1 ful still flowers earlier than the soc1 ful double mutant. Combining soc1 with ful mutation in svp background slightly delays flowering time in comparison with svp soc1 and svp ful double mutants. Therefore, when combined with soc1 ful, the svp mutation still confers an early flowering phenotype both in LD and SD. 134
145 Results Fig. 54. Expression of SOC1 and FUL mrna during floral transition in presence or absence of a functional SVP allele. In situ hybridisation on a time course in LD using probes for SOC1 (Panels A-K) and FUL (Panels L-V) mrna. Wild-type Col (A-D, L-O) is compared to svp-41 (E-G, P-R) and svp-41 ft-10 (H-K, S-V). Plants were grown in LD for 8 days (A, E, H, L, P, S), 10 days (B, F, I, M, Q, T), 12 days (C, G, J, N, R, U) and 14 days (D, K, O, V). All the samples were harvested at ZT3. Scale bar is 50 μm. 135
146 Results Fig. 55. Flowering times of plants carrying loss of function alleles of SVP, SOC1 or FUL. Flowering time was scored as number of leaves both in long-days (LD) and short-days (SD). RLN: number of rosette leaves. CLN: number of cauline leaves. 136
147 Results Fig. 56. Phenotype of the soc1-2 ful-2 double mutant. Plants were grown in LD (A, B, C) or SD (D). A: general view of the plant architecture after flowering. B and C: detailed view of new vegetative shoots grown on the inflorescences after formation of mature siliques. D: bushy architecture of the double mutants grown under continuous SD. Wild-type Col did not show any of these phenotypes under the same growth conditions (data not shown). Scale bar is 5 mm. These data indicate that as for FT and TSF in the leaf, SVP represses expression of both SOC1 and FUL in the meristem, but the effect of SVP cannot be explained only by the repression of these genes. This result complements our previous results of the role of SVP in the leaf. In addition, it was observed that the svp mutation suppresses the reversion phenotype of the soc1 ful double mutant. Thus in a soc1 ful double mutant SVP must have an important function in facilitating the reversion to vegetative growth observed in these plants Mis-expression of SVP in the meristem The approach of mis-expressing or knocking down SVP in a tissue-specific manner, as seen above for the leaf, was also followed to assess the function of SVP in the meristem. The KNAT1 promoter can be used to express a gene in the SAM (Lincoln et al., 1994). KNAT1::SVP constructs were 137
148 Results introduced into svp-41 mutants and flowering time of 7 independent lines was scored both in LD and SD (Fig. 57). Most of these lines, similar to mis-expression with SUC2 promoter, show a slightly later flowering compared to svp-41 under LD, which does not fully complement the loss of function of SVP. In this case, the effect of KNAT1::SVP on flowering in SD is stronger than the effect of SUC2::SVP (see above), consistent with a role of SVP in repressing genes at the meristem such as SOC1, which has a major role in floral induction. Fig. 57. Effect of mis-expression of SVP in the shoot apical meristem. Flowering time of KNAT1::SVP misexpression lines (in svp-41 background) was scored in LD (Panel A) and SD (Panel B). Interestingly, most of the KNAT1::SVP lines show an additional floral phenotype. A variable number of flowers, depending on the line and on the growth condition, have additional organs, such as 5-6 sepals, and petals. An example is given in Fig. 58 for line 5, which shows the strongest floral phenotype and the latest flowering in SD. Because KNAT1 should be expressed only in the SAM (Lincoln et al., 1994), a floral phenotype was not initially expected. However, although KNAT1 transcript was not detected in sepals, petals and 138
149 Results stamens, it was detected in cells encircling the base of the floral primordia (Lincoln et al., 1994). It may be that this effect is caused by a deregulation of the KNAT1 promoter itself in the svp mutant background, which would lead KNAT1::SVP to be expressed in the floral meristem causing floral abnormalities. The expression of SVP was followed by in situ hybridisation comparing wild-type Col, svp-41 and most of the KNAT1::SVP lines (Fig. 59). Plants were grown in LD for 10 days and collected at ZT8. Wild-type apices show the typical strong expression of SVP in the SAM before floral transition (Fig. 59, A), while svp-41 mutants are already flowering and show a residual weak expression of SVP transcript at the floral primordia (Fig. 59, B). This signal is probably caused by the fact that this mutant allele is generated by a transposon and part of the coding sequence could be still transcribed, although not functional. The KNAT1::SVP lines are in different developmental stages, from vegetative (for example Fig. 59, C, D, G) to a flowering stage very similar to the one of svp mutants (Fig. 59, F, I). For most of the lines, the situation depicted in the in situ hybridisations correlates with the corresponding flowering time of these lines, especially for the data in SD. Line 5 is the only one with a convincing strong expression of SVP at the SAM, while the others mainly show expression near or on the floral primordia. It is not then clear whether this expression is caused by KNAT1 promoter in the SAM, by the deregulation of KNAT1 in the flowers, or if this is the residual expression of SVP that is present in the svp-41 background. Fig. 58. Effect on the flowers of mis-expression of SVP by KNAT1::SVP. Examples from KNAT1::SVP (in svp-41) line #5 are shown. Flowers with 5 petals (D), 6 petals (E, F), and 7 petals (A, B, C) are shown. Scale bar is 3 mm. 139
150 Results Fig. 59. SVP mrna expression in KNAT1::SVP lines. In situ hybridisations with RNA probe for SVP mrna were performed to detect the level of expression and the spatial pattern of SVP transcribed under the KNAT1 promoter. Wildtype Columbia (A), svp-41 (B), and KNAT1::SVP (in svp-41 background) lines #1 (C), #2 (D), #3 (E), #4 (F), #5 (G), #8 (H), #10 (I) are compared. Plants were grown in LD for 10 days and apices collected at ZT8. KNAT1::SVP dsrnai constructs expressed in wild-type Col seem to have a weak effect on flowering time (Fig. 60). It could be that the KNAT1 promoter is not strong enough to have a significant effect on silencing SVP. The level of expression of SVP mrna at the meristem of these lines was not measured. Additionally, UFO::SVP dsrnai constructs were also generated. UFO is another promoter that has a specific expression pattern in the meristem and in flowers (Ingram et al., 1995), although it is more expressed in the later phases of the floral transition. It is therefore useful for expressing genes in the floral meristem. One of the UFO::SVP dsrnai lines shows slight early flowering in LD, but because only two lines were generated, there is not strong support for this effect (Fig. 60). Nevertheless, considering that only a few of the KNAT1::SVP dsrnai line showed early flowering, this suggests again that the weakness of the KNAT1 promoter may be a 140
151 Results problem. This, together with the possible de-regulation of the KNAT1 promoter itself in the svp-41 background, which will be further investigated, suggests that it would be better to test also another independent promoter to express SVP specifically in the SAM. Mis-expression of SVP was then performed also with the FD promoter. In order to test the efficiency of the FD promoter to express flowering time genes at the SAM, the same vector was used to produce a FD::FT promoter fusion, and transformed into wild-type Col. Several lines transformed with this construct at T1 stage show early flowering phenotype (data not shown), demonstrating the effectiveness of this construct and postulating a possible alternative for the mis-expression of SVP in the SAM. FD::SVP in svp-41 background, at the level of T1 transformants, did not show a clear effect on flowering. The effect of these constructs need to be further investigated in the T3 generation. Fig. 60. Effect of reducing SVP expression in the shoot apical meristem. Flowering times of KNAT1::SVP dsrnai (in wild-type Col background) lines were scored in LD (Panel A). Additionally, flowering times of UFO::SVP dsrnai (in wild-type Col background) lines were scored in LD and SD (Panel B). 141
152 Results Fig. 61. Flowering times of wild-type and mutants scored after double shift experiments. Plants were grown initially in short days (SD) for 2 weeks (except for svp-41 (Panel A), which was grown for 1 week in SD), shifted to long days (LD, the number of LDs is indicated in the X axis) and then shifted back to SD. Flowering time was scored as number of rosette leaves (RLN) plus number of cauline leaves (CLN), and percentage of induction was calculated with a formula described in the Methods Double shift experiments with mutants in flowering time genes As previously introduced, wild-type Col plants grown for two weeks in SD need 5 LD of induction to be fully committed to flower and 3 LD to be only partially committed, thus accelerating their flowering time compared to plants only grown in SD. It has also been shown how several parameters can affect the number of days required for a plant to be induced or committed to flower. Another example of altering this response is to use mutants instead of wild-type plants in these experiments. Plants carrying mutations in genes required to promote or repress flowering might also 142
153 Results have a different response to LD in terms of floral commitment compared to wild-type. Both cases of loss of components of the photoperiodic signal from the leaf or loss of components of the response to the signal in the meristem might affect this response. Mutants lacking a functional SVP gene flower earlier than wild-type, and they respond faster to induction by LD. A functional SVP gene, which is a strong repressor of flowering, is probably a decisive factor in delaying the commitment to flower, as suggested by the SVP expression pattern in double shift experiments shown before (Fig. 13, Fig. 14). Indeed, in our conditions svp-41 mutants grown only one week in SD needed exposure to only 3 LD to be fully committed to flower and needed only 1 LD to accelerate flowering. Although this experiment shows that the meristem responds earlier in the svp mutant compared to wild-type, it does not explain whether this is due to a stronger inductive signal coming from the leaf or to a higher sensitivity of the meristem to the stimulus from the leaf, or to both. In all cases, lack of repression from SVP decreases the threshold required for the response, either acting in the leaf or in the meristem, or in both. Double shift experiments were performed with soc1-2, ful-2, soc1-2 ful-2, svp-41 soc1-2 ful-2 plants, to study the role of SOC1 and FUL in contributing to the effect of the svp mutation on the commitment to flower. ft tsf double mutants and svp ft tsf triple mutants were not used to study the contribution in the leaf, because they are not sensitive to photoperiod so a transient exposure to LD would not have a significant effect on flowering time. Moreover, the standard 2 weeks of vegetative growth in SD before the LD induction could not be used for the svp mutant because the flowering processes are highly accelerated in this background and so that these mutants would already show a partial induction before the shift. So only 1 week in SD was used for this mutant, while 2 weeks were used for the other ones. The response of the different genotypes was compared using the protocol introduced in section (see also Methods). In one experiment, wild-type Col, svp and soc1 ful genotypes are compared. As expected, svp responds to fewer LDs than wild-type, while soc1 ful shows the opposite effect. Surprisingly, while the double mutant does not exhibit a strong delay in flowering when shifted permanently to LD, it only responds weakly to transient exposure to LD, at least until 7 LD in our condition (Fig. 61, A). In another experiment wild-type Col, soc1, ful, soc1 ful, and svp soc1 ful were compared (Fig. 61, B). soc1 single mutants are significantly less responsive than wild-type, since 9 LD are needed to have a complete response. Conversely, ful mutants are more responsive than soc1, although less than wild-type. This is in agreement with the flowering time phenotype of these mutants. soc1 ful double mutants, like for the flowering time in LD, show a synergistic effect compared to the single mutants. But again, although 143
154 Results in this experiment also 9 LD of transient induction were included, there was a strongly reduced effect of a transient induction in LD compared to SD. This is in agreement with the idea that these two genes play redundant roles in the response to photoperiod at the SAM. svp soc1 ful triple mutants are able to recover a higher degree of induction compared to soc1 ful double mutants, since after 5 LD the plants behave similarly to wild-type. The triple mutants have increased levels of FT mrna in the leaf, due to the loss of SVP, but this may not be the direct cause of the higher response. Indeed, soc1 ful double mutants induced with more LD, resulting in more FT expression, do not respond once shifted back to SD. Moreover, the effect of over-expressing FT in soc1 ful double mutants did not have a strong effect on flowering (Melzer et al., 2008). So it seems more likely than in the triple mutant the induction to LD is restored by a gene or a set of genes that are up-regulated at the SAM in svp background and can partially suppress the requirement for SOC1 and FUL. These results are clearly not fully conclusive, but suggest that SVP has a major role at the SAM in delaying floral commitment. Such an effect is consistent with the reduced reversion phenotype observed in svp soc1 ful plants compared to soc1 ful (see section 5.3.1). 5.4 Dual role of SVP: leaf and meristem In the previous sections, it was shown that the effect on flowering time of SVP when active only in the leaf or only in the meristem is mild, although significant. The mild effect on flowering of SVP when active in only one of these tissues could be due to it having an additive effect in both tissues to completely fulfill its function. To test this idea mutations in genes acting downstream of SVP either in the leaf or the meristem were combined in the svp background. Also the transgenic lines mis-expressing SVP in the leaf were crossed to those mis-expressing SVP in the meristem Quintuple mutant A soc1 ful double mutant grown in SD condition does not express FT and TSF, because these genes are only induced in LD. A svp soc1 ful triple mutant in SD shows only a weak expression of FT and TSF, due to relieving the repression by SVP. However, this up-regulation is not strong, since svp mutants and svp ft tsf triple mutants show only a mild difference in flowering time in SD, of around 5 leaves (see above). Perhaps therefore svp soc1 ful triple mutants grown in SD would flower late. However, this triple mutant in SD is still remarkably earlier than the soc1 ful double mutant (Fig. 55). Therefore introducing svp mutation into soc1 ful double mutants suppresses the late flowering 144
155 Results phenotype. To test whether this might be due to FT and TSF the quintuple mutant svp ft tsf soc1 ful was made. The svp-41 ft-10 tsf-1 plants were crossed to svp-41 soc1-2 ful-2 in order to generate a quintuple mutant svp-41 ft-10 tsf-1 soc1-2 ful-2 and the other mutant combinations in the svp background. Moreover, ft-10 tsf-1 were crossed to soc1-2 ful-2 in order to generate a quadruple mutant ft-10 tsf1 soc1-2 ful-2 and the other mutant combinations in the presence of a functional SVP gene. Only a few individuals homozygous for the 5 mutations were identified, therefore a complete flowering time experiment could not yet be performed. However, the estimated average number of total leaves at flowering for this quintuple mutant was around (Fig. 62). We still do not have a ft tsf soc1 ful quadruple mutant to compare with the quintuple, but we already generated a triple mutant ft tsf soc1. The triple mutant flowers with around 70 total leaves (Fig. 62), so even later than ft tsf. Since we do not expect ft tsf soc1 ful quadruple mutants to flower earlier than ft tsf soc1, we assume that the svp ft tsf soc1 ful quintuple mutant would flower earlier than the ft tsf soc1 ful quadruple mutant, at least by 5-10 leaves. We can then conclude that SVP has further other targets in addition to FT, TSF, SOC1 and FUL, and other genes need to be mutated to fully suppress early flowering in an svp background. Fig. 62. Flowering times of plants carrying loss of function alleles of SVP, FT, TSF, SOC1 or FUL. Flowering time was scored as number of leaves both in long-days (LD) and short-days (SD). RLN: number of rosette leaves. CLN: number of cauline leaves. 145
156 Results Fig. 63. Combined effect of mis-expression of SVP in leaves and meristem. Flowering time was scored for wild-type Col, svp-41, 35S::SVP, SUC2::SVP and KNAT1::SVP (in svp-41 background) mis-expression lines, and SUC2::SVP crossed to KNAT1::SVP (F1, in svp-41 background). S and K indicate SUC2 and KNAT1 respectively. Panel A: flowering time was scored in LD. Panel B: flowering time was scored in LD and SD Combined effect of mis-expression In order to cross SUC2::SVP lines with KNAT1::SVP lines, 3 independent lines made with each of the constructs were selected and they were crossed in all possible combinations (only one of the combinations failed). The parental lines were selected based on the expression of the transgene and 146
157 Results on the late flowering time phenotype, considering both LD and SD conditions. Flowering time was scored both in LD and SD for the parental mis-expressing lines and the F1 progeny of the crosses between the different parental lines, together with svp-41 mutant and wildtype. Because both SUC2::SVP and KNAT1::SVP are in svp-41 background, the F1 progeny of the crosses can be used to test the effect of combining the two transgenes. Also the transgenes exert a dominant effect in heterozygosis. The flowering times of some of the parental mis-expressing lines were also previously compared to 35S::SVP (see Fig. 52, A, B, and Fig. 63, A). Combining the two transgenes resulted in significantly later flowering compared to the parental lines, for the vast majority of cases. In LD, this effect is comparable to the effect of over-expressing SVP using the 35S promoter, and for most of the F1 crosses results in slightly later flowering compared to wild-type Col (Fig. 63, B). In SD, conversely, none of the combinations of transgenes led to the strong effect of the 35S ectopic expression, and all the lines flowered significantly earlier than wild-type Col (Fig. 63, B). However, all lines carrying combinations of transgenes were much later than svp-41 mutants. This result shows that combining the mis-expression of SVP in leaf and meristem has an additive effect. This complements all the previous results and further demonstrates an independent role for SVP in the leaf and in the meristem to control flowering time. The combination of transgenes in the F1 generation completely restores the effect of SVP in LDs, while it partially restores it in SD. Selection of progeny of F2 plants homozygous for both the trangenes will clarify if this partial effect is due to a quantitative effect of SVP expression in the svp-41 background. 5.5 Mis-expression of SVP.2 in different tissues In TAIR database (version 9) there are two splicing variants annotated as products of SVP. Together with the conventional form used in the current literature as the product of SVP, there is another one which was also found from cdna libraries. This alternative splicing variant is referred to here as SVP.2. This form is longer than the previous one, because it includes an intron (between exon 6 and 7). Within this intron there is a stop codon in frame with the coding sequence so that the predicted protein product is truncated before it reaches the following exon (see Fig. 64, A). In this truncated protein the last part of the K-box domain and the C-terminal part of SVP would be missing. We tested whether this form has a biological significance and possibly a function in the floral transition. As for the conventional SVP, SVP.2 coding sequence was cloned into binary vectors under the 147
158 Results control of different promoters: 35S promoter for ectopic expression, SUC2 promoter for the leaves, and FD promoter for the meristem. svp-41 mutants were transformed with these constructs and 20 independent lines carrying the transgene were obtained for each of the constructs. Only preliminary results were obtained, because only the 35S::SVP.2 was followed so far. At the T2 stage, among the different independent lines there is a significant variation in flowering time. While the majority of transformants are similar to svp-41 mutants, a few lines flower significantly later than svp-41 (Fig. 64, B), although far less than 35S::SVP over-expressing lines. Further analysis is needed to characterize the function of this second splicing form of SVP. Fig. 64. Alternative splicing of SVP gene. Panel A: The coding region of the SVP genomic locus is shown on top. The two alternative splicing forms as indicated in TAIR database are indicated below, as SVP.1 (the conventional form) and SVP.2 (another for present in TAIR based on EST collection). The scheme was taken from Gbrowse in the TAIR database (Poole, 2007) and adapted. Panel B: SVP.2 form was expressed under the 35S promoter in svp-41 background. Two lines are shown among all the independent transgenic lines, an early flowering one (line #5) and a later flowering one (line #2). 148
159 Discussion 6. Discussion PART1 6.1 Known genes and novel mechanisms that regulate the floral transition A global gene expression profiling of the Arabidopsis SAM during the floral transition was performed in this study. The general aims were to identify genes that were not previously known to have functions in floral induction and to place these within a temporal hierarchy of events in the SAM. Prior to the sampling, a detailed analysis of the stages of the floral transition was done. Indeed, while for example for flower development a detailed description of the various stages has been compiled (Smyth et al., 1990), together with a thorough knowledge of the molecular markers of the different stages, a similar formalization is still lacking for the floral transition. Previous indications of the expression kinetics of known genes, such as SOC1, FUL, AGL24, FD, SVP and AP1 have been confirmed in this study and some information further extended. Particularly, a combination of expression studies on key genes upon shift from SD to LD, and flowering time results of double shift experiments have better defined the stages involved in the floral transition and the boundaries of this process. A transition meristem is an intermediate state between the vegetative meristem, which did not initiate floral induction, and an inflorescence meristem, which is already induced and bears floral meristems on its flanks. A transition meristem can still be reverted to a vegetative meristem by removing the inductive photoperiod, although I demonstrated that it retains some memory of exposure to inductive conditions, depending on the level of induction. Because my interest in floral induction includes this transition meristem state, I set up a system in which it is possible to induce this state by shifting plants grown for 2 weeks in SD to 1 or 3 consecutive LDs. Exposure to 1 LD activates FT expression in the leaf (Corbesier et al., 2007) but only a few molecular events connected to floral induction are induced in the meristem, without any consequence on flowering time. 3 LD partially activates the floral transition. Exposure to an additional 2 LD cause this meristem to be fully committed to flowering at +5 LD, and to reach the inflorescence state with production of floral meristems. So far, two main families of transcription factors have been shown to play a role in the floral transition at the SAM, the MADS-box (Melzer et al., 2008; Michaels et al., 2003; Samach et al., 2000) and SPL families (Fornara and Coupland, 2009). In the MADS-box family, SOC1 and FUL play key roles in the response to the inductive photoperiod at the SAM. Activation of expression of both genes depends on FT and FD (Schmid et al., 2003; Searle et al., 2006; Wang et al., 2009a), 149
160 Discussion although it is not known how direct this activation is. In our experimental conditions soc1 ful double mutants are still responsive to LD and their late flowering phenotype in LD is quite mild (around 10 total leaves more than wild-type) suggesting that although these genes are expressed early during the floral transition other genes that can partially compensate for their loss of function are also expressed at this time. AP1 is another MADS-box gene, and it is considered to be a direct target of FT and FD (Abe et al., 2005; Wigge et al., 2005). However, AP1 is not a flowering time gene per se, because ap1 mutants are not late flowering, rather it plays a function in the determination of the floral meristem and in the establishment of the early floral organs (Irish and Sussex, 1990; Mandel et al., 1992). This conclusion is consistent with its expression pattern, which is specific to floral meristems. The last MADS-box gene is AGL24, which is also involved in the floral transition, but its role in response to photoperiod seems to be less clear and more accessory to the function of SOC1 (Liu et al, 2008; Michaels et al., 2003; Yu et al., 2002). In this study, I showed that SOC1 and FUL expression patterns differ in their response to photoperiod. While SOC1 decreases in expression once induced plants are shifted back to noninductive conditions, FUL expression is stably maintained once the meristems are committed to flower, regardless of the photoperiod. This is a new aspect, because there are not any other reports on flowering time genes that are stably maintained during the floral transition when inductive conditions are removed. On the other hand, this has been reported for floral meristem identity (Adrian et al., 2009), where positive loops sustain the expression of meristem identity genes once they are activated, (like the loop AP1-LFY (Bowman et al., 1993; Liljegren et al., 1999; Wagner et al., 1999)), thereby avoiding floral reversion. In addition, feedback regulation suppresses genes that confer inflorescence activity ensuring these are not expressed in floral meristems and avoiding reversion (like AP1 to TFL1/AGL24/SOC1/SVP/FUL (Liljegren et al., 1999; Liu et al., 2009a; Mandel and Yanofsky 1995a; Ratcliffe et al., 1999)). Similarly, floral activity is suppressed in the inflorescence meristem to avoid floral termination (like TFL1 to AP1 (Ratcliffe et al., 1998)). The only known positive loop in the case of the floral transition is the one involving SOC1 and AGL24 (Liu et al., 2008), but the in situ hybridisation analysis suggested that this loop is not maintained in our experimental conditions in the absence of inductive photoperiods. A role for FUL and SOC1 in determination and maintainance of floral induction has been proposed on the basis of the phenotype of soc1 ful double mutants, in which a phenotypic reversion to vegetative growth occurs after flowering (Melzer et al., 2008). I independently confirmed this effect. It can be related to the results of my double shift experiments in which the soc1 ful double mutants never acquired stable floral 150
161 Discussion induction upon transient exposure to up to 9 LD, while the soc1 and ful single mutants are only delayed compared to wild-type. Experiments with more than 9 LD of transient induction are needed to exclude the possibility that soc1 ful is only further delayed compared to the single mutants. Particularly, ful mutant is only slightly delayed, while soc1 responds later. This, together with the results of the in situ hybridisation on wild-type plants in double shift experiments, suggests that SOC1 is more important to rapidly respond to LD induction, while FUL is required to stably maintain this induction at the meristem. This model implies that there should be a mechanism to maintain FUL expression when the plants are returned to SD non-inductive conditions, which is not true for FT or SOC1. Such a role could be played by AGL24. Indeed, it remains to be determined whether there is an interplay between FUL and AGL24, which would maybe better clarify how the transition meristem is fully committed to the production of flowers. Moreover, the stable decrease of SVP mrna in the SAM at the commitment stage might be important in allowing the increase of FUL expression. Again, we do not know what is the upstream mechanism that drives the downregulation of SVP. The other possible candidate as a positive regulator of FUL at this commitment stage is SPL3, since it has been shown to directly activate FUL (Yamaguchi et al., 2009). The SPL genes also play important roles in the floral transition, inducing floral meristem identity genes. In addition, they respond to photoperiodic induction, although they are probably only accelerated in their function by FT/FD, and not dependent on them. They are more important for the age dependent pathway, which acts in parallel to the photoperiodic pathway (Wang et al., 2009a). It is very likely that many other regulatory genes are involved in the floral transition at the SAM, while in addition most of the genes regulated by SOC1, FUL and the SPLs remain to be identified. Many genetic screens carried out in the last years failed to identify new genes involved in the floral transition at the SAM and activated in response to FT. These difficulties could be due to these putative genes having only a minor effect on flowering when inactivated. This could be because they play a relatively minor role in the floral transition, that they have family members that are genetically redundant or they might be important for earlier steps in plant development and have been excluded in genetic screens because of the pleiotropic effect of the mutations. 6.2 Next-generation sequencing for global gene expression analysis Global gene expression analysis performed by next-generation sequencing on laser-dissected material was a challenging experiment. This was one of the first examples of this kind of approach, and at the time that the experiment was set up and performed, there was no other attempt reported in 151
162 Discussion literature. Therefore, many of the technical steps were still not optimised, from how to recover suitable RNA and DNA material for the sequencing, until the bioinformatics and statistics to analyze the data. The latter part relating to quantification of gene expression is still under development in the scientific community (Wang et al., 2009c; Wilhelm and Landry, 2009). Despite these difficulties the approach has the advantages of analyzing gene expression specifically in the meristem and utilizing the extreme sensitivity of Solexa sequencing. The output of this experiment is a gene expression profile, in which much of the data show correlation in terms of biological replicates, a good correlation with previously published data and allowed the confirmation of newly identified genes with interesting temporal and spatial expression patterns Comparison with available microarray data Comparing my dataset with the microarray data previously published for shoot apices (Schmid et al., 2003), identifies both interesting similarities and differences. Comparison of different global gene expression experiments is difficult, even if performed in a similar way, due to the variability caused by different experimental conditions (Allison et al., 2006; Grant et al., 2007). In this case, the experiments have also some intrinsic differences, such as a different time in which the plants were grown in SD before shift to LD, the difference in the tissues collected and methods for sampling the tissue, different procedures for extraction and amplification of the RNA, and finally a different technology for gene expression analysis and statistical procedures for data analysis. Moreover, the focus of the previous report was on the late stages of floral induction, at +7 LD after shift, by which time floral primordia are already present. Very few genes, even considering the time point +3 LD after the shift for both datasets, have a similar pattern in both datasets. Examples of similarities are SOC1, FUL, and SPL9. Several genes closely similar in sequence to other members of the same family, such as the SPL3-4-5 or AGL42, were not identified by our approach probably because the reads corresponding to these genes led to an ambiguous assignation, and were considered promiscuous tags so that they were discarded. The number of genes identified as differentially expressed by the two approaches is quite similar. In the microarray, for the comparison between time point +0 LD and +7 LD the top 500 genes were considered for both Ler and Col experiments. Those common between the two ecotypes were recovered, resulting in a total of 332 genes, 101 up-regulated and 231 down-regulated. I show, with the final clustering approach, 339 genes up-regulated and 82 down-regulated, which is in the same range. However, in their case the quantity of down-regulated genes is larger than the up-regulated, 152
163 Discussion while in my case the trend is opposite. Interestingly, using the same cut-off in the microarray data, comparing +0 LD to +3 LD instead of +7 LD, results in a lower number of differentially expressed genes (about half). Importantly, many genes that I identified as differentially expressed, showed a ratio of around 1 in expression between time points +3 LD and +0 LD in the microarray experiment, so that those genes were not identified as differentially expressed in that experiment. This could be due to the greater specificity of the LCM in sampling the SAMs, which prevented a dilution of the meristem tissue in the whole apex. SOC1 and FUL are exceptions to this phenomenon, as they were identified also in the microarrays. In addition to their spatial pattern of expression, which extends to the leaves as well as the SAM, this is probably due to the very strong up-regulation of SOC1 and FUL mrnas in the SAM, so that a dilution of their signal in the entire apex does not prevent their identification. Another exception was C23, which is also up-regulated in the microarray data, again probably because of the strong up-regulation of this gene in the central region of the SAM. However, this gene is considered as up-regulated only at + 3 LD, while in the later time points this up-regulation is not significant General features of the data A set of genes that shows a consistent change in expression upon photoperiodic induction was identified. Some of these were chosen as candidates and also tested by in situ hybridisation. For the up-regulated genes, some of them were confirmed by this method. For the down-regulated genes, none of them showed a convincing pattern by in situ hybridisation (data not shown). There are many possible explanations for this difference. One possibility is that the level of detection by in situ hybridisation for all the down-regulated genes was very low. Another possibility is that some of them were false positives. Anyhow, it seems quite challenging to find genes that consistently decrease in expression upon floral transition using our method. Indeed, no genes are so far known to be strongly decreased in expression at this stage. SVP is considered to be down-regulated, but only locally, and its transcript is re-distributed on the flanks of the SAM (Hartmann et al., 2000). Consistent with this its expression value is overally constant in my dataset. SMZ and SNZ, which were identified as down-regulated from the apex RNA microarray data (Schmid et al., 2003), were later shown to be genes mainly acting in the vascular tissue of leaves (Mathieu et al., 2009). The presence of putative false positive down-regulated genes in my dataset could be due to an artifact of the RNA amplification process. Indeed, those genes present a high number of counts in +0LD 153
164 Discussion sample and very low or even 0 in the +3LD sample. Because the +0LD is the sample with least initial material, less quality in terms of data, and which suffered more of the bias of the amplification procedure, it could be more prone to produce unbalanced values for some genes, leading to very high values in the +0LD sample. 6.3 Classification of the genes selected from the dataset Analysis of the gene expression data from the SAM transcriptome dataset and the further studies by in situ hybridisation for some known and some selected novel genes revealed different patterns of gene expression following the shift from non-inductive SD to inductive LD photoperiod. Genes identified as differentially expressed can be classified according to different criteria: - response to the photoperiod: how quickly their expression changes upon shift to LD - spatial pattern of expression: where they are expressed, how the pattern changes upon induction, how specific the signal is for the meristem - molecular function and biological process in which they are involved - response to FT/TSF: whether their up-regulation is dependent on FT or TSF function These issues are described in the following sections. 6.4 Time of the response to the inducing photoperiod My major interest was to identify genes induced during the early events of the floral transition. Several genes were found to be up-regulated already after the first LD of induction, although the exact number depended on the criteria used to define up-regulation. All of these genes are potential targets of the very early photoperiodic activation at the SAM, either responding directly to FT protein or to some other signal. SOC1 follows this response, as shown by several reports, and this was confirmed also by this study. Indeed, SOC1 activation is also dependent on FT and FD (Searle et al., 2006). FUL should follow the same pattern (Schmid et al., 2003), although in our conditions it is less strongly induced during the first LD, as demonstrated by in situ hybridisations and data from the transcriptome analysis. Therefore, it is also important to take into account the genes that increase in expression only after 3 LD of induction, because some of them may require more time to respond, depending on which threshold has to be reached for their activation. Indeed, although FT is already up-regulated upon shift to LD, 3 LD are necessary to activate a complete floral induction in Ler, and FT mrna level in the leaves increases progressively during the 3 LDs (Corbesier et al., 2007). This gradual accumulation of the FT transcript, which would lead to the accumulation of FT 154
165 Discussion protein at the apex, correlates with the gradual increase of SOC1 mrna in the apex, and with the fact that AP1 is activated even later, presumably after 3 LD in Ler and 5 LD in Col, although AP1 is a direct target of FT/FD. Moreover, activation of genes at +3LD rather than +1LD may be an indirect effect of FT activating early acting genes like SOC1 or FUL. This would be remarkable since not so much is known about target genes of SOC1, besides LFY (Lee et al., 2008b) and probably the CBF genes (Seo et al., 2009). Similarly almost nothing is known about targets of FUL, although it was reported that LFY expression may also depend on this gene (Ferrándiz et al., 2000). Interestingly, from the gene expression data, most of the selected candidate genes showed a similar up-regulation from +0LD to +1LD and from +0LD to +3LD, which means that the major up-regulation occurs during the first LD, and this is in agreement in most cases with the results of the in situ hybridisations. Nevertheless, for some genes the signal in the in situ appears later, at +3LD, suggesting that these genes are likely activated later during floral induction. Typical case is C11, which is lowly expressed and restricted to the primordia area. In the case of genes with very low expression levels, it can be useful to probe a later time point such as +5LD, because if there is a progressive increase in its expression under LD, there is more chance that the transcript is detected after 5 LD. Moreover, this revealed more clearly the expression pattern of some genes, that have to reach that developmental stage of the floral commitment to clearly show their specific pattern. Our global gene analysis did not include +5LD but some selected genes were tested at that stage and this should be repeated for all of them. Other genes respond later at +3LD, and there was agreement between the expression data and in situ hybridisation. For example D13 and C23 mrnas increased already at +1LD, but the upregulation at +3LD is much higher. C23 could be a possible target of SOC1 or FUL, and this needs to be tested. D13 does not seem to be a target of SOC1 and FUL, because it is up-regulated independently of FT and TSF, which are upstream of SOC1 and FUL. Indeed, in the ft tsf double mutant, when D13 strongly increases in expression at +3LD, very low mrna level of both SOC1 and FUL is present. 6.5 Spatial pattern of expression Several patterns of gene expression were described by in situ hybridisation experiments in this study, both for known and previously undescribed genes (see Fig. 65 for a scheme). The typical pattern of expression for genes implicated in floral promotion is a broad expression in the whole 155
166 Discussion dome of the SAM upon induction. This pattern is shown by SOC1, FUL and AGL24. SVP is also broadly expressed, and then it disappears from the center of the SAM upon floral induction. SPLs are emerging as genes with a more complex expression pattern, probably because they regulate several processes and are also related to juvenile/adult vegetative trait transitions (Fornara and Coupland, 2009). AP1, which marks the beginning of the floral meristem, and its homolog CAL, have a restricted pattern in the floral meristem, and these genes are not involved in the transition from the vegetative to the inflorescence meristem but are expressed after this has occurred (Kempin et al., 1995). Interestingly, while some novel genes found in this screen have a similar expression pattern to SOC1 (D37, D55, D31, C25, C27), some of them show differences. C11 is expressed in a restricted region at the primordia before the floral meristems arise, and subsequently in the boundary with the floral organ. C4 is expressed broadly but excluded from the most external layer L1 (and maybe L2). Strikingly, C23 and D13 are expressed in the center of the transition meristem (Fig. 65), in a region that is included within the central zone (Lyndon, 1998). This results in a novel pattern, because although genes like WUS are expressed in this region (Schoof et al., 2000), they are already present at the vegetative phase of the SAM. TFL1 is the only flowering-related gene known to be expressed specifically in that part of the inflorescence meristem, although it is also already expressed at the vegetative phase (Bradley et al., 1997). This suggests there might be an interaction between TFL1 and these novel genes, as they at least function in a common tissue and at the same stage. These possible interactions still have to be tested at the expression and genetic levels. C23, a gene encoding an unknown protein, is especially interesting because its mrna seems to be restricted only to that particular region, and only upon floral induction, while D13 for example is expressed also in external layers of the youngest leaves in the apex. Additionally, the strong signal of C23 disappears in the absence of FT and TSF, suggesting that this gene is downstream of the known photoperiodic flowering cascade. Additional hybridisation signals are found after 5 LD of induction in regions that could be developing axillary meristems. This is another common feature with TFL1 (Bradley et al., 1997). Interestingly, C19 and D13 are strongly and broadly expressed in the inflorescence meristem at +5LD but are not expressed in floral primordia (Fig. 65). This feature is also shown by flowering time genes like SOC1 and FUL. Also a gene involved in meristem maintainance, STM (Long et al., 1996), is expressed in the SAM but not in the incipient primordia, both leaf and floral, while its expression returns in the later floral meristems (Long et al., 1996). 156
167 Discussion Fig 65. A schematic representation of spatial expression patterns of some known and newly identified genes. The simplified patterns are representations of the results of in situ hybridisation experiments. See text for details. 6.6 Biological and molecular functions of the genes up-regulated during the floral transition Transcription factors and proteins involved in signaling Transcription factors and other types of regulatory proteins are essential for many developmental switches, like the floral transition. The majority of genes encoding these types of proteins in the Solexa dataset present extremely low expression values, so that only a few of them were tested by in situ hybridisation. Examples are C4, which encodes a putative bzip transcription factor, D37, which encodes a doftype zinc finger transcription factor, and C29, which encodes a GATA transcription factor. Among these, C4 and D37 present expression patterns that are restricted to the SAM. This contrasts with, for example, FD, a crucial gene for the floral transition, which also encodes a bzip transcription 157
168 Discussion factor, because FD expression pattern does not completely overlap with the one of C4. Other members of the dof family are the CDFs, which are involved in flowering but they regulate CO transcription in the leaf vascular tissue (Sawa et al., 2007; Fornara et al., 2009). C20, which encodes a protein with a RING finger-like zinc finger motif, is more broadly expressed in the whole apex. This gene is part of the SHI family, and although it was isolated as a gene expressed in the roots as LATERAL ROOT PRIMORDIUM1 (LRP1) (Smith and Fedoroff, 1995), loss of function of this gene enhances the defects in the gynoecium when combined with other mutants of the other members of the SHI family (Kuusk et al., 2006). C21 mrna is barely detectable, although among the regulatory genes identified here it is the only one that has been previously reported to be implicated in the floral transition. C21 encodes ATHB16, a homeodomain-leucine zipper class I protein, involved in plant growth and response to light (Wang et al., 2003). Altering the level of ATHB16 mrna in transgenic plants affects flowering time, leaf expansion and shoot elongation. Compared to wild-type, 35S::ATHB16 plants are later flowering in LD, while slightly earlier in SD. Therefore, the over-expressor lines show less responsiveness to photoperiod. Conversely, lines carrying an antisense construct for ATHB16 have enhanced responsiveness to photoperiod compared to wild-type, since they flower slightly early in LD and significantly late in SD. My data together with these genetic experiments suggest that induction of ATHB16 expression in the SAM in response to inductive photoperiod may feedback to reduce responsiveness to photoperiod. However, two putative regulatory genes on which I focused most were C19 and C11, and these are described in the next sections C19 C19 encodes FLOR1, which has been classified as a leucine-rich repeat (LRR) protein (Gamboa et al., 2001). LRR proteins, which form a very large family in Arabidopsis, are transmembrane receptors involved in signaling, and have several roles mainly in plant development and defense to pathogens (Diévart and Clark, 2004, for a review). In this group, several members were shown to play pivotal roles in developmental processes, like CLAVATA1 (Clark et al. 1997), ERECTA (Torii et al., 1996), and BRASSINOSTEROID INSENSITIVE1 (Li and Chory, 1997). There are already two reports on FLOR1. This protein was shown to interact in vitro with AGAMOUS (Gamboa et al., 2001). The pattern of expression was also previously investigated by in situ hybridisation (Acevedo et al., 2004), although a major focus was given to its expression 158
169 Discussion during flower development, because this gene was proposed to have a role in the flower. However, no experimental evidence for such a role has yet been provided. The pattern of expression previously reported for this gene in the inflorescence meristem closely resembles the pattern shown in my study in the SAM at vegetative and early stages of floral induction. The signal is strong in the L3 layer in the peripheral zone, less intense in the central zone and not present in the L1 and L2 layers. Moreover, the pattern of the protein was shown to be less restricted than the mrna and to spread all over the inflorescence meristem, including a further complication (Acevedo et al., 2004). In my study, the expression of this gene is clearly excluded from early floral meristems, as it also seems to be in the previous report. Interestingly, the LRR proteins that are most closely related in terms of sequence to FLOR1 are the polygalacturonase inhibiting proteins (PGIP). Although the function of PGIP1 and PGIP2 were mostly related to pathogen defense (Ferrari et al., 2006), a PGIP-like protein was shown to regulate floral organ number in rice (Jang et al., 2003). I showed that the late flowering of soc1 ful is enhanced by mutation in FLOR1. This suggests a role of this protein in the floral transition, rather than in floral development. It could be that, in addition to AGAMOUS, FLOR1 is able to interact with other MADS-box proteins, related to the floral transition, like SOC1, FUL or AGL24. This was not tested in the previous reports, and needs to be investigated. Another candidate gene encoding a LRR protein is C15. However, its expression seems to be quite broad in the apex, even before induction. D31 encodes a heptahelical protein (HHP) called HHP3. The proteins of this family are predicted to have 7 transmembrane helices, and could act as receptors in plant cells. HHP3, like the other members, is increased in expression upon light treatment, primarily through the effect of photosynthetic products (Hsieh and Goodman, 2005). Interestingly, although barely detectable, D31 mrna seems to be present at +3LD after the shift to LD and to be restricted to small areas of the SAM, while being absent in the ft tsf double mutants C11 C11 is part of the Arabidopsis zinc finger-homeodomain (ZF-HD) family. While other related gene families, such as the Class I KNOX genes (Scofield and Murray, 2006), the WOX class (van der Graaff et al., 2009), and the class III HD-Leu zipper proteins (Elhiti and Stasolla, 2009), contain members that are well studied since several years, the ZF-HD is still not well functionally 159
170 Discussion characterized. However, there is a report in which a general study of the entire family, consisting of 14 members, named ATHB20-34, has been carried out (Tan and Irish, 2006). In this study, the authors reported the phylogenetic relationships among these genes, their expression by northernblot analysis, and the physical interactions among their protein products. Particularly, these proteins can interact with each other in yeast two-hybrid assays, with a preference for heterodimerization, suggesting that these proteins form complexes to regulate transcription. ATHB33 has been found to interact also with AP1 by yeast two-hybrid (Tan and Irish, 2006). The expression pattern of the different ZF-HD genes varies in different plant tissues, but all the members are strongly expressed in flowers, and almost all of them in inflorescence. Because ATHB31 was isolated from my screen as C11, and the loss of function mutant of this gene does not have a phenotype, I tried to silence C11 and the most related genes in the same plants. I generated two constructs: amirnah21/31, which silences ATHB21 and ATHB31, and amirnah22/25, which silences ATHB22 and ATHB25. These two pairs of genes, not only are closely related in terms of sequence, but they are also present in two blocks of conserved synteny, suggesting that they originated from genomic duplications. Moreover, ATHB21, ATHB25 and ATHB31 are more highly expressed in younger flowers, suggesting an earlier temporal role in floral initiation, more related to the onset of AP1 expression than to floral development. Detailed phenotypic screening of the transformants will be needed to test if a decrease of the expression of these genes is related to an effect on the response to photoperiod, but the later flowering of the transformants is encouraging and suggests they play a role in the floral transition. Both ATHB31 and ATHB25 are expressed at the primordia at +3LD, and later at +5LD ATHB31 is expressed at the boundary between the SAM and floral primordia. An intriguing possibility is that ATHB31 and ATHB25 are expressed at a time that immediately precedes floral primordia determination, in a tissue that is not yet determined as floral primordia but will be re-specified with floral meristem character during floral induction. It was reported that at the stage of floral transition there is a restricted period of time in which there is an overlap between development of the last leaf and the first flower, and this overlap can occur in a single primordium on the primary shoot axis (Hempel and Feldman, 1995). This leads to the formation of a chimeric shoot, with both flower and leaf characteristics. The frequency of chimeric shoot formation depends on the growth conditions, but it appeared to be significantly higher in plants shifted from SD to LD than in plants continuously grown in LD. The authors hypothesized a partial re-specification of the leaf anlage by the floral stimulus, and they speculated that primordia in Arabidopsis can be specified also during 160
171 Discussion their development. If this is correct, some genes should be devoted to regulate this transition. Possibly members of the ZF-HD family participate in this process. Alternatively, they could have a role in the specification of the boundary between the SAM and the arising organs. Many transcription factors are known to play a role in this specific developmental process (Aida and Tasaka, 2006, for a review). However, it is perhaps unlikely that such a process would be under photoperiodic control Additional layers of regulation Other proteins that may play pivotal roles in the floral transition, although they are not transcription factors, are protein modifiers that regulate the activity of transcription factors by post-translational modifications. For example the transcription factor AP1 is a target of farnesylation, and the overexpression of a mutated form of AP1 lacking the farnesylation site does not exhibit the typical terminal flower of the complete AP1 coding region but only causes early flowering and additional novel phenotypes (Yalovsky et al., 2000b). The Arabidopsis era1 (for enhanced response to abscisic acid ) is a mutant in the β subunit of a farnesyltransferase, which presents several developmental anomalies in meristems, organs and flowers, as well as late flowering (Yalovsky et al., 2000a). Over-expression of wild-type AP1 in era1 background also causes early flowering but not meristem termination (Yalovsky et al., 2000b). Recently it was reported that a peptidyl-prolyl cis/trans isomerase encoded by Pin1At gene is involved in flowering (Wang et al., 2010). Pin1At protein was proposed to exert its effect on flowering through post-translational regulation of two key flowering time proteins promoting the floral transition at the SAM, SOC1 and AGL24, by phosphorylation-dependent cis/trans isomerization of these two MADS-box transcription factors. Pin1At plays an important function in the floral transition since lines expressing an antisense suppressor of this gene (Pin1At-AS) show delayed flowering, and over-expression of this gene promotes early flowering. Early flowering of 35S::SOC1 and 35S::AGL24 plants was significantly delayed in Pin1At-AS background, and the early flowering of 35S::Pin1At is completely suppressed in the soc1 agl24 double mutant background. In this study, both SOC1 and AGL24 proteins were demonstrated to be phosphorylated in planta, and Pin1At protein interacted with their phosphorylated forms, catalyzing conformational changes by isomerization and thus affecting their function at the post-translational level. The expression of Pin1At was detected in all tissues, including the SAM, and generally increased during floral transition. Interestingly, this was also detected in our gene expression dataset, where Pin1At 161
172 Discussion is in the list of the up-regulated genes identified by the clustering approach (see Appendix II). Consistent with this scenario, a specific kinase called Meristematic receptor-like kinase (MRLK) could be implicated in phosphorylation of AGL24 protein (Fujita et al., 2003). AGL24 was isolated by yeast two-hybrid screen as a physical interactor of MRLK, and then shown to be phosphorylated by this kinase. MRLK is expressed especially in apical meristems (Fujita et al., 2003). Another gene identified in our dataset, C27, encodes a putative calcium-dependent protein kinase. I showed that the expression of this gene strongly increases at the SAM during induction in LD, and that this increase is strongly suppressed in the ft tsf double mutant. In tobacco a related protein, a calcium/calmodulin-binding protein kinase named NtCBK1, was reported to be involved in flowering (Hua et al., 2004). However, this gene was strongly expressed in tobacco SAM in the vegetative phase, and its expression decreased upon floral transition. Indeed, NtCBK1 has a floral repressive function, as over-expression of this gene in tobacco causes late flowering Genes involved in metabolism Metabolism has a role in all basal cellular processes and as many of these are likely to change in the meristem during the floral transition it is not surprising to find many genes connected to metabolic pathways among the up- or down-regulated genes in my dataset. However, the significant enrichment shown in the GO term analysis of processes like biosynthetic process, macromolecule metabolic process, cellular metabolic process and primary metabolic process, gives an indication that metabolism plays a major role in the SAM during floral transition. There are two reasons that can account for this enrichment. One is that the floral transition involves a change in the SAM identity so that different structures are produced that sustain new organs, with a considerable energetic consumption. This is reasonable considering the extensive growth undergone by the SAM during the 3 LD of induction that I monitored and the resulting change in the SAM size. The other reason is that the shift from SD to LD implies also a longer exposure of the plants to light, which is reflected by more photosynthetic activity. The result of the photosynthesis, which takes place in the leaves, probably also has consequences at the SAM, which acts as a stronger sink for nutrients as more growth occurs. Transient exposure to red-rich light LD condition at high light intensity promotes flowering in Arabidopsis, while it does not have such an effect at low light intensity (King et al., 2008). The effect of high intensity red-rich light correlates with FT induction, and increase in expression of SUC2, a photosynthetically regulated gene. Blocking photosynthesis by transiently removing atmospheric CO 2 delayed flowering and the activation of FT by LD. 162
173 Discussion Moreover, ft mutants did not respond to floral activation by high-intensity red-rich LD (King et al., 2008). This suggests that photosynthesis, perhaps by increasing sugar concentration, has a promotive effect on flowering in LD through FT. Furthermore, higher light intensity promoted flowering even in SD, but independently of FT (King et al., 2008). From the set of genes which were up-regulated upon shift to LD, C25 encodes an uncoupling mitochondrial protein (UCP) called UCP1 (or PUMP1). Uncoupling proteins are integral to the inner mitochondrial membrane and dissipate the proton gradient. Loss of function of this gene impacts photosynthesis, as the ucp1 mutant has a significant decrease in the rate of CO 2 assimilation, and restriction in photorespiratory flux (Sweetlove et al., 2006). Another gene, D29, encodes a plastid glyceraldehyde-3-phosphate dehydrogenase (GAPCP-1). Loss of GAPCP-1 and GAPCP-2 enzymes cause drastic changes in sugar and amino acid balance resulting in arrested root development, dwarfism and sterility (Muñoz-Bertomeu et al., 2009). Male sterility of gapcp1 gapcp2 double mutants is caused by defects in pollen development, and is likely due to modifications in sugar signaling, particularly by an increase in trehalose (Muñoz-Bertomeu et al., 2010). There are several publications that implicate sugar metabolism in floral transition processes. In the pgi1 mutant, which has a highly reduced plastidial phosphoglucose isomerase enzyme activity, leaf starch synthesis is impaired (Yu et al., 2000). Also mutants in phosphoglucomutase (pgm1) and ADP-glocose pyrophosphorylase (adg1) have low starch content. All three mutants pgi1, pgm1 and adg1 show a slight delay in flowering in LD compared to wild-type and a more pronounced delay in shorter photoperiods of 12 hours light-12 hours dark (Yu et al., 2000). Additionally, supplementing the medium with 1% sucrose, glucose or fructose restored the flowering time of pgi1 mutant to that of the wild-type. Sugar concentration has been shown to be correlated with the floral transition (Corbesier et al., 1998), although with opposite effects depending on the concentration and on the genetic background (Ohto et al., 2001). Mutants in trehalose-6-phosphate synthase1 (tps1) are embryonic lethal in the homozygous state, but with a DEX-inducible system for TPS1 in the tps1 mutant it is possible to generate viable seeds (van Dijken et al., 2004). Interestingly, these lines flower only if they are induced with DEX, otherwise they remain in the vegetative state for about six months until they die. Upon DEX application, TPS function is restored, and the floral transition occurs, although it is still strongly delayed compared to wild-type. These lines also show other phenotypes related to retarded growth (van Dijken et al., 2004). 163
174 Discussion Another two candidate genes, D35 and D19, are only very weakly detectable by in situ hybridisation, although they seem to be quite specific for the SAM and not visible before +3LD. D35 encodes NIA2, a nitrate reductase. The nia1 nia2 double mutant has an early flowering phenotype (Seligman et al., 2008), which has been attributed to a decrease in nitric oxide production, since this molecule has a repressing action on the floral transition (He et al., 2004). NIA1 mrna was also detected in our gene expression dataset, and it was identified as up-regulated by the clustering approach (see Appendix II). D19 encodes AIM1, an enzyme in the pathway of β- oxidation of fatty acids (Richmond and Bleecker, 1999). Several abnormalities affect the inflorescence meristems of aim1 mutants. Moreover, the normal structure and the fertility of the flowers is severely compromised in these mutants. The presence of AIM1 mrna in many tissues, including inflorescence meristems and flowers, was confirmed by in situ hybridisation (Richmond and Bleecker, 1999). There are other candidate genes that are related to fatty acid methabolism. D55 encodes a phospholipid/glycerol acyl transferase, which is expressed strongly after +3LD, and it has a putative role in membrane metabolism (Stålberg et al., 2009). C22 encodes a putative hydrolase/lipase, which is also detected at +3LD, and quite specifically at the SAM. Finally D13, encodes a fatty acid desaturase, which I will discuss in a later section Growth is a key process for the floral transition Meristem growth As already mentioned, meristem growth is a striking aspect of the transition to an inflorescence meristem. Even before the floral primordia arise, remarkable growth of the meristem occurs in all three dimensions. This is immediately visible from sections of the SAMs of plants shifted from SD to LD (Fig. 11 and Fig. 18). This growth must require increases in metabolic and cellular processes. This is in agreement with the significant enrichment in expression of genes with the GO terms cellular component organization and biogenesis and other terms concerning ribosomes, protein metabolism and translation. I already discussed the possible role of metabolism in the transition in the earlier section. The contributions of cell division and cell elongation to this growth have not been thoroughly measured but it seems likely that increased cell cycle activity must play an important role in the meristem transition. Past studies tried to make a link between meristem transitions and meristem growth, and to describe this by measuring various parameters, including the cell cycle in different sub-domains of the SAM 164
175 Discussion (Kwiatkowska, 2008 for a review). However, the small size of the Arabidopsis meristem precluded extensive research on this model plant, and other species were mainly studied. Intrinsic speciesspecific differences in SAM growth and inflorescence architecture allow only a limited extrapolation of this knowledge to Arabidopsis. Moreover, there is not always a clear agreement between different reports concerning the dynamics of these parameters during the floral transition. Many studies have shown that in Arabidopsis the meristem increases in size during the transition to flowering. For Ler, it was reported that the vegetative meristem measures around 53 μm at the base and 13 μm in height, and expands to 70 μm at the base and 15 μm in height as an inflorescence meristem (Laufs et al., 1998). In the inflorescence meristem the cell size increases from the outer layer to the inner regions, so that cells in L1 layer are smaller than in L3. Mitotic index for both L1 and L2 layers in the center is lower than in periphery (Laufs et al., 1998), in agreement with the central zone (CZ) consisting of stem cells and the peripheral zone (PZ) consisting of cells forming the organs. Also in vivo imaging showed that, at the surface, cells at the center of the SAM grow slower than at the periphery (Grandjean et al., 2004). In another report, upon shift from SD (after 2 months of growth) to LD, the mitotic index at the transition meristem was 2-3 fold higher than at the vegetative meristem. Considering the central and peripheral zones, the increase was seen especially in the peripheral part (Jackmard et al., 2003). However, slight activation of cell division occurred also at the rib zone. Upon floral induction the SAM grows both in width and height, but because of the higher increase in height relative to width it becomes more domed. This process is also immediately followed by elongation of the apical internodes on the stem (Jackmard et al., 2003). Recently, a comparison between vegetative, transition, and inflorescence meristems was carried out taking also into account marker genes of the different meristem zones (Geier et al., 2008). The size of the transition meristem was around twice that of the vegetative meristem, correlating also with the width of STM expression domain. Inflorescence meristems were intermediate in terms of size between the other two meristem stages. The mitotic index also increased from the vegetative to the transition meristem, both in the CZ and in the PZ. Interestingly, the size of the organizing center and the stem cell region did not directly follow the growth of the overall meristem size (Geier et al., 2008) FT, florigen, and growth The remarkable growth of the SAM of wild-type plants upon the shift from SD to LD does not take 165
176 Discussion place in the ft tsf double mutant. Although this can be simply explained by the fact that without FT (and TSF) there is not any response to photoperiodic induction, it raises interesting points on the function of the FT protein at the SAM in the transition to flowering. In this sense, FT could be seen as a general inducer of growth, because increasing the concentration of this at the meristem causes an increase in growth. A role for the florigen as a regulator of growth was proposed from studies in tomato (Shalit et al., 2009). The tomato ortholog of FT is SINGLE FLOWER TRUSS (SFT). The sft mutant is late flowering and presents altered architecture and flower morphology (Lifschitz et al., 2006). Both SFT and FT when over-expressed cause early flowering even in tobacco and tomato, which are dayneutral-flowering plants. Over-expression of SFT induces early flowering also in a short-day strain of tobacco as well as long-day Arabidopsis, suggesting conservation of the function and mechanism of action. SFT is also graft-transmissible. However, over-expression of SFT leads to terminal inflorescences and retardation of growth (Lifschitz et al., 2006). Conversely SELF PRUNING (SP), the homolog of Arabidopsis TFL1, promotes growth and represses flowering (Pnueli et al., 1998). Besides its role in flowering, SFT requires SP for its role in sympodial and flower meristems (Shalit et al., 2009). High SFT/SP ratio causes growth restriction at the SAM and in lateral leaflet meristems, leading to reduced leaf complexity, while still higher ratios (for example in 35S::SFT sp) cause complete suppression of both vegetative and inflorescence meristems (Shalit et al., 2009). Therefore, the authors propose SFT/SP to regulate the balance of growth processes, and the florigen as a general growth hormone. The negative role of SFT on growth in tomato seems to contrast with the situation in Arabidopsis. However, this could be due to differences in life strategy and plant architecture of these two species. Another example comes from poplar, where PtFT1, the ortholog of Arabidopsis FT, plays a role both in flowering and bud set (Böhlenius et al., 2006). In autumn, in response to SD, growth terminates and bud dormancy is initiated in this tree species. However, over-expression of PtFT1 in poplar causes not only early flowering, but also suppresses the growth cessation induced by SD and bud set, so that transgenic trees do not terminate growth in SD. So in this case FT would promote growth, as appears to be the case in Arabidopsis meristems. Also in slow-growing conifers an FT orthologue was correlated with photoperiodic bud setting (Gyllenstrand et al., 2007). However, this does not exclude that the putative growth factor is something downstream of FT, which is activated by FT protein, either together with FD or independently of it. SOC1 and FUL, putative early targets of FT, could mediate this function, since they are transcription factors. FUL 166
177 Discussion has been associated with functions in the cell cycle (Gu et al., 1998). Moreover, in a recent report, FT, SOC1 and FUL were connected to growth processes in addition to flowering control (Melzer et al., 2008). For example, ft ful double mutants show extreme indeterminacy of the apical meristem and grow up to 1 meter tall with only a few branches, reverting to vegetative growth. The soc1 ful double mutants show several rounds of reversion to vegetative growth after flowering. 35S::FT in soc1 ful grows with a short inflorescence, a few terminating co-inflorescences, and a reiteration of vegetative growth (Melzer et al., 2008). 6.7 Response to FT/TSF and responsiveness of ft tsf In principle, classes of genes can be identified based on how much their induction upon shift to LD is dependent on FT/TSF. This can be done comparing the induction of a gene in wild-type to the induction in ft tsf double mutant. However, it is not possible to quantify this difference by in situ hybridisation, and other techniques are necessary to determine the level of gene expression in each genotype. Furthermore, in this study only very few genes were tested in the double mutant. Nevertheless, some qualitative information was gained from a series of genes. C11 and C23 are genes that convincingly respond to photoperiod and this response is dependent on FT or TSF, since they are clearly induced by LD in wild-type but not in the double mutant (Fig. 37 and Fig. 44). A series of other genes have been shown to be expressed in the meristem, and while in wild-type they are up-regulated upon the shift to LD, they remain constant in the double mutant (see C19 and C4) (Fig. 39 and Fig. 42). Another set of genes seems to partially respond to FT/TSF. They increase in their expression in the double mutant, but clearly less than in wild-type (see C25 and C27) (Fig. 43). From the microarray data of the shoot apices (Schmid et al., 2003), genes like SOC1, FUL, and several SPLs, show a marked increase in expression upon shift to LD in wild-type. This increase is strongly delayed in co and ft mutants, but the increase is still detectable, suggesting a residual effect of the photoperiod. This increase could be due to other factors rather than a response to the photoperiodic flowering pathway. A shift from SD to LD is a dramatic environmental change that plants never experience in nature because they gradually pass from a SD-like to a LD-like condition during the changing seasons. Therefore, many genes could be induced in expression because of this shift, not only due to the floral response to photoperiod. Genes related to stress, especially abiotic, or to temperature change, may be induced due to a direct consequence of a higher exposure of the plants to light. These genes would be expected to be expressed very similarly in the ft tsf double mutant. Moreover, 167
178 Discussion photosynthetic activity is higher in LD than SD, and this can also trigger processes that are related to energy production, as discussed before. The ft tsf double mutants, although un-responsive to photoperiod in terms of induction of flowering, seem to be still responsive to LD for growth. Although the size of the SAM upon floral induction in our experimental condition has not yet been quantified in detail, it it possible to recognize a certain degree of growth at +3LD after photoperiodic induction even in the double mutant. This residual growth may depend on the sugars produced upon photosynthesis and transported to the meristem. The size of the meristem of both wild-type and ft tsf during the floral transition needs to be compared, and the mechanism of this residual growth can then be investigated. From the novel genes isolated in my screen, the only one that seems to be induced by LD completely independently of FT/TSF is D A novel signal identified in response to shift in photoperiod D13, a gene encoding a putative stearoyl-acyl-carrier-protein (ACP) desaturase, has been shown to be strongly induced upon shift to LD in a region at the center of the inflorescence meristem. This induction occurs not only in wild-type, but also in ft tsf double mutant, with the same dynamics and a very similar pattern (Fig. 32, G-L and Fig. 33). This induction is unlikely to be due to direct detection of photoperiod in the meristem, as this is strongly shaded by young leaves. Therefore, I postulated that another signal distinct from FT/TSF is likely to trigger D13 expression. To date, there are no reports of genes rapidly induced by LD in the SAM in the absence of the photoperiodic pathway. Some hypotheses can be made on the identity of this signal. One possibility is that the photosynthesis, which would create a metabolic signal through the production of sugars could be involved. As discussed before, shift from SD to LD increases the exposure to light and boosts photosynthesis. This possibility could be tested for example using socalled Extended Short Days (ESD) instead of LD. ESD consists of initial 8 hours of light with the complete spectrum, then 8 hours of exposure to far-red light that is perceived as photoperiodically active but is not photosynthetically active, and finally 8 hours of dark. Another possibility is a hormonal signal. Gibberellins for example are also involved in triggering flowering independently of FT, although some studies report possible connections between the two pathways (Hisamatsu and King, 2008). Moreover, some responses to GA are similar to those caused by exposure to LD (Gocal et al., 2001), and gibberellins were reported to be a possible moving signal (Eriksson et al., 2006), although additional reports are needed to clearly support this 168
179 Discussion hypothesis. Another critical point is that for both sugars and gibberellins, and to a certain extent cytokinins (Corbesier et al., 2003), a role in the floral transition has been proposed as well as possible movement from leaf to apex. However, it is not known whether their roles are causal or a consequence of the floral transition. In other words, we do not know if these possible signals would be active in a ft tsf double mutant, which does not undergo the transition readily upon shift to LD. The experiment with the inducible system that activates CO also indicates that D13 induction occurs independently of the CO-FT module, and links D13 more clearly to the response to LD (Fig. 35). The tfl1 mutant shows an increase of D13 expression, or a premature expression of this gene, compared to wild-type, at the moment of the floral transition (Fig. 34). This suggests that this gene is somehow connected to the floral transition of the SAM. It could be that upon shift to LD a signal triggers the expression of D13, which contributes to the transition, independently of FT. Expression of D13 cannot be sufficient to induce flowering, because it is expressed normally in ft tsf double mutants, although these are very late flowering. However, D13 might still contribute to the early flowering caused by FT/TSF in wild-type plants. Insertion lines carrying a T-DNA within the locus are not available, and the RNAi against D13 did not efficiently decreased its expression. Possibly a feedback regulation causes this enzyme to be up-regulated once its concentration decreases, making RNAi approaches more challenging. Moreover, the over-expression of D13 did not show any visible phenotype, consistent with what has been shown for other members of the same gene family (Kachroo et al., 2007). What could be then the function of D13 at the SAM? Stearoyl-ACP desaturases are enzymes that catalyze the conversion of stearic acid (18:0) to oleic acid (18:1), to regulate polyunsaturated fatty acid content. Plants can adjust the membrane lipid fluidity by changing levels of unsaturated fatty acids mainly by regulating the activity of fatty acid desaturases. This has been related mainly to the response of abiotic stresses such as changes in temperature (Upchurch, 2008, for a review). Particularly, desaturase activity would maintain higher membrane fluidity when the temperature is very low. Therefore, this function could be connected to the floral transition, in which higher fluidity of the membrane would perhaps facilitate the growth of the meristem. Moreover, TFL1, which is expressed in a similar region, was reported to be implicated in endomembrane trafficking, and fractionation of protoplasts showed that TFL1 protein was associated with the membrane fraction (Sohn et al., 2007). These enzymes can also be involved in pathogen defense responses (Kachroo et al., 2001). D13 is part of a family of 7 stearoyl-acp desaturase in Arabidopsis. Loss of function mutants of one of the 169
180 Discussion members of this family, SSI2/FAB2, causes a dwarf phenotype, constitutive activation in salicylic acid-mediated signaling and repression in certain jasmonic acid-mediated responses, with several consequences in defense responses (Kachroo et al., 2001). Therefore, signals derived from fatty acids modulate crosstalk between different defense signaling pathways, revealing an interesting possible role of these enzymes in signaling mechanisms. A general description of this gene family has been published and showed a certain degree of tissue-specificity of the various members in planta, although D13 was not detected and not considered in this study (Kachroo et al., 2007). Knock-out lines for 3 out of the 7 members of this family were not viable when homozygotic, while for the other 2 members no visible mutant phenotype was detected (Kachroo et al., 2007). However, D13 is the most divergent member of this family, as demonstrated by phylogenetic analysis. Its expression pattern, specific for a particular region in the SAM in inductive photoperiods, could account for a unique function of this gene which cannot be predicted from the information on the other Arabidopsis ACP-desaturases. PART2 6.9 SVP represses many genes Although SVP was first described in 2000 (Hartmann et al., 2000), it only recently became of interest to many groups. Several reports underlined the importance of this transcription factor in the control of the floral transition, together with roles in floral meristem determination. A repressive effect of SVP on FT transcription has been reported by several studies, together with this study (Lee et al., 2007b; Li et al., 2008; Jang et al., 2009). Moreover, I showed that this repression is exerted during the 24 hours of a daily cycle, so that part of the early flowering of the svp mutant can be explained by up-regulation of FT and not, for example, by a shift in the phase of FT expression. I demonstrated the same for TSF, adding another similarity between FT and TSF at the level of their regulation (Jang et al., 2009). Repression of SOC1 by SVP was also reported, together with this study, by another group (Li et al., 2008). Moreover, a direct repression of SOC1 by SVP was demonstrated by showing that SVP binds to the SOC1 promoter (Li et al., 2008). In addition, I showed that in svp mutant, SOC1 still rises in expression, even in the absence of FT and TSF. Therefore, in absence of inducers and the SVP repressor, there is still activation of SOC1. A similar phenomenon was also shown in various double mutant combinations, in which in the absence of repressor (SVP) and inducer (CO or FT) activities there was still activation of the target (FT or SOC1, respectively), as measured by real- 170
181 Discussion time PCR. It could be that SOC1 in svp ft tsf, in absence of functional photoperiod pathway, is induced by other pathways such as the GA pathway. This can be tested in the future. Another point is that the svp co double mutant flowers slightly but significantly earlier than svp ft tsf. Considering FT and TSF as the only significant targets of CO for floral induction, it is expected that these two mutant combinations show the same phenotype. Indeed, I showed that in svp co during a day cycle of 24 hours the level of FT and TSF is very low. However, this reflected the situation of only 1 day at a precise developmental stage (from 10 to 11 days in LD condition), so it could be that there is a slight up-regulation of FT/TSF in svp co double mutants at another stage. Indeed, another real time PCR experiment showed that at 12 days in svp co the expression of both FT and TSF is significantly higher than in co, and even slightly higher than in wild-type. This result suggests that other activators can promote FT expression in an svp co double mutants. It is not yet clear how direct is the repression of FUL by SVP. In svp ft double mutants FUL is still quite strongly expressed in early stages of the floral transition, suggesting a direct control of SVP on FUL. However, the svp soc1 ful triple mutant does not significantly differ from the svp soc1 double mutant in terms of flowering time. Hence, other experiments need to be done to investigate the relation between SVP and FUL. As reported previously, FUL is ectopically expressed in ap1 cal double mutants, because it lacks the repression exerted by AP1 (Mandel and Yanofsky, 1995a). In another report, FUL mrna was measured in the ap1 agl24 svp triple mutant and found to be upregulated even significantly more than in ap1 cal (Gregis et a., 2008). The mutation in SVP could account for this further up-regulation of FUL, suggesting that FUL is normally repressed by SVP Is SVP a general repressor or is it downstream of photoperiodic induction? I showed that several floral promoter genes are increased in expression in the svp mutant and they could also be targets of SVP. An alternative view is that, in addition, SVP is genetically downstream of some floral promoter genes. Indeed, SVP shows a decrease in expression at the center of the SAM during the floral transition, and it is still not known if a floral promoter gene is upstream of SVP and negatively regulates it to allow the floral transition to occur. Moreover, the two views are not mutually exclusive, and it is possible that some factors are repressed by SVP and then when they are activated, for example by the photoperiod, they in turn repress SVP. A similar hypothesis was suggested for FLC, where FLC represses SOC1 but SOC1 would then down-regulate FLC (Seo et al., 2009). A previous report excluded that the photoperiodic pathway influences SVP expression, since the expression level of this gene did not change in mutants of genes within this genetic 171
182 Discussion pathway (Li et al., 2008) Double action leaf-meristem I demonstrated that SVP has a role in repressing floral promoting genes expressed in the leaves, and a role in repressing floral promoting genes expressed in the meristem. FLC is obviously a similar case, since this MADS-box protein has the same dual function in these tissues (Searle et al., 2006). Also the two repressors share many target genes and likely act in a complex. However, in the meantime it is emerging that more and more genes in the flowering time network show this kind of dual function in these two tissues. For example both SOC1 and FUL cause an acceleration of flowering when over-expressed in leaf or meristem, although the major contribution is in the meristem (Searle et al. 2006; Wang et al., 2009a). The same approach with SPL3 gave similar results (Wang et al., 2009a). Interestingly, the contribution of SVP on flowering seems to be equally important in leaf and meristem, since more or less the same effect is obtained using SUC2 and KNAT1 promoters, and the combination of the two transgenes restores a phenotype similar to the wild-type. This is similar to what has been observed with FLC (Searle et al 2006). However, the combination of the two transgenes for SVP does not fully complement the flowering time phenotype in SD. This might be due to the strength of the promoters, which might not be enough to suppress the effect of the svp mutation, or to the fact that the transgenes are single copy and heterozygotic. Analysis of the F2 generation when the plants are homozygotic will clarify whether the number of transgene copies makes a difference for the flowering time. The basis of the floral phenotype of KNAT1::SVP mis-expressing lines remains to be explained. Over-expression of SVP in all tissues using the 35S promoter leads to a dramatic effect of homeotic transformation on flowers (Masiero et al., 2004). It could be that the tissue where this promoter causes this effect partially overlaps with that of KNAT1 expression. Independent transformations of svp-41 mutant with 35S::SVP constructs that I performed show a range of floral phenotypes (data not shown), indicating that the level of expression is also important for the effect. Alternatively, in the svp background KNAT1 is de-regulated. This remains to be tested SVP and FLC Recently, SVP and FLC have been shown to be closely related in function. However, these genes also show notable differences. 172
183 Discussion At the level of targets, FT, TSF and SOC1 are shared between them. Additionally, FLC could be involved in the repression of FUL, since FRI-FLC lines strongly suppress the photoperiodic induction of FUL (Schmid et al., 2003). At the level of regulation, SVP and FLC are both targets of temperature changes and the autonomous pathway, and they are not directly affected by photoperiod (Lee et al., 2007b; Li et al., 2008; Michaels and Amasino, 1999). Finally, they are both down-regulated in the inflorescence apex (Hartmann et al., 2000; Michaels and Amasino, 1999). There are also major differences at the level of regulation. While the GA pathway affects only SVP, vernalization has an effect only on FLC (Li et al., 2008; Michaels and Amasino, 1999). Regarding the target genes, a direct binding of SVP protein to the FT promoter has been reported only once, and that experiment was performed in a transient assay with protoplasts (Lee et al., 2007b). It remains possible that the repression by SVP could not be direct, or could involve other specific factors, such as TFL2, that is also a repressor of FT and was shown to be recruited to the SEP3 locus by SVP to establish its repression (Liu et al., 2009b). The fact that SVP and FLC proteins physically interact does not necessarily explain the possible complexity of the regulation of their target genes. MADS-box transcription factors usually form different complexes with several partners, depending on the developmental stage and the specific tissue (Rijpkema et al, 2007). For example, in the flower SVP interacts with AP1 and AGL24 (and maybe with SOC1) (Liu et al, 2009a, for a review), but probably not with FLC. Because AGL24 and SOC1 proteins are present in the meristem also before floral initiation, interactions of SVP with these proteins to regulate transcription cannot be excluded and needs to be tested. Other similarities or differences still wait to be tested, such as the epigenetic regulation, which is well known for the FLC locus and the regulation through antisense transcripts, which has just been discovered for FLC (Swiezewski et al., 2009; Liu et al., 2010). Neither of these aspects has been studied for SVP. Finally, the presence of an alternative shorter differentially spliced form of SVP was discussed. Preliminary experiments showed a modest but significant effect on flowering for this form, when over-expressed with the 35S promoter, while the complete form strongly delays flowering and has also a dramatic effect on flower development. Interestingly, while the function that SVP has in Arabidopsis is well conserved in closely related species, such as Brassica campestris (Lee et al., 2007a), in other species there are important differences. In rice, the SVP-like genes still show a conserved role in meristem identity and they have a major role in brassinosteroid signaling, but they are not involved in the floral transition (Lee et al., 2008a). When over-expressed in Arabidopsis, 173
184 Discussion they do not delay flowering but they cause floral reversion similar to the endogenous SVP (Fornara et al., 2008). Also in barley, several SVP-like genes were isolated, and they also generate floral reversions when over-expressed, both in barley and Arabidopsis, while only one member caused late flowering (Trevaskis et al., 2007). Several isoforms of this protein may have arisen during evolution in different species, and alternative splicing may contribute in Arabidopsis to keeping more than one function encoded by the same genomic locus. Whether the alternative form of SVP mrna is biologically relevant or just coding for a truncated inactive protein needs to be investigated in more detail A quintuple mutant reveals additional targets of SVP The generation of the svp ft tsf soc1 ful quintuple mutant, and possibly all the other combinations of the different mutations, is a valuable tool to verify the genetic interactions among all these genes. Indeed, it is not yet clear, for example, how much SOC1 and FUL are functionally redundant. It is also not known what would be the effect of combining these mutations into a quadruple mutant ft tsf soc1 ful. A triple mutant ft tsf soc1 is already very late flowering in LD, but it has to be tested if the quadruple mutant can still easily flower. However, I already showed that the quintuple mutant flowers slightly earlier than ft tsf soc1 triple mutant, therefore presumably earlier than the ft tsf soc ful quadruple mutant, which still has to be generated. This demonstrates that, in absence of FT, TSF, SOC1 and FUL, svp still promotes significant early flowering. This suggests that an additional gene which is normally repressed by SVP, promotes early flowering in the quintuple mutant. What could this unknown gene be? AGL24 is a possible target, although the svp mutation was reported to be epistatic to agl24 (Gregis et al., 2006). If the effect of the loss of AGL24 was masked by the up-regulation of the other floral promoter genes in the svp background, this would be a reason why this gene was not identified as a possible target of SVP. Another floral pathway integrator, LFY, could also be downstream of SVP. Possible other targets are the SPL genes, for which the genetic interactions with SVP have not been tested so far. Finally, another gene is SEP3, since it has been reported to be a possible direct target of SVP during the flower development. Moreover, a role in promoting flowering was never reported for the SEP genes. It is possible that in absence of many other known floral promoters SEP3 would significantly promote the floral transition. Therefore, SVP might control one or more genes that are still not reported to have a role in the floral transition. This has to be further investigated. 174
185 Conclusions and perspectives Conclusions I set up a system in which the early phase of the floral transition in Arabidopsis can be induced and monitored in a controlled and synchronized way by shifting plants from SD to LD. I then collected shoot apical meristems (SAM) from wild-type Columbia with high tissue specificity by laser microdissection creating a time course during floral transition, and used the extracted RNA for global gene expression analysis through next generation sequencing. Around 300 genes were identified as up-regulated during this process in 3 independent experiments. Global analysis highlighted a high enrichment in metabolic activity, especially for the protein synthesis processes. A group of novel genes from different functional categories were chosen to validate the gene expression data by in situ hybridisation. These experiments confirmed the increase in expression upon floral induction for several candidates, and showed novel spatial and temporal expression patterns in some cases. Particularly, I started to characterize four candidates among these novel genes by further experiments (see model in Fig. 66). One is C19, a gene encoding a LRR protein, which is expressed broadly in the SAM but seems to respond to floral induction increasing in expression at the SAM. In the ft tsf double mutant, the increase in expression of this gene is strongly attenuated. Moreover, a putative loss of function of this gene, when crossed to soc1 ful double mutant, enhances the late flowering phenotype. Therefore, C19 could be involved in the perception of the floral stimulus or in the response to it at the SAM. The second gene is C11, which encodes a member of the zinc finger homeodomain protein family, and is specifically up-regulated at the primordia on the flanks of the SAM, only in the presence of functional FT and TSF. This suggests that this gene is downstream of the photoperiodic cascade. Preliminary results with transgenic lines knocking-down several members of this homeodomain family show a moderate late flowering, that would suggest a redundant role played by C11 together with other homologue genes in the control of the floral transition. The third is D13, a gene encoding a lipid desaturase, expressed in the center of the SAM upon photoperiodic induction. This gene is up-regulated independently of the presence of functional FT and TSF genes, suggesting the presence of a signal responding to inductive photoperiod that does not pass through the classical pathway activated by long-day. Additionally a fourth gene, C23, which does not have similarity to any known gene, is also expressed in the center of the meristem in a very restricted area upon photoperiodic induction, and this up-regulation is totally dependent on FT/TSF. Since some of the genes isolated by this approach were not previously identified by other global gene 175
186 Conclusions and perspectives expression studies, the use of laser microdissection resulted in a successful method to increase sensitivity toward lowly expressed genes. Fig 66. A model of the possible temporal and spatial interactions between flowering time genes and novel genes identified by this study. See text for details. I also showed by genetic and expression studies that SVP transcription factor represses several floral promoter genes. These included FT and SOC1, as shown by other studies, and TSF and FUL, which are novel targets. In addition, I showed the spatial relationship of SVP with these genes: FT and TSF are repressed in the leaf, SOC1 and FUL in the SAM. Furthermore, I found that in absence of SVP the presence of FT and TSF is not necessary to activate SOC1, but it only probably enhances this activation. I confirmed the dual role of SVP in leaf and meristem in repressing flowering using lines that mis-express this transcription factor in one or the other tissue. SVP activity in either organ 176
187 Conclusions and perspectives has a partial effect on flowering, but these activities are synergistic so when combined in the same background much later flowering occurs. Finally, an svp ft tsf soc1 ful quintuple mutant showed that the absence of SVP still promotes flowering in this genetic background, and demonstrates that an additional or more unknown genes are repressed by SVP (see model in Fig. 67). Fig 67. A model of the genetic and spatial interactions of the transcription factor SVP with floral promoter genes. See text for details. Perspectives In general, many loss of function mutations do not cause a phenotype due to genetic redundancy. Similarly, the redundant nature of the flowering pathways in Arabidopsis often makes it necessary to combine mutations in different loci to cause a clear phenotypic effect. Furthermore, because floral induction occurs late in plant development, mutation affecting earlier steps in development 177
188 Conclusions and perspectives can have pleiotropic effects on flowering, confounding the identification of genes with a more direct effect. Therefore, identifying new genes involved in the floral transition in Arabidopsis can be a challenging task. Nonetheless, global gene expression analysis combined with genetic approaches can be very powerful. The initial approach that will be used on the most promising genes identified in this study, is to try to place them in the genetic hierarchy of the flowering pathways, testing their expression level and spatial pattern in mutants. Together with ft tsf double mutants, also soc1 ful double mutants, svp, and tfl1 will be used, to reveal if there are epistatic interactions with these novel genes during the early phases of the floral induction. This will pinpoint which genes are likely to participate in the flowering network and place them relative to one another. Also transgenic approaches are in progress to ectopically express these genes using specific promoters, in order to investigate whether their over-expression is sufficient to cause a flowering phenotype. More detailed phenotypic analysis of meristem morphology during the floral transition in wild-type, mutants and transgenic plants may show that some of these genes do not affect flowering time but still have significant effects on meristem growth or development. A particular interest is also on the unknown signal that I proposed leads to a molecular response at the SAM when plants are shifted to inductive photoperiod in the absence of FT and TSF. Experimental approaches, together with the use of specific mutants, will be employed to identify the nature of this putative novel signal. Another unknown factor to identify is the further gene or genes regulated by SVP in addition to FT, TSF, SOC1 and FUL. Global gene expression analysis comparing the svp ft tsf soc1 ful quintuple mutant to the ft tsf soc1 ful quadruple mutant is a possible approach to try to address this question, in order to gain insight on possible novel genes involved in the floral transition. 178
189 References References Abe M, Kobayashi Y, Yamamoto S, Daimon Y, Yamaguchi A, Ikeda Y, Ichinoki H, Notaguchi M, Goto K, Araki T. (2005) FD, a bzip protein mediating signals from the floral pathway integrator FT at the shoot apex. Science 309, Acevedo FG, Gamboa A, Paéz-Valencia J, Jiménez-García LF, Izaguirre-Sierra M, Alvarez-Buylla ER (2004) FLOR1, a putative interaction partner of the floral homeotic protein AGAMOUS, is a plant-specific intracellular LRR. Plant Science 167, Adrian J, Torti S, Turck F (2009) From decision to commitment: the molecular memory of flowering. Molecular Plant 2, Ahn JH, Miller D, Winter VJ, Banfield MJ, Lee JH, Yoo SY, Henz SR, Brady RL, Weigel D (2006) A divergent external loop confers antagonistic activity on floral regulators FT and TFL1. The EMBO Journal 25, Aida M, Tasaka M (2006) Morphogenesis and patterning at the organ boundaries in the higher plant shoot apex. Plant Mol Biol. 60, Alabadí D, Oyama T, Yanovsky MJ, Harmon FG, Más P, Kay SA (2001) Reciprocal regulation between TOC1 and LHY/CCA1 within the Arabidopsis circadian clock. Science 293, Allison DB, Cui X, Page GP, Sabripour M (2006) Microarray data analysis: from disarray to consolidation and consensus. Nature Reviews 7, Alonso JM, Strepanova AN, Leisse TJ, Kim CJ, Chen H, Shinn P, Stevenson DK, Zimmerman J, Barajas P, Cheuk R, et al. (2003) Genome-wide insertional mutagenesis of Arabidopsis thaliana. Science 301, Al-Shahrour F, Minguez P, Tárraga J, Montaner D, Alloza E, Vaquerizas JMM, Conde L, Blaschke C, Vera J, Dopazo J (2006) BABELOMICS: a systems biology persperctive in the functional annotation of genome-scale experiments. Nucleic Acids Research 34, W472-W476 Altschul SF, Madden TL, Schäffer AA, Zhang J, Zhang Z, Miller W, Lipman DJ (1997) Gapped BLAST and PSI- BLAST: a new generation of protein database search programs. Nucleic Acids Res. 25, An H, Roussot C, Suárez-López P, Corbesier L, Vincent C, Piñeiro M, Hepworth S, Mouradov A, Justin S, Turnbull C, Coupland G. (2004) CONSTANS acts in the phloem to regulate a systemic signal that induces photoperiodic flowering of Arabidopsis. Development 131, Aoyama T, Chua N-H (1997) A glucocorticoid-mediated transcriptional induction system in transgenic plants. The Plant Journal 11, The Arabidopsis genome initiative (2000) Analysis of the genome sequence of the flowering plant Arabidopsis thaliana. Nature 408, Asano T, Masumura T, Kusano H, Kikuchi S, Kurita A, Shimada H, Kadowaki K (2002) Construction of a specialized cdna library from plant cells isolated by laser capture microdissection: toward comprehensive analysis of the genes expressed in the rice phloem. The Plant Journal 32, Aukerman MJ, Sakai H (2003) Regulation of flowering time and floral organ identity by a microrna and its APETALA2-like target genes. Plant Cell 15, Ausin I, Alonso-Blanco C, Jarillo JA, Ruiz-Garcia L, Martinez-Zapater JM (2004) Regulation of flowering time by FVE, a retinoblastoma-associated protein. Nature Genetics 36, Ausín I, Alonso-Blanco C, Martínez-Zapater JM (2005) Environmental regulation of flowering. Int J Dev Biol. 49,
190 References 705. Balasubramanian S, Sureshkumar S, Lempe J, Weigel D (2006) Potent induction of Arabidopsis thaliana flowering by elevated growth temperature. PloS Genetics 2, e106. Bäurle I, Dean C (2006) The timing of developmental transitions in Plants. Cell 125, Bastow R, Mylne JS, Lister C, Lippman Z, Martienssen RA, Dean C (2004) Vernalization requires epigenetic silencing of FLC by histone methylation. Nature 427, Bennett S, Barnes C, Cox A, Davies L, Brown C (2005) Toward the 1,000 dollars human genome. Pharmacogenomics 6, Blázquez MA, Ahn JH, Weigel D (2003) A thermosensory pathway controlling flowering time in Arabidopsis thaliana. Nat Genet. 33, Blázquez MA, Ferrándiz C, Madueño F, Parcy F (2006) How floral meristem are built. Plant Molecular Biology 60, Blázquez MA, Green R, Nilsson O, Sussman MR, Weigel D (1998) Gibberellins promote flowering of arabidopsis by activating the LEAFY promoter. Plant Cell 10, Blázquez MA, Soowal LN, Lee I, Weigel D (1997) LEAFY expression and flower initiation in Arabidopsis. Development 124, Blázquez MA, Weigel D. (2000) Integration of floral inductive signals in Arabidopsis. Nature 404, Borner R, Kampmann G, Chandler J, Gleissner R, Wisman E, Apel K, Melzer S. (2000) A MADS domain gene involved in the transition to flowering in Arabidopsis. Plant J. 24, Boss PK, Bastow RM, Mylne JS, Dean C (2004) Multiple pathways in the decision to flower: enabling, promoting, and resetting. Plant Cell 16, S Bowman JL, Alvarez J, Weigel D, Meyerowitz EM, Smyth DR (1993) Control of flower development in Arabidopsis thaliana by APETALA1 and interacting genes. Development 119, Böhlenius H, Huang T, Charbonnel-Campaa L, Brunner AM, Jansson S, Strauss SH, Nilsson O (2006) CO/FT regulatory module controls timing of flowering and seasonal growth cessation in trees. Science 312, Bradley D, Ratcliffe O, Vincent C, Carpenter R, Coen E (1997) Inflorescence commitment and architecture in Arabidopsis. Science 275, Brenner S, Johnson M, Bridgham J, Golda G, Lloyd DH, Johnson D, Luo S, McCurdy S, Foy M, Ewan M, et al. (2000) Gene expression analysis by massively parallel signature sequencing (MPSS) on microbead arrays. Nat. Biotehnol. 18, Brooks III L, Strable J, Zhang X, Ohtsu K, Zhou R, Sarkar A, Hargreaves S, Elshire RJ, et al. (2009) Microdissection of shoot meristem functional domains. PloS Genetics 5, e Bünning E (1936) Die endogene Tagesrhythmic als Grundlage der photoperiodischen Reaktion. Ber. Dtsch. Bot. Ges. 54, Cardon G, Höhmann S, Klein J, Nettesheim K, Saedler H, Huijser P (1999) Molecular characterization of the Arabidopsis SBP-box genes. Gene 237, Cardon GH, Höhmann S, Nettesheim K, Saedler H, Huijser P (1997) Functional analysis o the Arabidopsis thaliana SBP-box gene SPL3: a novel gene involved in the floral transition. The Plant Journal 12,
191 References Carles CC, Fletcher JC (2003) Shoot apical meristem maintenance: the art of a dynamic balance. Trends Plant Sci. 8, Castillejo C, Pelaz S (2008) The balance between CONSTANS and TEMPRANILLO activities determines FT expression to trigger flowering. Current Biology 18, Cerdan PD, Chory J (2003). Regulation of flowering time by light quality. Nature 423, Chardon F, Damerval C (2005) Phylogenomic analysis of the PEBP gene family in cereals. J. Mol. Evol. 61, Chen X (2004) A microrna as a translational repressor of APETALA2 in Arabidopsis flower development. Science 303, Chiang GCK, Barua D, Kramer EM, Amasino RM, Donohue K (2009) Major flowering time gene, FLOWERING LOCUS C, regulates seed germination in Arabidopsis thaliana. Proc. Natl. Acad. Sci. USA 106, Chuck G, Cigan AM, Saeteurn K, Hake S (2007) The heterochronic maize mutant Corngrass1 results from overexpression of a tandem microrna. Nature Genetics 39, Clark SE (2001) Cell signalling at the shoot meristem. Nat. Rev. Mol. Cell. Biol. 2, Clark SE, Williams RW, Meyerowitz EM (1997) The CLAVATA1 gene encodes a putative receptor kinase that controls shoot and floral meristem size in Arabidopsis. Cell 89, Cloonan N, Forrest ARR, Kolle G, Gardiner BBA, Faulkner GJ, Brown MK, Taylor DF, Steptoe AL, et al. (2008) Stem cell transcriptome profiling via massive-scale mrna sequencing. Nature Methods 5, Clough SJ, Bent AF (1998) Floral dip: a simplified method for Agrobacterium-mediated transformation of Arabidopsis thaliana. Plant J. 16, Coen ES, Meyerowitz EM (1991) The war of the whorls: genetic interactions controlling flower development. Nature 353, Conti L, Bradley D (2007) TERMINAL FLOWER1 is a mobile signal controlling Arabidopsis architecture. The Plant Cell 19, Corbesier L, Coupland G (2005) Photoperiodic flowering of Arabidopsis: integrating genetic and physiological approaches to characterization of the floral stimulus. Plant, Cell and Environment 28, Corbesier L, Coupland G. (2006) The quest for florigen: a review of recent progress. J. Exp. Bot. 57, Corbesier L, Gadisseur I, Silvestre G, Jacqmard A, Bernier G (1996) Design in Arabidopsis thaliana of a synchronous system of floral induction by one long day. The Plant Journal 9, Corbesier L, Lejeune P, Bernier G (1998) The role of carbohydrates in the induction of flowering in Arabidopsis thaliana: comparison between the wild type and a starchless mutant. Planta 206, Corbesier L, Prinsen E, Jacqmard A, Lejeune P, Van Onckelen H, Périlleux C, Bernier G (2003) Cytokinin levels in leaves, leaf exudate and shoot apical meristem of Arabidopsis thaliana during floral transition. J. Exp. Bot. 54, Corbesier L, Vincent C, Jang S, Fornara F, Fan Q, Searle I, Giakountis A, Farrona S, Gissot L, Turnbull C, Coupland G. (2007) FT protein movement contributes to long-distance signaling in floral induction of Arabidopsis. Science 316, Czechowski T, Stitt M, Altmann T, Udvardi MK, Scheible W-R (2005) Genome-wide identification and testing of superior reference genes for transcript normalization in Arabidopsis. Plant Physiology 139,
192 References Danilevskaya ON, Meng X, Selinger DA, Deschamps S, Hermon P, Vansant G, Gupta R, Ananiev EV, Muszynski MG. (2008) Involvement of the MADS-box gene ZMM4 in floral induction and inflorescence development in Maize. Plant Physiology 147, Davis SJ (2009) Integrating hormones into the floral-transition pathway of Arabidopsis thaliana. Plant Cell Environ. 32, Diévart A, Clark SE (2004) LRR-containing receptors regulating plant development and defense. Development 131, Dodsworth S (2009) A diverse and intricate signalling network regulates stem cell fate in the shoot apical meristem. Developmental Biology 336, 1-9. Edwards K, Johnstone C, Thompson C (1991) A simple and rapid method for the preparation of plant genomic DNA for PCR analysis. Nucleic Acids Research 19, Elhiti M, Stasolla C (2009) Structure and function of homodomain-leucine zipper (HD-Zip) proteins. Plant Signal Behav. 4, Eriksson S, Böhlenius H, Moritz T, Nilsson O (2006) GA 4 is the active gibberellin in the regulation of LEAFY transcription and Arabidopsis floral initiation. Plant Cell 18, Ferrándiz C, Gu Q, Martienssen R, Yanofsky MF (2000) Redundant regulation of meristem identity and plant architecture by FRUITFULL, APETALA1 and CAULIFLOWER. Development 127, Ferrari S, Galletti R, Vairo D, Cervone F, De Lorenzo G (2006) Antisense expression of the Arabidopsis thaliana AtPGIP1 gene reduces polygalacturonase-inhibiting protein accumulation and enhances susceptibility to Botrytis cinerea. Mol. Plant Microbe Interact. 19, Fornara F, Coupland G (2009) Plant phase transitions make a SPLash. Cell 138, Fornara F, Gregis V, Pelucchi N, Colombo L, Kater M (2008) The rice StMADS11-like genes OsMADS22 and OsMADS47 cause floral reversions in Arabidopsis without complementing the svp and agl24 mutants. J Exp Bot. 59, Fornara F, Panigrahi KCS, Gissot L, Sauerbrunn N, Rühl M, Jarillo JA, Coupland G (2009) Arabidopsis DOF transcription factors act redundantly to reduce CONSTANS expression and are essential for a photoperiodic flowering response. Developmental Cell 17, Fowler S, Lee K, Onouchi H, Samach A, Richardson K, Morris B, Coupland G, Putterill J (1999) GIGANTEA: a circadian clock-controlled gene that regulates photoperiodic flowering in Arabidopsis and encodes a protein with several possible membrane-spanning domains. EMBO Journal 18, Fujita H, Takemura M, Tani E, Nemoto K, Yokota A, Kohchi T (2003) An Arabidopsis MADS-box protein, AGL24, is specifically bound to and phosphorylated by meristematic receptor-like kinase (MRLK). Plant Cell Physiol. 44, Fullwood MJ, Wei C-L, Liu ET, Ruan Y (2009) Next-generation DNA sequencing of paired-end tags (PET) for transcriptome and genome analyses. Genome Research 19, Fujiwara S, Oda A, Yoshida R, Niinuma K, Miyata K, Tomozoe Y, Tajima T, Nakagawa M, Hayashi K, Coupland G, Mizoguchi T. (2008) Circadian Clock Proteins LHY and CCA1 Regulate SVP Protein Accumulation to Control Flowering in Arabidopsis. The Plant Cell 20, Gandikota M, Birkenbihl RP, Hohmann S, Cardon GH, Saedler H, Huijser P (2007) The mirna156/157 recognition element in the 3 UTR of the Arabidopsis SBP box gene SPL3 prevents early flowering by translational inhibition in seedlings. The Plant Journal 49,
193 References Gamboa A, Paéz-Valencia J, Acevedo GF, Vázquez-Moreno L, Alvarez-Buylla RE (2001) Floral transcription factor AGAMOUS interacts in vitro with a leucine-rich repeat and an acid phosphatase protein complex. Biochem. Biophys. Res. Commun. 288, Geier F, Lohmann JU, Gerstung M, Maier AT, Timmer J, Fleck C (2008) A quantitative and dynamic model for plant stem cell regulation. PloS One 3, e3553. Gendall AR, Levy YY, Wilson A, Dean C. (2001) The VERNALIZATION 2 gene mediates the epigenetic regulation of vernalization in Arabidopsis. Cell 107, Gentleman R, Carey VJ, Huber W, Irizarry RA, Dudoit S (2005) Bioinformatics and computational biology solutions using R and Bioconductor. Springer Verlag. Giakountis A., Coupland G. (2008) Phloem transport of flowering signals. Current Opinion in Plant Biology 11, 1-8. Ginsberg SD. (2005) RNA amplification strategies for small sample populations. Methods 37, Gocal GFW, Sheldon CC, Gubler F, Moritz T, Bagnall DJ, MacMillan CP, Li SF, Parish RW, Dennis ES, Weigel D, King RW (2001) GAMYB-like genes, flowering, and gibberellin signaling in Arabidopsis. Plant Physiology 127, Grandjean O, Vernoux T, Laufs P, Belcram K, Mizukami Y, Traas J (2004) In vivo analysis of cell division, cell growth, and differentiation at the shoot apical meristem in Arabidopsis. Plant Cell 16, Grant GR, Manduchi E, Stoeckert CJ Jr (2007) Analysis and management of microarray gene expression data. Curr Protoc Mol Biol. Chapter 19, Unit Greb T, Mylne JS, Crevillen P, Geraldo N, An H, et al. (2007) The PHD finger protein VRN5 functions in the epigenetic silencing of Arabidopsis FLC. Current Biology 17, Gregis V, Sessa A, Colombo L, Kater MM (2006) AGL24, SHORT VEGETATIVE PHASE, and APETALA1 redundantly control AGAMOUS during early stages of flower development in Arabidopsis. The Plant Cell 18, Gregis V, Sessa A, Colombo L, Kater MM. (2008) AGAMOUS-LIKE24 and SHORT VEGETATIVE PHASE determine floral meristem identity in Arabidopsis. The Plant Journal 56, Gregis V, Sessa A, Dorca-Fornell C, Kater MM (2009) The Arabidopsis floral meristem identity genes AP1, AGL24 and SVP directly repress class B and C floral homeotic genes. The Plant Journal 60, Gu Q, Ferrándiz C, Yanofsky MF, Martienssen R. (1998) The FRUITFULL MADS-box gene mediates cell differentiation during Arabidopsis fruit development. Development 125, Gustafson-Brown C, Savidge B, Yanofsky MF (1994) Regulation of the Arabidopsis floral homeotic gene APETALA1. Cell 76, Gyllenstrand N, Clapham D, Källman T, Lagercrantz U (2007) A Norway spruce flowering locus T homolog is implicated of control of growth rhythm in conifers. Plant Physiol. 144, Haerizadeh F, Wong CE, Singh MB, Bhalla PL. (2008) Genome-wide analysis of gene expression in soybean shoot apical meristem. Plant Mol. Biol. 69, Halliday K, Salter MG, Thingnaes E, Whitelam GC. (2003). Phytochrome control of flowering is temperature sensitive and correlates with expression of the floral integrator FT. Plant J. 33, Hanzawa Y, Money T, Bradley D. (2005) A single amino acid converts a repressor to an activator of flowering. Proc Natl Acad Sci U S A 102,
194 References Harmer SL (2009) The circadian system in higher plants. Annu. Rev. Plant Biol. 60, Hartmann U, Höhmann S, Nettesheim K, Wisman E, Saedler H, Huijser P (2000) Molecular cloning of SVP: a negative regulator of the floral transition in Arabidopsis. The Plant Journal 21(4), He Y, Michaels S, Amasino MR (2003) Regulation of flowering time by histone acetylation in Arabidopsis. Science 302, He Y, Tang RH, Hao Y, Stevens RD, Cook CW et al. (2004) Nitric oxide represses the Arabidopsis floral transition. Science 305, Helliwell CA, Wood CC, Robertson M, Peacock WJ, Dennis ES (2006) The Arabidopsis FLC protein interacts directly in vivo with SOC1 and FT chromatin and is part of a hugh-molecular-weight protein complex. The Plant Journal 46, Hempel FD, Feldman LJ (1995) Specification of chimeric flowering shoots in wild-type Arabidopsis. Plant Journal 8, Hempel FD, Weigel D, Mandel MA, Ditta G, Zambryski PC, Feldman LJ, Yanofsky MF. (1997) Floral determination and expression of floral regulatory genes in Arabidopsis. Development 124, Hepworth SR, Valverde F, Ravenscroft D, Mouradov A, Coupland G (2002) Antagonistic relation of flowering-time gene SOC1 by CONSTANS and FLC via separate promoter motifs. EMBO Journal 21, Hisamatsu T, King RW (2008) The nature of floral signals in Arabidopsis. II. Roles for FLOWERING LOCUS T (FT) and gibberellin. J. Exp. Bot. 59, Hong RL, Hamaguchi L, Busch MA, Weigel D (2003) Regulatory elements of the floral homeotic gene AGAMOUS identified by phylogenetic footprinting and shadowing. Plant Cell 15, Hsieh MH, Goodman HM (2005) A novel gene family in Arabidopsis encoding putative heptahelical transmembrane proteins homologous to human adiponectin receptors and progestin receptors. J Exp Bot. 56, Hua W, Zhang L, Liang S, Jones RL, Lu Y-T (2004) A tobacco calcium/calmodulin-binding protein kinase functions as a negative regulator of flowering. J. Biol. Chem. 279, Huq E, Tepperman JM, Quail PH. (2000) GIGANTEA is a nuclear protein involved in phytochrome signaling in Arabidopsis. Proc Natl Acad Sci U S A. 97, Imaizumi T (2010) Arabidopsis circadian clock and photoperiodism: time to think about location. Current Opinion in Plant Biology 13, Imaizumi T, Tran HG, Swartz TE, Briggs WR, Kay SA. (2003) FKF1 is essential for photoperiodic-specific light signalling in Arabidopsis. Nature 426, Inada N, Wildermuth MC. (2005) Novel tissue preparation method and cell-specific marker for laser microdissection of Arabidopsis mature leaf. Planta 221, Ingram GC, Goodrich J, Wilkinson MD, Simon R, Haughn GW, Coen ES (1995) Parallels between UNUSUAL FLORAL ORGANS and FIMBRIATA, genes controlling flower development in Arabidopsis and Antirrhinum. Plant Cell 7, Irish VF, Sussex IM. (1990) Function of the apetala1 gene during Arabidopsis floral development. Plant Cell 2, Jack T (2001) Relearning our ABCs: new twists on an old model. Trends Plant Sci. 6, Jacqmard A, Gadisseur I, Bernier G (2003) Cell division and morphological changes in the shoot apex of Arabidopsis 184
195 References thaliana during floral transition. Annals of Botany 91, Jacobsen SE, Olszewski NE (1993) Mutations at the SPINDLY locus of Arabidopsis alter gibberellin signal transduction. Plant Cell 5, Jaeger KE, Wigge P (2007) FT protein acts as a long-range signal in Arabidopsis. Current Biology 17, Jang S, Lee B, Kim C, Kim SJ, Yim J, Han JJ, Lee S, Kim SR, An G (2003) The OsFOR1 gene encodes a polygalacturonase-inhibiting protein (PGIP) that regulates floral organ number in rice. Plant Mol Biol. 53, Jang S, Marchal V, Panigrahi KCS, Wenkel S, Soppe W, Deng X-W, Valverde F, Coupland G. (2008) Arabidopsis COP1 shapes the temporal pattern of CO accumulation conferring a photoperiodic flowering response. The EMBO journal 27, Jang S, Torti S, Coupland G (2009) Genetic and spatial interactions between FT, TSF, and SVP during the early stages of floral induction in Arabidopsis. The Plant Journal 60, Jiao Y, Tausta SL, Gandotra N, Sun N, Liu T, Clay NK, Ceserani T, et al. (2009) A transcriptome atlas of rice cell types uncovers cellular, functional and developmental hierarchies. Nature Genetics 41, Johanson U, West J, Lister C, Michaels S, Amasino R, Dean C. (2000) Molecular analysis of FRIGIDA, a major determinant of natural variation in Arabidopsis flowering time. Science 290, Jung J-H, Seo Y-H, Seo PJ, Reyes JL, Yun J, Chua N-H, Park C-M (2007) The GIGANTEA-regulated microrna172 mediates photoperiodic flowering independent of CONSTANS in Arabidopsis. The Plant Cell 19, Kachroo A, Shanklin J, Whittle E, Lapchyk L, Hildebrand D, Kachroo P (2007) The Arabidopsis stearoyl-acyl carrier protein-desaturase family and the contribution of leaf isoforms to oleic acid synthesis. Plant Molecular Biology 63, Kachroo P, Shanklin J, Shah J, Whittle E, Klessig DF (2001) A fatty acid desaturase modulates the activation of defense signaling pathways in plants. Proc Natl Acad Sci U S A 98, Kardailsky I, Shukla VK, Ahn JH, Dagenais N, Christensen SK, Nguyen JT, Chory J, Harrison MJ, Weigel D. (1999) Activation tagging of the floral inducer FT. Science 286, Kehr J (2003). Single cell technology. Current Opinion in Plant Biology 6, Kempin SA, Savidge B, Yanofsky MF. (1995) Molecular basis of the cauliflower phenotype in Arabidopsis. Science 267, Kerk NM, Ceserani T, Tausta SL, Sussex IM, Nelson TM (2003) Laser Capture Microdissection of cells from plant tissues. Plant physiology 132, Kim D-H, Doyle MR, Sung S, Amasino RM (2009) Vernalization: winter and the timing of flowering in plants. Annu. Rev. Cell Dev. Biol. 25, Kim WY, Fujiwara S, Suh SS, Kim J, Kim Y, Han L, David K, Putterill J, Nam HG, Somers DE. (2007) ZEITLUPE is a circadian photoreceptor stabilized by GIGANTEA in blue light. Nature 449, King RW, Hisamatsu T, Goldschmidt EE, Blundell C (2008) The nature of floral signals in Arabidopsis. I. Photosynthesis and a far-red photoresponse independently regulate flowering by increasing expression of FLOWERING LOCUS T (FT). J. Exp. Bot. 59, Knott JE. (1934) Effect of a localized photoperiod on spinach. Proc. Am. Soc. Hort. Sci. 31, Kobayashi Y, Kaya H, Goto K, Iwabuchi M, Araki T. (1999) A pair of related genes with antagonistic roles in mediating flowering signals. Science 286,
196 References Kobayashi Y, Weigel D (2007) Move on up, it's time for change--mobile signals controlling photoperiod-dependent flowering. Genes Dev. 21, Koornneef M, Alonso-Blanco C, Blankestijn-de Vries H, Hanhart CJ, Peeters AJ. (1998) Genetic interactions among late-flowering mutants of Arabidopsis. Genetics 148, Koornneef M, Hanhart CJ, van der Veen JH. (1991) A genetic and physiological analysis of late flowering mutants in Arabidopsis thaliana. Mol Gen Genet. 229, Koornneef M, Meinke D (2010) The development of Arabidopsis as a model plant. Plant J. 61, Koornneef M, Van der Veen JH (1980) Induction and analysis of gibberellin sensitive mutants in Arabidopsis thaliana (L) Heynh. Theoretical and Applied Genetics 58, Kotake T, Takada S, Nakahigashi K, Ohto M, Goto K (2003) Arabidopsis TERMINAL FLOWER 2 gene encodes a Heterochromatin Protein 1 homolog and represses both FLOWERING LOCUS T to regulate flowering time and several floral homeotic genes. Plant Cell Physiology 44, Krizek BA, Fletcher JC (2005) Molecular mechanisms of flower development: an armchair guide. Nat. Rev. Genet. 6, Kuusk S, Sohlberg JJ, Magnus Eklund D, Sundberg E (2006) Functionally redundant SHI family genes regulate Arabidopsis gynoecium development in a dose-dependent manner. Plant J. 47, Kwiatkowska D (2008) Flowering and apical meristem growth dynamics. Journal of Experimental Botany 59, Larsson AS, Landberg K, Meeks-Wagner DM (1998) The TERMINAL FLOWER 2 (TFL2) gene controls the reproductive transition and meristem identity in Arabidopsis thaliana. Genetics 149, Laubinger S, Marchal V, Gentilhomme J, Wenkel S, Adrian J, Jang S, Kulajta C, Braun H, Coupland G, Hoecker U (2006) Arabidopsis SPA proteins regulate photoperiodic flowering and interact with the floral inducer CONSTANS to regulate its stability. Development 133, Laufs P, Grandjean O, Jonak C, Kiêu K, Traas J (1998) Cellular parameters of the shoot apical meristem in Arabidopsis. Plant Cell 10, Laux T, Mayer KFX, Berger J, Jurgens G (1996) The WUSCHEL gene is required for shoot and floral meristem integrity in Arabidopsis. Development 122, Lee I, Aukerman MJ, Gore SL, Lohman KN, Michaels SD, Weaver LM, John MC, Feldmann KA, Amasino RM (1994) Isolation of LUMINIDEPENDENS: a gene involved in the control of flowering time in Arabidopsis. Plant Cell 6, Lee H, Suh SS, Park E, Cho E, Ahn JH, Kim SG, Lee JS, Kwon YM, Lee I. (2000) The AGAMOUS-LIKE 20 MADS domain protein integrates floral inductive pathways in Arabidopsis. Genes Dev. 14, Lee H, Yoo SJ, Lee JH, Kim W, Yoo SK, Fitzgerald H, Carrington JC, Ahn JH (2010) Genetic framework for flowering-time regulation by ambient temperature-responsive mirnas in Arabidopsis. Nucleic Acids Research, ahead of print. Lee JH, Park SH, Lee JS, Ahn JH (2007a) A conserved role of SHORT VEGETATIVE PHASE (SVP) in controlling flowering time of Brassica plants. Biochim. Biophys. Acta 1769, Lee JH, Yoo SJ, Park AH, Hwang I, Lee JS, Ahn JH (2007b) Role of SVP in the control of flowering time by ambient temperature in Arabidopsis. Genes & Development 21, Lee S, Choi SC, An G (2008a) Rice SVP-group MADS-box proteins, OsMADS22 and OsMADS55, are negative 186
197 References regulators of brassinosteroid responses. Plant J. 54, Lee J, Oh M, Park H, Lee I. (2008b) SOC1 translocated to the nucleus by interaction with AGL24 directly regulates LEAFY. Plant Journal 55, Lenhard M, Bohnert A, Jurgens G, Laux T (2001) Termination of stem cell maintenance in Arabidopsis floral meristems by interactions between WUSCHEL and AGAMOUS. Cell 105, Levy YY, Mesnage S, Mylne JS, Gendall AR, Dean C. (2002) Multiple roles of Arabidopsis VRN1 in vernalization and flowering time control. Science 297, Li J, Chory J (1997) A putative leucine-rich repeat receptor kinase involved in brassinosteroid signal transduction. Cell 90, Li H, Durbin R (2009) Fast and accurate short read alignment with Burrows-Wheeler transform. Bioinformatics 25, Li D, Liu C, Shen L, Wu Y, Chen H, Robertson M, Helliwell CA, Ito T, Meyerowitz E, Yu H. (2008) A Repressor Complex Governs the Integration of Flowering Signals in Arabidopsis. Developmental Cell 15, Lifschitz E, Eviatar T, Rozman A, Shalit A, Goldschmidt A, Amsellem Z, Alvarez JP, Eshed Y (2006) The tomato FT ortholog triggers systemic signals that regulate growth and flowering and substitute for diverse environmental stimuli. Proc Natl Acad Sci U S A 103, Liljegren SJ, Gustafson-Brown C, Pinyopich A, Ditta GS, Yanofsky MF (1999) Interactions among APETALA1, LEAFY, and TERMINAL FLOWER1 specify meristem fate. Plant Cell 11, Lim M-H, Kim J, Kim Y-S, Chung K-S, Seo Y-H, Lee I, Kim I, Kim J, Hong CB, Kim H-J, Park C-M (2004) A new Arabidopsis gene, FLK, encodes an RNA binding protein with K homology motifs and regulates flowering via FLOWERING LOCUS C. Plant Cell 16, Lin MK, Belanger H, Lee YJ, Varkonyi-Gasic E, TaokaKI, Miura E, Xaconostle-Cázares B, Gendler K, Jorgensen RA, Phinney B, Lough TJ, Lucas WJ. (2007) FLOWERING LOCUS T protein may act as the long-distance florigenic signal in the Cucurbits. Plant Cell 19, Lincoln C, Long J, Yamaguchi J, Serikawa K, Hake S (1994) A knotted1-like homeobox gene in Arabidopsis is expressed in the vegetative meristem an dramatically alters leaf morphology when overexpressed in transgenic plants. Plant Cell 6, Liu C, Hongyan C, Hong LE, Hui MS, Kumar PP, Han J-H, Yih CL, Hao Y. (2008) Direct interaction of AGL24 and SOC1 integrates flowering signals in Arabidopsis. Development 135, Liu C, Thong Z, Yu H (2009a) Coming into bloom: the specification of floral meristems. Development 136, Liu C, Xi W, Shen L, Tan C, Yu H (2009b) Regulation of floral patterning by flowering time genes. Developmental Cell 16, Liu C, Zhou J, Bracha-Drori K, Yalovsky S, Ito T, Yu H (2007) Specification of Arabidopsis floral meristem identity by repression of flowering time genes. Development 134, Liu F, Marquardt S, Lister C, Swiezewski S, Dean C (2010) Targeting 3 processing of antisense transcripts triggers Arabidopsis FLC chromatin silencing. Science 327, Locke JC, Southern MM, Kozma-Bognar L, Hibberd V, Brown PE, et al. (2005) Extension of a genetic network model by iterative experimentation and mathematical analysis. Mol. Syst. Biol. 1, Lohmann JU, Hong RL, Hobe M, Busch MA, Parcy F, Simon R, Weigel D (2001) A molecular link between stem cell regulation and floral patterning in Arabidopsis. Cell 105,
198 References Long J, Barton MK. (2000) Initiation of axillary and floral meristems in Arabidopsis. Dev Biol. 218, Long JA, Moan EI, Medford JI, Barton MK (1996) A member of the KNOTTED class of homeodomain proteins encoded by the STM gene of Arabidopsis. Nature 379, Lyndon RF (1998) The shoot apical meristem: its growth and development. Cambridge University Press, Cambridge. Macknight R, Bancroft I, Page T, Lister C, Schmidt R, Love K, Westphal L, Murphy G, Sherson S, Cobbett C, Dean C (1997) FCA, a gene controlling flowering time in Arabidopsis, encodes a protein containing RNA-binding domains. Cell 89, Macknight R, Duroux M, Laurie R, Dijkwel P, Simpson G, Dean C (2002) Functional significance of the alternative transcript processing of the Arabidopsis floral promoter FCA. Plant Cell 14, Mandel MA, Gustafson-Brown C, Savidge B, Yanofsky MF. (1992) Molecular characterization of the Arabidopsis floral homeotic gene APETALA1. Nature 360, Mandel MA, Yanofsky MF. (1995a) The Arabidopsis AGL8 MADS box gene is expressed in inflorescence meristems and is negatively regulated by APETALA1. The Plant Cell 7, Mandel MA, Yanofsky MF (1995b) A gene triggering flower formation in Arabidopsis. Nature 377, Mardis ER. (2008) Next-Generation DNA Sequencing Methods. Annu. Rev. Genomics Hum. Genet. 9, Margulies M, Egholm M, Altman W, Attiya S, Bader J, Bemben L, Berka J, Braverman M, Chen Y, Chen Z, et al. (2005) Genome sequencing in microfabricated high-density picolitre reactors. Nature 437, Marioni JC, Mason CE, Mane SM, Stephens M, Gilad Y. (2008) RNA-Seq: An assessment of technical reproducibility and comparison with gene expression arrays. Genome Res. 18, Masiero S, Li MA, Will I, Hartmann U, Saedler H, Huijser P, Schwarz-Sommer Z, Sommer H (2004) INCOMPOSITA: a MADS-box gene controlling prophyll development and floral meristem identity in Antirrhinum. Development 131, Mathieu J, Yant LJ, Mürdter F, Küttner F, Schmid M (2009) Repression of flowering by the mir172 target SMZ. PLOS Biology 7, e Mathieu J, Warthmann N, Küttner F, Schmid M (2007) Export of FT protein from phloem companion cells is sufficient for floral induction in Arabidopsis. Current Biology 17, Mayer KFX, Schoof H, Haecker A, Lenhard M, Jurgens G, Laux T (1998) Role of WUSCHEL in regulating stem cell fate in the Arabidopsis shoot meristem. Cell 95, Melzer S, Majewski DM, Apel K. (1990) Early Changes in Gene Expression during the Transition from Vegetative to Generative Growth in the Long-Day Plant Sinapis alba. Plant Cell 2, Melzer S, Lens S, Gennen J, Vanneste S, Rohde A, Beeckman T. (2008) Flowering-time genes modulate meristem determinacy and growth form in Arabidopsis thaliana. Nature Genetics 40, Meyers BC, Tej SS, Vu TH, Haudenschild CD, Agrawal V, Edberg SB, Ghazal H, Decola S. (2004) Te use of MPSS for whol-genome transcriptional analysis in Arabidopsis. Genome research 14, Michaels SD, Amasino RM. (1999) FLOWERING LOCUS C encodes a novel MADS domain protein that acts as a repressor of flowering. Plant Cell 11, Michaels SD, Amasino RM. (2001) Loss of FLOWERING LOCUS C activity eliminates the late-flowering phenotype of FRIGIDA and autonomous pathway mutations but not responsiveness to vernalization. Plant Cell 13,
199 References Michaels SD, Ditta G, Gustafson-Brown C, Pelaz S, Yanofsky M, Amasino RM. (2003) AGL24 acts as a promoter of flowering in Arabidopsis and is positively regulated by vernalization. Plant J. 33, Michaels SD, Himelblau E, Kim SY, Schomburg FM, Amasino RM (2005) Integration of flowering signals in winterannual Arabidopsis. Plant Physiology 137, Mizoguchi T, Wheatley K, Hanzawa Y, Wright L, Mizoguchi M, Song HR, Carré IA, Coupland G (2002) LHY and CCA1 are partially redundant genes required to maintain circadian rhythms in Arabidopsis. Dev Cell. 2, Mizoguchi T, Wright L, Fujiwara S, Cremer F, Lee K, Onouchi H, Mouradov A, Fowler S, Kamada H, Putterill J, Coupland G. (2005) Distinct roles of GIGANTEA in promoting flowering and regulating circadian rhythms in Arabidopsis. Plant Cell 17, Mizukami Y, Ma H (1997) Determination of Arabidopsis floral meristem identity by AGAMOUS. Plant Cell 9, Mockler TC, Yu X, Shalitin D, Parikh D, Michael TP, Liou J, Huang J, Smith Z, et al. (2004) Regulation of flowering time in Arabidopsis by K homology domain proteins. Proc. Natl. Acad. Sci. USA 101, Moon J, Suh S-S, Lee H, Choi K-R, Hong CB, Paek N-C, Kim S-G, Lee I. (2003) The SOC1 MADS-box gene integrates vernalization and gibberellin signals for flowering in Arabidopsis. The Plant Journal 35, Mortazavi A, Williams BA, McCue K, Schaeffer L, Wold B. (2008) Mapping and quantifying mammalian transcriptomes by RNA-Seq. Nature Methods 5, Mouradov A, Cremer F, Coupland G. (2002) Control of flowering time: interacting pathways as a basis for diversity. Plant Cell 14, S Muñoz-Bertomeu J, Cascales-Miñana B, Mulet JM, Baroja-Fernández E, Pozueta-Romero J, Kuhn JM, Segura J, Ros R (2009) Plastidial glyceraldehyde-3-phosphate dehydrogenase deficiency leads to altered root development and affects the sugar and amino acid balance in Arabidopsis. Plant Physiol. 151, Muñoz-Bertomeu J, Cascales-Miñana B, Irles-Segura A, Mateu I, Nunes-Nesi A, Fernie AR, Segura J, Ros R (2010) The plastidial glyceraldehyde-3-phosphate dehydrogenase is critical for viable pollen development in Arabidopsis. Plant Physiol. 152, Mutasa-Göttgens E, Hedden, P (2009) Gibberellin as a factor in floral regulatory networks. J. Exp. Bot. 60, Nakazono M, Qiu F, Borsuk LA, Schnable PS (2003) Laser-Capture Microdissection, a tool for the global analysis of gene expression in specific plant cell types: identification of genes expressed differentially in epidermal cells or vascular tissues of maize. The Plant Cell 15, Nelson T, Tausta SL, Gandotra N, Liu T (2006) Laser Microdissection of plant tissue: what you see is what you get. Annu. Rev. Plant. Biol. 57, Nilsson O, Lee I, Blázquez MA, Weigel D. (1998) Flowering-time genes modulate the response to LEAFY activity. Genetics 150, Noh B, Lee SH, Kim HJ, Yi G, Shin EA, et al. (2004) Divergent roles of a pair of homologous jumonji/zinc-finger-class transcription factor proteins in the regulation of Arabidopsis flowering time. Plant Cell 16, Nygaard V, Hovig E. (2006) Options available for profiling small samples: a review of sample amplification technology when combined with microarray profiling. Nucleic Acids Res. 34, O'Malley RC, Ecker JR (2010) Linking genotype to phenotype using the Arabidopsis unimutant collection. Plant J. 61,
200 References Ohto M, Onai K, Furukawa Y, Aoki E, Araki T, Nakamura K (2001) Effects of sugar on vegetative development and floral transition in Arabidopsis. Plant Physiol. 127, Ohtsu K, Smith MB, Emrich SJ, Borsuk LA, Zhou R, Chen T, Zhang X, Timmermans MCP, Beck J, Buckner B, Janick-Buckner D, Nettleton D, Scanlon MJ, Schnable PS. (2007) Global gene expression analysis of the shoot apical meristem of maize (Zea mays L.). The Plant Journal 52, Onouchi H, Igeño MI, Périlleux C, Graves K, Coupland G (2000) Mutagenesis of plants overexpressing CONSTANS demonstrates novel interactions among Arabidopsis flowering-time genes. Plant Cell 12, Ossowski S, Schneeberger K, Clark RM, Lanz C, Warthmann N, Weigel D (2008a) Sequencing of natural strains of Arabidopsis thaliana with short reads. Genome Res. 18, Ossowski S, Schwab R, Weigel D (2008b) Gene silencing in plants using artificial micrornas and other small RNAs. Plant J. 53, Parcy F, Bomblies K, Weigel D (2002) Interaction of LEAFY, AGAMOUS and TERMINAL FLOWER1 in maintaining floral meristem identity in Arabidopsis. Development 129, Parcy F, Nilsson O, Busch MA, Lee I, Weigel D. (1998) A genetic framework for floral patterning. Nature 395, Park DH, Somers DE, Kim YS, Choy YH, Lim HK, Soh MS, Kim HJ, Kay SA, Nam HG (1999) Control of circadian rhythms and photoperiodic flowering by the Arabidopsis GIGANTEA gene. Science 285, Peiffer JA, Kaushik S, Sakai H, Arteaga-Vazquez M, Sanchez-Leon N, Ghazal H, Vielle-Calzada JP, Meyers BC. (2008) A spatial dissection of the Arabidopsis floral transcriptome by MPSS. BMC Plant Biology 8, 43. Pittendrigh CS, Minis DH. (1964) The entrainment of circadian oscillations by light and their role as photoperiodic clocks. Am. Nat. 98, Pnueli L, Carmel-Goren L, Hareven D, Gutfinger T, Alvarez J, Ganal M, Zamir D, Lifschitz E (1998) The SELF- PRUNING gene of tomato regulates vegetative to reproductive switching of sympodial meristems and is the ortholog of CEN and TFL1. Development 125, Poethig RS (2003) Phase change and the regulation of developmental timing in plants. Science 301, Poole RL (2007) The TAIR database. Methods Mol Biol. 406, Putterill J, Robson F, Lee K, Simon R, Coupland G. (1995) The CONSTANS gene of Arabidopsis promotes flowering and encodes a protein showing similarities to zinc finger transcription factors. Cell 80, Quesada V, Macknight R, Dean C, Simpson GG (2003) Autoregulation of FCA pre-mrna processing controls Arabidopsis flowering time. EMBO J. 22, Ratcliffe OJ, Amaya I, Vincent CA, Rothstein S, Carpenter R, Coen ES, Bradley DJ (1998) A common mechanism controls the life cycle and architecture of plants. Development 125, Ratcliffe OJ, Bradley DJ, Coen ES (1999) Separation of shoot and floral identity in Arabidopsis. Development 126, Rédei GP. (1962) Supervital Mutants of Arabidopsis. Genetics. 47, Reeves PH Coupland G (2001) Analysis of flowering time control in Arabidopsis by comparison of double and triple mutants. Plant Physiol. 126, Rhoades MW, Reinhart BJ, Lim LP, Burge CB, Bartel B, Bartel DP (2002) Prediction of plant microrna targets. Cell 110,
201 References Richmond TA, Bleecker AB (1999) A defect in β-oxidation causes abnormal inflorescences development in Arabidopsis. Plant Cell 11, Rijpkema AS, Gerats T, Vandenbussche M. (2007) Evolutionary complexity of MADS complexes. Curr Opin Plant Biol. 10, Robson F, Costa MM, Hepworth SR, Vizir I, Piñeiro M, Reeves PH, Putterill J, Coupland G. (2001) Functional importance of conserved domains in the flowering-time gene CONSTANS demonstrated by analysis of mutant alleles and transgenic plants. Plant J. 28, Ruiz-García L, Madueño F, Wilkinson M, Haughn G, Salinas J, Martínez-Zapater JM (1997) Different roles of flowering-time genes in the activation of floral initiation genes in Arabidopsis. Plant Cell 9, Sablowski R (2007) Flowering and determinacy in Arabidopsis. J. Exp. Bot. 58, Saddic LA, Huvermann B, Bezhani S, Su Y, Winter CM, Kwon CS, Collum RP, Wagner D (2006) The LEAFY target LMI1 is a meristem identity regulator and acts together with LEAFY to regulate expression of CAULIFLOWER. Development 133, Salomé PA, McClung CR. (2004) The Arabidopsis thaliana clock. J Biol Rhythms 19, Samach A, Onouchi H, Gold SE, Ditta GS, Schwarz-Sommer Z, Yanofsky MF, Coupland G. (2000) Distinct roles of CONSTANS target genes in reproductive development of Arabidopsis. Science 288, Sawa M, Nusinow DA, Kay SA, Imaizumi T. (2007) FKF1 and GIGANTEA Complex Formation is required for Day- Length Measurement in Arabidopsis. Science 318, Schmid M, Uhlenhaut NH, Godard F, Demar M, Bressan R, Weigel D, Lohman JU (2003) Dissection of floral induction pathways using global expression analysis. Development 130, Schomburg FM, Patton DA, Meinke DW, Amasino RM (2001) FPA, a gene involved in floral induction in Arabidopsis, encodes a protein containing RNA-recognition motifs. Plant Cell 13, Schoof H, Lenhard M, Haecker A, Mayer KF, Jürgens G, Laux T (2000) The stem cell population of Arabidopsis shoot meristems in maintained by a regulatory loop between the CLAVATA and WUSCHEL genes. Cell 100, Schultz EA, Haughn GW (1991) LEAFY, a homeotic gene that regulates inflorescence development in Arabidopsis. Plant Cell 3, Schwab R, Ossowski S, Riester M, Warthmann N, Weigel D (2006) Highly specific gene silencing by artificial micrornas in Arabidopsis. Plant Cell 18, Schwab R, Palatnik JF, Riester M, Schommer C, Schmid M, Weigel D (2005) Specific effects of micrornas on the plant transcriptome. Developmental Cell 8, Schwartz S, Grande AV, Bujdoso N, Saedler H, Huijser P (2008) The microrna regulated SBP-box genes SPL9 and SPL15 control shoot maturation in Arabidopsis. Plant Mol. Biol. 67, Scofield S, Murray JA (2006) KNOX gene function in plant stem cell niches. Plant Mol Biol. 60, Scortecci E, Michels SD, Amasino RM (2001) Identification of a MADS-box gene, FLOWERING LOCUS M, that represses flowering. The Plant Journal 26, Scortecci E, Michels SD, Amasino RM (2003) Genetic interaction between FLM and other flowering-time genes in Arabidopsis thaliana. Plant Molecular Biology 52, Searle I, He Y, Turck F, Vincent C, Fornara F, Kröber S, Amasino RA, Coupland G (2006) The transcription factor FLC confers a flowering response to vernalization by repressing meristem competence and systemic signalling in 191
202 References Arabidopsis. Genes & Development 20, Seligman K, Saviani EE, Oliveira HC, Pinto-Maglio CA, Salgado I (2008) Floral transition and nitric oxide emission during flower development in Arabidopsis thaliana is affected in nitrate reductase-deficient plant. Plant Cell physiology 49, Seo E, Lee H, Jeon J, Park H, Kim J, Noh Y-S, Lee I (2009) Crosstalk between cold response and flowering in Arabidopsis is mediated through the flowering-time gene SOC1 and its upstream negative regulator FLC. Plant Cell 21, Shalit A, Rozman A, Goldschmidt A, Alvarez JP, Bowman JL, Eshed Y, Lifschitz E (2009) The flowering hormone florigen functions as a general systemic regulator of growth and termination. Proc. Natl. Acad. Sci. USA 106, Shannon S, Meeks-Wagner DR.(1991) A Mutation in the Arabidopsis TFL1 Gene Affects Inflorescence Meristem Development. Plant Cell 3, Simon R, Igeño IM, Coupland G (1996) Activation of floral meristem identity genes in Arabidopis. Nature 384, Simpson GG (2004) The autonomous pathway: epigenetic and post-transcriptional gene regulation in the control of Arabidopsis flowering time. Curr. Opin. Plant Biol. 7, Simpson GG, Dean C. (2002) Arabidopsis, the Rosetta stone of flowering time? Science 296, Simpson GG, Dijkwel PP, Quesada V, Henderson I, Dean C (2003) FY is an RNA 3 end -processing factor that interacts with FCA to control the Arabidopsis floral transition. Cell 113, Smith DL, Fedoroff NV (1995) LRP1, a gene expressed in lateral and adventitious root primordia of arabidopsis. Plant Cell 7, Smyth DR, Bowman JL, Meyerowitz EM (1990) Early flower development in Arabidopsis. Plant Cell 2, Sohn EJ, Rojas-Pierce M, Pan S, Carter C, Serrano-Mislata A, Madueno F, Rojo E, Surpin M, Raikhel NV. (2007) The shoot meristem identity gene TFL1 is involved in flower development and trafficking to the protein storage vacuole. Proc. Natl. Acad. Sci. USA 104, Sridhar VV, Surendrarao A, Gonzalez D, Conlan RS, Liu Z (2004) Transcriptional repression of target genes by LEUNIG and SEUSS, two interacting regulatory proteins for Arabidopsis flower development. Proc Natl Acad Sci U S A. 101, Stadler R, Sauer N (1996) The Arabidopsis thaliana AtSUC2 gene is specifically expressed in companion cells. Bot. Acta 109, Stålberg K, Ståhl U, Stymne S, Ohlrogge J (2009) Characterization of two Arabidopsis thaliana acyltransferases with preference for lysophosphatidylethanolamine. BMC Plant Biol. 9, 60. Strayer CA, Kay SA. (1999) The ins and outs of circadian regulated gene expression. Curr Opin Plant Biol. 2, Suárez-López P, Wheatley K, Robson F, Onouchi H, Valverde F, Coupland G. (2001) CONSTANS mediates between the circadian clock and the control of flowering in Arabidopsis. Nature 410, Sung S, Amasino RM. (2004) Vernalization in Arabidopsis thaliana is mediated by the PHD finger protein VIN3. Nature 427, Sung S, Schmitz RJ, Amasino RM (2006) A PHD finger protein involved in both the vernalization and photoperiodic pathways in Arabidopsis. Genes Dev. 20, Sweetlove LJ, Lytovchenko A, Morgan M, Nunes-Nesi A, Taylor NL, Baxter CJ, Eickmeier I, Fernie AR (2006) 192
203 References Mitochondrial uncoupling protein is required for efficient photosynthesis. Proc. Natl. Acad. Sci. USA 103, Swiezewski S, Liu F, Magusin A, Dean C (2009) Cold-induced silencing by long antisense transcripts of an Arabidopsis Polycomb target. Nature 462, Takada S, Goto K (2003) TERMINAL FLOWER2, an Arabidopsis homolog of HETEROCHROMATIN PROTEIN1, counteracts the activation of FLOWERING LOCUS T by CONSTANS in the vascular tissues of leaves to regulate flowering time. The Plant Cell 15, Tamaki S, Matsuo S, Wong HL, Yokoi S, Shimamoto K. (2007) Hd3a protein is a mobile flowering signal in rice. Science 316, Tan Q K-G, Irish VF (2006) The Arabidopsis zinc finger-homeodomain genes encode proteins with unique biochemical properties that are coordinately expressed during floral development. Plant Physiology 140, Teper-Bamholker P, Samach A. (2005) The Flowering Integrator FT Regulates SEPALLATA3 and FRUITFULL Accumulation in Arabidopsis Leaves. The Plant Cell 17, Theissen G, Saedler H (2001) Plant biology. Floral quartets. Nature 409, Thomashow, MF (1999) Plant cold acclimation: freezing tolerance genes and regulatory mechanisms. Annu. Rev. Plant Physiol. Plant Mol. Biol. 50, Tooke F, Ordidge M, Chiurugwi T, Battey N. (2005) Mechanisms and function of flower and inflorescence reversion. J Exp Bot. 56, Torii KU, Mitsukawa N, Oosumi T, Matsuura Y, Yokoyama R, Whittier RF, Komeda Y (1996) The Arabidopsis ERECTA gene encodes a putative receptor protein kinase with extracellular leucine-rich repeats. Plant Cell 8, Trevaskis B, Tadege M, Hemming MN, Peacock WJ, Dennis ES, Sheldon C (2007) Short Vegetative Phase-like MADS-box genes inhibit floral meristem identity in barley. Plant Physiol. 143, Turck F, Fornara F, Coupland G (2008) Regulation and identity of florigen: FLOWERING LOCUS T moves center stage. Annu. Rev. Plant Biol. 59, Upchurch RG (2008) Fatty acids unsaturation, mobilization, and regulation in the response of plants to stress. Biotechnol. Lett. 30, Valverde F, Mouradov A, Soppe W, Ravenscroft D, Samach A, Coupland G. (2004) Photoreceptor regulation of CONSTANS protein in photoperiodic flowering. Science 303, van der Graaff E, Laux T, Rensing SA (2009) The WUS homeobox-containing (WOX) protein family. Genome Biol. 10, 248. Van Dijken AJH, Schluepmann H, Smeekens SCM (2004) Arabidopsis trehalose-6-phosphate synthase 1 is essential for normal vegetative growth and transition to flowering. Plant Physiol. 135, Wagner D, Sablowski RWM, Meyerowitz EM (1999) Transcriptional activation of APETALA1 by LEAFY. Science 285, Wang J-W, Czech B, Weigel D (2009a) mir156-regulated SPL transcription factors define an endogenous flowering pathway in Arabidopsis thaliana. Cell 138, Wang J-W, Schwab R, Czech B, Mica E, Weigel D (2008) Dual effects of mir156-targeted SPL genes and CYP78A5/KLUH on plastochron length and organ size in Arabidopsis thaliana. Plant Cell 20, Wang R, Farrona S, Vincent C, Joecker A, Schoof H, Turck F, Alonso-Blanco C, Coupland G, Albani MC (2009b) 193
204 References PEP1 regulates perennial flowering in Arabis alpina. Nature 459, Wang Z, Gerstein M, Snyder M (2009c) RNA-Seq: a revolutionary tool for transcriptomics. Nat Rev Genet. 10, Wang Y, Henriksson E, Söderman E, Henriksson KN, Sundberg E, Engström P (2003) The Arabidopsis homeobox gene, ATHB16, regulates leaf development and the sensitivity to photoperiod in Arabidopsis. Developmental Biology 264, Wang Y, Liu C, Yang D, Yu H, Liou Y-C (2010) Pin1At encoding a peptidyl-prolyl cis/trans isomerase regulates flowering time in Arabidopsis. Molecular Cell 37, Weigel D, Alvarez J, Smyth DR, Yanofsky MF, Meyerowitz EM. (1992) LEAFY controls floral meristem identity in Arabidopsis. Cell 69, Weigel D, Jürgens G (2002) Stem cells that make stems. Nature 415, Weigel D, Nilsson O (1995) A developmental switch sufficient for flower initiation in diverse plants. Nature 377, Wigge PA, Kim MC, Jaeger KE, Busch W, Schmid M, Lohman JU, Weigel D (2005) Integration of spatial and temporal information during floral induction in Arabidopsis. Science 309, Wilhelm BT, Landry JR (2009) RNA-Seq-quantitative measurement of expression through massively parallel RNAsequencing. Methods 48, William DA, Su Y, Smith MR, Lu M, Baldwin DA, Wagner D (2004) Genomic identification of direct target genes of LEAFY. Proc. Natl. Acad. Sci. USA 101, Wilson RN, Heckman JW, Somerville CR (1992) Gibberellin is required for flowering in Arabidopsis thaliana under short days. Plant Physiol. 100, Wong CE, Bhalla PL, Ottenhof H, Singh MB. (2008a) Transcriptional profiling of the pea shoot apical meristem reveals processes underlying its function and maintainance. BMC Plant Biology 8:73. Wong CE, Singh MB, Bhalla PL. (2008b) Molecular processes underlying the floral transition in the soybean shoot apical meristem. The Plant Journal 57, Wu G, Park MY, Conway SR, Wang J-W, Weigel D, Poethig RS (2009) The sequential action of mir156 and mir172 regulates developmental timing in Arabidopsis. Cell 138, Wu G, Poethig RS (2006) Temporal regulation of shoot development in Arabidopsis thaliana by mir156 and its target SPL3. Development 133, Xie K, Wu C, Xiong L (2006) Genomic organization, differential expression, and interaction of SQUAMOSA promoter-binding-like transcription factors and microrna156 in rice. Plant Physiol. 142, Yalovsky S, Kulukian A, Rodríguez-Concepción M, Young CA, Gruissem W (2000a) Functional requirement of plant farnesyltransferase during development in Arabidopsis. Plant Cell, 12, Yalovsky S, Rodríguez-Concepción M, Bracha K, Toledo-Ortiz G, Gruissem W (2000b) Prenylation of the floral transcription factor APETALA1 modulates its function. Plant Cell 12, Yamaguchi A, Kobayashi Y, Goto K, Abe M, Araki A (2005) TWIN SISTER OF FT (TSF) acts as a floral pathway integrator redundantly with FT. Plant Cell Physiol 46, Yamaguchi A, Wu M-F, Yang L, Wu G, Poethig RS, Wagner D (2009) The microrna-regulated SBP-box transcription factor SPL3 is a direct upstream activator of LEAFY, FRUITFULL, and APETALA1. Developmental Cell 17,
205 References Yanovsky MJ, Kay SA. (2002) Molecular basis of seasonal time measurement in Arabidopsis. Nature 419, Yoo SK, Chung KS, Kim J, Lee JH, Hong SM, Yoo SJ, Yoo SY, Lee JS, Ahn JH (2005) CONSTANS activates SUPPRESSOR OF OVEREXPRESSION OF CONSTANS 1 through FLOWERING LOCUS T to promote flowering in Arabidopsis. Plant Physiology 139, Yoshida R, Fekih R, Fujiwara S, Oda A, Miyata K, Tomozoe Y, Nakagawa M, Niinuma K, Hayashi K, Ezura H, Coupland G, Mizoguchi T (2009) Possible role of EARLY FLOWERING 3 (ELF3) in clock-dependent floral regulation by SHORT VEGETATIVE PHASE (SVP) in Arabidopsis thaliana. New Phytologist 182, Yu H, Ito T, Wellmer F, Meyerowitz EM. (2004) Repression of AGAMOUS-LIKE 24 is a crucial step in promoting flower development. Nat Genet. 36, Yu H, Xu Y, Tan EL, Kumar PP. (2002) AGAMOUS-LIKE 24, a dosage-dependent mediator of the flowering signals. Proc Natl Acad Sci U S A 99, Yu Y, Lashbrook CC, Hannapel DJ (2007) Tissue integrity and RNA quality of laser microdissected phloem of potato. Planta 226, Yu T-S, Lue W-L, Wang S-M, Chen J (2000) Mutation of Arabidopsis plastid phosphoglucose isomerase affects leaf starch synthesis and floral initiation. Plant Physiol. 123, Zeevaart JAD (1976) Physiology of flower formation. Annu. Rev. Plant Physiol. 27, Zeilinger MN, Farre EM, Taylor SR, Kay SA, Doyle FJ, et al. (2006) A novel computational model of the circadian clock in Arabidopsis that incorporates PRR7 and PRR9. Mol. Syst. Biol. 2, 58. Zhang X, Madi S, Borsuk L, Nettleton D, Elshire RJ, Buckner B, Janick-Buckner D, Beck J, Timmermans M, Schnable PS, Scanlon MJ (2007) Laser microdissection of narrow sheath mutant maize uncovers novel gene expression in the shoot apical meristem. PLoS Genetics 3(6): e101 doi: /journal.pgen Zhang Z, Schwartz S, Wagner L, Miller W (2000) A greedy algorithm for aligning DNA sequences. J Comput Biol. 7,
206 Appendix I. List of primers used in this study -RT-PCR SOC1 T003 SOC1small-R GTGATCTCCACTCAACAAAAA T004 SOC1small-R CAACAAGAGAGAAGCAGCTTTA TUBULIN F041 TUB-F CAACTCTGACCTCCGAAAGC F042 TUB-R CACATTCAGCATCTGCTCGT ACTIN2 T032 qrt-act-f GGTAACATTGTGCTCAGTGGTGG T033 qrt-act-r AACGACCTTAATCTTCATGCTGC SOC1 SOC1-RTAn-F GGATCGAGTCAGCACCAAACCG SOC1-RTAn-R CTTGAAGAACAAGGTAACCCAATGAACAAT C19 (upstream T-DNA) T151 C19-F3 GCATCCACACATAATCACGA T181 C19-R3 GTGTGGCAGGTAGCTGAAAT C19 (downstream T-DNA) T070 C19-F TCTACGGGAAGATACCACCA T071 C19-T7-R TAATACGACTCACTATAGGGAAGGGGAGTTCCACAAAGAC -Real-time PCR TSF T030 TSF-F-RT CTCGGGAATTCATCGTATTG T031 TSF-R-RT CCCTCTGGCAGTTGAAGTAA ACTIN2 T032 qrt-act-f GGTAACATTGTGCTCAGTGGTGG T033 qrt-act-r AACGACCTTAATCTTCATGCTGC SVP T074 SVP-RT-F AAGAGAACGAGCGACTTGG T075 SVP-RT-R ATACGGTAAGCCGAGCCTAA FT T144 FT-F-PLC191 CGAGTAACGAACGGTGATGA T145 FT-R-PLC192 CGCATCACACACTATATAAGTAAAACA TFL1 A07-FW-TFL1 RT GGCAAAGAGGTGGTGAGCTA A08-RE-TFL1 RT AAGATCATACTCGACCGCAAA SOC1 T003 SOC1small-R GTGATCTCCACTCAACAAAAA T004 SOC1small-R CAACAAGAGAGAAGCAGCTTTA SOC1 SOC1-RTAn-F GGATCGAGTCAGCACCAAACCG SOC1-RTAn-R CTTGAAGAACAAGGTAACCCAATGAACAAT CO F191 CO-qRT-F TAAGGATGCCAAGGAGGTTG F192 CO-qRT-R CCCTGAGGAGCCATATTTGA D13 T094 D13-F CCCGATGCTATTCGAACATT T188 D13-R TCTCTCGTCTGCACGCTCT 196
207 -Cloning SVP CDS T001 SVPattB1-F T002 SVPattB2-R SVP RNAi T008 SVPRNAi-F T009 SVPRNAi-R D13 RNAi T149 D13i-F T150 D13i-R amirnah21/31 T189 ARNA1_I T190 ARNA1_II T191 ARNA1_III T192 ARNA1_IV amirnah22/25 T193 ARNA2_I T194 ARNA2_II T195 ARNA2_III T196 ARNA2_IV D13 CDS T203 D13-GW-F T204 D13-GW-R GGGGACAAGTTTGTACAAAAAAGCAGGCTTCATGGCGAGAGAAAAGATTC GGGGACCACTTTGTACAAGAAAGCTGGGTCACCACCATACGGTAAGC GGGGACAAGTTTGTACAAAAAAGCAGGCTTATTTCCTCTGGCTTCTTCTTC GGGGACCACTTTGTACAAGAAAGCTGGGTGAAGCAAGAGAGAGAGCTTAGGT GGGGACAAGTTTGTACAAAAAAGCAGGCTGTGTGGGTTAGCTCAGAGGA GGGGACCACTTTGTACAAGAAAGCTGGGTCAAGAAACGGAGAAA gatagtaatgtcgttattaccagtctctcttttgtattcc gactggtaataacgacattactatcaaagagaatcaatga gactagtaataacgagattactttcacaggtcgtgatatg gaaagtaatctcgttattactagtctacatatatattcct gatccttgcggtggaagtcgcgatctctcttttgtattcc gatcgcgacttccaccgcaaggatcaaagagaatcaatga gatcacgacttccacggcaaggttcacaggtcgtgatatg gaaccttgccgtggaagtcgtgatctacatatatattcct GGGGACAAGTTTGTACAAAAAAGCAGGCTTCATGCTTGCGCACAAGTCTCT GGGGACCACTTTGTACAAGAAAGCTGGGTCTTACACACTAATCTGCTTATCGAAGA -Genotyping T166 SALKLB TGGTTCACGTAGTGGGCCATCG T187 GKLB CCCATTTGGACGTGAATGTAGACAC svp-41 F208 SVP-1F (wt) GACCCACTAGTTATCAGCTCAG F209 SVP-1R (wt) AAGTTATGCCTCTCTAGGAC F210 SVP-2R (mut) AAGTTATGCCTCTCTAGGTT soc1-2 SOC1-F TTCTTCTCCCTCCAGTAATGC SOC1-R GAGTTTTGCCCCTCACCATA SALKLB ful-1 T012 AGL8PG TGTATTCACGTCACATACCG T013 AGL8MG CTCATGAGCTTTCTTGAGC T014 GUS3 CTTGTAACGCGCTTTCCC ful-2 T026 ful2-1f AATGTTGTAGGAAAATTGG T027 ful2-1r TTATGAGGATCCAAGACACA T028 ful2-2f CCAATGTTGTAGGAAAATTA T029 ful2-2r ATGAGGATCCAAGACACAA svp-3 (followed by digestion with HgaI) T080 svp3f_dicap TTATTGGAATGTGTTTATATTATGAC T020 svp3-2 TTGGTAATTCAACGGAGTAA soc1-1 (followed by digestion with AvaII) T081 soc1f_dicap TCGTTATCTGAGGCATACTAAGGAC T077 SOC1WT-R TTCATCATGTTTGCTGCTTC ft-10 FT-F-Fer TAAGCAGAGTTGTTGGAGAC FT-R-Fer GTCTTCTTCGTCCGCA T187 GKLB 197
208 tsf-1 TSF-F-Fer TSF-R-Fer SALKLB c19 T151 C19-F3 T071 C19-T7-R SALKLB-F d13 T234 D13-LP T235 D13-RP 35S promoter F195 35S-For SUC2 F067 psuc2-1f FD promoter F353 pfd-2f KNAT1 promoter T005 KNAT1-F SVP.2 (intron) T205 SVP-i-R amirnah21/31 T238 piiarna1 amirnah22/25 T239 piiarna2 CACGAGGTTGGTCTCTCTTAAG CTGGCAGTTGAAGTAAGAG GCATCCACACATAATCACGA TAATACGACTCACTATAGGGAAGGGGAGTTCCACAAAGAC AAGGGTGTTGATCATCGTCTG TCAACCATAAGATCCAATGGC CTTCGCAAGACCCTTCCT CGAATTTCTCGCTTCATGGT TCCCTCTCTGCGTGTAGGA GAAGTAGCCGCGAAGACCTA GGGGTGTGTACGTTAATGGT CTGGTAATAACGACATTACTA TCGCGACTTCCACCGCAAGGA -Templates for in situ hybridisation SVP SVPT3-F SVPT7-R SOC1 SOC1T3-F SOC1T7-R AGL24 T015 AGL24-F T016 AGL24-T7R WUS T175 WUS-F T176 WUS-T7-R FD F094 FDT7-2R F095 FDT3-2F FUL F096 FULT7-R F097 FULT3-F ATTAACCCTCACTAAAGGGAATGAAGGAAGTCCTAGAGAGGCATAAC TAATACGACTCACTATAGGGAGAATTCACTACTTAGACATTGTCTC ATTAACCCTCACTAAAGGGAATCGAGGAGCTGCAACAGAT TAATACGACTCACTATAGGGTTGACCAAACTTCGCTTTCA GGATGAGAATAAGAGACTGAGGGATAAAC TAATACGACTCACTATAGGGGACCAATAACACGTACAATATCTGAAAC ACAACAACGTAGGTGGAGGA TAATACGACTCACTATAGGGCACCGTTGATGTGATCTTCA TAATACGACTCACTATAGGGaccagagcctcgaaagaggt ATTAACCCTCACTAAAGGGAtttcatcctcatcaccatcg TAATACGACTCACTATAGGGacgtctcgacaacggagttc ATTAACCCTCACTAAAGGGAgggggaagatcttgattcgt Candidate genes: C4 T040 C4-F T041 C4-T7-R C11 T054 C11-F TTCAATCCAACGGTGCAG TAATACGACTCACTATAGGGCATTAGCCATAATGGGTTGG CAATGTTGATCTGTCCGGTA 198
209 T055 C11-T7-R C15 T062 C15-F T063 C15-T7-R C19 T070 C19-F T071 C19-T7-R C20 T072 C20-F T073 C20-T7-R D3 T084 D3-F T085 D3-T7-R D13 T094 D13-F T095 D13-T7-R D13_2 T147 D13-2F T148 D13-T7-2R D19 T100 D19-F T101 D19-T7-R D27 T108 D27-F T109 D27-T7-R D29 T110 D29-F T111 D29-T7-R D31 T112 D31-F T113 D31-T7-R D35 T116 D35-F T117 D35-T7-R D37 T118 D37-F T119 D37-T7-R D55 T136 D55-F T137 D55-T7-R C21 T208 C21-F T209 C21-T7-R C22 T210 C22-F T211 C22-T7-R C23 T212 C23-F T213 C23-T7-R C25 T216 C25-F T217 C25-T7-R C26 T218 C26-F T219 C26-T7-R C27 T220 C27-F T221 C27-T7-R TAATACGACTCACTATAGGGCGAGAGATAGCGAAATGAGC ATTTTCAGGCAACACAGAGC TAATACGACTCACTATAGGGCAGCTTCTTCCTCCATTTCA TCTACGGGAAGATACCACCA TAATACGACTCACTATAGGGAAGGGGAGTTCCACAAAGAC GGATCGTAGGGTCTCAACAA TAATACGACTCACTATAGGGCCTCCACTGCCGTTACTCTA AAGCCTCTTGGTTCTGATCG TAATACGACTCACTATAGGGATTTAGCTGGAGGCCCAAAT CCCGATGCTATTCGAACATT TAATACGACTCACTATAGGGTCTCTCGTCTGCACGCTCT GTGTGGGTTAGCTCAGAGGA TAATACGACTCACTATAGGGCAAGAAACGGAGAAAGGAAA TGTTTTCTGGGCAGACACTG TAATACGACTCACTATAGGGTTCAGCCTCTCCTTCTGCAT ACAAGCCAAGGGAGGTGAG TAATACGACTCACTATAGGGATCGTTTGGGGGATAATAGC TGACAACTGTCCACGCAACT TAATACGACTCACTATAGGGCGTAAGAGGCACCCTTCTCA GGTGCTCTTGCTCATTGTGT TAATACGACTCACTATAGGGCAAATCAAGTCTCGGTTTCAA AAACGTTAAGTCGTCAAAAAGC TAATACGACTCACTATAGGGCGCAGAAAATTCAATGTACG GTCAAGAAGAGGGGTCCAGT TAATACGACTCACTATAGGGCTCCAAAACCCAACAGATTG CACGCCACATTTTATTCCTT TAATACGACTCACTATAGGGTTGTCGCTAAGTCCCAACTC GAGGGCAAAGGTGGAATAAT TAATACGACTCACTATAGGGCAGACTTAAGGGGTCAAACG GAGACTGCTAACGCCATTGT TAATACGACTCACTATAGGGATCAATTGTGACCGGTTTTT ATTCAGCAGAAGATGCAAGG TAATACGACTCACTATAGGGTCTCCTCAAGAAATCGTACTAAAAA CTTGGCTCATGGAACGTAAT TAATACGACTCACTATAGGGCCGAAAACAATATTCGACCA TCAAAGACAAGTTGCTTCCAG TAATACGACTCACTATAGGGACAAAAGTCAAAAGAACTTTCACA CATGACCTAAGCGAAATCGT TAATACGACTCACTATAGGGTCTTTTTGGAATTTTCTTTTTCA 199
210 C29 T224 C29-F GGAAGGTTTTTAAAGGAGCAG T225 C29-T7-R TAATACGACTCACTATAGGGTTCTGAAAATTAATGCGAAACA C30 T226 C30-F CTGTGGCTCATTTGCTCTTT T227 C30-T7-R TAATACGACTCACTATAGGGATCTGCAGGTCCTTCTTCCT ATHB21 T177 ATHB21-F CAGCTTTGTCAAGAGATTGGA T178 ATHB21-T7-R TAATACGACTCACTATAGGGAACAACAATCTGAACTTAACTAAGGA ATHB25 T179 ATHB25-F ACCACCACAGTCTTCGTTTC T180 ATHB25-T7-R TAATACGACTCACTATAGGGCCAACATCATCAACATCATCA PGIP2 T182 PGIP2-F GCATCCCCAAAGGAGAGTAT T183 PGIP2-T7-R TAATACGACTCACTATAGGGGCTAAAACATTGGTTCATGCT 200

211 Appendix II. Lists of genes from the Solexa gene expression data 201
212 202
213 203
214 204
215 205
216 206

217 207
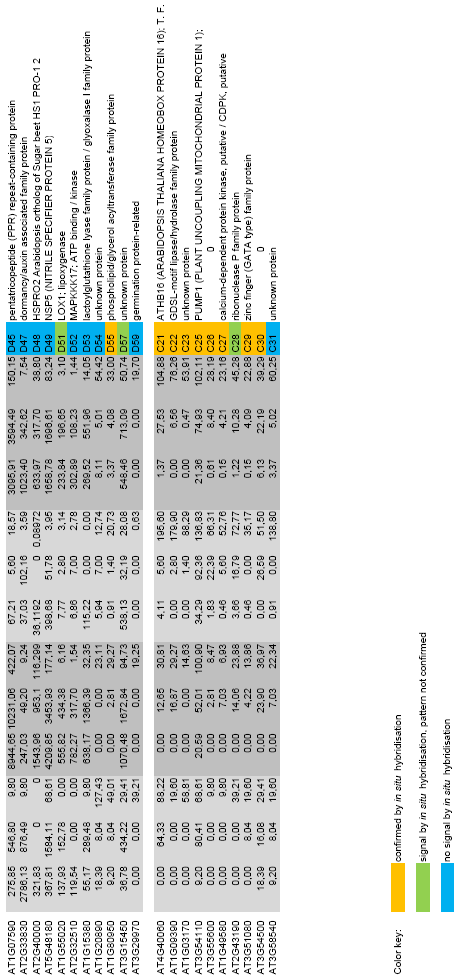
218 208
www.mpiz-koeln.mpg.de Abt. Entwicklungsbiologie de Pflanzen
 WEB ADDRESS: www.mpiz-koeln.mpg.de Forschung Abt. Entwicklungsbiologie de Pflanzen George Coupland How is the transition from vegetative growth to flowering controlled? - How is it regulated by environmental
Plant Growth & Development. Growth Stages. Differences in the Developmental Mechanisms of Plants and Animals. Development
 Plant Growth & Development Plant body is unable to move. To survive and grow, plants must be able to alter its growth, development and physiology. Plants are able to produce complex, yet variable forms
The world of non-coding RNA. Espen Enerly
 The world of non-coding RNA Espen Enerly ncrna in general Different groups Small RNAs Outline mirnas and sirnas Speculations Common for all ncrna Per def.: never translated Not spurious transcripts Always/often
Plant Responses to Environmental Cues Tropisms, Photoperiodism, and Plant Hormones
 Plant Responses to Environmental Cues Tropisms, Photoperiodism, and Plant Hormones Plant Responses to Environmental Cues Phototropism - plant growth response to light shoots bend toward light - positive
Brahma Is Required for Proper Expression of the Floral Repressor FLC in Arabidopsis
 Brahma Is Required for Proper Expression of the Floral Repressor FLC in Arabidopsis Sara Farrona 1 *., Lidia Hurtado 2., Rosana March-Díaz 2, Robert J. Schmitz 3, Francisco J. Florencio 4, Franziska Turck
Control of Gene Expression
 Control of Gene Expression What is Gene Expression? Gene expression is the process by which informa9on from a gene is used in the synthesis of a func9onal gene product. What is Gene Expression? Figure
Control of Gene Expression
 Home Gene Regulation Is Necessary? Control of Gene Expression By switching genes off when they are not needed, cells can prevent resources from being wasted. There should be natural selection favoring
Just the Facts: A Basic Introduction to the Science Underlying NCBI Resources
 1 of 8 11/7/2004 11:00 AM National Center for Biotechnology Information About NCBI NCBI at a Glance A Science Primer Human Genome Resources Model Organisms Guide Outreach and Education Databases and Tools
GENE REGULATION. Teacher Packet
 AP * BIOLOGY GENE REGULATION Teacher Packet AP* is a trademark of the College Entrance Examination Board. The College Entrance Examination Board was not involved in the production of this material. Pictures
Micro RNAs: potentielle Biomarker für das. Blutspenderscreening
 Micro RNAs: potentielle Biomarker für das Blutspenderscreening micrornas - Background Types of RNA -Coding: messenger RNA (mrna) -Non-coding (examples): Ribosomal RNA (rrna) Transfer RNA (trna) Small nuclear
Chapter 39: Plant Responses to Internal and External Signals
 Name Period Concept 39.1 Signal transduction pathways link signal reception to response This concept brings together the general ideas on cell communication from Chapter 11 with specific examples of signal
Engineering of Yellow Mosaic Virus Resistance (YMVR) in Blackgram. Project ID: 1 April 2000 to 31 August 2004. Project Duration:
 in Blackgram. Project ID: 1 April 2000 to 31 August 2004. Project Duration:") Engineering of Yellow Mosaic Virus Resistance (YMVR) in Blackgram ID: Duration: Coordinator in Switzerland: PS1 1 April 2000 to 31 August 2004 Prof. Thomas Hohn University of Basel Botanisches Institut
Engineering of Yellow Mosaic Virus Resistance (YMVR) in Blackgram ID: Duration: Coordinator in Switzerland: PS1 1 April 2000 to 31 August 2004 Prof. Thomas Hohn University of Basel Botanisches Institut
Control of Gene Expression
 Control of Gene Expression (Learning Objectives) Explain the role of gene expression is differentiation of function of cells which leads to the emergence of different tissues, organs, and organ systems
Lecture 1 MODULE 3 GENE EXPRESSION AND REGULATION OF GENE EXPRESSION. Professor Bharat Patel Office: Science 2, 2.36 Email: b.patel@griffith.edu.
 Lecture 1 MODULE 3 GENE EXPRESSION AND REGULATION OF GENE EXPRESSION Professor Bharat Patel Office: Science 2, 2.36 Email: b.patel@griffith.edu.au What is Gene Expression & Gene Regulation? 1. Gene Expression
S1 Text. Modeling deterministic single-cell microrna-p53-mdm2 network Figure 2 Figure 2
 S1 Text. Modeling deterministic single-cell microrna-p53-mdm2 network The schematic diagram of the microrna-p53-mdm2 oscillator is illustrated in Figure 2. The interaction scheme among the mrnas and the
Twincore - Zentrum für Experimentelle und Klinische Infektionsforschung Institut für Molekulare Bakteriologie
 Twincore - Zentrum für Experimentelle und Klinische Infektionsforschung Institut für Molekulare Bakteriologie 0 HELMHOLTZ I ZENTRUM FÜR INFEKTIONSFORSCHUNG Technische Universität Braunschweig Institut
Chapter 18 Regulation of Gene Expression
 Chapter 18 Regulation of Gene Expression 18.1. Gene Regulation Is Necessary By switching genes off when they are not needed, cells can prevent resources from being wasted. There should be natural selection
The Plant Cell, March 2016, www.plantcell.org 2016 American Society of Plant Biologists. All rights reserved.
 Epigenetics (TTPB4) Outline and Study Guide Overview Epigenetic modifications of DNA and chromatin affect the activity of genes and transposons. Epigenetic controls affect processes as diverse as time-of-flowering,
Complex multicellular organisms are produced by cells that switch genes on and off during development.
 Home Control of Gene Expression Gene Regulation Is Necessary? By switching genes off when they are not needed, cells can prevent resources from being wasted. There should be natural selection favoring
Gene Regulation -- The Lac Operon
 Gene Regulation -- The Lac Operon Specific proteins are present in different tissues and some appear only at certain times during development. All cells of a higher organism have the full set of genes:
Module 3 Questions. 7. Chemotaxis is an example of signal transduction. Explain, with the use of diagrams.
 Module 3 Questions Section 1. Essay and Short Answers. Use diagrams wherever possible 1. With the use of a diagram, provide an overview of the general regulation strategies available to a bacterial cell.
Outline. interfering RNA - What is dat? Brief history of RNA interference. What does it do? How does it work?
 Outline Outline interfering RNA - What is dat? Brief history of RNA interference. What does it do? How does it work? What is RNA interference? Recently discovered regulatory level. Genome immune system.
The Making of the Fittest: Evolving Switches, Evolving Bodies
 OVERVIEW MODELING THE REGULATORY SWITCHES OF THE PITX1 GENE IN STICKLEBACK FISH This hands-on activity supports the short film, The Making of the Fittest:, and aims to help students understand eukaryotic
Lecture Series 7. From DNA to Protein. Genotype to Phenotype. Reading Assignments. A. Genes and the Synthesis of Polypeptides
 Lecture Series 7 From DNA to Protein: Genotype to Phenotype Reading Assignments Read Chapter 7 From DNA to Protein A. Genes and the Synthesis of Polypeptides Genes are made up of DNA and are expressed
How To Understand How Gene Expression Is Regulated
 What makes cells different from each other? How do cells respond to information from environment? Regulation of: - Transcription - prokaryotes - eukaryotes - mrna splicing - mrna localisation and translation
MOTHER OF FT AND TFL1 Regulates Seed Germination through a Negative Feedback Loop Modulating ABA Signaling in Arabidopsis C W
 This article is a Plant Cell Advance Online Publication. The date of its first appearance online is the official date of publication. The article has been edited and the authors have corrected proofs,
Arabidopsis. A Practical Approach. Edited by ZOE A. WILSON Plant Science Division, School of Biological Sciences, University of Nottingham
 Arabidopsis A Practical Approach Edited by ZOE A. WILSON Plant Science Division, School of Biological Sciences, University of Nottingham OXPORD UNIVERSITY PRESS List of Contributors Abbreviations xv xvu
Genetic information (DNA) determines structure of proteins DNA RNA proteins cell structure 3.11 3.15 enzymes control cell chemistry ( metabolism )
 determines structure of proteins DNA RNA proteins cell structure 3.11 3.15 enzymes control cell chemistry ( metabolism )") Biology 1406 Exam 3 Notes Structure of DNA Ch. 10 Genetic information (DNA) determines structure of proteins DNA RNA proteins cell structure 3.11 3.15 enzymes control cell chemistry ( metabolism ) Proteins
Biology 1406 Exam 3 Notes Structure of DNA Ch. 10 Genetic information (DNA) determines structure of proteins DNA RNA proteins cell structure 3.11 3.15 enzymes control cell chemistry ( metabolism ) Proteins
Genetics Lecture Notes 7.03 2005. Lectures 1 2
 Genetics Lecture Notes 7.03 2005 Lectures 1 2 Lecture 1 We will begin this course with the question: What is a gene? This question will take us four lectures to answer because there are actually several
The Changing Global Egg Industry
 Vol. 46 (2), Oct. 2011, Page 3 The Changing Global Egg Industry - The new role of less developed and threshold countries in global egg production and trade 1 - Hans-Wilhelm Windhorst, Vechta, Germany Introduction
Activity 7.21 Transcription factors
 Purpose To consolidate understanding of protein synthesis. To explain the role of transcription factors and hormones in switching genes on and off. Play the transcription initiation complex game Regulation
AP Biology Essential Knowledge Student Diagnostic
 AP Biology Essential Knowledge Student Diagnostic Background The Essential Knowledge statements provided in the AP Biology Curriculum Framework are scientific claims describing phenomenon occurring in
Search Engines Chapter 2 Architecture. 14.4.2011 Felix Naumann
 Search Engines Chapter 2 Architecture 14.4.2011 Felix Naumann Overview 2 Basic Building Blocks Indexing Text Acquisition Text Transformation Index Creation Querying User Interaction Ranking Evaluation
A Primer of Genome Science THIRD
 A Primer of Genome Science THIRD EDITION GREG GIBSON-SPENCER V. MUSE North Carolina State University Sinauer Associates, Inc. Publishers Sunderland, Massachusetts USA Contents Preface xi 1 Genome Projects:
Current Motif Discovery Tools and their Limitations
 Current Motif Discovery Tools and their Limitations Philipp Bucher SIB / CIG Workshop 3 October 2006 Trendy Concepts and Hypotheses Transcription regulatory elements act in a context-dependent manner.
Kapitel 2 Unternehmensarchitektur III
 Kapitel 2 Unternehmensarchitektur III Software Architecture, Quality, and Testing FS 2015 Prof. Dr. Jana Köhler jana.koehler@hslu.ch IT Strategie Entwicklung "Foundation for Execution" "Because experts
School of Nursing. Presented by Yvette Conley, PhD
 Presented by Yvette Conley, PhD What we will cover during this webcast: Briefly discuss the approaches introduced in the paper: Genome Sequencing Genome Wide Association Studies Epigenomics Gene Expression
Lezioni Dipartimento di Oncologia Farmacologia Molecolare. RNA interference. Giovanna Damia 29 maggio 2006
 Lezioni Dipartimento di Oncologia Farmacologia Molecolare RNA interference Giovanna Damia 29 maggio 2006 RNA INTERFERENCE Sequence-specific gene suppression by dsrnas Gene silencing by dsrna: C. elegans
Translation Study Guide
 Translation Study Guide This study guide is a written version of the material you have seen presented in the replication unit. In translation, the cell uses the genetic information contained in mrna to
CONTRACTING ORGANIZATION: University of Alabama at Birmingham Birmingham, AL 35294
 AD Award Number: W81XWH-08-1-0030 TITLE: Regulation of Prostate Cancer Bone Metastasis by DKK1 PRINCIPAL INVESTIGATOR: Gregory A. Clines, M.D., Ph.D. CONTRACTING ORGANIZATION: University of Alabama at
ARABIDOPSIS. A Laboratory Manual DETLEF WEIGEL JANE GLAZEBROOK
 ARABIDOPSIS A Laboratory Manual DETLEF WEIGEL Salk Institute, Plant Biology Laboratory La Jolla, California Max Planck Institute for Developmental Biology Tubingen, Germany JANE GLAZEBROOK Torrey Mesa
Antigenic variation in Plasmodium falciparum : Erythrocyte invasion and immune escape mechanisms
 Antigenic variation in Plasmodium falciparum : Erythrocyte invasion and immune escape mechanisms Introduction Why does immunity to malaria take so long to develop? The parasite s survival depends on its
Histone modifications. and ChIP. G. Valle - Università di Padova
 Histone modifications and ChIP Histone acetylation It has been shown that the acetylation of lysines is highly dynamic and regulated by the opposing action of two families of enzymes, histone acetyltransferases
Name Class Date. Figure 13 1. 2. Which nucleotide in Figure 13 1 indicates the nucleic acid above is RNA? a. uracil c. cytosine b. guanine d.
 13 Multiple Choice RNA and Protein Synthesis Chapter Test A Write the letter that best answers the question or completes the statement on the line provided. 1. Which of the following are found in both
Gene expression profiling during gliogenesis in the Drosophila embryo. Angela Becker
 Gene expression profiling during gliogenesis in the Drosophila embryo Angela Becker Introduction to the modellorganism Drosophila melanogaster the embryonic development structure and development of the
Trasposable elements: P elements
 Trasposable elements: P elements In 1938 Marcus Rhodes provided the first genetic description of an unstable mutation, an allele of a gene required for the production of pigment in maize. This instability
Dynamics of the Genetic Regulatory Network for Arabidopsis thaliana Flower Morphogenesis
 J. theor. Biol. (1998) 193, 307 319 Article No. jt980701 Dynamics of the Genetic Regulatory Network for Arabidopsis thaliana Flower Morphogenesis LUIS MENDOZA AND ELENA R. ALVAREZ-BUYLLA* Lab. de Gene
BioBoot Camp Genetics
 BioBoot Camp Genetics BIO.B.1.2.1 Describe how the process of DNA replication results in the transmission and/or conservation of genetic information DNA Replication is the process of DNA being copied before
Transcription and Translation of DNA
 Transcription and Translation of DNA Genotype our genetic constitution ( makeup) is determined (controlled) by the sequence of bases in its genes Phenotype determined by the proteins synthesised when genes
How many of you have checked out the web site on protein-dna interactions?
 How many of you have checked out the web site on protein-dna interactions? Example of an approximately 40,000 probe spotted oligo microarray with enlarged inset to show detail. Find and be ready to discuss
(1-p) 2. p(1-p) From the table, frequency of DpyUnc = ¼ (p^2) = #DpyUnc = p^2 = 0.0004 ¼(1-p)^2 + ½(1-p)p + ¼(p^2) #Dpy + #DpyUnc
 2. p(1-p) From the table, frequency of DpyUnc = ¼ (p^2) = #DpyUnc = p^2 = 0.0004 ¼(1-p)^2 + ½(1-p)p + ¼(p^2) #Dpy + #DpyUnc") Advanced genetics Kornfeld problem set_key 1A (5 points) Brenner employed 2-factor and 3-factor crosses with the mutants isolated from his screen, and visually assayed for recombination events between
Advanced genetics Kornfeld problem set_key 1A (5 points) Brenner employed 2-factor and 3-factor crosses with the mutants isolated from his screen, and visually assayed for recombination events between
AP BIOLOGY 2009 SCORING GUIDELINES
 AP BIOLOGY 2009 SCORING GUIDELINES Question 4 The flow of genetic information from DNA to protein in eukaryotic cells is called the central dogma of biology. (a) Explain the role of each of the following
Gene Transcription in Prokaryotes
 Gene Transcription in Prokaryotes Operons: in prokaryotes, genes that encode protein participating in a common pathway are organized together. This group of genes, arranged in tandem, is called an OPERON.
Sample Questions for Exam 3
 Sample Questions for Exam 3 1. All of the following occur during prometaphase of mitosis in animal cells except a. the centrioles move toward opposite poles. b. the nucleolus can no longer be seen. c.
13.4 Gene Regulation and Expression
 13.4 Gene Regulation and Expression Lesson Objectives Describe gene regulation in prokaryotes. Explain how most eukaryotic genes are regulated. Relate gene regulation to development in multicellular organisms.
Restriction Endonucleases
 Nucleic Acids and Molecular Biology 14 Restriction Endonucleases Bearbeitet von Alfred Pingoud 1. Auflage 2004. Buch. xxvi, 443 S. Hardcover ISBN 978 3 540 20502 9 Format (B x L): 15,5 x 23,5 cm Gewicht:
MUTATION, DNA REPAIR AND CANCER
 MUTATION, DNA REPAIR AND CANCER 1 Mutation A heritable change in the genetic material Essential to the continuity of life Source of variation for natural selection New mutations are more likely to be harmful
Human Cloning The Science and Ethics of Nuclear Transplantation
 Human Cloning The Science and Ethics of Transplantation Rudolf Jaenisch, M.D. In addition to the moral argument against the use of somatic-cell nuclear for the creation of a child ( reproductive cloning
Luísa Romão. Instituto Nacional de Saúde Dr. Ricardo Jorge Av. Padre Cruz, 1649-016 Lisboa, Portugal. Cooper et al (2009) Cell 136: 777
 Cell 136: 777") Luísa Romão Instituto Nacional de Saúde Dr. Ricardo Jorge Av. Padre Cruz, 1649-016 Lisboa, Portugal Cooper et al (2009) Cell 136: 777 PTC = nonsense or stop codon = UAA, UAG, UGA PTCs can arise in a variety
Luísa Romão Instituto Nacional de Saúde Dr. Ricardo Jorge Av. Padre Cruz, 1649-016 Lisboa, Portugal Cooper et al (2009) Cell 136: 777 PTC = nonsense or stop codon = UAA, UAG, UGA PTCs can arise in a variety
In developmental genomic regulatory interactions among genes, encoding transcription factors
 JOURNAL OF COMPUTATIONAL BIOLOGY Volume 20, Number 6, 2013 # Mary Ann Liebert, Inc. Pp. 419 423 DOI: 10.1089/cmb.2012.0297 Research Articles A New Software Package for Predictive Gene Regulatory Network
AP Biology 2015 Free-Response Questions
 AP Biology 2015 Free-Response Questions College Board, Advanced Placement Program, AP, AP Central, and the acorn logo are registered trademarks of the College Board. AP Central is the official online home
Functional Biology of Plants
 Brochure More information from http://www.researchandmarkets.com/reports/2252012/ Functional Biology of Plants Description: Functional Biology of Plants provides students and researchers with a clearly
Notch 1 -dependent regulation of cell fate in colorectal cancer
 Notch 1 -dependent regulation of cell fate in colorectal cancer Referees: PD Dr. Tobias Dick Prof. Dr. Wilfried Roth http://d-nb.info/1057851272 CONTENTS Summary 1 Zusammenfassung 2 1 INTRODUCTION 3 1.1
Lecture 3: Mutations
 Lecture 3: Mutations Recall that the flow of information within a cell involves the transcription of DNA to mrna and the translation of mrna to protein. Recall also, that the flow of information between
PART 3.3: MicroRNA and Cancer
 BIBM 2010 Tutorial: Epigenomics and Cancer PART 3.3: MicroRNA and Cancer Dec 18, 2010 Sun Kim at Indiana University Outline of Part 3.3 Background on microrna Role of microrna in cancer MicroRNA pathway
Biological Sciences Initiative. Human Genome
 Biological Sciences Initiative HHMI Human Genome Introduction In 2000, researchers from around the world published a draft sequence of the entire genome. 20 labs from 6 countries worked on the sequence.
SPICE auf der Überholspur. Vergleich von ISO (TR) 15504 und Automotive SPICE
 15504 und Automotive SPICE") SPICE auf der Überholspur Vergleich von ISO (TR) 15504 und Automotive SPICE Historie Software Process Improvement and Capability determination 1994 1995 ISO 15504 Draft SPICE wird als Projekt der ISO zur
SPICE auf der Überholspur Vergleich von ISO (TR) 15504 und Automotive SPICE Historie Software Process Improvement and Capability determination 1994 1995 ISO 15504 Draft SPICE wird als Projekt der ISO zur
Profiling of non-coding RNA classes Gunter Meister
 Profiling of non-coding RNA classes Gunter Meister RNA Biology Regensburg University Universitätsstrasse 31 93053 Regensburg Overview Classes of non-coding RNAs Profiling strategies Validation Protein-RNA
Sickle cell anemia: Altered beta chain Single AA change (#6 Glu to Val) Consequence: Protein polymerizes Change in RBC shape ---> phenotypes
 Consequence: Protein polymerizes Change in RBC shape ---> phenotypes") Protein Structure Polypeptide: Protein: Therefore: Example: Single chain of amino acids 1 or more polypeptide chains All polypeptides are proteins Some proteins contain >1 polypeptide Hemoglobin (O 2 binding
Protein Structure Polypeptide: Protein: Therefore: Example: Single chain of amino acids 1 or more polypeptide chains All polypeptides are proteins Some proteins contain >1 polypeptide Hemoglobin (O 2 binding
Appendix 2 Molecular Biology Core Curriculum. Websites and Other Resources
 Appendix 2 Molecular Biology Core Curriculum Websites and Other Resources Chapter 1 - The Molecular Basis of Cancer 1. Inside Cancer http://www.insidecancer.org/ From the Dolan DNA Learning Center Cold
Recombinant DNA and Biotechnology
 Recombinant DNA and Biotechnology Chapter 18 Lecture Objectives What Is Recombinant DNA? How Are New Genes Inserted into Cells? What Sources of DNA Are Used in Cloning? What Other Tools Are Used to Study
DNA Replication & Protein Synthesis. This isn t a baaaaaaaddd chapter!!!
 DNA Replication & Protein Synthesis This isn t a baaaaaaaddd chapter!!! The Discovery of DNA s Structure Watson and Crick s discovery of DNA s structure was based on almost fifty years of research by other
Introduction to transcriptome analysis using High Throughput Sequencing technologies (HTS)
") Introduction to transcriptome analysis using High Throughput Sequencing technologies (HTS) A typical RNA Seq experiment Library construction Protocol variations Fragmentation methods RNA: nebulization,
Introduction to transcriptome analysis using High Throughput Sequencing technologies (HTS) A typical RNA Seq experiment Library construction Protocol variations Fragmentation methods RNA: nebulization,
Molecular Genetics: Challenges for Statistical Practice. J.K. Lindsey
 Molecular Genetics: Challenges for Statistical Practice J.K. Lindsey 1. What is a Microarray? 2. Design Questions 3. Modelling Questions 4. Longitudinal Data 5. Conclusions 1. What is a microarray? A microarray
LightSwitch Luciferase Assay System
 Constructs, Assays & Services Assay System Promoter GoClones Synthetic Response Elements Pathway Cell Lines 3 UTR GoClones mirna Mimics & Inhibitors Synthetic mirna Targets Transfection Reagents Assay
GENE CLONING AND RECOMBINANT DNA TECHNOLOGY
 GENE CLONING AND RECOMBINANT DNA TECHNOLOGY What is recombinant DNA? DNA from 2 different sources (often from 2 different species) are combined together in vitro. Recombinant DNA forms the basis of cloning.
Name: Class: Date: ID: A
 Name: Class: _ Date: _ Meiosis Quiz 1. (1 point) A kidney cell is an example of which type of cell? a. sex cell b. germ cell c. somatic cell d. haploid cell 2. (1 point) How many chromosomes are in a human
BCOR101 Midterm II Wednesday, October 26, 2005
 BCOR101 Midterm II Wednesday, October 26, 2005 Name Key Please show all of your work. 1. A donor strain is trp+, pro+, met+ and a recipient strain is trp-, pro-, met-. The donor strain is infected with
Genetics 301 Sample Final Examination Spring 2003
 Genetics 301 Sample Final Examination Spring 2003 50 Multiple Choice Questions-(Choose the best answer) 1. A cross between two true breeding lines one with dark blue flowers and one with bright white flowers
Protein Synthesis How Genes Become Constituent Molecules
 Protein Synthesis Protein Synthesis How Genes Become Constituent Molecules Mendel and The Idea of Gene What is a Chromosome? A chromosome is a molecule of DNA 50% 50% 1. True 2. False True False Protein
Mit einem Auge auf den mathema/schen Horizont: Was der Lehrer braucht für die Zukun= seiner Schüler
 Mit einem Auge auf den mathema/schen Horizont: Was der Lehrer braucht für die Zukun= seiner Schüler Deborah Löwenberg Ball und Hyman Bass University of Michigan U.S.A. 43. Jahrestagung für DidakEk der
The role of IBV proteins in protection: cellular immune responses. COST meeting WG2 + WG3 Budapest, Hungary, 2015
 The role of IBV proteins in protection: cellular immune responses COST meeting WG2 + WG3 Budapest, Hungary, 2015 1 Presentation include: Laboratory results Literature summary Role of T cells in response
Next Generation Sequencing
 Next Generation Sequencing Technology and applications 10/1/2015 Jeroen Van Houdt - Genomics Core - KU Leuven - UZ Leuven 1 Landmarks in DNA sequencing 1953 Discovery of DNA double helix structure 1977
Biogenesis, Size and Function of Small RNAs
 srnas of Plants Small, Non-coding RNAs of Plants Regulatory RNAs that act through gene silencing Two classes of small RNAs (srnas) o microrna (mirnas) Encoded by genes in the genome o small interfering
Systematic discovery of regulatory motifs in human promoters and 30 UTRs by comparison of several mammals
 Systematic discovery of regulatory motifs in human promoters and 30 UTRs by comparison of several mammals Xiaohui Xie 1, Jun Lu 1, E. J. Kulbokas 1, Todd R. Golub 1, Vamsi Mootha 1, Kerstin Lindblad-Toh
Introduction To Real Time Quantitative PCR (qpcr)
") Introduction To Real Time Quantitative PCR (qpcr) SABiosciences, A QIAGEN Company www.sabiosciences.com The Seminar Topics The advantages of qpcr versus conventional PCR Work flow & applications Factors
Introduction To Real Time Quantitative PCR (qpcr) SABiosciences, A QIAGEN Company www.sabiosciences.com The Seminar Topics The advantages of qpcr versus conventional PCR Work flow & applications Factors
Site-Directed Nucleases and Cisgenesis Maria Fedorova, Ph.D.
 Site-Directed Nucleases and Cisgenesis Maria Fedorova, Ph.D. Regulatory Strategy Lead Enabling Technologies DuPont-Pioneer, USA 1 New Plant Breeding Techniques 2007 New Techniques Working Group established
Chapter 5: Organization and Expression of Immunoglobulin Genes
 Chapter 5: Organization and Expression of Immunoglobulin Genes I. Genetic Model Compatible with Ig Structure A. Two models for Ab structure diversity 1. Germ-line theory: maintained that the genome contributed
岑 祥 股 份 有 限 公 司 技 術 專 員 費 軫 尹 20100803
 技 術 專 員 費 軫 尹 20100803 Overview of presentation Basic Biology of RNA interference Application of sirna for gene function? How to study mirna? How to deliver sirna and mirna? New prospects on RNAi research
Plant Classification, Structure, Growth and Hormones
 Biology SAT II Review Sheet Plants Plant Classification, Structure, Growth and Hormones Multicellular autotrophs (organisms that use the energy of inorganic materials to produce organic materials) Utilize
Feed Forward Loops in Biological Systems
 Feed Forward Loops in Biological Systems Dr. M. Vijayalakshmi School of Chemical and Biotechnology SASTRA University Joint Initiative of IITs and IISc Funded by MHRD Page 1 of 7 Table of Contents 1 INTRODUCTION...
"Fingerprinting" Vegetables DNA-based Marker Assisted Selection
 "Fingerprinting" Vegetables DNA-based Marker Assisted Selection Faster, Cheaper, More Reliable; These are some of the goals that vegetable breeders at seed companies and public institutions desire for
Summary of Discussion on Non-clinical Pharmacology Studies on Anticancer Drugs
 Provisional Translation (as of January 27, 2014)* November 15, 2013 Pharmaceuticals and Bio-products Subcommittees, Science Board Summary of Discussion on Non-clinical Pharmacology Studies on Anticancer
Head of College Scholars List Scheme. Summer Studentship. Report Form
 Head of College Scholars List Scheme Summer Studentship Report Form This report should be completed by the student with his/her project supervisor. It should summarise the work undertaken during the project
INTERNATIONAL CONFERENCE ON HARMONISATION OF TECHNICAL REQUIREMENTS FOR REGISTRATION OF PHARMACEUTICALS FOR HUMAN USE Q5B
 INTERNATIONAL CONFERENCE ON HARMONISATION OF TECHNICAL REQUIREMENTS FOR REGISTRATION OF PHARMACEUTICALS FOR HUMAN USE ICH HARMONISED TRIPARTITE GUIDELINE QUALITY OF BIOTECHNOLOGICAL PRODUCTS: ANALYSIS
Analysis of gene expression data. Ulf Leser and Philippe Thomas
 Analysis of gene expression data Ulf Leser and Philippe Thomas This Lecture Protein synthesis Microarray Idea Technologies Applications Problems Quality control Normalization Analysis next week! Ulf Leser:
http://www.springer.com/3-540-23372-5
 http://www.springer.com/3-540-23372-5 Chromatin Remodeling Factors and DNA Replication Patrick Varga-Weisz Abstract Chromatin structures have to be precisely duplicated during DNA replication to maintain
CelaSYS Customized PEGylation Solutions
 CelaSYS Customized PEGylation Solutions Neue Ära der Wirkstoffoptimierung - New Era of Drug Optimization Die celares GmbH verfügt über exzellentes fachliches Know-how in den Bereichen Synthesechemie, Biotechnologie
Wissenschaftliche Highlights der GSF 2007
 H Forschungszentrum für Umwelt und Gesundheit GmbH in der Helmholtzgemeinschaft Wissenschaftlich-Technische Abteilung Wissenschaftliche Highlights der GSF 2007 Abfrage April 2007 Institut / Selbst. Abteilung
Gene Switches Teacher Information
 STO-143 Gene Switches Teacher Information Summary Kit contains How do bacteria turn on and turn off genes? Students model the action of the lac operon that regulates the expression of genes essential for