Business Analytics using Data Mining
|
|
|
- Emery Daniels
- 10 years ago
- Views:
Transcription

1 Business Analytics using Data Mining Project Report Indian School of Business Group A6 Bhushan Khandelwal Mahabaleshwar Bhat Mayank Gupta Shikhar Angra Sujay Koparde

2 Executive Summary Idea: Our project involves developing a model for predicting the travel time for a particular cab booking. Such a model holds a lot of value for the consumers as well as the cab company. Many times customers inquire the booking agents about the time it will take to travel from their source to destination but the booking agents are not able to provide a specific time estimates. They only provide a rough estimate based on the distance between the two locations and sometimes this estimate is way off because they do not take into consideration the difference in travel time at different hours of the day and difference in time taken to cover same distance on two different routes. Value Proposition: Customers plan their travel to ensure they reach the destination on time, therefore they tend to err on the side of caution but sometimes they plan the travel so much in advance that they reach the destination much earlier than required. This is again not a desirous situation. With our model we would be able to predict the travel time quite accurately and this would allow the customers to plan the travel accordingly to ensure they reach the destination in time and not too much in advance. From Cab Company s perspective such a feature can result in better customer value and higher customer satisfaction levels which could lead to higher customer acquisition and retention levels. Data: We used the data provided by YourCabs.com for building our model. Each row in the dataset corresponds to a single journey. There were approximately 80,000 bookings in the dataset between November 2011 and November 2013 and the information included locations, time stamps, vehicle id, cancellation status, and more. For our model we needed records with both the start time and end time and thus we could work with only 21,000 records which were for Point to Point travel. We didn t consider intercity travel because of high dependence of intercity travel time on external factors. The main columns of interest for our model were: vehicle_id, from_date & to_date, from_lat, to_lat, from_long, to_long and the output variable timediff_inmin. We added some dummy variables for vehicle_id and day and time slot of journey and added a derived column distance based on the from and to latitude and longitude. Analytics Solution: Analytics solution for this model involves predicting the travel time for a particular journey. So this is a supervised data mining task. We would have all the predictors (travel day and time slot, vehicle model and from and to location) at the time of booking and so can predict the time using the model. We could have also made it a classification task rather than a prediction task but that might have involved too many classes to handle. Thus it would be better to predict the time and then add some safety buffer to give the customer a range of travel time rather than a spot prediction. Recommendations: Such a model/feature obviously needs to be tested thoroughly before going ahead with a full blown rollout. Therefore we recommend rolling out the new feature in a phase wise manner starting with certain routes where travel time can be predicted with high accuracy. The feature should be rolled out in 2-3 popular routes where the number of bookings is significant enough to test the model properly but at the same time it should not be rolled out on the most popular routes because it might impact a large number of customers if there are any issues with the model or implementation. Depending on the success of the new feature and the accuracy of the model the feature can then be rolled out on other routes too. Secondly to take care of various idiosyncrasies we recommend displaying a time range instead of spot prediction.

3 Problem Description This project would address the problem of estimating travel time for a customer. YourCabs would be able to predict the travel time (within a given range), thus giving the user much better travel time predictions and benefit of saving his waiting time. Business Goal Stakeholder: Customers and YourCabs team Business Goal Description: Estimate the time required to travel from point A to point B based on day of the week, car type and time of travel and relevant external data (if available) such as traffic conditions. The project would yield following benefits: For Cab Users: They would be able to estimate their travel time which would allow the users to plan their travel in a better way thus reduce his wait time. For YourCabs Team: A value addition/differentiation service to customers which might help the company to win additional customers. Another benefit as explained by CEO of YourCabs this model would also help in estimating the supply of cars by predicting the time a car would take to drop off a customer and be ready for next trip. This is one of the major challenges company is facing as drivers tend to delay the communication. A time prediction with 80% accuracy would be considered a success. We are keeping a buffer of 20% because of the inherent traffic problems in India such as frequent traffic jams, rallies, etc. Data Mining Goal Analytics objective: Predict the estimated travel time from source to destination for a particular journey and time of day Task Description: This is a supervised, predictive and forward-looking task as the output i.e. future travel time is predicted based on inputs such as source, destination, time of day and the vehicle_model_id chosen Outcome variable: Continuous variable Time (in minutes) Data Description Data is rich, regional dataset on cab bookings facilitated by YourCabs in Bangalore. The dataset captured between November 2011 and November 2013 includes information about over 80,000 cab bookings, their locations, time stamps, id of booking user, vehicle id, cancellation status, and more. Each row represents a journey/trip Final data used after the preparation [Annexure 4] 1) Complete possible data set: rows & 7 columns 2) Top 10 routes: 881 rows & 18 columns Detailed description of each column is provided in [Annexure 3] Data Preparation After deciding on the input and output variables the relevant data was prepared for our model. The data was prepared in three parts: Removing the unwanted data: We observed that many entries in to_time column had null values. Since our main prediction relied on to_time variable we removed all the null entries which left us
 such as traffic conditions.")
4 with around rows. Also when we calculated the time difference (= to_time from_time) most of the entries were coming out be zero. So we removed such entries as well. We also removed few outliers where time difference was coming out to be very high > 500 min. Keeping/adding the required data: Since we were predicting the time required for a particular route, we kept only P-2-P data within the city. We assumed that travel to an outside city will include stoppages etc. including such data will not be useful for our analysis. We also added distance column in our data by taking from and end location longitude and latitude values. Creating Data Categories and dummies: through following visualizations Bar chart for from_time [Annexure 1]: created 4 categories for from_time variable from 7-11 AM, 11-4 PM, 4-10 PM, 10-7 AM. For these four categories we created three dummies dmorning, dafternoon and devening. Combination chart between to_areaid, from_area_id and count(id) [Annexure 1]: This chart showed us the combination of high frequency routes. So we chose 10 most high frequency routes to these destinations that reduced our data to 800 rows. We finally created 9 dummies for these 10 routes as our input variables. Creating dummy for day of the week & Car types based on knowledge about the car Data Mining Solution For predicting the output i.e. expected duration of travel, we used the below predictive models: 1) Multi-linear Regression 2) K-Nearest Neighbor (K-NN) After the process of data preparation and massaging the data, we partitioned the data into three parts namely training, validation and test in the ratio of 50:30:20. This will help us in building the model on the training data in case of linear regression and training & validation data in case of K-NN and then testing it on test data. Methods Applied: 1) Multi-linear regression On fitting the regression model, we get the following details: The Regression Model Input variables Constant term dsmallvehicle dsedan dweekday dmorning dafternoon devening Distance Coefficient Std. Error p-value SS Residual df R-squared Std. Dev. estimate Residual SS The beta s of the model fitted are in line with the assumptions and the graphs which showed higher concentration of cab booking records during morning and evenings hours, which matches with the peak traffic and demand during these hours. The model also shows a smaller beta value for smaller cars compared to sedans as smaller cars generally take lesser time than sedans for travel within a city like Bangalore. The overall R-squared value of approximately 0.4 is also decent indicating a good fit of the model for the data. 2) K-Nearest Neighbor(K-NN) We ran the K-NN model for a value of K=10 and the best value of K as suggested by the model was 10.

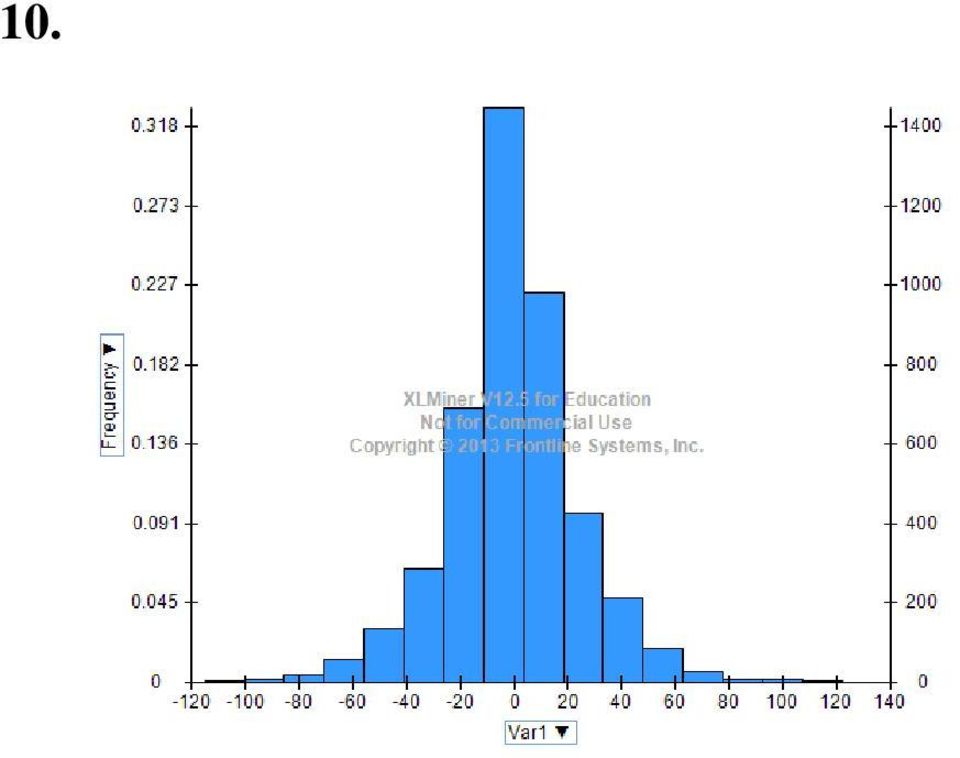
5 Performance evaluation: Choice of measure We used RMSE (root mean square error) for checking the performance of the models fitted. We observed that both linear regression and K-NN give almost the same values for RMSE. Since both the models show more or less the same performance, we did not consider the ensemble option in this case. However, for smaller number of records, as in the case of records related to travel to airport and railway station we observed that linear regression model performs better than the K-NN model. The summary reports of the models fitted are as in the annexure and shown in exhibit 7 and exhibit 8. The distribution of residuals for linear regression and K-NN are as in exhibits 9 & exhibit 10 respectively. Benchmarking We benchmarked our performance measures with the Naïve s rule which for our record set is 75 minutes for a records set of records i.e. total time/total # of records = /31674 = 75 minutes Evaluation The RMSE value of minutes as in exhibit 1 indicates a prediction accuracy of approximately 70% and it is calculated as (RMSE/Naïve rule = 25.62/75 = 0.34 = 66% accuracy)) in case of linear regression and (24.24/75 = 0.32 = 68% accuracy) in case of K-NN. We also fitted the models for records pertaining to only airport and railway station travels (roughly 7000 records) and we observed that linear regression performed better than K-NN (due to smaller size of record set) with a prediction accuracy of approximately 75%. On removing the outliers in the dataset and choosing only the top 10 routes as our record set, we observed that our model could predict with an accuracy as high as 85%. Given that the size of record set can vary depending on the scenario chosen, we chose the multi linear regression model as K-NN model s performance degrades for smaller datasets. Conclusion The prediction of travel time would definitely be useful for both the stakeholders namely the company and customers. Following are our recommendations: Roll out the new feature of time prediction in a phased manner starting with certain routes where travel time can be predicted with high accuracy. Initially the feature should not be rolled out on the most popular routes. This will ensure that if there are any specific issues then they do not impact the travel on most popular routes. Instead the feature should be rolled out on routes which lie between 5 th and 10 th on the popularity ranking. This will allow us to test the feature with substantial amount of travelers without exposing our most popular routes. [Annexure 6]. Depending on the success of the new feature it can then be rolled out on other routes too. To take care of external factors displaying a time range instead of exact time is recommended. Further we also recommend appraising/informing the user that the time prediction does not take into consideration sudden change in traffic conditions due to any external factors such as weather. Limitations: We could not achieve the desired level of accuracy due to outliers. (YourCabs has confirmed that data is erroneous specifically the end time of travel). [Annexure 5] Model does not consider the traffic conditions and external factors Dividing city into zones would probably increase the accuracy

6 Annexure 1. Demand visualization based on time of the day Pattern in the above graph was considered to divide 24hours in a day into 4 buckets Bar chart for from_time: We observed that there were two intervals from 7-11 AM and 4-10 PM where there is maximum frequency of travel. Rest 2 intervals from 11AM-4 PM and 10 PM- 7AM didn t attract much travel. So we created 4 categories for from_time variable from 7-11 AM, 11-4 PM, 4-10 PM, 10-7 AM. For these four categories we created three dummies dmorning, dafternoon and devening.

7 2. Finding Busy Routes Combination chart between to_areaid, from_area_id and count(id): This chart showed us the combination of high frequency routes. If we see observe the chart, three destinations viz, airport, railway station and MG road Bangalore were attracting maximum amount of travel. So we chose 10 most high frequency routes to these destinations that reduced our data to 800 rows. We finally created 9 dummies for these 10 routes as our input variables. 3. Data dictionary Column Name vehicle_model_id travel_type_id from_date & to_date from_lat Column Description vehicle model type type of travel (1=long distance, 2= point to point (p2p), 3= hourly rental) We built our model for only Point to Point travel Start and End datetime stamp of journey - Not used in the model latitude of from area - Not used in the model from_long to_lat to_long dsmallvehicle dsedan distance dweekday dmorning dafternoon devening timediff_inmin & longitude of from area - Not used in the model latitude of to area - Not used in the model longitude of to area - Not used in the model dummy variables for vehicle_model_id. dsmallvehicle = 1 if small vehicle, dsedan = 1 if sedan and both 0 if SUV/MUV distance between the start point and end point of journey calculated using latitude & longitude values /using data from Google Maps dummy variable for day of the week on the date of travel. 0 if day of travel falls on Saturday or Sunday. 1 otherwise dummy variable for time bucketing. 1 if start time falls between 7 a.m. and 11 a.m. dummy variable for time bucketing. 1 if start time falls between 11 a.m. and 4 p.m. dummy variable for time bucketing. 1 if start time falls between 4 p.m. and 10 p.m. Output Column total time taken for the journey. For the existing records (training/validation/test data) this was calculated by taking
, 3= hourly")
8 the time difference between from_date and to_date in minutes. 4. Final data Sample Considering all the data points Row Id. dsmallveh icle dseda n dweekda y dmornin g dafternoo n devenin g Distanc in km TimeDif inmin Considering only top 10 routes 5. Erroneous data sample Time required is less than the total distance, this is practically impossible in Bangalore


9 6. Sample Concept of usage on YourCabs.com webpage Before: After: 7. Training Data scoring - Summary Report

10 E-06 Validation Data scoring - Summary Report Test Data scoring - Summary Report Training Data scoring - Summary Report (for k=10) Validation Data scoring - Summary Report (for k=10) Test Data scoring - Summary Report (for k=10)
 3972175.385 24.54182235-0.")
11 10.
Lowering social cost of car accidents by predicting high-risk drivers
 Lowering social cost of car accidents by predicting high-risk drivers Vannessa Peng Davin Tsai Shu-Min Yeh Why we do this? Traffic accident happened every day. In order to decrease the number of traffic
Understanding Characteristics of Caravan Insurance Policy Buyer
 Understanding Characteristics of Caravan Insurance Policy Buyer May 10, 2007 Group 5 Chih Hau Huang Masami Mabuchi Muthita Songchitruksa Nopakoon Visitrattakul Executive Summary This report is intended
Determining optimum insurance product portfolio through predictive analytics BADM Final Project Report
 2012 Determining optimum insurance product portfolio through predictive analytics BADM Final Project Report Dinesh Ganti(61310071), Gauri Singh(61310560), Ravi Shankar(61310210), Shouri Kamtala(61310215),
CAB TRAVEL TIME PREDICTI - BASED ON HISTORICAL TRIP OBSERVATION
 CAB TRAVEL TIME PREDICTI - BASED ON HISTORICAL TRIP OBSERVATION N PROBLEM DEFINITION Opportunity New Booking - Time of Arrival Shortest Route (Distance/Time) Taxi-Passenger Demand Distribution Value Accurate
Prediction of Car Prices of Federal Auctions
 Prediction of Car Prices of Federal Auctions BUDT733- Final Project Report Tetsuya Morito Karen Pereira Jung-Fu Su Mahsa Saedirad 1 Executive Summary The goal of this project is to provide buyers who attend
1. What is the critical value for this 95% confidence interval? CV = z.025 = invnorm(0.025) = 1.96
 = 1.96") 1 Final Review 2 Review 2.1 CI 1-propZint Scenario 1 A TV manufacturer claims in its warranty brochure that in the past not more than 10 percent of its TV sets needed any repair during the first two years
1 Final Review 2 Review 2.1 CI 1-propZint Scenario 1 A TV manufacturer claims in its warranty brochure that in the past not more than 10 percent of its TV sets needed any repair during the first two years
JetBlue Airways Stock Price Analysis and Prediction
 JetBlue Airways Stock Price Analysis and Prediction Team Member: Lulu Liu, Jiaojiao Liu DSO530 Final Project JETBLUE AIRWAYS STOCK PRICE ANALYSIS AND PREDICTION 1 Motivation Started in February 2000, JetBlue
International Statistical Institute, 56th Session, 2007: Phil Everson
 Teaching Regression using American Football Scores Everson, Phil Swarthmore College Department of Mathematics and Statistics 5 College Avenue Swarthmore, PA198, USA E-mail: [email protected] 1. Introduction
Business Analytics using Data Mining Project Report. Optimizing Operation Room Utilization by Predicting Surgery Duration
 Business Analytics using Data Mining Project Report Optimizing Operation Room Utilization by Predicting Surgery Duration Project Team 4 102034606 WU, CHOU-CHUN 103078508 CHEN, LI-CHAN 102077503 LI, DAI-SIN
BIDM Project. Predicting the contract type for IT/ITES outsourcing contracts
 BIDM Project Predicting the contract type for IT/ITES outsourcing contracts N a n d i n i G o v i n d a r a j a n ( 6 1 2 1 0 5 5 6 ) The authors believe that data modelling can be used to predict if an
MULTIPLE REGRESSION EXAMPLE
 MULTIPLE REGRESSION EXAMPLE For a sample of n = 166 college students, the following variables were measured: Y = height X 1 = mother s height ( momheight ) X 2 = father s height ( dadheight ) X 3 = 1 if
2. Simple Linear Regression
 Research methods - II 3 2. Simple Linear Regression Simple linear regression is a technique in parametric statistics that is commonly used for analyzing mean response of a variable Y which changes according
August 2012 EXAMINATIONS Solution Part I
 August 01 EXAMINATIONS Solution Part I (1) In a random sample of 600 eligible voters, the probability that less than 38% will be in favour of this policy is closest to (B) () In a large random sample,
NCC5010: Data Analytics and Modeling Spring 2015 Practice Exemption Exam
 NCC5010: Data Analytics and Modeling Spring 2015 Practice Exemption Exam Do not look at other pages until instructed to do so. The time limit is two hours. This exam consists of 6 problems. Do all of your
Doing Multiple Regression with SPSS. In this case, we are interested in the Analyze options so we choose that menu. If gives us a number of choices:
 Doing Multiple Regression with SPSS Multiple Regression for Data Already in Data Editor Next we want to specify a multiple regression analysis for these data. The menu bar for SPSS offers several options:
CONTENTS PREFACE 1 INTRODUCTION 1 2 DATA VISUALIZATION 19
 PREFACE xi 1 INTRODUCTION 1 1.1 Overview 1 1.2 Definition 1 1.3 Preparation 2 1.3.1 Overview 2 1.3.2 Accessing Tabular Data 3 1.3.3 Accessing Unstructured Data 3 1.3.4 Understanding the Variables and Observations
KSTAT MINI-MANUAL. Decision Sciences 434 Kellogg Graduate School of Management
 KSTAT MINI-MANUAL Decision Sciences 434 Kellogg Graduate School of Management Kstat is a set of macros added to Excel and it will enable you to do the statistics required for this course very easily. To
NCSS Statistical Software Principal Components Regression. In ordinary least squares, the regression coefficients are estimated using the formula ( )
") Chapter 340 Principal Components Regression Introduction is a technique for analyzing multiple regression data that suffer from multicollinearity. When multicollinearity occurs, least squares estimates
Chapter 340 Principal Components Regression Introduction is a technique for analyzing multiple regression data that suffer from multicollinearity. When multicollinearity occurs, least squares estimates
Chapter 23. Inferences for Regression
 Chapter 23. Inferences for Regression Topics covered in this chapter: Simple Linear Regression Simple Linear Regression Example 23.1: Crying and IQ The Problem: Infants who cry easily may be more easily
Applied Data Mining Analysis: A Step-by-Step Introduction Using Real-World Data Sets
 Applied Data Mining Analysis: A Step-by-Step Introduction Using Real-World Data Sets http://info.salford-systems.com/jsm-2015-ctw August 2015 Salford Systems Course Outline Demonstration of two classification
Determining Factors of a Quick Sale in Arlington's Condo Market. Team 2: Darik Gossa Roger Moncarz Jeff Robinson Chris Frohlich James Haas
 Determining Factors of a Quick Sale in Arlington's Condo Market Team 2: Darik Gossa Roger Moncarz Jeff Robinson Chris Frohlich James Haas Executive Summary The real estate market for condominiums in Northern
Chicago Booth BUSINESS STATISTICS 41000 Final Exam Fall 2011
 Chicago Booth BUSINESS STATISTICS 41000 Final Exam Fall 2011 Name: Section: I pledge my honor that I have not violated the Honor Code Signature: This exam has 34 pages. You have 3 hours to complete this
SUMAN DUVVURU STAT 567 PROJECT REPORT
 SUMAN DUVVURU STAT 567 PROJECT REPORT SURVIVAL ANALYSIS OF HEROIN ADDICTS Background and introduction: Current illicit drug use among teens is continuing to increase in many countries around the world.
Regression Analysis: A Complete Example
 Regression Analysis: A Complete Example This section works out an example that includes all the topics we have discussed so far in this chapter. A complete example of regression analysis. PhotoDisc, Inc./Getty
Stepwise Regression. Chapter 311. Introduction. Variable Selection Procedures. Forward (Step-Up) Selection
 Selection") Chapter 311 Introduction Often, theory and experience give only general direction as to which of a pool of candidate variables (including transformed variables) should be included in the regression model.
Chapter 311 Introduction Often, theory and experience give only general direction as to which of a pool of candidate variables (including transformed variables) should be included in the regression model.
Chapter 3 - GPS Data Collection Description and Validation
 Chapter 3 - GPS Data Collection Description and Validation The first step toward the analysis of accuracy and reliability of AVI system was to identify a suitable benchmark for measuring AVI system performance.
Multiple Linear Regression in Data Mining
 Multiple Linear Regression in Data Mining Contents 2.1. A Review of Multiple Linear Regression 2.2. Illustration of the Regression Process 2.3. Subset Selection in Linear Regression 1 2 Chap. 2 Multiple
Location matters. 3 techniques to incorporate geo-spatial effects in one's predictive model
 Location matters. 3 techniques to incorporate geo-spatial effects in one's predictive model Xavier Conort [email protected] Motivation Location matters! Observed value at one location is
A Property & Casualty Insurance Predictive Modeling Process in SAS
 Paper AA-02-2015 A Property & Casualty Insurance Predictive Modeling Process in SAS 1.0 ABSTRACT Mei Najim, Sedgwick Claim Management Services, Chicago, Illinois Predictive analytics has been developing
AN ILLUSTRATION OF COMPARATIVE QUANTITATIVE RESULTS USING ALTERNATIVE ANALYTICAL TECHNIQUES
 CHAPTER 8. AN ILLUSTRATION OF COMPARATIVE QUANTITATIVE RESULTS USING ALTERNATIVE ANALYTICAL TECHNIQUES Based on TCRP B-11 Field Test Results CTA CHICAGO, ILLINOIS RED LINE SERVICE: 8A. CTA Red Line - Computation
Modeling the Relation Between Driving Behavior and Fuel Consumption
 WHITE PAPER Modeling the Relation Between Driving Behavior and Fuel Consumption Many companies are investing in coaching services for professional drivers with the goal of teaching them how to reduce fuel
Data representation and analysis in Excel
 Page 1 Data representation and analysis in Excel Let s Get Started! This course will teach you how to analyze data and make charts in Excel so that the data may be represented in a visual way that reflects
Chapter 13 Introduction to Linear Regression and Correlation Analysis
 Chapter 3 Student Lecture Notes 3- Chapter 3 Introduction to Linear Regression and Correlation Analsis Fall 2006 Fundamentals of Business Statistics Chapter Goals To understand the methods for displaing
Lesson 1: Comparison of Population Means Part c: Comparison of Two- Means
 Lesson : Comparison of Population Means Part c: Comparison of Two- Means Welcome to lesson c. This third lesson of lesson will discuss hypothesis testing for two independent means. Steps in Hypothesis
Indian School of Business Forecasting Sales for Dairy Products
 Indian School of Business Forecasting Sales for Dairy Products Contents EXECUTIVE SUMMARY... 3 Data Analysis... 3 Forecast Horizon:... 4 Forecasting Models:... 4 Fresh milk - AmulTaaza (500 ml)... 4 Dahi/
5. Multiple regression
 5. Multiple regression QBUS6840 Predictive Analytics https://www.otexts.org/fpp/5 QBUS6840 Predictive Analytics 5. Multiple regression 2/39 Outline Introduction to multiple linear regression Some useful
GTFS: GENERAL TRANSIT FEED SPECIFICATION
 GTFS: GENERAL TRANSIT FEED SPECIFICATION What is GTFS? A standard in representing schedule and route information Public Transportation Schedules GIS Data Route, trip, and stop information in one zipfile
Getting to and from Bengaluru International Airport
 Getting to and from Bengaluru International For more information, visit our website www.bengaluruairport.com For any feedback, email [email protected] Bengaluru International, Bangalore 560 300
Final Exam Practice Problem Answers
 Final Exam Practice Problem Answers The following data set consists of data gathered from 77 popular breakfast cereals. The variables in the data set are as follows: Brand: The brand name of the cereal
Real Time Bus Monitoring System by Sharing the Location Using Google Cloud Server Messaging
 Real Time Bus Monitoring System by Sharing the Location Using Google Cloud Server Messaging Aravind. P, Kalaiarasan.A 2, D. Rajini Girinath 3 PG Student, Dept. of CSE, Anand Institute of Higher Technology,
Machine Learning and Data Mining. Regression Problem. (adapted from) Prof. Alexander Ihler
 Prof. Alexander Ihler") Machine Learning and Data Mining Regression Problem (adapted from) Prof. Alexander Ihler Overview Regression Problem Definition and define parameters ϴ. Prediction using ϴ as parameters Measure the error
Machine Learning and Data Mining Regression Problem (adapted from) Prof. Alexander Ihler Overview Regression Problem Definition and define parameters ϴ. Prediction using ϴ as parameters Measure the error
Data Analysis Methodology 1
 Data Analysis Methodology 1 Suppose you inherited the database in Table 1.1 and needed to find out what could be learned from it fast. Say your boss entered your office and said, Here s some software project
Forecasting in STATA: Tools and Tricks
 Forecasting in STATA: Tools and Tricks Introduction This manual is intended to be a reference guide for time series forecasting in STATA. It will be updated periodically during the semester, and will be
Statistics 104 Final Project A Culture of Debt: A Study of Credit Card Spending in America TF: Kevin Rader Anonymous Students: LD, MH, IW, MY
 Statistics 104 Final Project A Culture of Debt: A Study of Credit Card Spending in America TF: Kevin Rader Anonymous Students: LD, MH, IW, MY ABSTRACT: This project attempted to determine the relationship
Detecting Email Spam. MGS 8040, Data Mining. Audrey Gies Matt Labbe Tatiana Restrepo
 Detecting Email Spam MGS 8040, Data Mining Audrey Gies Matt Labbe Tatiana Restrepo 5 December 2011 INTRODUCTION This report describes a model that may be used to improve likelihood of recognizing undesirable
Forecasting Analytics. Group members: - Arpita - Kapil - Kaushik - Ridhima - Ushhan
 Forecasting Analytics Group members: - Arpita - Kapil - Kaushik - Ridhima - Ushhan Business Problem Forecast daily sales of dairy products (excluding milk) to make a good prediction of future demand, and
11. Analysis of Case-control Studies Logistic Regression
 Research methods II 113 11. Analysis of Case-control Studies Logistic Regression This chapter builds upon and further develops the concepts and strategies described in Ch.6 of Mother and Child Health:
Didacticiel - Études de cas
 1 Topic Regression analysis with LazStats (OpenStat). LazStat 1 is a statistical software which is developed by Bill Miller, the father of OpenStat, a wellknow tool by statisticians since many years. These
Regression Clustering
 Chapter 449 Introduction This algorithm provides for clustering in the multiple regression setting in which you have a dependent variable Y and one or more independent variables, the X s. The algorithm
Compressed Natural Gas Study for Westport Light Duty, Inc. Kelley Blue Book Irvine, California April 3, 2012
 Compressed Natural Gas Study for Westport Light Duty, Inc. Kelley Blue Book Irvine, California April 3, 2012 2 Overview Westport Light Duty is part of the Westport Innovations company, a leader in the
MGT 267 PROJECT. Forecasting the United States Retail Sales of the Pharmacies and Drug Stores. Done by: Shunwei Wang & Mohammad Zainal
 MGT 267 PROJECT Forecasting the United States Retail Sales of the Pharmacies and Drug Stores Done by: Shunwei Wang & Mohammad Zainal Dec. 2002 The retail sale (Million) ABSTRACT The present study aims
Social Media Mining. Data Mining Essentials
 Introduction Data production rate has been increased dramatically (Big Data) and we are able store much more data than before E.g., purchase data, social media data, mobile phone data Businesses and customers
Data Mining for Business Intelligence. Concepts, Techniques, and Applications in Microsoft Office Excel with XLMiner. 2nd Edition
 Brochure More information from http://www.researchandmarkets.com/reports/2170926/ Data Mining for Business Intelligence. Concepts, Techniques, and Applications in Microsoft Office Excel with XLMiner. 2nd
4.1 Exploratory Analysis: Once the data is collected and entered, the first question is: "What do the data look like?"
 Data Analysis Plan The appropriate methods of data analysis are determined by your data types and variables of interest, the actual distribution of the variables, and the number of cases. Different analyses
How to Get More Value from Your Survey Data
 Technical report How to Get More Value from Your Survey Data Discover four advanced analysis techniques that make survey research more effective Table of contents Introduction..............................................................2
Multiple Regression Analysis A Case Study
 Multiple Regression Analysis A Case Study Case Study Method 1 The first step in a case study analysis involves research into the subject property and a determination of the key factors that impact that
How To Use A Polyanalyst
 Accident Data Analysis with PolyAnalyst Pavel Anashenko Sergei Ananyan www.megaputer.com Megaputer Intelligence, Inc. 120 West Seventh Street, Suite 310 Bloomington, IN 47404, USA +1 812-330-0110 Accident
BIG DATA FOR MODELLING 2.0
 BIG DATA FOR MODELLING 2.0 ENHANCING MODELS WITH MASSIVE REAL MOBILITY DATA DATA INTEGRATION www.ptvgroup.com Lorenzo Meschini - CEO, PTV SISTeMA COST TU1004 final Conference www.ptvgroup.com Paris, 11
Simple linear regression
 Simple linear regression Introduction Simple linear regression is a statistical method for obtaining a formula to predict values of one variable from another where there is a causal relationship between
Easily Identify Your Best Customers
 IBM SPSS Statistics Easily Identify Your Best Customers Use IBM SPSS predictive analytics software to gain insight from your customer database Contents: 1 Introduction 2 Exploring customer data Where do
MICROSOFT EXCEL 2007-2010 FORECASTING AND DATA ANALYSIS
 MICROSOFT EXCEL 2007-2010 FORECASTING AND DATA ANALYSIS Contents NOTE Unless otherwise stated, screenshots in this book were taken using Excel 2007 with a blue colour scheme and running on Windows Vista.
IBM SPSS Data Preparation 22
 IBM SPSS Data Preparation 22 Note Before using this information and the product it supports, read the information in Notices on page 33. Product Information This edition applies to version 22, release
Testing for Lack of Fit
 Chapter 6 Testing for Lack of Fit How can we tell if a model fits the data? If the model is correct then ˆσ 2 should be an unbiased estimate of σ 2. If we have a model which is not complex enough to fit
Data Mining Techniques Chapter 6: Decision Trees
 Data Mining Techniques Chapter 6: Decision Trees What is a classification decision tree?.......................................... 2 Visualizing decision trees...................................................
Moderation. Moderation
 Stats - Moderation Moderation A moderator is a variable that specifies conditions under which a given predictor is related to an outcome. The moderator explains when a DV and IV are related. Moderation
Some Essential Statistics The Lure of Statistics
 Some Essential Statistics The Lure of Statistics Data Mining Techniques, by M.J.A. Berry and G.S Linoff, 2004 Statistics vs. Data Mining..lie, damn lie, and statistics mining data to support preconceived
Regression step-by-step using Microsoft Excel
 Step 1: Regression step-by-step using Microsoft Excel Notes prepared by Pamela Peterson Drake, James Madison University Type the data into the spreadsheet The example used throughout this How to is a regression
Vehicle Reservation System Phase 1 Outcomes
 Vehicle Reservation System Phase 1 Outcomes January 2013 WASHINGTON STATE DEPARTMENT OF TRANSPORTATION FERRIES DIVISION Vehicle Reservation System Phase I Outcomes January 2013 INTRODUCTION During peak
2013 MBA Jump Start Program. Statistics Module Part 3
 2013 MBA Jump Start Program Module 1: Statistics Thomas Gilbert Part 3 Statistics Module Part 3 Hypothesis Testing (Inference) Regressions 2 1 Making an Investment Decision A researcher in your firm just
A Comparative Study of the Pickup Method and its Variations Using a Simulated Hotel Reservation Data
 A Comparative Study of the Pickup Method and its Variations Using a Simulated Hotel Reservation Data Athanasius Zakhary, Neamat El Gayar Faculty of Computers and Information Cairo University, Giza, Egypt
Predictive Modeling Techniques in Insurance
 Predictive Modeling Techniques in Insurance Tuesday May 5, 2015 JF. Breton Application Engineer 2014 The MathWorks, Inc. 1 Opening Presenter: JF. Breton: 13 years of experience in predictive analytics
Additional sources Compilation of sources: http://lrs.ed.uiuc.edu/tseportal/datacollectionmethodologies/jin-tselink/tselink.htm
 Mgt 540 Research Methods Data Analysis 1 Additional sources Compilation of sources: http://lrs.ed.uiuc.edu/tseportal/datacollectionmethodologies/jin-tselink/tselink.htm http://web.utk.edu/~dap/random/order/start.htm
Credit Risk Analysis Using Logistic Regression Modeling
 Credit Risk Analysis Using Logistic Regression Modeling Introduction A loan officer at a bank wants to be able to identify characteristics that are indicative of people who are likely to default on loans,
Studying the accuracy of demand generation from mobile phone trajectories with synthetic data
 Available online at www.sciencedirect.com Procedia Computer Science 00 (2014) 000 000 www.elsevier.com/locate/procedia The 3rd International Workshop on Agent-based Mobility, Traffic and Transportation
DEPARTMENT OF PSYCHOLOGY UNIVERSITY OF LANCASTER MSC IN PSYCHOLOGICAL RESEARCH METHODS ANALYSING AND INTERPRETING DATA 2 PART 1 WEEK 9
 DEPARTMENT OF PSYCHOLOGY UNIVERSITY OF LANCASTER MSC IN PSYCHOLOGICAL RESEARCH METHODS ANALYSING AND INTERPRETING DATA 2 PART 1 WEEK 9 Analysis of covariance and multiple regression So far in this course,
Data Mining Techniques Chapter 5: The Lure of Statistics: Data Mining Using Familiar Tools
 Data Mining Techniques Chapter 5: The Lure of Statistics: Data Mining Using Familiar Tools Occam s razor.......................................................... 2 A look at data I.........................................................
A Panel Data Analysis of Corporate Attributes and Stock Prices for Indian Manufacturing Sector
 Journal of Modern Accounting and Auditing, ISSN 1548-6583 November 2013, Vol. 9, No. 11, 1519-1525 D DAVID PUBLISHING A Panel Data Analysis of Corporate Attributes and Stock Prices for Indian Manufacturing
The TomTom Manifesto Reducing Congestion for All Big traffic data for smart mobility, traffic planning and traffic management
 The TomTom Manifesto Reducing Congestion for All Big traffic data for smart mobility, traffic planning and traffic management Ralf-Peter Schäfer Fellow & VP Traffic and Travel Information Product Unit
Chapter 7: Simple linear regression Learning Objectives
 Chapter 7: Simple linear regression Learning Objectives Reading: Section 7.1 of OpenIntro Statistics Video: Correlation vs. causation, YouTube (2:19) Video: Intro to Linear Regression, YouTube (5:18) -
How To Run Statistical Tests in Excel
 How To Run Statistical Tests in Excel Microsoft Excel is your best tool for storing and manipulating data, calculating basic descriptive statistics such as means and standard deviations, and conducting
N-Way Analysis of Variance
 N-Way Analysis of Variance 1 Introduction A good example when to use a n-way ANOVA is for a factorial design. A factorial design is an efficient way to conduct an experiment. Each observation has data
The importance of graphing the data: Anscombe s regression examples
 The importance of graphing the data: Anscombe s regression examples Bruce Weaver Northern Health Research Conference Nipissing University, North Bay May 30-31, 2008 B. Weaver, NHRC 2008 1 The Objective
SPSS Guide: Regression Analysis
 SPSS Guide: Regression Analysis I put this together to give you a step-by-step guide for replicating what we did in the computer lab. It should help you run the tests we covered. The best way to get familiar
Predicting Market Value of Soccer Players Using Linear Modeling Techniques
 1 Predicting Market Value of Soccer Players Using Linear Modeling Techniques by Yuan He Advisor: David Aldous Index Introduction ----------------------------------------------------------------------------
Customer Satisfaction Index 2014
 Customer Satisfaction Index 01 Contents Executive summary Customer satisfaction methodology Initiatives to improve customer satisfaction November 01 results Overall train network Overall bus regions Overall
Basic Statistics and Data Analysis for Health Researchers from Foreign Countries
 Basic Statistics and Data Analysis for Health Researchers from Foreign Countries Volkert Siersma [email protected] The Research Unit for General Practice in Copenhagen Dias 1 Content Quantifying association
Simple Linear Regression Inference
 Simple Linear Regression Inference 1 Inference requirements The Normality assumption of the stochastic term e is needed for inference even if it is not a OLS requirement. Therefore we have: Interpretation
White Paper Combining Attitudinal Data and Behavioral Data for Meaningful Analysis
 MAASSMEDIA, LLC WEB ANALYTICS SERVICES White Paper Combining Attitudinal Data and Behavioral Data for Meaningful Analysis By Abigail Lefkowitz, MaassMedia Executive Summary: In the fast-growing digital
Simple Predictive Analytics Curtis Seare
 Using Excel to Solve Business Problems: Simple Predictive Analytics Curtis Seare Copyright: Vault Analytics July 2010 Contents Section I: Background Information Why use Predictive Analytics? How to use
Module 6: Introduction to Time Series Forecasting
 Using Statistical Data to Make Decisions Module 6: Introduction to Time Series Forecasting Titus Awokuse and Tom Ilvento, University of Delaware, College of Agriculture and Natural Resources, Food and
An Overview of Knowledge Discovery Database and Data mining Techniques
 An Overview of Knowledge Discovery Database and Data mining Techniques Priyadharsini.C 1, Dr. Antony Selvadoss Thanamani 2 M.Phil, Department of Computer Science, NGM College, Pollachi, Coimbatore, Tamilnadu,
Chapter 27 Using Predictor Variables. Chapter Table of Contents
 Chapter 27 Using Predictor Variables Chapter Table of Contents LINEAR TREND...1329 TIME TREND CURVES...1330 REGRESSORS...1332 ADJUSTMENTS...1334 DYNAMIC REGRESSOR...1335 INTERVENTIONS...1339 TheInterventionSpecificationWindow...1339
Factors affecting online sales
 Factors affecting online sales Table of contents Summary... 1 Research questions... 1 The dataset... 2 Descriptive statistics: The exploratory stage... 3 Confidence intervals... 4 Hypothesis tests... 4
Interaction effects between continuous variables (Optional)
") Interaction effects between continuous variables (Optional) Richard Williams, University of Notre Dame, http://www.nd.edu/~rwilliam/ Last revised February 0, 05 This is a very brief overview of this somewhat
Interaction effects between continuous variables (Optional) Richard Williams, University of Notre Dame, http://www.nd.edu/~rwilliam/ Last revised February 0, 05 This is a very brief overview of this somewhat
Multiple Regression in SPSS This example shows you how to perform multiple regression. The basic command is regression : linear.
 Multiple Regression in SPSS This example shows you how to perform multiple regression. The basic command is regression : linear. In the main dialog box, input the dependent variable and several predictors.
Statistics, Data Analysis & Econometrics
 Using the LOGISTIC Procedure to Model Responses to Financial Services Direct Marketing David Marsh, Senior Credit Risk Modeler, Canadian Tire Financial Services, Welland, Ontario ABSTRACT It is more important