By Hui Bian. Office for Faculty Excellence
|
|
|
- Samuel Blankenship
- 7 years ago
- Views:
Transcription

1 By Hui Bian Office for Faculty Excellence
2 A parametric statistical test is a test whose model specifies certain conditions about the parameters of the population from which the research sample was drawn. Conditions include: The observations must be independent. The observations must be drawn from normally distributed populations These populations must have the same variances Variables involved must have been measured in at least an interval scale.
3 A non-parametric statistical test is a test whose model does NOT specify conditions about the parameters of the population from which the sample was drawn. Do not require measurement so strong as that required for the parametric tests. Most non-parametric tests apply to data in an ordinal scale, and some apply to data in nominal scale.
4 Why non-parametric tests? They do not make numerous or stringent assumptions about parameters. Or call those tests distribution-free
5 Statistical reference is concerned two types of problem: Estimation of population parameters Tests of hypotheses When the data under analysis are met those assumptions for parametric tests, we should choose parametric tests because they are more powerful than non-parametric tests.
6 Non-parametric tests focus on order or ranking Data are changed from scores to ranks or signs A parametric test focuses on the mean difference, and equivalent non-parametric test focuses on the difference between medians.
7
8 Three types of tests A one-sample test analyzes one field. A test for related samples compares two or more fields for the same set of cases. An independent-samples test analyzes one field that is grouped by categories of another field.
9 What is your objective? Automatically compare observed data to hypothesized. Binomial test: categorical fields with only two categories; Chi-Square test: all other categorical fields; and Kolmogorov-Smirnov test: continuous fields. Test sequence for randomness. Runs test: test the observed sequence of data values for randomness. Custom analysis. Manually choose your test (Click Settings tab). This setting is automatically selected if you subsequently make changes to options on the Settings tab that are incompatible with the currently selected objective.

10 How to run one-sample nonparametric tests Go to Analyze > Nonparametric Tests > One Sample
11 Example 1: Binomial test (variable with only two categories) We want to know if there is no difference between the proportion of males and females (H 0 ). Use Q2 (gender) as Field variable

12 Binomial test: Click Field tab, then click Run


13 SPSS output of binomial test the proportions of females and males in this sample significantly differ.


14 Double click the table in the output, we can get a new window called Model Viewer Model Viewer

15 Another way to get Binomial test Go to Analyze > Nonparametric Tests > Legacy Dialogue > Binomial Test
16 SPSS Output
17 Chi-square goodness of fit: it allows us to test whether the observed proportions for a categorical variable differ from hypothesized proportions. Example: we want to know whether the four grade levels have equal frequencies. Use Q3r (has four grade levels: 9 th, 10 th, 11 th, and 12 th ) We can let SPSS automatically choose expected values for us (the probability should be 25% for each grade level)

18 We can also customize our analysis Objective: customize analysis Fields: Q3r Settings: Choose Customize tests, check the second box


19 Click Options: we want equal probability In the Category column, specify category values. In the Relative Frequency column, specify a value greater than 0 for each category. Custom frequencies are treated as ratios so that, for example, specifying frequencies 1, 2, and 3 is equivalent to specifying frequencies 10, 20, and 30, and both specify that 1/6 of the records are expected to fall into the first category, 1/3 into the second, and 1/2 into the third.

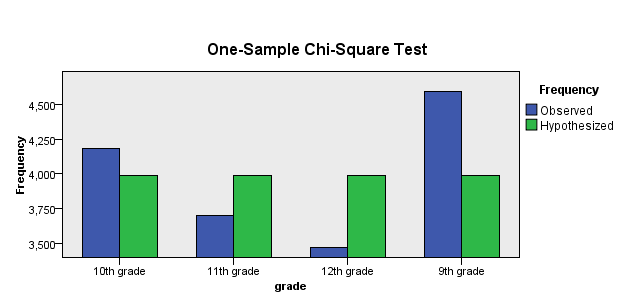
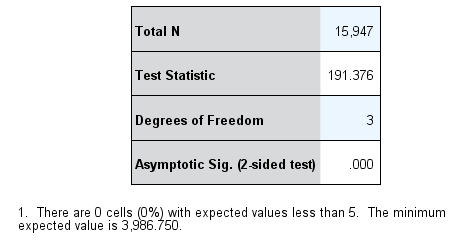
20 SPSS Output
21 Kolmogorov-Smirnov test: it is applied to continuous fields. This produces a one-sample test of whether the sample cumulative distribution function for a field is homogenous with a uniform, normal, Poisson, or exponential distribution. Example: we want to know If Q30 has a normal distribution.
22 We can let SPSS automatically choose test for us or customize analysis Q30 is a continuous variable.

23 Click Options: check Normal

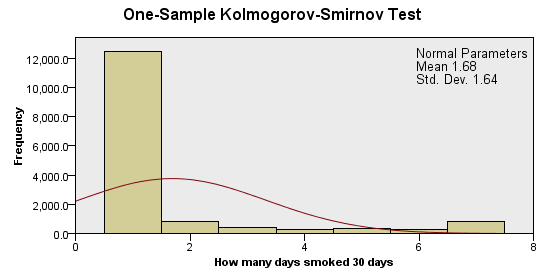

24 SPSS outputs
25 One sample median test: Wilcoxon signed rank test that allows us to test whether a sample median differs significantly from a hypothesized value. Example: we use Q80 as a field. We want to know whether the median of Q80 differs from 3.
26 Click settings

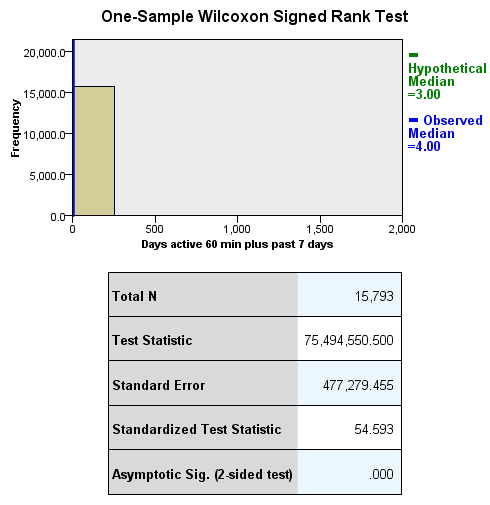
27 SPSS Outputs
28 Independent sample nonparametric tests identify differences between two or more groups using one or more nonparametric tests. Nonparametric tests do not assume your data follow the normal distribution. 2 Independent samples: grouping variable has two categories. K Independent samples: grouping variable has more than two (k) categories


29 2 Independent samples Example: we want to know whether there are gender difference on Q30 and Q80 Go to analyze > Nonparametric Test > Legacy Dialogue > 2 Independent Samples
30 Another way to run the analysis Go to Analyze > Non Parametric Tests > Independent Samples Choose Automatically compare distributions across groups
31

32 Click Settings
33 We can let SPSS make decision for us. We also can customize tests Mann-Whitney U for two groups Kruskal-Wallis 1-way ANOVA for more than two groups

34 2 Independent samples SPSS Outputs

35 SPSS Outputs


36 K Independent samples (more than two groups) Example: we want to know whether there are grade (Q3r) difference on Q30 and Q80 Go to analyze > Nonparametric Test > Legacy Dialogue > K Independent Samples

37 Another way to analyze data
38 K Independent samples: SPSS output

39 SPSS Output
40 2 Related samples: Wilcoxon signed rank sum test (identify differences between two related fields). Example: we want to know whether there is a difference between pre and post test scores of drug use (assume Q30 is a pre score and Q41 is a post score) Go to Analyze > Nonparametric Tests > Legacy Dialogue > 2 Related Samples

41 2 Related samples
42 2 Related samples : SPSS Outputs


43 Another way to analyze data Go to Analyze > Nonparametric Tests > Related Samples

44 Click Settings
45 McNemar s test (2 samples): test for change in binary data. Cochran s Q (k samples) can be applied to categorical fields. Test change for Multinomial data (2 samples): applied to ordinal fields. Compare median difference to hypothesized (2 samples): applied to continuous fields. Estimate confidence interval (2 samples): median difference of related samples
46 Quantity association (k samples): produces a measure of agreement among judges or raters. Compare distributions (k samples): applied to continuous fields.

47 SPSS Output

48 K related samples Example: we use Q30, Q41, and Q42 as three related fields to test the change.

49 From Legacy Dialogue

50
51 SPSS output

52
Statistical tests for SPSS
 Statistical tests for SPSS Paolo Coletti A.Y. 2010/11 Free University of Bolzano Bozen Premise This book is a very quick, rough and fast description of statistical tests and their usage. It is explicitly
Nonparametric Statistics
 Nonparametric Statistics J. Lozano University of Goettingen Department of Genetic Epidemiology Interdisciplinary PhD Program in Applied Statistics & Empirical Methods Graduate Seminar in Applied Statistics
Chapter G08 Nonparametric Statistics
 G08 Nonparametric Statistics Chapter G08 Nonparametric Statistics Contents 1 Scope of the Chapter 2 2 Background to the Problems 2 2.1 Parametric and Nonparametric Hypothesis Testing......................
SPSS Explore procedure
 SPSS Explore procedure One useful function in SPSS is the Explore procedure, which will produce histograms, boxplots, stem-and-leaf plots and extensive descriptive statistics. To run the Explore procedure,
Statistics. One-two sided test, Parametric and non-parametric test statistics: one group, two groups, and more than two groups samples
 Statistics One-two sided test, Parametric and non-parametric test statistics: one group, two groups, and more than two groups samples February 3, 00 Jobayer Hossain, Ph.D. & Tim Bunnell, Ph.D. Nemours
NAG C Library Chapter Introduction. g08 Nonparametric Statistics
 g08 Nonparametric Statistics Introduction g08 NAG C Library Chapter Introduction g08 Nonparametric Statistics Contents 1 Scope of the Chapter... 2 2 Background to the Problems... 2 2.1 Parametric and Nonparametric
SCHOOL OF HEALTH AND HUMAN SCIENCES DON T FORGET TO RECODE YOUR MISSING VALUES
 SCHOOL OF HEALTH AND HUMAN SCIENCES Using SPSS Topics addressed today: 1. Differences between groups 2. Graphing Use the s4data.sav file for the first part of this session. DON T FORGET TO RECODE YOUR
UNIVERSITY OF NAIROBI
 UNIVERSITY OF NAIROBI MASTERS IN PROJECT PLANNING AND MANAGEMENT NAME: SARU CAROLYNN ELIZABETH REGISTRATION NO: L50/61646/2013 COURSE CODE: LDP 603 COURSE TITLE: RESEARCH METHODS LECTURER: GAKUU CHRISTOPHER
COMPARING DATA ANALYSIS TECHNIQUES FOR EVALUATION DESIGNS WITH NON -NORMAL POFULP_TIOKS Elaine S. Jeffers, University of Maryland, Eastern Shore*
 COMPARING DATA ANALYSIS TECHNIQUES FOR EVALUATION DESIGNS WITH NON -NORMAL POFULP_TIOKS Elaine S. Jeffers, University of Maryland, Eastern Shore* The data collection phases for evaluation designs may involve
Data analysis process
 Data analysis process Data collection and preparation Collect data Prepare codebook Set up structure of data Enter data Screen data for errors Exploration of data Descriptive Statistics Graphs Analysis
Projects Involving Statistics (& SPSS)
") Projects Involving Statistics (& SPSS) Academic Skills Advice Starting a project which involves using statistics can feel confusing as there seems to be many different things you can do (charts, graphs,
Projects Involving Statistics (& SPSS) Academic Skills Advice Starting a project which involves using statistics can feel confusing as there seems to be many different things you can do (charts, graphs,
Overview of Non-Parametric Statistics PRESENTER: ELAINE EISENBEISZ OWNER AND PRINCIPAL, OMEGA STATISTICS
 Overview of Non-Parametric Statistics PRESENTER: ELAINE EISENBEISZ OWNER AND PRINCIPAL, OMEGA STATISTICS About Omega Statistics Private practice consultancy based in Southern California, Medical and Clinical
II. DISTRIBUTIONS distribution normal distribution. standard scores
 Appendix D Basic Measurement And Statistics The following information was developed by Steven Rothke, PhD, Department of Psychology, Rehabilitation Institute of Chicago (RIC) and expanded by Mary F. Schmidt,
Using SPSS, Chapter 2: Descriptive Statistics
 1 Using SPSS, Chapter 2: Descriptive Statistics Chapters 2.1 & 2.2 Descriptive Statistics 2 Mean, Standard Deviation, Variance, Range, Minimum, Maximum 2 Mean, Median, Mode, Standard Deviation, Variance,
January 26, 2009 The Faculty Center for Teaching and Learning
 THE BASICS OF DATA MANAGEMENT AND ANALYSIS A USER GUIDE January 26, 2009 The Faculty Center for Teaching and Learning THE BASICS OF DATA MANAGEMENT AND ANALYSIS Table of Contents Table of Contents... i
Descriptive Statistics
 Descriptive Statistics Primer Descriptive statistics Central tendency Variation Relative position Relationships Calculating descriptive statistics Descriptive Statistics Purpose to describe or summarize
Parametric and non-parametric statistical methods for the life sciences - Session I
 Why nonparametric methods What test to use? Rank Tests Parametric and non-parametric statistical methods for the life sciences - Session I Liesbeth Bruckers Geert Molenberghs Interuniversity Institute
IBM SPSS Statistics for Beginners for Windows
 ISS, NEWCASTLE UNIVERSITY IBM SPSS Statistics for Beginners for Windows A Training Manual for Beginners Dr. S. T. Kometa A Training Manual for Beginners Contents 1 Aims and Objectives... 3 1.1 Learning
The Dummy s Guide to Data Analysis Using SPSS
 The Dummy s Guide to Data Analysis Using SPSS Mathematics 57 Scripps College Amy Gamble April, 2001 Amy Gamble 4/30/01 All Rights Rerserved TABLE OF CONTENTS PAGE Helpful Hints for All Tests...1 Tests
Comparison of EngineRoom (6.0) with Minitab (16) and Quality Companion (3)
 with Minitab (16) and Quality Companion (3)") Comparison of EngineRoom (6.0) with Minitab (16) and Quality Companion (3) What is EngineRoom? A Microsoft Excel add in A suite of powerful, simple to use Lean and Six Sigma data analysis tools Built for
Comparison of EngineRoom (6.0) with Minitab (16) and Quality Companion (3) What is EngineRoom? A Microsoft Excel add in A suite of powerful, simple to use Lean and Six Sigma data analysis tools Built for
EPS 625 INTERMEDIATE STATISTICS FRIEDMAN TEST
 EPS 625 INTERMEDIATE STATISTICS The Friedman test is an extension of the Wilcoxon test. The Wilcoxon test can be applied to repeated-measures data if participants are assessed on two occasions or conditions
THE KRUSKAL WALLLIS TEST
 THE KRUSKAL WALLLIS TEST TEODORA H. MEHOTCHEVA Wednesday, 23 rd April 08 THE KRUSKAL-WALLIS TEST: The non-parametric alternative to ANOVA: testing for difference between several independent groups 2 NON
SPSS ADVANCED ANALYSIS WENDIANN SETHI SPRING 2011
 SPSS ADVANCED ANALYSIS WENDIANN SETHI SPRING 2011 Statistical techniques to be covered Explore relationships among variables Correlation Regression/Multiple regression Logistic regression Factor analysis
Chapter 5 Analysis of variance SPSS Analysis of variance
 Chapter 5 Analysis of variance SPSS Analysis of variance Data file used: gss.sav How to get there: Analyze Compare Means One-way ANOVA To test the null hypothesis that several population means are equal,
SPSS Tests for Versions 9 to 13
 SPSS Tests for Versions 9 to 13 Chapter 2 Descriptive Statistic (including median) Choose Analyze Descriptive statistics Frequencies... Click on variable(s) then press to move to into Variable(s): list
IBM SPSS Statistics 20 Part 4: Chi-Square and ANOVA
 CALIFORNIA STATE UNIVERSITY, LOS ANGELES INFORMATION TECHNOLOGY SERVICES IBM SPSS Statistics 20 Part 4: Chi-Square and ANOVA Summer 2013, Version 2.0 Table of Contents Introduction...2 Downloading the
Course Text. Required Computing Software. Course Description. Course Objectives. StraighterLine. Business Statistics
 Course Text Business Statistics Lind, Douglas A., Marchal, William A. and Samuel A. Wathen. Basic Statistics for Business and Economics, 7th edition, McGraw-Hill/Irwin, 2010, ISBN: 9780077384470 [This
Business Statistics. Successful completion of Introductory and/or Intermediate Algebra courses is recommended before taking Business Statistics.
 Business Course Text Bowerman, Bruce L., Richard T. O'Connell, J. B. Orris, and Dawn C. Porter. Essentials of Business, 2nd edition, McGraw-Hill/Irwin, 2008, ISBN: 978-0-07-331988-9. Required Computing
Testing Group Differences using T-tests, ANOVA, and Nonparametric Measures
 Testing Group Differences using T-tests, ANOVA, and Nonparametric Measures Jamie DeCoster Department of Psychology University of Alabama 348 Gordon Palmer Hall Box 870348 Tuscaloosa, AL 35487-0348 Phone:
MASTER COURSE SYLLABUS-PROTOTYPE PSYCHOLOGY 2317 STATISTICAL METHODS FOR THE BEHAVIORAL SCIENCES
 MASTER COURSE SYLLABUS-PROTOTYPE THE PSYCHOLOGY DEPARTMENT VALUES ACADEMIC FREEDOM AND THUS OFFERS THIS MASTER SYLLABUS-PROTOTYPE ONLY AS A GUIDE. THE INSTRUCTORS ARE FREE TO ADAPT THEIR COURSE SYLLABI
An introduction to IBM SPSS Statistics
 An introduction to IBM SPSS Statistics Contents 1 Introduction... 1 2 Entering your data... 2 3 Preparing your data for analysis... 10 4 Exploring your data: univariate analysis... 14 5 Generating descriptive
Bowerman, O'Connell, Aitken Schermer, & Adcock, Business Statistics in Practice, Canadian edition
 Bowerman, O'Connell, Aitken Schermer, & Adcock, Business Statistics in Practice, Canadian edition Online Learning Centre Technology Step-by-Step - Excel Microsoft Excel is a spreadsheet software application
Nonparametric Two-Sample Tests. Nonparametric Tests. Sign Test
 Nonparametric Two-Sample Tests Sign test Mann-Whitney U-test (a.k.a. Wilcoxon two-sample test) Kolmogorov-Smirnov Test Wilcoxon Signed-Rank Test Tukey-Duckworth Test 1 Nonparametric Tests Recall, nonparametric
ANALYSING LIKERT SCALE/TYPE DATA, ORDINAL LOGISTIC REGRESSION EXAMPLE IN R.
 ANALYSING LIKERT SCALE/TYPE DATA, ORDINAL LOGISTIC REGRESSION EXAMPLE IN R. 1. Motivation. Likert items are used to measure respondents attitudes to a particular question or statement. One must recall
Introduction to Statistics Used in Nursing Research
 Introduction to Statistics Used in Nursing Research Laura P. Kimble, PhD, RN, FNP-C, FAAN Professor and Piedmont Healthcare Endowed Chair in Nursing Georgia Baptist College of Nursing Of Mercer University
Sample Size and Power in Clinical Trials
 Sample Size and Power in Clinical Trials Version 1.0 May 011 1. Power of a Test. Factors affecting Power 3. Required Sample Size RELATED ISSUES 1. Effect Size. Test Statistics 3. Variation 4. Significance
Once saved, if the file was zipped you will need to unzip it. For the files that I will be posting you need to change the preferences.
 1 Commands in JMP and Statcrunch Below are a set of commands in JMP and Statcrunch which facilitate a basic statistical analysis. The first part concerns commands in JMP, the second part is for analysis
Nonparametric tests these test hypotheses that are not statements about population parameters (e.g.,
 CHAPTER 13 Nonparametric and Distribution-Free Statistics Nonparametric tests these test hypotheses that are not statements about population parameters (e.g., 2 tests for goodness of fit and independence).
SPSS 3: COMPARING MEANS
 SPSS 3: COMPARING MEANS UNIVERSITY OF GUELPH LUCIA COSTANZO lcostanz@uoguelph.ca REVISED SEPTEMBER 2012 CONTENTS SPSS availability... 2 Goals of the workshop... 2 Data for SPSS Sessions... 3 Statistical
The Kruskal-Wallis test:
 Graham Hole Research Skills Kruskal-Wallis handout, version 1.0, page 1 The Kruskal-Wallis test: This test is appropriate for use under the following circumstances: (a) you have three or more conditions
Research Methods & Experimental Design
 Research Methods & Experimental Design 16.422 Human Supervisory Control April 2004 Research Methods Qualitative vs. quantitative Understanding the relationship between objectives (research question) and
INTERPRETING THE ONE-WAY ANALYSIS OF VARIANCE (ANOVA)
") INTERPRETING THE ONE-WAY ANALYSIS OF VARIANCE (ANOVA) As with other parametric statistics, we begin the one-way ANOVA with a test of the underlying assumptions. Our first assumption is the assumption of
INTERPRETING THE ONE-WAY ANALYSIS OF VARIANCE (ANOVA) As with other parametric statistics, we begin the one-way ANOVA with a test of the underlying assumptions. Our first assumption is the assumption of
1 Nonparametric Statistics
 1 Nonparametric Statistics When finding confidence intervals or conducting tests so far, we always described the population with a model, which includes a set of parameters. Then we could make decisions
Analyzing Research Data Using Excel
 Analyzing Research Data Using Excel Fraser Health Authority, 2012 The Fraser Health Authority ( FH ) authorizes the use, reproduction and/or modification of this publication for purposes other than commercial
Chapter 12 Nonparametric Tests. Chapter Table of Contents
 Chapter 12 Nonparametric Tests Chapter Table of Contents OVERVIEW...171 Testing for Normality...... 171 Comparing Distributions....171 ONE-SAMPLE TESTS...172 TWO-SAMPLE TESTS...172 ComparingTwoIndependentSamples...172
Descriptive and Inferential Statistics
 General Sir John Kotelawala Defence University Workshop on Descriptive and Inferential Statistics Faculty of Research and Development 14 th May 2013 1. Introduction to Statistics 1.1 What is Statistics?
Intro to Parametric & Nonparametric Statistics
 Intro to Parametric & Nonparametric Statistics Kinds & definitions of nonparametric statistics Where parametric stats come from Consequences of parametric assumptions Organizing the models we will cover
SPSS: AN OVERVIEW. Seema Jaggi and and P.K.Batra I.A.S.R.I., Library Avenue, New Delhi-110 012
 SPSS: AN OVERVIEW Seema Jaggi and and P.K.Batra I.A.S.R.I., Library Avenue, New Delhi-110 012 The abbreviation SPSS stands for Statistical Package for the Social Sciences and is a comprehensive system
Likert Scales. are the meaning of life: Dane Bertram
 are the meaning of life: Note: A glossary is included near the end of this handout defining many of the terms used throughout this report. Likert Scale \lick urt\, n. Definition: Variations: A psychometric
The Statistics Tutor s Quick Guide to
 statstutor community project encouraging academics to share statistics support resources All stcp resources are released under a Creative Commons licence The Statistics Tutor s Quick Guide to Stcp-marshallowen-7
List of Examples. Examples 319
 Examples 319 List of Examples DiMaggio and Mantle. 6 Weed seeds. 6, 23, 37, 38 Vole reproduction. 7, 24, 37 Wooly bear caterpillar cocoons. 7 Homophone confusion and Alzheimer s disease. 8 Gear tooth strength.
Additional sources Compilation of sources: http://lrs.ed.uiuc.edu/tseportal/datacollectionmethodologies/jin-tselink/tselink.htm
 Mgt 540 Research Methods Data Analysis 1 Additional sources Compilation of sources: http://lrs.ed.uiuc.edu/tseportal/datacollectionmethodologies/jin-tselink/tselink.htm http://web.utk.edu/~dap/random/order/start.htm
NONPARAMETRIC STATISTICS 1. depend on assumptions about the underlying distribution of the data (or on the Central Limit Theorem)
") NONPARAMETRIC STATISTICS 1 PREVIOUSLY parametric statistics in estimation and hypothesis testing... construction of confidence intervals computing of p-values classical significance testing depend on assumptions
NONPARAMETRIC STATISTICS 1 PREVIOUSLY parametric statistics in estimation and hypothesis testing... construction of confidence intervals computing of p-values classical significance testing depend on assumptions
Introduction to Analysis of Variance (ANOVA) Limitations of the t-test
 Limitations of the t-test") Introduction to Analysis of Variance (ANOVA) The Structural Model, The Summary Table, and the One- Way ANOVA Limitations of the t-test Although the t-test is commonly used, it has limitations Can only
Introduction to Analysis of Variance (ANOVA) The Structural Model, The Summary Table, and the One- Way ANOVA Limitations of the t-test Although the t-test is commonly used, it has limitations Can only
Foundation of Quantitative Data Analysis
 Foundation of Quantitative Data Analysis Part 1: Data manipulation and descriptive statistics with SPSS/Excel HSRS #10 - October 17, 2013 Reference : A. Aczel, Complete Business Statistics. Chapters 1
Assumptions. Assumptions of linear models. Boxplot. Data exploration. Apply to response variable. Apply to error terms from linear model
 Assumptions Assumptions of linear models Apply to response variable within each group if predictor categorical Apply to error terms from linear model check by analysing residuals Normality Homogeneity
Non-parametric Tests Using SPSS
 Non-parametric Tests Using SPSS Statistical Package for Social Sciences Jinlin Fu January 2016 Contact Medical Research Consultancy Studio Australia http://www.mrcsau.com.au Contents 1 INTRODUCTION...
UNDERSTANDING THE TWO-WAY ANOVA
 UNDERSTANDING THE e have seen how the one-way ANOVA can be used to compare two or more sample means in studies involving a single independent variable. This can be extended to two independent variables
STA-201-TE. 5. Measures of relationship: correlation (5%) Correlation coefficient; Pearson r; correlation and causation; proportion of common variance
 Correlation coefficient; Pearson r; correlation and causation; proportion of common variance") Principles of Statistics STA-201-TE This TECEP is an introduction to descriptive and inferential statistics. Topics include: measures of central tendency, variability, correlation, regression, hypothesis
Principles of Statistics STA-201-TE This TECEP is an introduction to descriptive and inferential statistics. Topics include: measures of central tendency, variability, correlation, regression, hypothesis
One-Way ANOVA using SPSS 11.0. SPSS ANOVA procedures found in the Compare Means analyses. Specifically, we demonstrate
 1 One-Way ANOVA using SPSS 11.0 This section covers steps for testing the difference between three or more group means using the SPSS ANOVA procedures found in the Compare Means analyses. Specifically,
Institute of Actuaries of India Subject CT3 Probability and Mathematical Statistics
 Institute of Actuaries of India Subject CT3 Probability and Mathematical Statistics For 2015 Examinations Aim The aim of the Probability and Mathematical Statistics subject is to provide a grounding in
An Introduction to SPSS. Workshop Session conducted by: Dr. Cyndi Garvan Grace-Anne Jackman
 An Introduction to SPSS Workshop Session conducted by: Dr. Cyndi Garvan Grace-Anne Jackman Topics to be Covered Starting and Entering SPSS Main Features of SPSS Entering and Saving Data in SPSS Importing
business statistics using Excel OXFORD UNIVERSITY PRESS Glyn Davis & Branko Pecar
 business statistics using Excel Glyn Davis & Branko Pecar OXFORD UNIVERSITY PRESS Detailed contents Introduction to Microsoft Excel 2003 Overview Learning Objectives 1.1 Introduction to Microsoft Excel
CHAPTER 12 TESTING DIFFERENCES WITH ORDINAL DATA: MANN WHITNEY U
 CHAPTER 12 TESTING DIFFERENCES WITH ORDINAL DATA: MANN WHITNEY U Previous chapters of this text have explained the procedures used to test hypotheses using interval data (t-tests and ANOVA s) and nominal
NCSS Statistical Software
 Chapter 06 Introduction This procedure provides several reports for the comparison of two distributions, including confidence intervals for the difference in means, two-sample t-tests, the z-test, the
Parametric and Nonparametric: Demystifying the Terms
 Parametric and Nonparametric: Demystifying the Terms By Tanya Hoskin, a statistician in the Mayo Clinic Department of Health Sciences Research who provides consultations through the Mayo Clinic CTSA BERD
Confidence Intervals for One Standard Deviation Using Standard Deviation
 Chapter 640 Confidence Intervals for One Standard Deviation Using Standard Deviation Introduction This routine calculates the sample size necessary to achieve a specified interval width or distance from
QUANTITATIVE METHODS BIOLOGY FINAL HONOUR SCHOOL NON-PARAMETRIC TESTS
 QUANTITATIVE METHODS BIOLOGY FINAL HONOUR SCHOOL NON-PARAMETRIC TESTS This booklet contains lecture notes for the nonparametric work in the QM course. This booklet may be online at http://users.ox.ac.uk/~grafen/qmnotes/index.html.
Directions for using SPSS
 Directions for using SPSS Table of Contents Connecting and Working with Files 1. Accessing SPSS... 2 2. Transferring Files to N:\drive or your computer... 3 3. Importing Data from Another File Format...
Statistics I for QBIC. Contents and Objectives. Chapters 1 7. Revised: August 2013
 Statistics I for QBIC Text Book: Biostatistics, 10 th edition, by Daniel & Cross Contents and Objectives Chapters 1 7 Revised: August 2013 Chapter 1: Nature of Statistics (sections 1.1-1.6) Objectives
Chapter 13. Chi-Square. Crosstabs and Nonparametric Tests. Specifically, we demonstrate procedures for running two separate
 1 Chapter 13 Chi-Square This section covers the steps for running and interpreting chi-square analyses using the SPSS Crosstabs and Nonparametric Tests. Specifically, we demonstrate procedures for running
LAGUARDIA COMMUNITY COLLEGE CITY UNIVERSITY OF NEW YORK DEPARTMENT OF MATHEMATICS, ENGINEERING, AND COMPUTER SCIENCE
 LAGUARDIA COMMUNITY COLLEGE CITY UNIVERSITY OF NEW YORK DEPARTMENT OF MATHEMATICS, ENGINEERING, AND COMPUTER SCIENCE MAT 119 STATISTICS AND ELEMENTARY ALGEBRA 5 Lecture Hours, 2 Lab Hours, 3 Credits Pre-
SPSS Guide How-to, Tips, Tricks & Statistical Techniques
 SPSS Guide How-to, Tips, Tricks & Statistical Techniques Support for the course Research Methodology for IB Also useful for your BSc or MSc thesis March 2014 Dr. Marijke Leliveld Jacob Wiebenga, MSc CONTENT
The Chi-Square Test. STAT E-50 Introduction to Statistics
 STAT -50 Introduction to Statistics The Chi-Square Test The Chi-square test is a nonparametric test that is used to compare experimental results with theoretical models. That is, we will be comparing observed
IBM SPSS Direct Marketing 23
 IBM SPSS Direct Marketing 23 Note Before using this information and the product it supports, read the information in Notices on page 25. Product Information This edition applies to version 23, release
Normality Testing in Excel
 Normality Testing in Excel By Mark Harmon Copyright 2011 Mark Harmon No part of this publication may be reproduced or distributed without the express permission of the author. mark@excelmasterseries.com
Testing differences in proportions
 Testing differences in proportions Murray J Fisher RN, ITU Cert., DipAppSc, BHSc, MHPEd, PhD Senior Lecturer and Director Preregistration Programs Sydney Nursing School (MO2) University of Sydney NSW 2006
IBM SPSS Direct Marketing 22
 IBM SPSS Direct Marketing 22 Note Before using this information and the product it supports, read the information in Notices on page 25. Product Information This edition applies to version 22, release
4. Descriptive Statistics: Measures of Variability and Central Tendency
 4. Descriptive Statistics: Measures of Variability and Central Tendency Objectives Calculate descriptive for continuous and categorical data Edit output tables Although measures of central tendency and
Two-Sample T-Tests Allowing Unequal Variance (Enter Difference)
") Chapter 45 Two-Sample T-Tests Allowing Unequal Variance (Enter Difference) Introduction This procedure provides sample size and power calculations for one- or two-sided two-sample t-tests when no assumption
Chapter 45 Two-Sample T-Tests Allowing Unequal Variance (Enter Difference) Introduction This procedure provides sample size and power calculations for one- or two-sided two-sample t-tests when no assumption
SPSS TUTORIAL & EXERCISE BOOK
 UNIVERSITY OF MISKOLC Faculty of Economics Institute of Business Information and Methods Department of Business Statistics and Economic Forecasting PETRA PETROVICS SPSS TUTORIAL & EXERCISE BOOK FOR BUSINESS
Part 3. Comparing Groups. Chapter 7 Comparing Paired Groups 189. Chapter 8 Comparing Two Independent Groups 217
 Part 3 Comparing Groups Chapter 7 Comparing Paired Groups 189 Chapter 8 Comparing Two Independent Groups 217 Chapter 9 Comparing More Than Two Groups 257 188 Elementary Statistics Using SAS Chapter 7 Comparing
Chapter Seven. Multiple regression An introduction to multiple regression Performing a multiple regression on SPSS
 Chapter Seven Multiple regression An introduction to multiple regression Performing a multiple regression on SPSS Section : An introduction to multiple regression WHAT IS MULTIPLE REGRESSION? Multiple
Students' Opinion about Universities: The Faculty of Economics and Political Science (Case Study)
") Cairo University Faculty of Economics and Political Science Statistics Department English Section Students' Opinion about Universities: The Faculty of Economics and Political Science (Case Study) Prepared
Cairo University Faculty of Economics and Political Science Statistics Department English Section Students' Opinion about Universities: The Faculty of Economics and Political Science (Case Study) Prepared
Statistics for Sports Medicine
 Statistics for Sports Medicine Suzanne Hecht, MD University of Minnesota (suzanne.hecht@gmail.com) Fellow s Research Conference July 2012: Philadelphia GOALS Try not to bore you to death!! Try to teach
TABLE OF CONTENTS. About Chi Squares... 1. What is a CHI SQUARE?... 1. Chi Squares... 1. Hypothesis Testing with Chi Squares... 2
 About Chi Squares TABLE OF CONTENTS About Chi Squares... 1 What is a CHI SQUARE?... 1 Chi Squares... 1 Goodness of fit test (One-way χ 2 )... 1 Test of Independence (Two-way χ 2 )... 2 Hypothesis Testing
One-Way Analysis of Variance (ANOVA) Example Problem
 Example Problem") One-Way Analysis of Variance (ANOVA) Example Problem Introduction Analysis of Variance (ANOVA) is a hypothesis-testing technique used to test the equality of two or more population (or treatment) means
One-Way Analysis of Variance (ANOVA) Example Problem Introduction Analysis of Variance (ANOVA) is a hypothesis-testing technique used to test the equality of two or more population (or treatment) means
UNIVERSITY of MASSACHUSETTS DARTMOUTH Charlton College of Business Decision and Information Sciences Fall 2010
 UNIVERSITY of MASSACHUSETTS DARTMOUTH Charlton College of Business Decision and Information Sciences Fall 2010 COURSE: POM 500 Statistical Analysis, ONLINE EDITION, Fall 2010 Prerequisite: Finite Math
TRAINING PROGRAM INFORMATICS
 MEDICAL UNIVERSITY SOFIA MEDICAL FACULTY DEPARTMENT SOCIAL MEDICINE AND HEALTH MANAGEMENT SECTION BIOSTATISTICS AND MEDICAL INFORMATICS TRAINING PROGRAM INFORMATICS FOR DENTIST STUDENTS - I st COURSE,
The Friedman Test with MS Excel. In 3 Simple Steps. Kilem L. Gwet, Ph.D.
 The Friedman Test with MS Excel In 3 Simple Steps Kilem L. Gwet, Ph.D. Copyright c 2011 by Kilem Li Gwet, Ph.D. All rights reserved. Published by Advanced Analytics, LLC A single copy of this document
Examining Differences (Comparing Groups) using SPSS Inferential statistics (Part I) Dwayne Devonish
 using SPSS Inferential statistics (Part I) Dwayne Devonish") Examining Differences (Comparing Groups) using SPSS Inferential statistics (Part I) Dwayne Devonish Statistics Statistics are quantitative methods of describing, analysing, and drawing inferences (conclusions)
Examining Differences (Comparing Groups) using SPSS Inferential statistics (Part I) Dwayne Devonish Statistics Statistics are quantitative methods of describing, analysing, and drawing inferences (conclusions)
STAT 2080/MATH 2080/ECON 2280 Statistical Methods for Data Analysis and Inference Fall 2015
 Faculty of Science Course Syllabus Department of Mathematics & Statistics STAT 2080/MATH 2080/ECON 2280 Statistical Methods for Data Analysis and Inference Fall 2015 Instructor: Michael Dowd Email: michael.dowd@dal.ca
Two-Way ANOVA tests. I. Definition and Applications...2. II. Two-Way ANOVA prerequisites...2. III. How to use the Two-Way ANOVA tool?...
 Two-Way ANOVA tests Contents at a glance I. Definition and Applications...2 II. Two-Way ANOVA prerequisites...2 III. How to use the Two-Way ANOVA tool?...3 A. Parametric test, assume variances equal....4
Why Is EngineRoom the Right Choice? 1. Cuts the Cost of Calculation
 What is EngineRoom? - A Web based data analysis application with an intuitive, drag-and-drop graphical interface. - A suite of powerful, simple-to-use Lean and Six Sigma data analysis tools that you can
THE UNIVERSITY OF TEXAS AT TYLER COLLEGE OF NURSING COURSE SYLLABUS NURS 5317 STATISTICS FOR HEALTH PROVIDERS. Fall 2013
 THE UNIVERSITY OF TEXAS AT TYLER COLLEGE OF NURSING 1 COURSE SYLLABUS NURS 5317 STATISTICS FOR HEALTH PROVIDERS Fall 2013 & Danice B. Greer, Ph.D., RN, BC dgreer@uttyler.edu Office BRB 1115 (903) 565-5766
Come scegliere un test statistico
 Come scegliere un test statistico Estratto dal Capitolo 37 of Intuitive Biostatistics (ISBN 0-19-508607-4) by Harvey Motulsky. Copyright 1995 by Oxfd University Press Inc. (disponibile in Iinternet) Table
SPSS Modules Features Statistics Premium
 SPSS Modules Features Statistics Premium Core System Functionality (included in every license) Data access and management Data Prep features: Define Variable properties tool; copy data properties tool,
Two-Sample T-Tests Assuming Equal Variance (Enter Means)
") Chapter 4 Two-Sample T-Tests Assuming Equal Variance (Enter Means) Introduction This procedure provides sample size and power calculations for one- or two-sided two-sample t-tests when the variances of
Chapter 4 Two-Sample T-Tests Assuming Equal Variance (Enter Means) Introduction This procedure provides sample size and power calculations for one- or two-sided two-sample t-tests when the variances of