Water footprint of rice
|
|
|
- Steven Hill
- 7 years ago
- Views:
Transcription
1 Water footprint of rice Quantifying the rainbow of virtual water fluxes related to rice trade Ashok Chapagain, WWF-UK RE-THINKING PARADIGMS: WATER AND FOOD SECURITY 4 th Marcelino Botín Foundation Water Workshop, Santander (Spain) September 2009
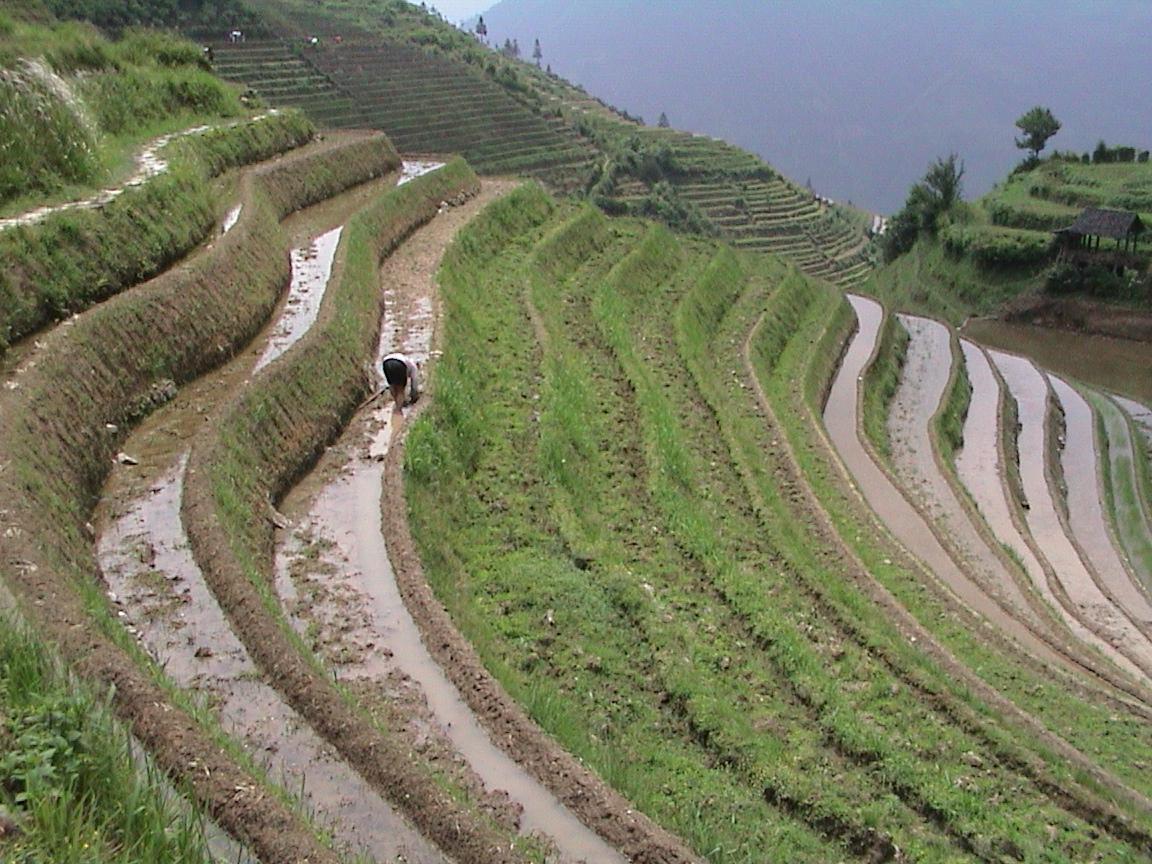
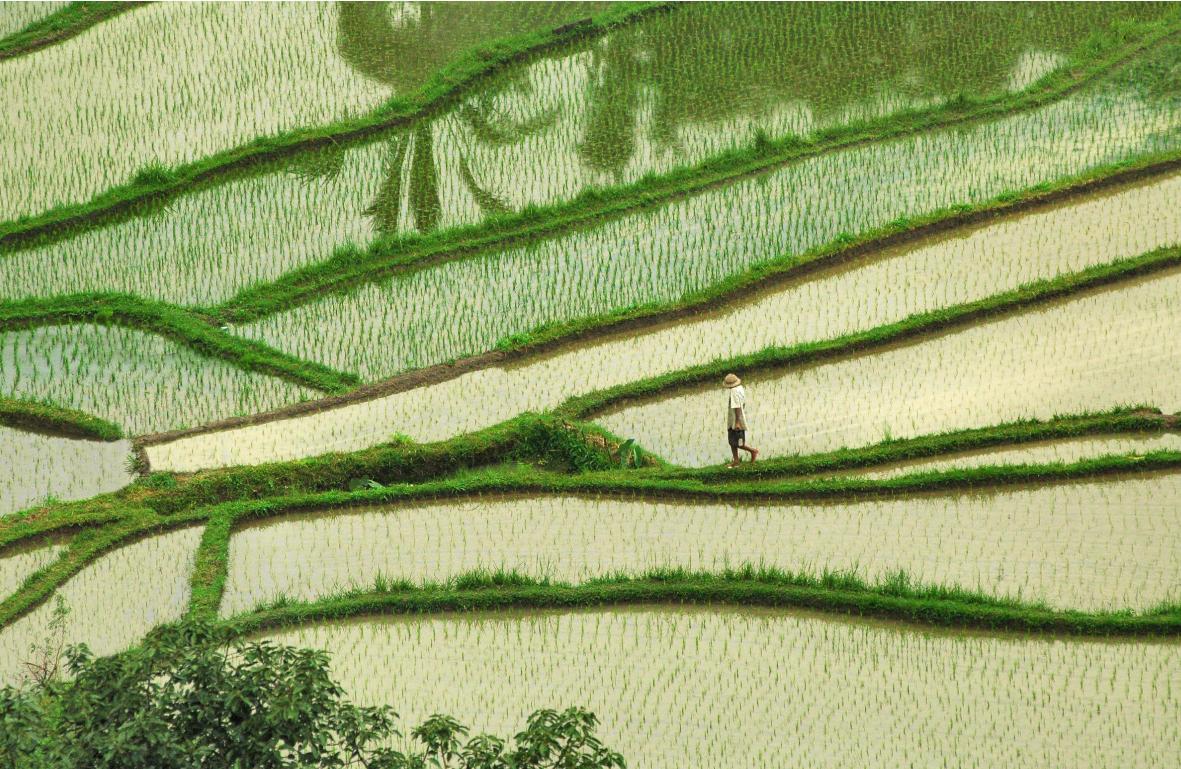
2 Backdrop It is a popular belief that rice is one of the most water guzzling crops. reinforced by the reflection of what we see in rice fields/thousands of pictures of rice fields covered with a thick layer of standing water. large irrigation projects, often constructed to meet the water demand in rice production. the largest grain category feeding the world population, mostly in South Asia and Africa, consuming rice is very water intensive.

3
4
5

6
7 Questions. Is consuming rice more water expensive, or is this a perception merely based on the fact that rice is mostly produced in wet-land systems with standing water all over the time? How does the global consumption of rice relate to the use of different kinds of water at production regions? What is the role of the blue (surface and ground) and green water in rice production? What is the volume of water polluted (grey) in the local water resources as a result of fertilizers use in the rice fields?.
8 Questions. How does the temporal and spatial variations in rice production relate to the water footprint of rice consumption globally? What are the external water footprints of nations related to rice consumption? A thought, do we really want to increase irrigation efficiency in rice fields (reduced percolation)? Do we have better mechanism to allocate water saved as a result of less percolation from rice fields?
9 Rice production statistics Systems of rice production: wet-land system (85% of area ) upland system (15%) About 75% of the rice productions are obtained from irrigated wetland rice. In Asia, rice fields are prepared by tillage followed by puddling. The soil layer is saturated and there is standing water during the entire growth period of the crop. In US, Australia, parts of Europe and some Asian countries, rice land is prepared dry and flooded later.
10 Rice production statistics Produced in115 countries (FAOSTAT) Production = 592 million metric tons/yr, yield = 4.49 t/ha (FAOSTAT) 13 countries account for >90% of the global rice production, and >82% of the total export of rice-equivalent globally (PC-TAS). Only 6-7% of world rice production is traded internationally (FAOSTAT). [All data from FAOSTAT, period ]
11 Rice production statistics Countries Average production (t/yr) 1 Global share (%) 1 Average area harvested (ha/yr) 1 Average yield (t/ha) 1 China 177,657, % 28,670, India 126,503, % 43,057, Indonesia 52,014, % 11,642, Bangladesh 37,217, % 10,641, Viet Nam 33,960, % 7,512, Thailand 26,800, % 10,038, Myanmar 22,581, % 6,431, Philippines 13,322, % 4,056, Brazil 11,068, % 3,371, Japan 10,989, % 1,706, USA 9,520, % 1,285, Pakistan 6,910, % 2,339, Korea, Rep. 6,808, % 1,045, Sub total 535,354, % 131,797,547 - Global total 591,751, ,666,
12 Calculation data and assumptions The volume of water used in land preparation is assumed to be 200 mm. This demand is assumed to be spread over one month period. There is a layer of standing water, ~100 mm, gradually maintained in one month. There is a constant percolation as long as there is standing water in the field. The field is let dry in the last month of harvesting. [All data from FAOSTAT, period ]

13 Globally available water Precipitation 100 % 65 % Source: M. Falkenmark 35 %

14 Source: M. Falkenmark
15 Water demand at different stages
16 Water demand at different stages
17 Water demand at different stages
18 Water demand at different stages
19 Water supply at different stages
20 Water supply at different stages
21 Water supply at different stages
22 Water supply at different stages
23 Water use at different stages
24 Water use at different stages
25 Water use at different stages
26 Water use at different stages
27 Calculation of water use For each of the 13 countries; green water use irrigation demand blue water use Estimate is made based on whether wetland system upland system For each variety grown in each season For each major regions of production
28 Calculation of water use National average water uses are calculated based on the regional share of production to the total national value. The planting and harvesting period is chosen based on the major crop season in each region. Local climate data is used for each production regions
29 Unit water use (mm/yr) Water use by source type Water use by event type (mm/yr) (mm/yr) Green water use Blue water use Total Evaporation Losses Total China India Indonesia Bangladesh Viet Nam Thailand Myanmar Japan Philippines Brazil USA Korea, Rep Pakistan
30 Total water use (km 3 /yr) Evaporation (km 3 /yr) Losses (km 3 /yr) Total crop water use (Evaporation + losses) (km 3 /yr) Green Blue Total Green Blue Total Green Blue Total China India Indonesia Bangladesh Viet Nam Thailand Myanmar Japan Philippines Brazil USA Korea, Rep Pakistan
31 Virtual water content of paddy (m 3 /t) Evaporative (m 3 /t) Non-evaporative (m 3 /t) Pollution (m 3 /t) Green Blue Evaporative total losses Grey China India Indonesia Bangladesh Viet Nam Thailand Myanmar Japan Philippines Brazil USA Korea, Rep Pakistan
32 Product tree
33 Virtual water content of rice products (m 3 /t) PC-TAS Product description Green* Blue* Grey code (m 3 /t) (m 3 /t) (m 3 /t) Rice in the husk (paddy or rough) Rice, husked (brown) Rice groats and meal Rice, semi-milled, milled, whether or not polished or glazed Rice, broken Rice flour
34 Virtual water flows (Mm 3 /yr) Largest gross-exporters Largest top gross-importers (Mm 3 /yr) (Mm 3 /yr) Green Blue Grey Total Green Blue Grey Total Thailand 4,830 3, ,149 Nigeria 1,359 1, ,867 India 2,529 2, ,078 Indonesia ,592 USA 572 2, ,474 Iran ,466 Pakistan 408 2, ,923 Saudi Arabia ,403 China ,296 South Africa ,300 Viet Nam ,194 Senegal ,287 Italy ,033 Brazil Uruguay Japan Egypt Philippines Australia UK World total 12,463 15,504 2,366 30,333
35 Water footprint of rice The global WF of rice production is 1308 Mm 3 /yr, out of which 707 Mm 3 /yr is evaporated 332Mm 3 /yr is green water use 374 Mm 3 /yr is blue water use 64 Mm 3 /yr is pollution 538 Mm 3 /yr is lost (percolation+ residual soil moisture after the harvest)
36 Evaporative water footprint Water footprint of rice Pollution water footprint Water losses Water footprint including losses Green Blue Total Grey (Green+Blue) Total India 122, , ,171 13, , ,628 China 55,875 95, ,170 20, , ,232 Indonesia 26,936 28,662 55,599 6,261 44, ,683 Bangladesh 17,860 23,429 41,288 3,846 37,229 82,364 Thailand 16,916 12,703 29,618 2,421 21,471 53,510 Myanmar 17,867 8,614 26,481 1,118 21,926 49,525 Philippines 10,738 6,569 17,307 1,137 14,177 32,621 Brazil 6,516 10,108 16, ,090 30,470 Pakistan 2,363 14,053 16, ,974 24,910 Viet Nam 9,197 6,504 15,701 4,074 22,767 42,542 Japan 3,609 5,382 8, ,382 18,121 USA 1,636 6,036 7, ,247 12,638 Egypt 3,095 3,478 6, ,999 12,167 Nigeria 3,099 3,255 6, ,729 11,626 Korea Rep. 2,159 2,981 5, ,922 9,654
37 Internal WF
38 External WF
39 Spatial linkages of water footprint related to rice Internal water footprint (Mm3/yr) External water footprint (Mm3/yr) Total water footprint* Total WF** Green Blue Grey Total Green Blue Grey Total Green Blue Grey Total (including losses) India 122, ,075 13, , , ,078 13, , ,628 China 55,530 95,036 20, , ,875 95,295 20, , ,232 Indonesia 26,228 27,930 6,111 60, ,591 26,936 28,662 6,261 61, ,683 Bangladesh 17,726 23,310 3,831 44, ,860 23,429 3,846 45,134 82,364 Thailand 16,915 12,702 2,421 32, ,916 12,703 2,421 32,039 53,510 Myanmar 17,867 8,614 1,118 27, ,867 8,614 1,118 27,599 49,525 Viet Nam 9,197 6,504 4,074 19, ,197 6,504 4,074 19,775 42,542 Philippines 10,299 6,162 1,034 17, ,738 6,569 1,137 18,444 32,621 Brazil 6,115 9, , ,516 10, ,380 30,470 Pakistan 2,363 14, , ,363 14, ,936 24,910 Japan 3,298 4, , ,609 5, ,739 18,121 USA 1,351 5, , ,636 6, ,391 12,638 Egypt 3,095 3, , ,095 3, ,168 12,167 World total 320, ,365 61, ,528 12,012 14,887 2,282 29, , ,252 64, ,710 1,308,550
40

41 Water footprint of the UK related to agricultural products

42 Impact assessment Water footprint of the UK related to agricultural products
43 USA, EU27 Consumption of rice products in EU27 nations is indirectly connected to the management of water resources in Thailand, India and Pakistan. EU27 and USA rice consumption => total evaporation of 2205 Mm 3 of water polluted return flows of 171 Mm 3 around the globe, mainly in Thailand, Vietnam and India. Overlaying with water availability maps show that the water footprint of global rice consumption creates relatively lower stress on the water resources in Thailand compared to that in Pakistan as in the later case rice is extensively irrigated and blue water resource is even more scarcer.
44 Summary Producing a kilogram of rice (paddy) in average evaporates about 1200 litres of water pollutes 110 litres of fresh water. 910 litres of water lost in the field as a result of percolation and unused soil moisture. Contribution of green water to the total evaporation is about 47%
45 Summary Producing a kilogram of milled - rice (white/polished rice) in average evaporates about 1444 litres of water (680 green and 764 blue) pollutes 131 litres of fresh water litres of water lost in the field as a result of percolation and unused soil moisture (575litres irrigation litres augmented water in the field). Total WF of 1 kg of milled rice = 2672 litres The share of green virtual water to the total global virtual water ~41% => importance of green water in the context of international trade, rising food security and water scarcity around the world.
46 Farming communities manage about 80 per cent of the water used in our economies - about 70 per cent by volume of this water is green water and 30 per cent is blue water [Tony Allan, 2009]
47 Options for 3.8 bln poor [M. Falkenmark] modernise agriculture/reduce water losses maximising crop per drop = loss of return flow = increased river depletion
48 Water for rice, or rice for water Increasing field efficiency in rice fields may further trigger the expansion of agriculture (under suitable conditions) Less water available for already stressed river system Best option at production end would be to Efficiency gain is to be targeted towards consumptive (evaporative) use rather than in total use Adopt suitable fertilizer application strategy so that there is almost full recovery in crop Stimulate rice cultivation mainly in rainy season Best option at consumption end would be to Reduce the overall consumption Switch to different consumption pattern with equivalent calorie content Understand the impacts of our individual choices, and thus engage with suppliers if possible Import from regions where the impacts are minimal.
49 Many thanks
RICE CULTIVATION: ENVIRONMENTAL ISSUES AND WATER SAVING APPROACHES
 RICE CULTIVATION: ENVIRONMENTAL ISSUES AND WATER SAVING APPROACHES Ragab Ragab 1 Introduction Globally, rice is the most important food crop with more than 90% produced in Asia. In most of Asian countries,
Evaluating the benefits of integrated rice-duck farming as organic system in Bangladesh
 Evaluating the benefits of integrated rice-duck farming as organic system in Bangladesh Shaikh Tanveer Hossain*, H Konagaya, T Furuno and H Sugimoto * E-mail : tanveer107@yahoo.com Fact Sheet of Bangladesh
Elizabeth Curmi, Keith Richards, Richard Fenner, Julian.M Allwood, Bojana Bajželj and Grant M. Kopec
 A new representation of integrated management of water resources: Sankey diagrams that link water sources and services for humans and nature at different scales Elizabeth Curmi, Keith Richards, Richard
List of tables. I. World Trade Developments
 List of tables I. World Trade Developments 1. Overview Table I.1 Growth in the volume of world merchandise exports and production, 2010-2014 39 Table I.2 Growth in the volume of world merchandise trade
NET INTERNATIONAL MIGRATION
 II. NET INTERNATIONAL MIGRATION A. GLOBAL TRENDS During the period 195-21, the developed regions experienced population gains from positive net international migration while the developing regions were
Key global markets and suppliers impacting U.S. grain exports BRICs
 Key global markets and suppliers impacting U.S. grain exports BRICs Levin Flake Senior Agricultural Economist, Global Policy Analysis Division, OGA/FAS/USDA TEGMA Annual Meeting January 23 rd, 2015 U.S.
Small Farm Modernization & the Quiet Revolution in Asia s Food Supply Chains. Thomas Reardon
 Small Farm Modernization & the Quiet Revolution in Asia s Food Supply Chains Thomas Reardon Part 1 of Talk: Introduction to research issues and method 1. Introduction to Research Issues 1. Research past
Investment in developing countries' food and agriculture: Assessing agricultural capital stocks and their impact on productivity
 Investment in developing countries' food and agriculture: Assessing agricultural capital stocks and their impact on productivity Gustavo Anriquez (FAO), Hartwig de Haen, Oleg Nivyevskiy & Stephan von Cramon
System of Rice Intensification (SRI)
") System of Rice Intensification (SRI) Ramasamy Selvaraju Climate, Energy and Tenure Division (NRC), FAO Fifth annual Investment Days, Rome, Italy; 17 December 2013 Contents What is SRI? Main concepts of
System of Rice Intensification (SRI) Ramasamy Selvaraju Climate, Energy and Tenure Division (NRC), FAO Fifth annual Investment Days, Rome, Italy; 17 December 2013 Contents What is SRI? Main concepts of
Mediterranean region. Contents 18.02.2014 WATER FOOTPRINT OF TOURISM AND AGRICULTURAL PRODUCTION IN TURKEY
 WATER FOOTPRINT OF TOURISM AND AGRICULTURAL PRODUCTION IN TURKEY Prof.Dr.Bülent Topkaya Akdeniz University Department of Environmental Engineering Mediterranean Region Water in Turkey Tourism activities
Global trends in production and trade of major grain legumes
 International Conference on Grain Legumes: Quality Improvement, Value Addition and Trade, February 14-16, 2009, Indian Society of Pulses Research and Development, Indian Institute of Pulses Research, Kanpur,
Meat and Meat products: price and trade update Issue 1 May 2014. Meat and Meat products. Price and Trade Update: April 2014 1
 Issue 1 May 2014 Weekly Newsletter Meat and Meat products Price and Trade Update April export prices stable Meat and Meat products Price and Trade Update: April 2014 1 The FAO Meat Price Index averaged
MAUVE GROUP GLOBAL EMPLOYMENT SOLUTIONS PORTFOLIO
 MAUVE GROUP GLOBAL SOLUTIONS PORTFOLIO At Mauve Group, we offer a variety of complete employee management services such as Global Employment Solutions (GES), Professional Employment Outsourcing (PEO),
Wheat Import Projections Towards 2050. Chad Weigand Market Analyst
 Wheat Import Projections Towards 2050 Chad Weigand Market Analyst January 2011 Wheat Import Projections Towards 2050 Analysis Prepared by Chad Weigand, Market Analyst January 2011 Purpose The United Nations
Have Recent Increases in International Cereal Prices Been Transmitted to Domestic Economies? The experience in seven large Asian countries
 Have Recent Increases in International Cereal Prices Been Transmitted to Domestic Economies? The experience in seven large Asian countries David Dawe ESA Working Paper No. 08-03 April 2008 Agricultural
II. Merchandise trade
 II. Merchandise trade Merchandise trade increased by 5 per cent in volume in 211. The strongest momentum was achieved by trade in manufactured goods, which grew by.5 per cent. Key developments in 211:
Conceptual and analytical frameworks for evaluation and reporting of the bioenergy impacts - The challenge of applying LCA for water
 Conceptual and analytical frameworks for evaluation and reporting of the bioenergy impacts - The challenge of applying LCA for water Brendan George University of New England NSW Department of Primary Industries
2) Relevance for environmental policy... 2. 4) Data sources and reporting... 4 5) References at the international level... 4
 Relevance for environmental policy... 2. 4) Data sources and reporting... 4 5) References at the international level... 4") F- 4: Pesticide consumption 1) General description... 2 1.1) Brief definition... 2 1.2) Units of measurement... 2 1.3) Context...2 2) Relevance for environmental policy... 2 2.1) Purpose... 2 2.2) Issue...
F- 4: Pesticide consumption 1) General description... 2 1.1) Brief definition... 2 1.2) Units of measurement... 2 1.3) Context...2 2) Relevance for environmental policy... 2 2.1) Purpose... 2 2.2) Issue...
World Population to reach 10 billion by 2100 if Fertility in all Countries Converges to Replacement Level
 UNITED NATIONS PRESS RELEASE EMBARGOED UNTIL 3 MAY 2011, 11:00 A.M., NEW YORK TIME World Population to reach 10 billion by if Fertility in all Countries Converges to Replacement Level UNITED NATIONS, 3
Chapter 2. Global Dairy Sector: Status and Trends
 Chapter 2 Global Dairy Sector: Status and Trends 2.1 Summary 16 2.2 Global price trends for feed and dairy products 18 2.3 Milk production trends 20 2.4 Farmers milk prices and milk:feed price ratio 22
BASEL, 3 FEBRUARY 2016
 BASEL, 3 FEBRUARY 2016 SAFE HARBOR ADDITIONAL INFORMATION AND WHERE TO FIND IT THE TENDER OFFER FOR THE OUTSTANDING SHARES, AMERICAN DEPOSITARY SHARES AND OTHER OUTSTANDING EQUITY INSTRUMENTS IN THE COMPANY
Water: The Environmental Outlook to 2050
 Water: The Environmental Outlook to 2050 Helen Mountford Deputy Director, OECD Environment Directorate OECD Global Forum on Environment: Making Water Reform Happen 25-26 October 2011, Paris OECD Environmental
Shifts and emerging trends in commodity production and trade flows
 Shifts and emerging trends in commodity production and trade flows Mathilde Douillet, FARM, Cirad (France) QUNO workshop «New Framework for Trade and Investment in Agriculture» 22 January 2014 Trends in
The Role of Emerging and New Markets in the Shrimp Trade & Value Addition. Fatima Ferdouse INFOFISH
 The Role of Emerging and New Markets in the Shrimp Trade & Value Addition Fatima Ferdouse INFOFISH Shrimp Trade : Domestic and International Shrimp is one of the most popular seafood traded and consumed
Annex 5A Trends in international carbon dioxide emissions
 Annex 5A Trends in international carbon dioxide emissions 5A.1 A global effort will be needed to reduce greenhouse gas emissions and to arrest climate change. The Intergovernmental Panel on Climate Change
MILK AND MILK PRODUCTS
 MILK AND MILK PRODUCTS World milk production is forecast to grow by 1.6 percent to 816 million tonnes in. Output is set to expand in Europe, Asia and the Americas, but anticipated to stagnate or decline
I. World trade developments
 I. World trade developments The value of world merchandise exports increased by 20 per cent in 2011 while exports of commercial services grew by 11 per cent. Key developments in 2011: a snapshot Trade
Alternate wetting and drying irrigation for rice cultivation
 J. Bangladesh Agril. Univ. 6(2): 409 414, 2008 ISSN 1810-3030 Alternate wetting and drying irrigation for rice cultivation M.M.H. Oliver 1, M.S.U. Talukder and M. Ahmed Department of Irrigation and Water
FDI performance and potential rankings. Astrit Sulstarova Division on Investment and Enterprise UNCTAD
 FDI performance and potential rankings Astrit Sulstarova Division on Investment and Enterprise UNCTAD FDI perfomance index The Inward FDI Performance Index ranks countries by the FDI they receive relative
Sulfuric Acid 2013 World Market Outlook and Forecast up to 2017
 Brochure More information from http://www.researchandmarkets.com/reports/2547547/ Sulfuric Acid 2013 World Market Outlook and Forecast up to 2017 Description: Sulfuric Acid 2013 World Market Outlook and
Global Cashew Nut Industry Report
 Brochure More information from http://www.researchandmarkets.com/reports/310379/ Global Cashew Nut Industry Report Description: Cashew a native of Eastern Brazil was introduced to India by the Portuguese
Current capabilities in the analysis of climate risks and adaptation strategies in critical areas
 Current capabilities in the analysis of climate risks and adaptation strategies in critical areas M. Arif Goheer Global Change Impact Studies Centre (GCISC) Islamabad- 44000, Pakistan Symposium on Climate
The water footprint of food
 The footprint of food Professor Arjen Y. Hoekstra, Twente Water Centre, University of Twente, the Netherlands. The international trade in agricultural commodities at the same time constitutes a trade with
Exploring the links between water and economic growth
 Exploring the links between water and economic growth A report prepared for HSBC by Frontier Economics: Executive Summary June 2012 June 2012 The water challenge Population and economic growth are putting
Cotton and Wool Outlook
 Economic Research Service Situation and Outlook CWS-14h Release Date August 14, 2014 Cotton and Wool Outlook Leslie Meyer lmeyer@ers.usda.gov Stephen MacDonald stephenm@ers.usda.gov Global Cotton Stocks
C&A s Water Footprint Strategy: Cotton Clothing Supply Chain
 C&A s Water Footprint Strategy: Cotton Clothing Supply Chain Authors Nicolas Franke and Ruth Mathews, Water Footprint Network Acknowledgments This report has been written thanks to the support of several
WILMAR INTERNATIONAL LIMITED Investor Day Presentation
 WILMAR INTERNATIONAL LIMITED Investor Day Presentation April 25, 2014 BY THOMAS LIM GENERAL MANAGER - TRADING IMPORTANT NOTICE Information in this presentation may contain projections and forward looking
MILK AND MILK PRODUCTS
 Market summaries MILK AND MILK PRODUCTS World milk production in is forecast to grow by 1.9 percent to 780 million tonnes a similar rate to that in previous years. Asia and Latin America and the Caribbean
Impact of Water Saving Irrigation Systems on Water Use, Growth and Yield of Irrigated Lowland Rice
 Agriculture, Environment and Food Security in the Context of Rice Impact of Water Saving Irrigation Systems on Water Use, Growth and Yield of Irrigated Lowland Rice W. M. W. Weerakoon, T. N. N. Priyadarshani,
CBI Trade Statistics: Fish and Seafood
 CBI Trade Statistics: Fish and Seafood Introduction Seafood consumption and production in Europe is relatively stable. The largest seafood consumers live in France, Spain and Italy: the Southern part of
II. Merchandise trade
 II. Merchandise trade World merchandise trade grew by 2 per cent in volume terms in 2012 against a backdrop of weak global demand and declining prices. This is significantly less than the 5 per cent increase
Milk and milk products market summary
 Milk and milk products market summary Food Outlook Prices of dairy products began to decline in mid-2011, as supplies to the international market improved. In April, after a favourable outcome of the milk-producing
Fresh Connections: China
 Fresh Connections: China China Market Overview Mabel Zhuang, PMA China Consultant M.Z. Marketing Communications March 20, 2014 Overview 1. Background 2. Production 3. Trade & Distribution 4. Trends Background:
41 T Korea, Rep. 52.3. 42 T Netherlands 51.4. 43 T Japan 51.1. 44 E Bulgaria 51.1. 45 T Argentina 50.8. 46 T Czech Republic 50.4. 47 T Greece 50.
 Overall Results Climate Change Performance Index 2012 Table 1 Rank Country Score** Partial Score Tendency Trend Level Policy 1* Rank Country Score** Partial Score Tendency Trend Level Policy 21 - Egypt***
A stakeholder s. guide. Consultation for ISO Strategy 2016-2020
 Strategy A stakeholder s guide Consultation for ISO Strategy 2016-2020 ISO Strategy 2016-2020 What is the ISO Strategy 2016-2020? The ISO Strategy 2016-2020 is the strategic plan for the organization
A.Y. Hoekstra. Value of Water
 M.M. Mekonnen A.Y. Hoekstra May 2011 National water footprint accounts: The green, blue and grey water footprint of production and consumption Volume 1: Main Report Value of Water Research Report Series
Digital vs Traditional Media Consumption
 Digital vs Traditional Media Consumption Summary Comparing time spent on traditional and digital media at a global level as well as analyzing behaviors between countries and across the age groups GWI Q3
Appendix 1: Full Country Rankings
 Appendix 1: Full Country Rankings Below please find the complete rankings of all 75 markets considered in the analysis. Rankings are broken into overall rankings and subsector rankings. Overall Renewable
ICT Development Index (IDI)
") ITU Regional Forum and Training Workshop on Telecommunication/ICT Indicators: Measuring the Information Society and ITU ASEAN Meeting on Establishing National ICT Statistics Portals and Measuring ASEAN
ITU Regional Forum and Training Workshop on Telecommunication/ICT Indicators: Measuring the Information Society and ITU ASEAN Meeting on Establishing National ICT Statistics Portals and Measuring ASEAN
Global Dynamism Index (GDI) 2013 summary report. Model developed by the Economist Intelligence Unit (EIU)
 2013 summary report. Model developed by the Economist Intelligence Unit (EIU)") Global Dynamism Index (GDI) 2013 summary report Model developed by the Economist Intelligence Unit (EIU) What is the Global Dynamism Index (GDI)? the GDI assesses the dynamism of 60 of the world's largest
Global Dynamism Index (GDI) 2013 summary report Model developed by the Economist Intelligence Unit (EIU) What is the Global Dynamism Index (GDI)? the GDI assesses the dynamism of 60 of the world's largest
Export Growth and Prospect of Floriculture in India
 Export Growth and Prospect of Floriculture in India *Amitava Saha I Introduction Floriculture is an age old farming activity in India having immense potential for generating gainful self-employment among
STATE OF GLOBAL E-COMMERCE REPORT (Preview) February 2013
 February 2013") STATE OF GLOBAL E-COMMERCE REPORT (Preview) February 2013 THE E-COMMERCE REPORT WHAT IS THE E-COMMERCE REPORT? It is an annual investigation into the global uptake and impact of e- commerce. The report
STATE OF GLOBAL E-COMMERCE REPORT (Preview) February 2013 THE E-COMMERCE REPORT WHAT IS THE E-COMMERCE REPORT? It is an annual investigation into the global uptake and impact of e- commerce. The report
TURKISH GRAIN BOARD GENERAL DIRECTORATE
 TURKISH GRAIN BOARD GENERAL DIRECTORATE NUMBER: 2014/3 GRAIN NEWSLETTER 15.04.2014 1-) TGB GRAIN PURCHASES AND PRICES A- GRAIN According to TÜİK s (TurkStat) data, in our country, 20.100 thousand tons
AG R I C U LT U R E GREEN ECONOMY
 THIS IS THE STORY OF AG R I C U LT U R E GREEN ECONOMY We need to make the global economy green. provides significant opportunities for growth, investment and jobs to help make this happen. $ Everyone
Abstract. Scenario Max. Acceptable As (ppb) Rice Water Sources equal 277 25 Water 10 ppb 444 10. % of Samples. <0.1 0.1-0.5 0.5-1 >1 Grain As - ppm
 Rice Water Sources equal 277 25 Water 10 ppb 444 10. % of Samples. <0.1 0.1-0.5 0.5-1 >1 Grain As - ppm") What are Safe Levels of Arsenic in Food and Soils? J.M. Duxbury (jmd17@cornell.edu) and Y. J. Zavala (yjz1@cornell.edu), Cornell University, Ithaca, NY, USA Abstract A perspective on arsenic safety in
What are Safe Levels of Arsenic in Food and Soils? J.M. Duxbury (jmd17@cornell.edu) and Y. J. Zavala (yjz1@cornell.edu), Cornell University, Ithaca, NY, USA Abstract A perspective on arsenic safety in
Innovative Technology Solutions for Sustainability ABENGOA. Industrial Production Market Outlook. Analyst & Investor Day. Javier Salgado Javier Molina
 Innovative Technology Solutions for Sustainability ABENGOA Industrial Production Market Outlook Javier Salgado Javier Molina Analyst & Investor Day May 2012 Agenda 1 Bioenergy Market Outlook & Growth Strategy
International Education in the Comox Valley: Current and Potential Economic Impacts
 International Education in the Comox Valley: Current and Potential Economic Impacts FINAL REPORT March 2012 Prepared by: Vann Struth Consulting Group Inc. Vancouver, BC www.vannstruth.com Prepared for:
Global Outlook for Shrimp Markets and Demand. Felix Dent Fishery Industry Officer Fish Products, Trade & Marketing Branch (FIPM)
") Global Outlook for Shrimp Markets and Demand Felix Dent Fishery Industry Officer Fish Products, Trade & Marketing Branch (FIPM) FAO? What is... Food and Agriculture Organization of the United Nations Established
Global Outlook for Shrimp Markets and Demand Felix Dent Fishery Industry Officer Fish Products, Trade & Marketing Branch (FIPM) FAO? What is... Food and Agriculture Organization of the United Nations Established
Carnegie Mellon University Office of International Education Admissions Statistics for Summer and Fall 2013
 Carnegie Mellon University Admissions Statistics for and Fall 2013 New International Students and Fall 2012 Undergraduate 270 14.3% Master's 1301 68.7% Doctorate 192 10.1% Exchange 99 5.2% 31 1.6% Total
Group sales 10% Weak SEA currencies accounted for ~3% decrease Global brand sales 4% from improvements in China franchisee performance
 2016 First Quarter Update 4 May 2016 Overview Group sales 1 Weak SEA currencies accounted for ~3% decrease Global brand sales 4% from improvements in China franchisee performance Gross margin 2.5pp; gross
HARVESTING AND GINNING OF COTTON IN THE WORLD
 HARVESTING AND GINNING OF COTTON IN THE WORLD M. Rafiq Chaudhry Technical Information Section International Cotton Advisory Committee, Washington, D.C. Abstract About 30% of world cotton production is
Climbing the Learning Curve: What works and what doesn t for Subsurface Drip in Alfalfa?
 Climbing the Learning Curve: What works and what doesn t for Subsurface Drip in Alfalfa? Daniel H. Putnam, Ali Montazar, Khaled Bali, Daniele Zaccaria University of California, Davis dhputnam@ucdavis.edu
Global growth rates Macroeconomic indicators CEDIGAZ Reference Scenario
 Medium and Long Term Natural Gas Outlook CEDIGAZ February 215 Global growth rates Macroeconomic indicators CEDIGAZ Reference Scenario 4 3 %/year 199-213 213-235 6 Main consuming markets - %/year (213-235)
Comparing Levels of Development
 2 Comparing Levels of Development Countries are unequally endowed with natural capital. For example, some benefit from fertile agricultural soils, while others have to put a lot of effort into artificial
Harvesting energy with fertilizers
 Harvesting energy with fertilizers Sustainable agriculture in Europe 1 Harvesting energy with fertilizers The reason for agriculture s existence is to supply energy to mankind. Agriculture converts solar
DAIRY AND DAIRY PRODUCTS
 3. COMMODITY SNAPSHOTS DAIRY AND DAIRY PRODUCTS Market situation International prices of all dairy products continued to decline from their 2013 peak, in particular for skim milk powder (SMP) and whole
World Water and Climate Atlas
 International Water Management Institute World Water and Climate Atlas Direct access to water and climate data improves agricultural planning The IWMI World Water and Climate Atlas provides rapid access
World Consumer Income and Expenditure Patterns
 World Consumer Income and Expenditure Patterns 2014 14th edi tion Euromonitor International Ltd. 60-61 Britton Street, EC1M 5UX TableTypeID: 30010; ITtableID: 22914 Income Algeria Income Algeria Income
OPPORTUNITIES FOR CLIMATE CHANGE MITIGATION IN AGRICULTURE
 OPPORTUNITIES FOR CLIMATE CHANGE MITIGATION IN AGRICULTURE AND INVESTMENT REQUIREMENTS TO TAKE ADVANTAGE OF THESE OPPORTUNITIES A report to the UNFCCC Secretariat Financial and Technical Support Programme
Russia. How does Travel & Tourism compare to other sectors? GDP. Size. Share. Russia GDP Impact by Industry. Russia GDP Impact by Industry
 Russia Izmaylovo Kremlin in Moscow Agriculture Automotive Manufacturing Banking Chemicals Manufacturing Communications Education Financial Services Mining Other Service Exports Retail (without wholesale)
FY2015 Survey on the International Operations of Japanese Firms JETRO Overseas Business Survey
 Japan External Trade Organization FY2015 Survey on the International Operations of Japanese Firms JETRO Overseas Business Survey March 3, 2016 Japan External Trade Organization (JETRO) Table of contents
Global AML Resource Map Over 2000 AML professionals
 www.pwc.co.uk Global AML Resource Map Over 2000 AML professionals January 2016 Global AML Resources: Europe France Italy Jersey / Guernsey 8 Ireland 1 Portugal 7 Luxembourg 5 United Kingdom 1 50 11 Spain
I. World trade developments
 I. World trade developments World merchandise exports grew by 2 per cent in value terms in 2013 while exports of commercial services increased by per cent. Key developments in 2013: a snapshot Trade data
2015 Country RepTrak The World s Most Reputable Countries
 2015 Country RepTrak The World s Most Reputable Countries July 2015 The World s View on Countries: An Online Study of the Reputation of 55 Countries RepTrak is a registered trademark of Reputation Institute.
Chapter D9. Irrigation scheduling
 Chapter D9. Irrigation scheduling PURPOSE OF THIS CHAPTER To explain how to plan and schedule your irrigation program CHAPTER CONTENTS factors affecting irrigation intervals influence of soil water using
Sustainable Solutions. Switch to future thinking
 Switch to future thinking Increased global competition, rapid advances in technology, risks from natural disasters, resource shortages today s business leaders must adapt to operating in a changing world,
Which floret of broccoli would you choose?
 Which floret of broccoli would you choose? Thomas Angervall Britta Florén Friederike Ziegler November 2006 A study carried out by SIK for the Stockholm Consumer Co-operative Society. For more information:
ANNEX TABLES Table 1. Revenue by ICT Type Revenue * Share to Total Revenues Growth Rate ICT Type 2004 2005 2004 2005 (in percent)
") ANNEX TABLES Table 1. Revenue by Revenue * Share to Revenues 2004 2005 2004 2005 Contact Centers 32,904.1 54,295.1 44.4 49.4 65.0 Medical Transcription 236.7 466.2 0.3 0.4 97.0 Animation 694.2 939.1 0.9
ANNEX TABLES Table 1. Revenue by Revenue * Share to Revenues 2004 2005 2004 2005 Contact Centers 32,904.1 54,295.1 44.4 49.4 65.0 Medical Transcription 236.7 466.2 0.3 0.4 97.0 Animation 694.2 939.1 0.9
Global water resources under increasing pressure from rapidly growing demands and climate change, according to new UN World Water Development Report
 WWDR4 Background Information Brief Global water resources under increasing pressure from rapidly growing demands and climate change, according to new UN World Water Development Report As demand for water
Carnegie Mellon University Office of International Education Admissions Statistics for Summer and Fall 2015
 Carnegie Mellon University Admissions Statistics for and Fall 2015 New International Students and Fall 2015 Undergraduate 344 15.2% Master's 1599 70.6% Doctorate 167 7.4% Exchange 73 3.2% 81 3.6% Total
ISO International Workshop on Water Kobe Convention Center, Japan, 25-26 July 2012. Water footprint. Taikan OKI
 ISO International Workshop on Water Kobe Convention Center, Japan, 25-26 July 2012 Water footprint Taikan OKI Institute of Industrial Science, The University of Tokyo 1 http://hydro.iis.u-tokyo.ac.jp/
2015 Growth in data center employment continues but the workforce is changing
 Published in Conjunction with MARKET BRIEFING GLOBAL DATA CENTER EMPLOYMENT 2015 2015 Growth in data center employment continues but the workforce is changing Globally, the number of people working in
Trends in International Education
 Trends in International Education 1 Presentation Objectives 1. International landscape the competitive environment for recruitment of international students 2. Key statistics 3. Key trends 4. Observations/Conclusions
AGRICULTURAL PROBLEMS OF JAPAN
 AGRICULTURAL PROBLEMS OF JAPAN Takeshi Kimura, Agricultural Counselor Embassy of Japan, Washington, D. C. I would like, first, to sketch the Japanese agricultural situation and, second, to review Japan's
Open Doors 2011 Report on International Educational Exchange
 Open Doors 2011 Report on International Educational Exchange Produced by the Institute of International Education with support from the Bureau of Educational and Cultural Affairs of the U.S. Department
WATER HARVESTING AND AQUACULTURE FOR RURAL DEVELOPMENT INTRODUCTION TO AQUACULTURE
 WATER HARVESTING AND AQUACULTURE FOR RURAL DEVELOPMENT INTRODUCTION TO AQUACULTURE 2 INTERNATIONAL CENTER FOR AQUACULTURE AND AQUATIC ENVIRONMENTS AUBURN UNIVERSITY 3 INTRODUCTION More than one-fourth
Australia s position in global and bilateral foreign direct investment
 Australia s position in global and bilateral foreign direct investment At the end of 213, Australia was the destination for US$592 billion of global inwards foreign direct investment (FDI), representing
ANALYSIS OF LEBANON S FOOD MARKET
 ANALYSIS OF LEBANON S FOOD MARKET Table of Contents World Food Market 3 Lebanon s Food Production 8 Lebanon s Food Imports and Exports 11 Evolution of Food Imports 11 Food Imports by Type 12 Food Imports
LOW CARBON AND ENVIRONMENTAL GOODS AND SERVICES (LCEGS) Report for 2009/10 JULY 2011
 Report for 2009/10 JULY 2011") LOW CARBON AND ENVIRONMENTAL GOODS AND SERVICES (LCEGS) Report for 2009/10 JULY 2011 Low Carbon and Environmental Goods and Services (LCEGS) Report for 2009/10 July 2011 Commissioned by the Department
LOW CARBON AND ENVIRONMENTAL GOODS AND SERVICES (LCEGS) Report for 2009/10 JULY 2011 Low Carbon and Environmental Goods and Services (LCEGS) Report for 2009/10 July 2011 Commissioned by the Department
ACCOUNTING FOR ASIA S NATURAL CAPITAL
 ACCOUNTING FOR S NATURAL CAPITAL DRIVING THE TRANSITION TO A RESOURCE-EFFICIENT GREEN ECONOMY Asia s rapid economic growth during recent decades has been accompanied by serious depletion of the region
JICA Training Course Plant Variety Protection course
 Session 4: DUS Training provided by members of the Union DUS Training organized by Japan Tsukasa KAWAKAMI Intellectual Property Division, Ministry of Agriculture, Forestry and Fisheries (MAFF) Japan 1
Water footprints of nations: Water use by people as a function of their consumption pattern
 DOI 10.1007/s11269-006-9039-x ORIGINAL ARTICLE Water footprints of nations: Water use by people as a function of their consumption pattern A. Y. Hoekstra A. K. Chapagain Received: 18 January 2005 / Accepted:
Mineral Industry Surveys
 4 Mineral Industry Surveys For information contact: Robert L. Virta, Asbestos Commodity Specialist U.S. Geological Survey 989 National Center Reston, VA 20192 Telephone: 703-648-7726, Fax: (703) 648-7757
INSIGHTS FROM OPERA MEDIAWORKS
 INSIGHTS FROM OPERA MEDIAWORKS The first mobile ad platform built for brands, delivering breakthrough marketing at scale 90% of the top AD AGE GLOBAL ADVERTISERS 850 million+ UNIQUE USERS Over 18,000 SITES
Impact of dry seeding with alternate wetting and drying on rice productivity and profitability in Punjab-Pakistan
 Impact of dry seeding with alternate wetting and drying on rice productivity and profitability in Punjab-Pakistan Mann RA 1, Hussain S 1, Saleem M 2 1 Rice Program, National Agricultural Research Centre
Water Resource. 1 Initiating and Sustaining Water Sector Reforms : A Synthesis World Bank in collaboration with the Government of India, Ministry of
 WATER RESOURCES OF INDIA by Kalipada Chatterjee Climate Change Centre Development Alternatives Introduction Water is essential for human civilisation, living organisms, and natural habitat. It is used
BT Premium Event Call and Web Rate Card
 BT Managed Event and BT Self-Managed Event (also referred to as Express, Plus and Premium) Conference Bridge and Call for Booked Audio Conferencing Services will comprise the following for each phone-conference:
Global Water Resources
 Global Water Resources Highlights from assessment activities over the past two decades, which are used to establish present and future water trends, reveal that: 1. Freshwater resources are unevenly distributed,
El Niño-Southern Oscillation (ENSO): Review of possible impact on agricultural production in 2014/15 following the increased probability of occurrence
: Review of possible impact on agricultural production in 2014/15 following the increased probability of occurrence") El Niño-Southern Oscillation (ENSO): Review of possible impact on agricultural production in 2014/15 following the increased probability of occurrence EL NIÑO Definition and historical episodes El Niño
El Niño-Southern Oscillation (ENSO): Review of possible impact on agricultural production in 2014/15 following the increased probability of occurrence EL NIÑO Definition and historical episodes El Niño
THAI AGRICULTURAL STANDARD TAS 4000-2003 THAI HOM MALI RICE
 THAI AGRICULTURAL STANDARD TAS 4000-2003 THAI HOM MALI RICE National Bureau of Agricultural Commodity and Food Standards Ministry of Agriculture and Cooperatives ICS 67.060 ISBN 974-403-194-8 UNOFFICAL