INFRARED SPECTROSCOPY. Dr.Mishu Singh Chemistry Department M.P.Govt P.G. College Hardoi
|
|
|
- Cory Francis
- 7 years ago
- Views:
Transcription
1 INFRARED SPECTROSCOPY Dr.Mishu Singh Chemistry Department M.P.Govt P.G. College Hardoi 1
2 ? 2
3 Seeing The non-seeable Using electromagnetic radiation as a probe to obtain information about atoms and molecules that are too small to see 3
4 What is Spectroscopy? Atoms and molecules interact with electromagnetic radiation (EMR) in a wide variety of ways. Atoms and molecules may absorb and/or emit EMR. Absorption of EMR stimulates different types of motion in atoms and/or molecules. The patterns of absorption (wavelengths absorbed and to what extent) and/or emission (wavelengths emitted and their respective intensities) are called spectra. Spectroscopy is the interaction of EMR with matters to get spectra,which gives information like, bond length, bond angle, geometry and molecular structure. 4
5 Electromagnetic radiation displays the properties of both particles and waves. The particle component is called a photon. The term photon is implied to mean a small, massless particle that contains a small wave-packet of EM radiation/light. The energy (E) component of a photon is proportional to the frequency. Where h is Planck s constant and ʋ is the frequency in Hertz (cycles per second). E = hʋ = distance of one wave = frequency: waves per unit time (sec -1, Hz) c = speed of light (3.0 x 10 8 m sec -1 ) h = Plank s constant (6.63 x J sec). 5
6 Because the speed of light, c, is constant, the frequency, n, (number of cycles of the wave per second) can complete in the same time, must be inversely proportional to how long the oscillation is, or wavelength: = c c = 3 x cm/s E = h = hc Because the atomic particles in matter also exhibit wave and particle properties, EM radiation can interact with matter in two ways: Collision particle-to-particle energy is lost as heat and movement. Coupling the wave property of the radiation matches the wave property of the particle and couple to the next higher quantum mechanical energy level 6
7 Electromagnetic Spectrum Frequency, in Hz ~10 19 ~10 17 ~10 15 ~10 13 ~10 10 ~10 5 Wavelength, ~.0001 nm ~0.01 nm 10 nm 1000 nm 0.01 cm 100 m Energy (kcal/mol) > ~10-4 ~10-6 g-rays X-rays UV IR Microwave Radio nuclear excitation (PET) core electron excitation (X-ray cryst.) electronic excitation (p to p*) molecular vibration molecular rotation Nuclear Magnetic Resonance NMR (MRI) Visible 7
8 Principles of molecular spectroscopy organic molecule (ground state) light h organic molecule (excited state) relaxation organic molecule (ground state) + h UV-Visible: valance electron transitions - gives information about p-bonds and conjugated systems Infrared: molecular vibrations (stretches, bends) - identify functional groups Radiowaves: nuclear spin in a magnetic field (NMR) - gives a map of the H and C framework 8
9 INSTRUMENTAL METHODS OF STRUCTURE DETERMINATION 1. Nuclear Magnetic Resonance (NMR) Excitation of the nucleus of atoms through radiofrequency irradiation. Provides extensive information about molecular structure and atom connectivity. 2. Infrared Spectroscopy (IR) Triggering molecular vibrations through irradiation with infrared light. Provides mostly information about the presence or absence of certain functional groups. 3. Mass spectrometry Bombardment of the sample with electrons and detection of resulting molecular fragments. Provides information about molecular mass and atom connectivity. 4. Ultraviolet spectroscopy (UV) Promotion of electrons to higher energy levels through irradiation of the molecule with ultraviolet light. Provides mostly information about the presence of conjugated p systems and the presence of double and triple bonds.
10 Infrared (IR) Spectroscopy IR deals with the interaction of infrared radiation with matter. The IR spectrum of a compound can provide important information about its chemical nature and molecular structure. Most commonly, the spectrum is obtained by measuring the absorption of IR radiation, although infrared emission and reflection are also used. Widely applied in the analysis of organic materials, also useful for polyatomic inorganic molecules and for organometallic compounds. 10
11 Infrared spectrometry is applied to the qualitative and quantitative determination of molecular species of all types. The most widely used region is the mid-infrared that extends from about 400 to 4000 cm -1 (2.5 to 25 m). (Absorption, reflection and emission spectra are employed) The near-infrared region from 4000 to 14,000 cm -1 (0.75 to 2.5 m) also finds considerable use for the routine quantitative determination. (water, CO 2, low conc. Hydrocarbons, amine nitrogen, many other compounds) The far-infrared region has been for the determination of the structures of inorganic and metal-organic species. 11

12 Range of IR Radiation 12
13 13
14 Conditions For IR Activity Energy of IR photon insufficient to cause electronic excitation but can cause vibrational or rotational excitation Molecule electric field (dipole moment) interacts with IR photon electric field (both dynamic) Magnitude of dipole moment determined by (i) charge (ii) separation of charge Molecule must have change in dipole moment due to vibration or rotation to absorb IR radiation. Absorption causes increase in vibration amplitude/rotation frequency 14
15 DIPOLE MOMENT (µ) µ = Q x r Q = charge and r = distance between charges Asymmetrical distribution of electrons in a bond renders the bond polar A result of electro negativity difference µ changes upon vibration due to changes in r Change in µ with time is necessary for a molecule to absorb IR radiation 15
16 The repetitive changes in µ makes it possible for polar molecules to absorb IR radiation Symmetrical molecules do not absorb IR radiation since they do not have dipole moment (O 2, F 2, H 2, Cl 2 ) Diatomic molecules with dipole moment are IR-active (HCl, HF, CO, HI) Molecules with more than two atoms may or may not be IR active depending on whether they have permanent net dipole moment 16
17 A bond or molecule must have a permanent dipole moment. If not, then, some of its vibration must produce an induced dipole moment in order to have an absorbance in the IR spectrum. The frequency of vibration of a particular bond must be equal to the frequency of IR radiation. 17
 are IR")
18 Molecules with permanent dipole moments (μ) are IR active! 18

19 Some linear molecules may be IR active CO 2 O=C=O 19

20 20
21 IR ABSORPTION BY MOLECULES Molecules with covalent bonds may absorb IR radiation Absorption is quantized Molecules move to a higher energy state IR radiation is sufficient enough to cause rotation and vibration. The IR scans a range of frequencies (in the infrared part of the electromagnetic spectrum). Any frequency which matches the characteristic frequency of a bond will be absorbed Radiation between 1 and 100 µm will cause excitation to vibrational states higher 21
22 Absorption spectrum is composed of broad vibrational absorption bands Molecules absorb radiation when a bond in the molecule vibrates at the same frequency as the incident radiant energy Molecules vibrate at higher amplitude after absorption A molecule must have a change in dipole moment during vibration in order to absorb IR radiation 22
23 Absorption frequency depends on: Masses of atoms in the bonds Geometry of the molecule Strength of bond Other contributing factors 23
24 Theory / Principle Infrared radiation is largely thermal energy. It induces stronger molecular vibrations in covalent bonds, which can be viewed as springs holding,together two masses, or atoms. Specific bonds respond to (absorb) specific frequencies X Y μ =m 1.m 2 /m 1 +m 2, reduced mass K = Force constant 24
25 As a covalent bond oscillates due to the oscillation of the dipole of the molecule a varying electromagnetic field is produced. The greater the dipole moment change through the vibration, the more intense the EM field that is generated 25
26 When a wave of infrared light encounters this oscillating EM field generated by the oscillating dipole of the same frequency, the two waves couple, and IR light is absorbed. The coupled wave now vibrates with twice the amplitude IR beam from spectrometer coupled wave EM oscillating wave from bond vibration 26
27 Types of vibrations Stretching Vibration or oscillation along the line of the bond ( change of bond length) H H C C H symmetric H asymmetric 27
28 Types of vibrations Bending Vibration or oscillation not along the line of the bond (change of bond angle) H H C H H C H H C H H C scissor in plane rock twist wag out of plane 28
29 29
30 Vibrational Modes Covalent bonds can vibrate in several modes, including stretching, bending (rocking, scissoring, wagging and twisting) The most useful bands in an infrared spectrum correspond to stretching frequencies, and those will be the ones we ll focus on. A molecule containing n atoms, has 3n degrees of freedom. 3n = Translational modes + Rotational modes + Vibrational Mode Linear Molecule : TM = 3, RM = 2, hence, 3n = Vibrational Modes Vibrational Modes = (3n-5) ; C 2 H 2, CO 2 Strecthing vib = (n-1) bending vib = (2n-4) Non-linear Molecule : Vibrational Modes = (3n-6); C 6 H 6, CHCl 3 Strecthing vib = (n-1) bending vib. = (2n-5) 30
31 Number of possible modes Nonlinear molecule: 3N 6 Linear molecule: 3N 5 3 degrees of freedom i.e., 3 coordinates in space 3 translations and 3 rotations account for 6 motions of molecule Rotation about center bond in linear molecule is indistinguishable Remaining degrees of motion represent vibrational motion (i.e., number of vibrations within the molecule) 31
32 Factors Influencing the Normal Modes Four factors tend to produce fewer experimental peaks than would be expected from the theoretical number of normal modes. (1) the symmetry of the molecules is such that no change in dipole results from a particular vibration (2) the energies of two or more vibrations are identical or nearly identical (3) the absorption intensity is so low as to be undetectable by ordinary means (4) the vibrational energy is in a wavelength region beyond the range of the instrument. 32
33 Occasionally more peaks are found than are expected based upon the number of normal modes. The occurrence of overtone peaks that occur at two or three times the frequency of a fundamental peak. In addition combination bands are sometimes encountered when a photon excites two vibrational modes simultaneously. The frequency of the combination band is approximately the sum or difference of the two fundamental frequencies. 33
34 Vibratrional Coupling The energy of a vibration, and thus the wavelength of its absorption peak, may be influenced by other vibrators in the molecule. A number of factors influence the extent of such coupling: 1. Strong coupling between stretching vibrations occurs only when there is an atom common to the two vibrations. 2. Interaction between bending vibrations requires a common bond between the vibrating groups. 34
35 3.Coupling between a stretching and a bending vibration can occur if the stretching bond forms one side of the angle that varies in the bending vibration. 4. Interaction is greatest when the coupled groups have individual energies that are approximately equal. 5. Little or no interaction is observed between groups separated by two or more bonds. 6. Coupling requires that the vibrations be of the same symmetry species. 35
36 CO2 Molecule If no coupling occurred between the two C=O bonds, an absorption peak would be expected at the same peak for the C=O stretching vibration in an aliphatic ketone (about 1700 cm-1). Experimentally, carbon dioxide exhibits two absorption peaks, the one at 2350 cm-1 and the other at 666 cm-1. Carbon dioxide is a linear molecule and thus has 3 x 3 5 = 4 normal modes. Two stretching vibrations are possible. The symmetric vibration causes no change in dipole. Thus, the symmetric vibration is infrared inactive. The asymmetric vibration produce a change in dipole moments, so absorption at 2330 cm-1 results. The remaining two vibrational modes of carbon dioxide involve scissoring. The two bending vibrations are the resolved components at 90 deg to one another of the bending motion in all possible planes around the bond axis. The two vibrations are identical in energy and thus produce a single peak at 667 cm-1. 36
37 37
38 H2O molecule Triatomic molecule such as water, sulfur dioxide, or nitrogen dioxide have 3 x 3 6 = 3 vibrational modes. The central atom is not in line with the other two, a symmetric stretching vibration will produce a change in dipole and will thus be responsible for infrared absorption. Stretching peaks at 3650 and 3760 cm-1 appear in the infrared spectrum for the symmetric and asymmetric vibrations of the water molecule. There is only one component to the scissoring vibration for this nonlinear molecule. For water, the bending vibration cause absorption at 1595 cm-1. 38
39 39
40 In an IR Spectrum each stretching and bending vibration occurs with a characteristic frequency as the atoms and charges involved are different for different bonds The y-axis on an IR spectrum is in units of % transmittance In regions where the EM field of an osc. bond interacts with IR light of the same n transmittance is low (light is absorbed) In regions where no osc. bond is interacting with IR light, transmittance nears 100% 40
41 The x-axis of the IR spectrum is in units of wavenumber, n, which is the number of waves per centimeter in units of cm -1 (Remember E = hʋ or E = hc/ɻ) 41
42 Use of unit wavenumbers 1. This unit wavenumbers is used rather than wavelength (microns) because wavenumbers are directly proportional to the energy of transition being observed chemists like this, physicists hate it High frequencies and high wavenumbers equate higher energy is quicker to understand than Short wavelengths equate higher energy 2. This unit is used rather than frequency as the numbers are more real than the exponential units of frequency 3. IR spectra are observed for the mid-infrared: cm -1 42
43 I. R. Spectrum The IR spectrum is basically a plot of transmitted (or absorbed) frequencies vs. intensity of the transmission (or absorption). Frequencies appear in the x-axis in units of inverse centimeters (wave numbers), and intensities are plotted on the y-axis in percentage units. The graph 2nd above shows a spectrum in transmission mode.this is the most commonly used representation and the one found in most chemistry and spectroscopy books. Therefore we will use this representation
44 Infrared Active Bonds 1.Not all covalent bonds display bands in the IR spectrum. Only polar bonds do so. These are referred to as IR active. 2. The intensity of the bands depends on the magnitude of the dipole moment associated with the bond in question: Strongly polar bonds such as carbonyl groups (C=O) produce strong bands. Medium polarity bonds and asymmetric bonds produce medium bands. Weakly polar bond and symmetric bonds produce weak or non observable bands. 44
45 Infrared Band Shapes Two of the most common bands are narrow; thin and pointed, like a dagger and Broad bands ;wide and smoother. A typical example of a broad band is that displayed by O-H bonds, such as those found in alcohols and carboxylic acids, as shown below. Broad bands 45
46 CLASSIFICATION OF IR BANDS IR bands can be classified as strong (s), medium (m), or weak (w), depending on their relative intensities in the infrared spectrum. A strong band covers most of the y-axis. A medium band falls to about half of the y-axis, and a weak band falls to about one third or less of the y-axis. Strong (s) peak is tall, transmittance is low (0-35 %) Medium (m) peak is mid-height (75-35%) Weak (w) peak is short, transmittance is high (90-75%) 46
47 Information Obtained From Ir Spectra IR is most useful in providing information about the presence or absence of specific functional groups. IR can provide a molecular fingerprint that can be used when comparing samples. If two pure samples display the same IR spectrum it can be argued that they are the same compound. IR does not provide detailed information or proof of molecular formula or structure. It provides information on molecular fragments, specifically functional groups. Therefore it is very limited in scope, and must be used in conjunction with other techniques to provide a more complete picture of the molecular structure. 47

48 The Fingerprint Region Although the entire IR spectrum can be used as a fingerprint for the purposes of comparing molecules, the cm -1 range is called the fingerprint region. This is normally a complex area showing many bands, frequently overlapping each other. Focus your analysis on this region. This is where most stretching frequencies appear. Fingerprint region: complex and difficult 48 to interpret reliably.
49 49
50 50
51 51

52 I.R. Absorption Range Note that the blue coloured sections above the dashed line refer to stretching vibrations, and the green coloured band below the line encompasses bending vibrations. 52

53 Summary of IR Absorptions 53
54 Applications of Infrared Spectroscopy Infrared spectrometry is applied to the qualitative and quantitative determination of molecular species of all types. The most widely used region is the mid-infrared that extends from about 400 to 4000 cm -1 (2.5 to 25 m). (Absorption, reflection and emission spectra are employed) The near-infrared region from 4000 to 14,000 cm -1 (0.75 to 2.5 m) also finds considerable use for the routine quantitative determination. (water, CO 2, low conc. Hydrocarbons, amine nitrogen, many other compounds) The far-infrared region has been for the determination of the structures of inorganic and metal-organic species. 54
55 Functional Groups & IR Frequencies 55
56 Factors effecting IR absorption 1. Force constant, k 2. Reduced mass, μ 3. Electronegativity difference, N 4. Bond dissociation energy, D 5. Internuclear distance, r It also depends upon: Inductive effect, resonance, and steric effect etc. Stronger bonds will have higher Force constant.k H-bonding 56
57 Sample problem The force constant for a typical triple bond is 1.91 x 10 3 N/m. Calculate the approximate frequency of the main absorption peak due to vibration of CO. 57
58 Force Constant : Stronger bonds will have higher Force constant. K Triple bonds > Double bonds > Single bonds C C C o C N > C=C > C-C > C=O > C-O > C=N > C-N 58
59 PREDICTING STRUCTURE OF UNKNOWN Identify the major functional groups from the strong absorption peaks Identify the compound as aromatic or aliphatic Subtract the FW of all functional groups identified from the given molecular weight of the compound Look for C C and C=C stretching bands Look for other unique CH bands (e.g. aldehyde) Use the difference obtained to deduce the structure 59
60 INTERPRETATION OF IR SPECTRA Functional Group Region Strong absorptions due to stretching from hydroxyl, amine, carbonyl, CH x cm -1 Fingerprint Region Result of interactions between vibrations cm -1 60
61 Conjugation By resonance, conjugation lowers the energy of a double or triple bond. The effect of this is readily observed in the IR spectrum: O O 1684 cm cm -1 C=O C=O Conjugation will lower the observed IR band for a carbonyl from cm -1 provided conjugation gives a strong resonance contributor O C H 3 C X X = NH 2 CH 3 Cl NO cm -1 O H 2 N C CH 3 vs. O O N O C CH 3 Strong resonance contributor Poor resonance contributor (cannot resonate with C=O) Inductive effects are usually small, unless coupled with a resonance contributor 61 (note CH 3 and Cl above)
62 Steric Effects Usually not important in IR spectroscopy, unless they reduce the strength of a bond (usually p) by interfering with proper orbital overlap: O O C=O: 1686 cm -1 CH 3 C=O: 1693 cm -1 Here the methyl group in the structure at the right causes the carbonyl group to be slightly out of plane, interfering with resonance Strain effects Changes in bond angle forced by the constraints of a ring will cause a slight change in hybridization, and therefore, bond strength O O O O O 1815 cm cm cm cm cm -1 As bond angle decreases, carbon becomes more electronegative, as well as less sp 2 62 hybridized (bond angle < 120 )
63 Hydrogen bonding Hydrogen bonding causes a broadening in the band due to the creation of a continuum of bond energies associated with it. In the solution phase these effects are readily apparent; in the gas phase where these effects disappear or in lieu of steric effects, the band appears as sharp as all other IR bands: H-bonding can interact with other functional groups to lower frequencies O H O C=O; 1701 cm -1 63
64 64

65 Steric hindrance to H-bonding in a di-tert-butylphenol OH 65

66 Gas phase spectrum of 1-butanol 66
67 Single Bond Region O-H ν = cm -1 N-H ν = cm -1 C-H ν = cm -1 Greater the dipole moment, the more intense the absorption. But, actually it is not so. There are other factors which affect the absorption in IR region 67
68 Infrared Absorption Frequencies of C-H Depend upon the state of hybridization of C-atom attached. Structural unit Frequency, cm -1 sp C H sp 2 C H sp 3 C H
69 Alkanes combination of C-C and C-H bonds C-C stretches and bends cm -1 CH 2 -CH 2 bond cm -1 CH 2 -CH 3 bond cm -1 sp 3 C-H between cm -1 69
70 Octane (w s) (m) 70
71 71
72 n-pentane 3000 cm cm -1 sat d C-H 1470 &1375 cm -1 CH 3 CH 2 CH 2 CH 2 CH 3 72
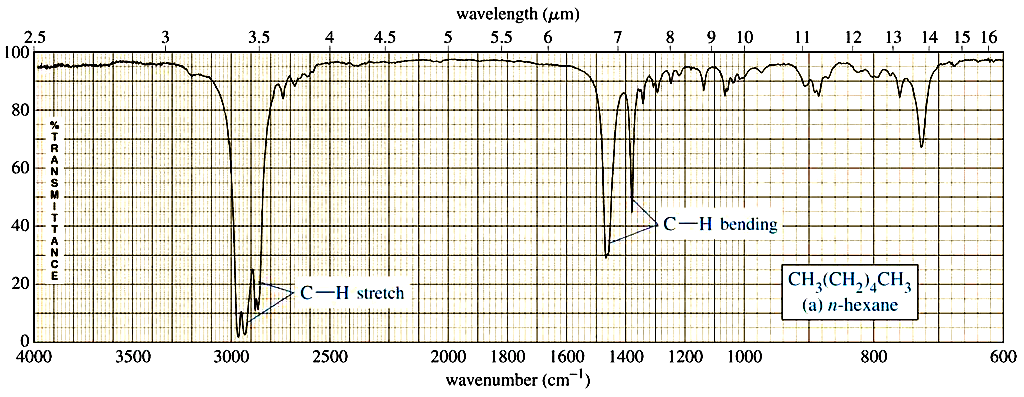
73 n-hexane CH 3 CH 2 CH 2 CH 2 CH 2 CH 3 73
74 2-methylbutane (isopentane) 74
75 2,3-dimethylbutane 75
76 cyclohexane no 1375 cm -1 no CH 3 76
77 Toluene sp 2 C-H sp 3 C-H CH 3 aromatic C=C aromatic oops 77
78 isopropylbenzene isopropyl split
79 C 8 H 6 C-H unsat d 1500, 1600 benzene 3300 C-H C 8 H 6 C 6 H 5 = C 2 H mono phenylacetylene 79
80 C 4 H 8 Unst d C=C R 2 C=CH 2 isobutylene CH 3 CH 3 C=CH 2 80
81 C 9 H & 1600 benzene C-H unsat d & sat d mono C 9 H 12 C 6 H 5 = -C 3 H 7 isopropylbenzene n- propylbenzene? 81
82 n-propylbenzene 82
83 Alkenes addition of the C=C and vinyl C-H bonds C=C stretch at cm -1 weaker as substitution increases vinyl C-H stretch occurs at cm -1 The difference between alkane, alkene or alkyne C-H is important! If the band is slightly above 3000 it is vinyl sp 2 C-H or alkyl sp C-H, if it is below it is alkyl sp 3 C-H 83
 (w m) 84")
84 1-Octene (w m) (w m) 84
85 IR frequencies of ALKENES =C H bond, unsaturated vinyl (sp 2 ) cm RCH=CH & R 2 C=CH cis-rch=chr (v) trans-rch=chr C=C bond cm -1 (v) 85

86 86
87 1-Hexene sp 2 C-H sp 3 C-H stretch C=C stretch out of plane bendings (oops) CH 2 CH CH 2 CH 2 CH 2 CH 3 87
88 1-decene unsat d C-H cm -1 C=C & RCH=CH 2 88
89 4-methyl-1-pentene & RCH=CH 2 89
90 2-methyl-1-butene R 2 C=CH 2 90
91 2,3-dimethyl-1-butene R 2 C=CH 2 91
92 Non Terminal Alkene This spectrum shows that the band appearing around 3080 cm -1 can be obscured by the broader bands appearing around 3000 cm -1. ( lower ) 92
occurs at 3200-3300 cm -1 Internal alkynes ( R-C C-R ) would not have this band!")
93 Alkynes C C stretch cm -1 ; strength depends on asymmetry of bond, strongest for terminal alkynes, weakest for symmetrical internal alkynes C-H for terminal alkynes (,sharp &weak )occurs at cm -1 Internal alkynes ( R-C C-R ) would not have this band! (w-m) (m s) 93
94 I.R.Spectrum of Alkynes 94
95 Aromatics Due to the delocalization of toluene e - in the ring, C-C bond order is 1.5, the stretching frequency for these bonds is slightly lower in energy than normal C=C These show up as a pair of sharp bands, 1500 & 1600 cm -1, C-H bonds of the ring show up similar to vinyl C-H at cm -1 Ethyl benzene (w m) (w m) 95
96 IR spectra BENZENEs =C H bond, unsaturated aryl (sp 2 ) cm mono-substituted , ortho-disubstituted meta-disubstituted para-disubstituted , (m) (m) C=C bond 1500, 1600 cm -1 96
97 ethylbenzene cm -1 Unsat d C-H 1500 & 1600 Benzene ring , mono- 97
98 o-xylene ortho 98
99 p-xylene (m) para 99
100 m-xylene meta , (m) 100
101 styrene no sat d C-H 1640 C=C & RCH=CH 2 mono 101
102 2-phenylpropene Sat d C-H mono R 2 C=CH 2 102
103 p-methylstyrene para 103
104 Nitriles (the cyano- or C N group) Principle group is the carbon nitrogen triple bond at cm -1 This band has a sharp, pointed shape just like the alkyne C-C triple bond, but because the CN triple bond is more polar, this band is stronger than alkynes. 104
105 propionitrile N C (s) 105
106 Ir Spectrum of Nitrile 106
107 Ethers Addition of the C-O-C asymmetric band and vinyl C-H bonds Show a strong band for the antisymmetric C-O-C stretch at cm
108 methyl n-propyl ether no O--H C-O ether 108
")
109 Diisopropyl ether (s) 109
110 Infrared Absorption Frequencies of -OH groups Structural unit Frequency, cm -1 Stretching vibrations (single bonds) O H (alcohols & phenols ) O H (carboxylic acids) First examine the absorption bands in the vicinity of cm 1 110
111 Alcohols Strong, broad O-H stretch from cm -1 Like ethers, C-O stretch from cm -1 Band position changes depending on the alcohols substitution: ; ; ; phenol OH band in neat aliphatic alcohols is a broad band centered at ~ 3200 cm -1 due to hydrogen bonding ( cm -1 ) - OH band in dilute solutions of aliphatic alcohols is a sharp peak ~ 3400 cm
112 1-butanol (m s) br (s) 112
113 1-butanol (b) O- H C-O 1 o CH 3 CH 2 CH 2 CH 2 -OH 113
114 2-butanol O-H C-O 2 o 114
115 tert-butyl alcohol O-H C-O 3 o 115
116 Cyclohexanol OH O-H stretch sp 3 C-H stretch bending C-O stretch 116
117 Phenol CO H stretch is broad band C H stretch ~ 3050 cm -1 C C O band ~ 1225 cm -1 C O H bend ~ 1350 cm -1 Aromatic ring C stretching between cm -1 Mono substituted bands ~ cm -1 and cm
118 Carboxylic Acids Consist of both, C=O and O-H groups. C=O band occurs between cm -1 The highly dissociated O-H bond has a broad band from cm -1 covering up to half the IR spectrum in some cases 118
 br (s) (s) 119")
119 4-phenylbutyric acid (w m) br (s) (s) 119
120 IR Spectrum of A Carboxylic Acid 120
121 Propionic Acid 121
122 IR Spectrum of Carbonyl Componds Carbonyl compounds are those that contain the C=O functional group Aldehydes and ketones show a strong, prominent, band around cm -1 (right in the middle of the spectrum). This band is due to the highly polar C=O bond. Because,aldehydes also contain a C-H bond to the sp 2 carbon of the C=O bond, they also show a pair of medium strength bands positioned about 2700 and 2800 cm -1. These bands are missing in the spectrum of a ketone because the sp 2 carbon of the ketone lacks the C-H bond. 122
123 Infrared Absorption Frequencies of C=O Structural unit Frequency, cm -1 Stretching vibrations (carbonyl groups) 1.Aldehydes and ketones Carboxylic acids C O 3.Acid anhydrides and Esters Amides Acid Chloride 1800 ν C=O Decreasing order RCO) 2 O > RCOX > RCOOR > RCHO > RCOR > RCOOH > RCONH 2 123
124 ν C=O of Aldehydes And Ketones Both,aldehyde and ketone have a common functional group, called as, carbonyl, C=O. Strong, sharp C=O peak cm 1 124
125 How does Adsorption differ in Aldehydes & Ketones? 1. CH 2 O, EDG-CHO, EWG-CHO (CH 3 -CHO), (Cl 3 C- CHO) 2. CH 3 -CHO, CH 3 -CO-CH 3 3. Ph CHO, CH3-CHO 4. Ph CO-CH3, CH3-CO-CH3 125
126 Aldehydes C=O (carbonyl) stretch from cm -1 Band is sensitive to conjugation, as are all carbonyls (upcoming slide) A highly unique sp 2 C-H stretch appears as a doublet, 2720 & 2820 cm -1 called a Fermi doublet Cyclohexyl carboxaldehyde (w-m) (s) 126
127 127
128 128
129 Mono-substituted aromatic aldehyde 129
130 130
131 Ketones Simplest of the carbonyl compounds as far as IR spectrum carbonyl only 3-methyl-2-pentanone C=O stretch occurs at cm -1 (s) 131
132 IR: Ketones 132
133 2-butanone C=O ~1700 (s) 133
134 4-Methyl-2-pentanone C-H < 3000, C=O 1715 cm -1 CH 3 O C-H stretch C=O stretch CH 3 CH CH 2 C CH 3 134
135 Cyclic aliphatic ketone 135
136 Mono substituted aromatic methyl ketone aromatic C=C C=O 136
137 Mono substituted aromatic ketone 137
138 Effect Of Conjugation on ν C=O Conjugation with a double bond or benzene ring lowers the stretching frequency by 30 to 40 cm -1. Ketones are sensitive to conjugation O O O H O cm -1 rotational isomers cause doubling. S-trans 1674, S-cis cm cm-1 for enol 1715 cm-1 for the keto bond Along with br. OH str. 138

139 Effects of Conjugation 139

140 Strain on C=O of Ketones Ring strain increases frequency Incorporation of the carbonyl group in a small ring (5, 4 or 3- membered), raises the stretching frequency. 30 cm -1 higher for every C atom removed -diketones, str-str for open chain, IR inactive; in ring, 1720,1740 -haloketones--can see second band from rotamer populations 140 (1720, 1745)
 (s) 141")
141 Esters and Lactones: C=O stretch at cm -1 Strong band for C-O at a higher frequency than ethers or alcohols at cm -1 Lactones absorb at higher frequency than esters Ethyl pivalate (s) (s) 141
142 Aliphatic ester I 142
143 Aliphatic ester II 143
144 Aliphatic ester III 144
145 Mono substituted aromatic ester 145
146 Mono substituted aromatic conjugated ester 146
147 Effects of conjugation IR: C=O: Esters 1735 cm 1 in saturated esters Electron donating O increased the frequency 1715 cm 1 in esters next to aromatic ring or a double bond Conjugation decreases the frequency 147
148 : Effects of conjugation O O R O O Lowers to 1715 cm -1 Raises to 1770 cm -1 O Similar, to 1715 cm -1 O O R O Weakens DB character Strengthens DB character (inductive over resonance) 148
149 Mono substituted aromatic conjugated ester 149
150 Lactones, similar effects O O O O 1735 cm cm -1 O O O 1765 cm -1 O 1715 cm
151 INTERPRETATION OF IR SPECTRA Nitrogen-Containing Compounds - 1 o amines (NH 2 ) have scissoring mode and low frequency wagging mode - 2 o amines (NH) only have wagging mode (cannot scissor) - 3 o amines have no NH band and are characterized by C N stretching modes ~ cm -1 and cm -1-1 o, 2 o, 3 o amides are similar to their amine counterparts but have additional C=O stretching band 151
152 INTERPRETATION OF IR SPECTRA Nitrogen-Containing Compounds - C=O stretching called amide I in 1 o and 2 o amides and amide II in 3 o amides - N H stretch doublet ~ cm-1 for 1 o amines - 1 o N H bend at ~ 1610 cm-1 and 800 cm-1 - Single N H stretch ~ 3293 cm-1 for 2 o but absent in 3 o amine - C N stretch weak band ~ 1100 cm-1 152
153 INTERPRETATION OF IR SPECTRA Amino Acids [RCH(NH 2 )COOH] - IR spectrum is related to salts of amines and salts of acids - Broad CH bands that overlap with each other - Broad band ~ 2100 cm-1 - NH band ~ 1500 cm-1 - Carboxylate ion stretch ~ 1600 cm-1 153
154 Amides Display features of amines and carbonyl compounds C=O stretch at cm -1 If the amide is primary (-NH 2 ) the N-H stretch occurs from cm -1 as a doublet If the amide is secondary (-NHR) the N-H stretch occurs at cm -1 as a sharp singlet 154
 (s) 155")
155 pivalamide O NH 2 (m s) (s) 155
156 156
157 Acid anhydrides Coupling of the anhydride though the ether oxygen splits the carbonyl band into two with a separation of 70 cm -1 Bands are at cm-1 and cm -1 Mixed mode C-O stretch at cm
158 Propionic anhydride O O O (s) (s) 158
159 Amines - Primary Shows the N-H stretch for NH 2 as a doublet between cm -1 (symmetric and anti-symmetric modes) -NH 2 has deformation band from cm -1 Additionally there is a wag band at cm -1 that is not diagnostic 159

160 2-aminopentane (w) 160
161 1-Butanamine N-H stretch doublet N-H bend CH 2 CH 3 bend sp 3 C-H stretch CH 3 CH 2 CH 2 CH 2 NH 2 161
162 Amines Secondary N-H band for R 2 N-H occurs at cm -1 as a single sharp peak weaker than O-H Tertiary amines (R 3 N) have no N-H bond and will not have a band in this region 162
163 pyrrolidine (w m) 163
164 164
165 INTERPRETATION OF IR SPECTRA Halogenated Compounds C X strong absorption bands in the fingerprint and aromatic regions -More halogens on the same C results in an increase in intensity and a shift to higher wavenumbers Absorption due to C Cl and C Br occurs below 800 cm
166 Pause and Review Inspect the bonds to H region ( cm -1 ) Peaks from are simply sp 3 C-H in most organic molecules Above 3000 cm -1 Learn shapes, not wavenumbers!: Broad U-shape peak -O H bond V-shape peak -N H bond for 2 o amine (R 2 N H) W-shape peak -N H bond for 1 o amine (RNH 2 ) Sharp spike -C C H bond 3000 cm -1 Small peak shouldered just above 3000 cm -1 C=C H or Ph H 166
167 Study of metal complexes The metal-heteroatom bond stretching vibration can be studied with the help of far IR spectroscopy Examples: 167
168 Q. Which of the following will absorb at higher v c=o / v c-o in IR?
169 Ques. Predict the approximate positions of all of the important absorptions in the IR spectrum of this compound. Ques. Explain how IR spectroscopy could be used to distinguish between these two compounds. Be as specific as possible. 169
170 170
171 Explain which functional group is present in the compound with the following IR spectrum. Show a possible structure for the compound. The peak at 3300 cm -1 indicates the presence of an spc-h bond. The peaks at cm -1 indicate the presence of sp 3 C-H bonds. The peak at 2150 cm -1 indicates the presence of a carbon-carbon triple bond. So the compound is a 1-alkyne. A possible structure is 171
 benzyl alcohol B) 2,4,6-cycloheptaheptatrien-1-one C)")
172 Identify the compound from the IR.. C 7 H 6 O A) benzyl alcohol B) 2,4,6-cycloheptaheptatrien-1-one C) acetophenone D) benzaldehyde E) phenylacetic acid 172
173 C 10 H 12 O A) 2,4,5-trimethylbenzaldehyde B) p-allylanisole C) 2-allyl-4-methylphenol D) 1-phenyl-2-butanone 173
174 C 3 H 4 O A) cyclopropanone B) propynol C) acrylaldehyde D) propenoic acid 174
methylbenzoate B)o-hydroxyacetophenone C)o-toluic acid")
175 Identify the compound from the IR above. C 8 H 8 O 2 A)methylbenzoate B)o-hydroxyacetophenone C)o-toluic acid D)p-anisaldehyde (p-methoxybenzaldehyde) 175
176 C 8 H 8 O 2 Identify the compound from the IR above. A) benzylformate B) o-hydroxyacetophenone C) 2-methoxytropone D) o-anisaldehyde (p-methoxybenzaldehyde) E) p-toluic acid 176
177 The following IR spectrum is one of the four compounds shown below. Circle the correct compound. answer 177
178 Which compound is this? a) 2-pentanone b) 1-pentanol c) 1-bromopentane d) 2-methylpentane 1-pentanol 178
179 What is the compound? a) 1-bromopentane b) 1-pentanol c) 2-pentanone d) 2-methylpentane 2-pentanone 179
180 180
181 1 181
182 2 182
183 3 183
184 4 184
185 5 185
186 6 186

187 Strengths and Limitations IR alone cannot determine a structure Some signals may be ambiguous The functional group is usually indicated The absence of a signal is definite proof that the functional group is absent Correspondence with a known sample s IR spectrum confirms the identity of the compound 187
188 THANKYOU FOR PATIENCE 188
INFRARED SPECTROSCOPY (IR)
") INFRARED SPECTROSCOPY (IR) Theory and Interpretation of IR spectra ASSIGNED READINGS Introduction to technique 25 (p. 833-834 in lab textbook) Uses of the Infrared Spectrum (p. 847-853) Look over pages
INFRARED SPECTROSCOPY (IR) Theory and Interpretation of IR spectra ASSIGNED READINGS Introduction to technique 25 (p. 833-834 in lab textbook) Uses of the Infrared Spectrum (p. 847-853) Look over pages
Determining the Structure of an Organic Compound
 Determining the Structure of an Organic Compound The analysis of the outcome of a reaction requires that we know the full structure of the products as well as the reactants In the 19 th and early 20 th
Infrared Spectroscopy 紅 外 線 光 譜 儀
 Infrared Spectroscopy 紅 外 線 光 譜 儀 Introduction Spectroscopy is an analytical technique which helps determine structure. It destroys little or no sample (nondestructive method). The amount of light absorbed
Symmetric Stretch: allows molecule to move through space
 BACKGROUND INFORMATION Infrared Spectroscopy Before introducing the subject of IR spectroscopy, we must first review some aspects of the electromagnetic spectrum. The electromagnetic spectrum is composed
for excitation to occur, there must be an exact match between the frequency of the applied radiation and the frequency of the vibration
 ! = 1 2"c k (m + M) m M wavenumbers! =!/c = 1/" wavelength frequency! units: cm 1 for excitation to occur, there must be an exact match between the frequency of the applied radiation and the frequency
Organic Chemistry Tenth Edition
 Organic Chemistry Tenth Edition T. W. Graham Solomons Craig B. Fryhle Welcome to CHM 22 Organic Chemisty II Chapters 2 (IR), 9, 3-20. Chapter 2 and Chapter 9 Spectroscopy (interaction of molecule with
Infrared Spectroscopy
 Infrared Spectroscopy 1 Chap 12 Reactions will often give a mixture of products: OH H 2 SO 4 + Major Minor How would the chemist determine which product was formed? Both are cyclopentenes; they are isomers.
passing through (Y-axis). The peaks are those shown at frequencies when less than
. The peaks are those shown at frequencies when less than") Infrared Spectroscopy used to analyze the presence of functional groups (bond types) in organic molecules The process for this analysis is two-fold: 1. Accurate analysis of infrared spectra to determine
Infrared Spectroscopy used to analyze the presence of functional groups (bond types) in organic molecules The process for this analysis is two-fold: 1. Accurate analysis of infrared spectra to determine
Infrared Spectroscopy: Theory
 u Chapter 15 Infrared Spectroscopy: Theory An important tool of the organic chemist is Infrared Spectroscopy, or IR. IR spectra are acquired on a special instrument, called an IR spectrometer. IR is used
DETERMINACIÓN DE ESTRUCTURAS ORGÁNICAS (ORGANIC SPECTROSCOPY) IR SPECTROSCOPY
 IR SPECTROSCOPY") DETERMINACIÓN DE ESTRUCTURAS ORGÁNICAS (ORGANIC SPECTROSCOPY) IR SPECTROSCOPY Hermenegildo García Gómez Departamento de Química Instituto de Tecnología Química Universidad Politécnica de Valencia 46022
DETERMINACIÓN DE ESTRUCTURAS ORGÁNICAS (ORGANIC SPECTROSCOPY) IR SPECTROSCOPY Hermenegildo García Gómez Departamento de Química Instituto de Tecnología Química Universidad Politécnica de Valencia 46022
CHEM 51LB EXP 1 SPECTROSCOPIC METHODS: INFRARED AND NUCLEAR MAGNETIC RESONANCE SPECTROSCOPY
 CHEM 51LB EXP 1 SPECTRSCPIC METHDS: INFRARED AND NUCLEAR MAGNETIC RESNANCE SPECTRSCPY REACTINS: None TECHNIQUES: IR Spectroscopy, NMR Spectroscopy Infrared (IR) and nuclear magnetic resonance (NMR) spectroscopy
13C NMR Spectroscopy
 13 C NMR Spectroscopy Introduction Nuclear magnetic resonance spectroscopy (NMR) is the most powerful tool available for structural determination. A nucleus with an odd number of protons, an odd number
For example: (Example is from page 50 of the Thinkbook)
") SOLVING COMBINED SPECTROSCOPY PROBLEMS: Lecture Supplement: page 50-53 in Thinkbook CFQ s and PP s: page 216 241 in Thinkbook Introduction: The structure of an unknown molecule can be determined using
SOLVING COMBINED SPECTROSCOPY PROBLEMS: Lecture Supplement: page 50-53 in Thinkbook CFQ s and PP s: page 216 241 in Thinkbook Introduction: The structure of an unknown molecule can be determined using
Typical Infrared Absorption Frequencies. Functional Class Range (nm) Intensity Assignment Range (nm) Intensity Assignment
 Intensity Assignment Range (nm) Intensity Assignment") Typical Infrared Absorption Frequencies Functional Class Range (nm) Intensity Assignment Range (nm) Intensity Assignment Alkanes 2850-3000 CH 3, CH 2 & CH 2 or 3 bands Alkenes 3020-3100 1630-1680 1900-2000
Typical Infrared Absorption Frequencies Functional Class Range (nm) Intensity Assignment Range (nm) Intensity Assignment Alkanes 2850-3000 CH 3, CH 2 & CH 2 or 3 bands Alkenes 3020-3100 1630-1680 1900-2000
Chapter 13 Spectroscopy NMR, IR, MS, UV-Vis
 Chapter 13 Spectroscopy NMR, IR, MS, UV-Vis Main points of the chapter 1. Hydrogen Nuclear Magnetic Resonance a. Splitting or coupling (what s next to what) b. Chemical shifts (what type is it) c. Integration
Application Note AN4
 TAKING INVENTIVE STEPS IN INFRARED. MINIATURE INFRARED GAS SENSORS GOLD SERIES UK Patent App. No. 2372099A USA Patent App. No. 09/783,711 World Patents Pending INFRARED SPECTROSCOPY Application Note AN4
electron does not become part of the compound; one electron goes in but two electrons come out.
 Characterization Techniques for Organic Compounds. When we run a reaction in the laboratory or when we isolate a compound from nature, one of our first tasks is to identify the compound that we have obtained.
Ultraviolet Spectroscopy
 Ultraviolet Spectroscopy The wavelength of UV and visible light are substantially shorter than the wavelength of infrared radiation. The UV spectrum ranges from 100 to 400 nm. A UV-Vis spectrophotometer
HOMEWORK PROBLEMS: IR SPECTROSCOPY AND 13C NMR. The peak at 1720 indicates a C=O bond (carbonyl). One possibility is acetone:
. One possibility is acetone:") HMEWRK PRBLEMS: IR SPECTRSCPY AND 13C NMR 1. You find a bottle on the shelf only labeled C 3 H 6. You take an IR spectrum of the compound and find major peaks at 2950, 1720, and 1400 cm -1. Draw a molecule
HMEWRK PRBLEMS: IR SPECTRSCPY AND 13C NMR 1. You find a bottle on the shelf only labeled C 3 H 6. You take an IR spectrum of the compound and find major peaks at 2950, 1720, and 1400 cm -1. Draw a molecule
Experiment 11. Infrared Spectroscopy
 Chem 22 Spring 2010 Experiment 11 Infrared Spectroscopy Pre-lab preparation. (1) In Ch 5 and 12 of the text you will find examples of the most common functional groups in organic molecules. In your notebook,
MOLECULAR REPRESENTATIONS AND INFRARED SPECTROSCOPY
 MLEULAR REPRESENTATINS AND INFRARED SPETRSPY A STUDENT SULD BE ABLE T: 1. Given a Lewis (dash or dot), condensed, bond-line, or wedge formula of a compound draw the other representations. 2. Give examples
Organic Spectroscopy. UV - Ultraviolet-Visible Spectroscopy. !! 200-800 nm. Methods for structure determination of organic compounds:
 Organic Spectroscopy Methods for structure determination of organic compounds: X-ray rystallography rystall structures Mass spectroscopy Molecular formula -----------------------------------------------------------------------------
Determination of Molecular Structure by MOLECULAR SPECTROSCOPY
 Determination of Molecular Structure by MOLEULAR SPETROSOPY hemistry 3 B.Z. Shakhashiri Fall 29 Much of what we know about molecular structure has been learned by observing and analyzing how electromagnetic
12.4 FUNCTIONAL-GROUP INFRARED ABSORPTIONS
 552 APTER 12 INTRODUTION TO SPETROSOPY. INFRARED SPETROSOPY AND MASS SPETROMETRY PROBLEM 12.9 Which of the following vibrations should be infrared-active and which should be infrared-inactive (or nearly
How to Interpret an IR Spectrum
 How to Interpret an IR Spectrum Don t be overwhelmed when you first view IR spectra or this document. We have simplified the interpretation by having you only focus on 4/5 regions of the spectrum. Do not
IR Applied to Isomer Analysis
 DiscovIR-LC TM Application Note 025 April 2008 Deposition and Detection System IR Applied to Isomer Analysis Infrared spectra provide valuable information about local configurations of atoms in molecules.
Organic Spectroscopy
 1 Organic Spectroscopy Second Year, Michaelmas term, 8 lectures: Dr TDW Claridge & Prof BG Davis Lectures 1 4 highlight the importance of spectroscopic methods in the structural elucidation of organic
The Fundamentals of Infrared Spectroscopy. Joe Van Gompel, PhD
 TN-100 The Fundamentals of Infrared Spectroscopy The Principles of Infrared Spectroscopy Joe Van Gompel, PhD Spectroscopy is the study of the interaction of electromagnetic radiation with matter. The electromagnetic
How to Quickly Solve Spectrometry Problems
 How to Quickly Solve Spectrometry Problems You should be looking for: Mass Spectrometry (MS) Chemical Formula DBE Infrared Spectroscopy (IR) Important Functional Groups o Alcohol O-H o Carboxylic Acid
Suggested solutions for Chapter 3
 s for Chapter PRBLEM Assuming that the molecular ion is the base peak (00% abundance) what peaks would appear in the mass spectrum of each of these molecules: (a) C5Br (b) C60 (c) C64Br In cases (a) and
The Four Questions to Ask While Interpreting Spectra. 1. How many different environments are there?
 1 H NMR Spectroscopy (#1c) The technique of 1 H NMR spectroscopy is central to organic chemistry and other fields involving analysis of organic chemicals, such as forensics and environmental science. It
where h = 6.62 10-34 J s
 Electromagnetic Spectrum: Refer to Figure 12.1 Molecular Spectroscopy: Absorption of electromagnetic radiation: The absorptions and emissions of electromagnetic radiation are related molecular-level phenomena
CHEM 51LB: EXPERIMENT 5 SPECTROSCOPIC METHODS: INFRARED AND NUCLEAR MAGNETIC RESONANCE SPECTROSCOPY
 CHEM 51LB: EXPERIMENT 5 SPECTROSCOPIC METHODS: INFRARED AND NUCLEAR MAGNETIC RESONANCE SPECTROSCOPY REACTIONS: None TECHNIQUES: IR, NMR Infrared (IR) and nuclear magnetic resonance (NMR) spectroscopy are
Proton Nuclear Magnetic Resonance Spectroscopy
 Proton Nuclear Magnetic Resonance Spectroscopy Introduction: The NMR Spectrum serves as a great resource in determining the structure of an organic compound by revealing the hydrogen and carbon skeleton.
PROTON NUCLEAR MAGNETIC RESONANCE SPECTROSCOPY (H-NMR)
") PROTON NUCLEAR MAGNETIC RESONANCE SPECTROSCOPY (H-NMR) WHAT IS H-NMR SPECTROSCOPY? References: Bruice 14.1, 14.2 Introduction NMR or nuclear magnetic resonance spectroscopy is a technique used to determine
PROTON NUCLEAR MAGNETIC RESONANCE SPECTROSCOPY (H-NMR) WHAT IS H-NMR SPECTROSCOPY? References: Bruice 14.1, 14.2 Introduction NMR or nuclear magnetic resonance spectroscopy is a technique used to determine
Solving Spectroscopy Problems
 Solving Spectroscopy Problems The following is a detailed summary on how to solve spectroscopy problems, key terms are highlighted in bold and the definitions are from the illustrated glossary on Dr. Hardinger
MULTIPLE CHOICE. Choose the one alternative that best completes the statement or answers the question.
 Exam Name 1) Which compound would be expected to show intense IR absorption at 3300 cm-1? A) butane B) CH3CH2C CH C)CH3C CCH3 D) but-1-ene 1) 2) Which compound would be expected to show intense IR absorption
Nuclear Magnetic Resonance Spectroscopy
 Nuclear Magnetic Resonance Spectroscopy Introduction NMR is the most powerful tool available for organic structure determination. It is used to study a wide variety of nuclei: 1 H 13 C 15 N 19 F 31 P 2
0 10 20 30 40 50 60 70 m/z
 Mass spectrum for the ionization of acetone MS of Acetone + Relative Abundance CH 3 H 3 C O + M 15 (loss of methyl) + O H 3 C CH 3 43 58 0 10 20 30 40 50 60 70 m/z It is difficult to identify the ions
Nuclear Magnetic Resonance Spectroscopy
 Nuclear Magnetic Resonance Spectroscopy Nuclear magnetic resonance spectroscopy is a powerful analytical technique used to characterize organic molecules by identifying carbonhydrogen frameworks within
Mass Spec - Fragmentation
 Mass Spec - Fragmentation An extremely useful result of EI ionization in particular is a phenomenon known as fragmentation. The radical cation that is produced when an electron is knocked out of a neutral
Time out states and transitions
 Time out states and transitions Spectroscopy transitions between energy states of a molecule excited by absorption or emission of a photon hn = DE = E i - E f Energy levels due to interactions between
Molecular Models Experiment #1
 Molecular Models Experiment #1 Objective: To become familiar with the 3-dimensional structure of organic molecules, especially the tetrahedral structure of alkyl carbon atoms and the planar structure of
EXPERIMENT 1: Survival Organic Chemistry: Molecular Models
 EXPERIMENT 1: Survival Organic Chemistry: Molecular Models Introduction: The goal in this laboratory experience is for you to easily and quickly move between empirical formulas, molecular formulas, condensed
Chapter 4 Lecture Notes
 Chapter 4 Lecture Notes Chapter 4 Educational Goals 1. Given the formula of a molecule, the student will be able to draw the line-bond (Lewis) structure. 2. Understand and construct condensed structural
Used to determine relative location of atoms within a molecule Most helpful spectroscopic technique in organic chemistry Related to MRI in medicine
 Structure Determination: Nuclear Magnetic Resonance CHEM 241 UNIT 5C 1 The Use of NMR Spectroscopy Used to determine relative location of atoms within a molecule Most helpful spectroscopic technique in
E35 SPECTROSCOPIC TECHNIQUES IN ORGANIC CHEMISTRY
 E35 SPECTRSCPIC TECNIQUES IN RGANIC CEMISTRY TE TASK To use mass spectrometry and IR, UV/vis and NMR spectroscopy to identify organic compounds. TE SKILLS By the end of the experiment you should be able
ANALYSIS OF ASPIRIN INFRARED (IR) SPECTROSCOPY AND MELTING POINT DETERMINATION
 SPECTROSCOPY AND MELTING POINT DETERMINATION") Chem 306 Section (Circle) M Tu W Th Name Partners Date ANALYSIS OF ASPIRIN INFRARED (IR) SPECTROSCOPY AND MELTING POINT DETERMINATION Materials: prepared acetylsalicylic acid (aspirin), stockroom samples
Chem 306 Section (Circle) M Tu W Th Name Partners Date ANALYSIS OF ASPIRIN INFRARED (IR) SPECTROSCOPY AND MELTING POINT DETERMINATION Materials: prepared acetylsalicylic acid (aspirin), stockroom samples
Survival Organic Chemistry Part I: Molecular Models
 Survival Organic Chemistry Part I: Molecular Models The goal in this laboratory experience is to get you so you can easily and quickly move between empirical formulas, molecular formulas, condensed formulas,
Background A nucleus with an odd atomic number or an odd mass number has a nuclear spin that can be observed by NMR spectrometers.
 NMR Spectroscopy I Reading: Wade chapter, sections -- -7 Study Problems: -, -7 Key oncepts and Skills: Given an structure, determine which protons are equivalent and which are nonequivalent, predict the
Proton Nuclear Magnetic Resonance ( 1 H-NMR) Spectroscopy
 Spectroscopy") Proton Nuclear Magnetic Resonance ( 1 H-NMR) Spectroscopy Theory behind NMR: In the late 1940 s, physical chemists originally developed NMR spectroscopy to study different properties of atomic nuclei,
Proton Nuclear Magnetic Resonance ( 1 H-NMR) Spectroscopy Theory behind NMR: In the late 1940 s, physical chemists originally developed NMR spectroscopy to study different properties of atomic nuclei,
Nuclear Magnetic Resonance
 Nuclear Magnetic Resonance NMR is probably the most useful and powerful technique for identifying and characterizing organic compounds. Felix Bloch and Edward Mills Purcell were awarded the 1952 Nobel
Chapter 16: Infrared Spectroscopy
 Where relevant, each IR spectrum will include the corresponding molecular structure. Chapter 16: Infrared Spectroscopy 16.1 Why Should I Study This? Spectroscopy is the study of the interaction of energy
Chapter 11 Structure Determination: Nuclear Magnetic Resonance Spectroscopy. Nuclear Magnetic Resonance Spectroscopy. 11.1 Nuclear Magnetic Resonance
 John E. McMurry http://www.cengage.com/chemistry/mcmurry Chapter 11 Structure Determination: Nuclear Magnetic Resonance Spectroscopy 11.1 Nuclear Magnetic Resonance Spectroscopy Many atomic nuclei behave
Chapter 5 Classification of Organic Compounds by Solubility
 Chapter 5 Classification of Organic Compounds by Solubility Deductions based upon interpretation of simple solubility tests can be extremely useful in organic structure determination. Both solubility and
UV-Visible Spectroscopy
 UV-Visible Spectroscopy UV-Visible Spectroscopy What is UV-Visible Spectroscopy? Molecular spectroscopy that involves study of the interaction of Ultra violet (UV)-Visible radiation with molecules What
Unit Vocabulary: o Organic Acid o Alcohol. o Ester o Ether. o Amine o Aldehyde
 Unit Vocabulary: Addition rxn Esterification Polymer Alcohol Ether Polymerization Aldehyde Fermentation Primary Alkane Functional group Saponification Alkene Halide (halocarbon) Saturated hydrocarbon Alkyne
Nuclear Magnetic Resonance notes
 Reminder: These notes are meant to supplement, not replace, the laboratory manual. Nuclear Magnetic Resonance notes Nuclear Magnetic Resonance (NMR) is a spectrometric technique which provides information
Chapter 5 Organic Spectrometry
 Chapter 5 Organic Spectrometry from Organic Chemistry by Robert C. Neuman, Jr. Professor of Chemistry, emeritus University of California, Riverside orgchembyneuman@yahoo.com
Unit 2 Review: Answers: Review for Organic Chemistry Unit Test
 Unit 2 Review: Answers: Review for Organic Chemistry Unit Test 2. Write the IUPAC names for the following organic molecules: a) acetone: propanone d) acetylene: ethyne b) acetic acid: ethanoic acid e)
Organic Functional Groups Chapter 7. Alcohols, Ethers and More
 Organic Functional Groups Chapter 7 Alcohols, Ethers and More 1 What do you do when you are in Pain? What do you do when you are in a lot of pain? 2 Functional Groups A functional group is an atom, groups
18 electron rule : How to count electrons
 18 electron rule : How to count electrons The rule states that thermodynamically stable transition metal organometallic compounds are formed when the sum of the metal d electrons and the electrons conventionally
4/18/2011. 9.8 Substituent Effects in Electrophilic Substitutions. Substituent Effects in Electrophilic Substitutions
 9.8 Substituent effects in the electrophilic substitution of an aromatic ring Substituents affect the reactivity of the aromatic ring Some substituents activate the ring, making it more reactive than benzene
IR Summary - All numerical values in the tables below are given in wavenumbers, cm -1
 Spectroscopy Data Tables Infrared Tables (short summary of common absorption frequencies) The values given in the tables that follow are typical values. Specific bands may fall over a range of wavenumbers,
Identification of Unknown Organic Compounds
 Identification of Unknown Organic Compounds Introduction The identification and characterization of the structures of unknown substances are an important part of organic chemistry. Although it is often
Module 3 : Molecular Spectroscopy Lecture 13 : Rotational and Vibrational Spectroscopy
 Module 3 : Molecular Spectroscopy Lecture 13 : Rotational and Vibrational Spectroscopy Objectives After studying this lecture, you will be able to Calculate the bond lengths of diatomics from the value
Molecular Formula Determination
 Molecular Formula Determination Classical Approach Qualitative elemental analysis Quantitative elemental analysis Determination of empirical formula Molecular weight determination Molecular formula determination
Chemistry 1110 Organic Chemistry IUPAC Nomenclature
 hemistry 1110 rganic hemistry IUPA Nomenclature 1 f the approximately 32 million unique chemical compounds presently known, over 95% of them can be classified as organic; i.e., containing carbon. The IUPA
NMR SPECTROSCOPY A N I N T R O D U C T I O N T O... Self-study booklet NUCLEAR MAGNETIC RESONANCE. 4 3 2 1 0 δ PUBLISHING
 A N I N T R O D U T I O N T O... NMR SPETROSOPY NULEAR MAGNETI RESONANE 4 3 1 0 δ Self-study booklet PUBLISING NMR Spectroscopy NULEAR MAGNETI RESONANE SPETROSOPY Origin of Spectra Theory All nuclei possess
Chapter 2 Polar Covalent Bonds; Acids and Bases
 John E. McMurry http://www.cengage.com/chemistry/mcmurry Chapter 2 Polar Covalent Bonds; Acids and Bases Javier E. Horta, M.D., Ph.D. University of Massachusetts Lowell Polar Covalent Bonds: Electronegativity
Determination of Equilibrium Constants using NMR Spectrscopy
 CHEM 331L Physical Chemistry Laboratory Revision 1.0 Determination of Equilibrium Constants using NMR Spectrscopy In this laboratory exercise we will measure a chemical equilibrium constant using key proton
MULTIPLE CHOICE. Choose the one alternative that best completes the statement or answers the question.
 Ch14_PT MULTIPLE CHOICE. Choose the one alternative that best completes the statement or answers the question. 1) Compounds with the -OH group attached to a saturated alkane-like carbon are known as A)
Organic Spectroscopy: a Primer
 EM 03 rganic Spectroscopy: a Primer INDEX A. Introduction B. Infrared (IR) Spectroscopy 3. Proton Nuclear Magnetic Resonance ( NMR) Spectroscopy A. Introduction The problem of determining the structure
2. Molecular stucture/basic
 2. Molecular stucture/basic spectroscopy The electromagnetic spectrum Spectral region for atomic and molecular spectroscopy E. Hecht (2nd Ed.) Optics, Addison-Wesley Publishing Company,1987 Spectral regions
4. It is possible to excite, or flip the nuclear magnetic vector from the α-state to the β-state by bridging the energy gap between the two. This is a
 BASIC PRINCIPLES INTRODUCTION TO NUCLEAR MAGNETIC RESONANCE (NMR) 1. The nuclei of certain atoms with odd atomic number, and/or odd mass behave as spinning charges. The nucleus is the center of positive
Chapter 5. IR Spectroscopy and Raman Scattering
 PDF File: (Click to Down Load): Chapter5.pdf Polymer Analysis = Back to TOC = To Syllabus Chapter 5. IR Spectroscopy and Raman Scattering (Chapter 5 Campbell & White). Bristol University IR Spectroscopy
Health Science Chemistry I CHEM-1180 Experiment No. 15 Molecular Models (Revised 05/22/2015)
") (Revised 05/22/2015) Introduction In the early 1900s, the chemist G. N. Lewis proposed that bonds between atoms consist of two electrons apiece and that most atoms are able to accommodate eight electrons
(Revised 05/22/2015) Introduction In the early 1900s, the chemist G. N. Lewis proposed that bonds between atoms consist of two electrons apiece and that most atoms are able to accommodate eight electrons
Proton Nuclear Magnetic Resonance Spectroscopy
 CHEM 334L Organic Chemistry Laboratory Revision 2.0 Proton Nuclear Magnetic Resonance Spectroscopy In this laboratory exercise we will learn how to use the Chemistry Department's Nuclear Magnetic Resonance
AROMATIC COMPOUNDS A STUDENT SHOULD BE ABLE TO:
 A STUDENT SHULD BE ABLE T: ARMATIC CMPUNDS 1. Name benzene derivatives given the structures, and draw the structures given the names. This includes: Monosubstituted benzenes named as derivatives of benzene:
NOMENCLATURE OF ORGANIC COMPOUNDS 2010, 2003, 1980, by David A. Katz. All rights reserved.
 NMENCLATURE F RGANIC CMPUNDS 2010, 2003, 1980, by David A. Katz. All rights reserved. rganic chemistry is the chemistry of carbon compounds. Carbon has the ability to bond with itself to form long chains
CHE334 Identification of an Unknown Compound By NMR/IR/MS
 CHE334 Identification of an Unknown Compound By NMR/IR/MS Purpose The object of this experiment is to determine the structure of an unknown compound using IR, 1 H-NMR, 13 C-NMR and Mass spectroscopy. Infrared
Raman Scattering Theory David W. Hahn Department of Mechanical and Aerospace Engineering University of Florida (dwhahn@ufl.edu)
") Introduction Raman Scattering Theory David W. Hahn Department of Mechanical and Aerospace Engineering University of Florida (dwhahn@ufl.edu) The scattering of light may be thought of as the redirection
Introduction Raman Scattering Theory David W. Hahn Department of Mechanical and Aerospace Engineering University of Florida (dwhahn@ufl.edu) The scattering of light may be thought of as the redirection
NMR Spectroscopy of Aromatic Compounds (#1e)
") NMR Spectroscopy of Aromatic Compounds (#1e) 1 H NMR Spectroscopy of Aromatic Compounds Erich Hückel s study of aromaticity in the 1930s produced a set of rules for determining whether a compound is aromatic.
NMR Spectroscopy of Aromatic Compounds (#1e) 1 H NMR Spectroscopy of Aromatic Compounds Erich Hückel s study of aromaticity in the 1930s produced a set of rules for determining whether a compound is aromatic.
Chapter 3. Infrared Spectrophotometry
 Chapter 3 Infrared Spectrophotometry n = wavenumbers (cm -1 ) n = The units used on IR spectrum WAVENUMBERS ( n ) 1 l (cm) n = frequency = nc or l = wavelength (cm) c = speed of light c = 3 x 10 10 cm/sec
Page 1. 6. Which hydrocarbon is a member of the alkane series? (1) 1. Which is the structural formula of methane? (1) (2) (2) (3) (3) (4) (4)
 1. Which is the structural formula of methane? (1) (2) (2) (3) (3) (4) (4)") 1. Which is the structural formula of methane? 6. Which hydrocarbon is a member of the alkane series? 7. How many carbon atoms are contained in an ethyl group? 1 3 2 4 2. In the alkane series, each molecule
1. Which is the structural formula of methane? 6. Which hydrocarbon is a member of the alkane series? 7. How many carbon atoms are contained in an ethyl group? 1 3 2 4 2. In the alkane series, each molecule
Spectrophotometry and the Beer-Lambert Law: An Important Analytical Technique in Chemistry
 Spectrophotometry and the Beer-Lambert Law: An Important Analytical Technique in Chemistry Jon H. Hardesty, PhD and Bassam Attili, PhD Collin College Department of Chemistry Introduction: In the last lab
Chapter 12 Organic Compounds with Oxygen and Sulfur
 Chapter 12 Organic Compounds with Oxygen and Sulfur 1 Alcohols An alcohol contains a hydroxyl group ( OH) that replaces a hydrogen atom in a hydrocarbon. A phenol contains a hydroxyl group ( OH) attached
Assessment Schedule 2013 Chemistry: Demonstrate understanding of the properties of organic compounds (91391)
") NCEA Level 3 Chemistry (91391) 2013 page 1 of 8 Assessment Schedule 2013 Chemistry: Demonstrate understanding of the properties of organic compounds (91391) Evidence Statement Q Evidence Achievement Achievement
NCEA Level 3 Chemistry (91391) 2013 page 1 of 8 Assessment Schedule 2013 Chemistry: Demonstrate understanding of the properties of organic compounds (91391) Evidence Statement Q Evidence Achievement Achievement
Acids and Bases. but we will use the term Lewis acid to denote only those acids to which a bond can be made without breaking another bond
 Acids and Bases. Brønsted acids are proton donors, and Brønsted bases are proton acceptors. Examples of Brønsted acids: HCl, HBr, H 2 SO 4, HOH, H 3 O +, + NH 4, NH 3, CH 3 CO 2 H, H CH 2 COCH 3, H C CH,
Chapter 13 Organic Chemistry
 Chapter 13 Organic Chemistry 13-1. Carbon Bonds 13-2. Alkanes 13-3. Petroleum Products 13-4. Structural Formulas 13-5. Isomers 13-6. Unsaturated Hydrocarbons 13-7. Benzene 13-8. Hydrocarbon Groups 13-9.
CHAPTER 6 Chemical Bonding
 CHAPTER 6 Chemical Bonding SECTION 1 Introduction to Chemical Bonding OBJECTIVES 1. Define Chemical bond. 2. Explain why most atoms form chemical bonds. 3. Describe ionic and covalent bonding.. 4. Explain
Question Bank Organic Chemistry-I
 Question Bank Organic Chemistry-I 1. (a) What do you understand by the following terms : (i) Organic chemistry (ii) Organic compounds (iii) Catenation? [3] (b) Why are there very large number of organic
UV-Vis Vis spectroscopy. Electronic absorption spectroscopy
 UV-Vis Vis spectroscopy Electronic absorption spectroscopy Absortpion spectroscopy Provide information about presence and absence of unsaturated functional groups Useful adjunct to IR Determination of
Nuclear Magnetic Resonance Spectroscopy
 Chapter 8 Nuclear Magnetic Resonance Spectroscopy http://www.yteach.co.uk/page.php/resources/view_all?id=nuclear_magnetic _resonance_nmr_spectroscopy_spin_spectrometer_spectrum_proton_t_pag e_5&from=search
6. 3. Molecular spectroscopy. Unit 6: Physical chemistry of spectroscopy, surfaces and chemical and phase equilibria
 6. 3 Molecular spectroscopy Spectroscopy in its various forms is a technique with wide applications across many disciplines. From qualitative analysis in toxicology through to quantitative measurements
Acids and Bases: Molecular Structure and Acidity
 Acids and Bases: Molecular Structure and Acidity Review the Acids and Bases Vocabulary List as needed. Tutorial Contents A. Introduction B. Resonance C. Atomic Radius D. Electronegativity E. Inductive
Experiment #5: Qualitative Absorption Spectroscopy
 Experiment #5: Qualitative Absorption Spectroscopy One of the most important areas in the field of analytical chemistry is that of spectroscopy. In general terms, spectroscopy deals with the interactions
Alkanes. Chapter 1.1
 Alkanes Chapter 1.1 Organic Chemistry The study of carbon-containing compounds and their properties What s so special about carbon? Carbon has 4 bonding electrons. Thus, it can form 4 strong covalent bonds
Molecular Spectroscopy
 Molecular Spectroscopy UV-Vis Spectroscopy Absorption Characteristics of Some Common Chromophores UV-Vis Spectroscopy Absorption Characteristics of Aromatic Compounds UV-Vis Spectroscopy Effect of extended
ORGANIC COMPOUNDS IN THREE DIMENSIONS
 (adapted from Blackburn et al., Laboratory Manual to Accompany World of hemistry, 2 nd ed., (1996) Saunders ollege Publishing: Fort Worth) Purpose: To become familiar with organic molecules in three dimensions