Mixed Reviews : An Introduction to Proc Mixed ANNMARIA DE MARS, PH.D. THE JULIA GROUP SANTA MONICA, CA
|
|
|
- Erick Walton
- 7 years ago
- Views:
Transcription
1 Mixed Reviews : An Introduction to Proc Mixed ANNMARIA DE MARS, PH.D. THE JULIA GROUP SANTA MONICA, CA
2 Obligatory naked mole rat slide How to do PROC MIXED, syntax using SAS 9.2 and SAS Enterprise Guide, Interpretation of PROC MIXED results, Differences between PROC MIXED and PROC GLM, Common error messages
3 Statisticians feel free to check your text messages I see a significant R-squared, can I leave now?
4 It s not as hard as it looks Proc mixed, that is
5 In a nutshell For the vast majority of practical cases, PROC MIXED and PROC GLM will give you the same results If you aren t familiar with PROC GLM, the previous statement was of no help whatsoever
6 Baby Steps GLM = General Linear Model Regression Analysis of Variance
7 PROC MIXED and PROC GLM both Are used to predict the values of a numeric dependent variable Assume the dependent variable is normally distributed
8 PROC GLM may be identical to PROC MIXED
9 MIXED MODELS include A mix of FIXED effects and RANDOM effects Seriously, this is key to understanding the whole thing
10 The fixed-effects parameters are associated with known explanatory variables, as in the standard linear model. These variables can be either qualitative (as in the traditional analysis of variance) or quantitative (as in standard linear regression). SAS 9.2 SAS/STAT Users Guide
11 Fixed effect Not a random sample of genders
12 Random effects - schools Well, either type of school, really
13 Why age is not a random effect It s all about the (error)variance
14 Predicting height of a new species Family is a random effect Age is not
15 Why PROC MIXED may not matter It may be that there is not much covariance within schools, sites, etc.
16 How Mixed Models differ Y = ß1* FAM_INC + ß2*SCHOOL +ß3 *IQ + e
17 IID* and homoscedasticity * Independent, identically distributed
18 GLM assumes errors are uncorrelated, homoscedastic and normally distributed In PROC MIXED, errors are not assumed to be uncorrelated
19 That s IT?! You went through this whole thing to say that in PROC GLM errors are assumed to be uncorrelated and in PROC MIXED they re not?
20 How Mixed Models differ Y = ß1* FAM_INC +ß2 *IQ + YZ1 + e But in this case e is no longer assumed to be independent Also, there can be (and usually are) a bunch of gamma effects
21 One last try In the general model PROC GLM we are trying to fit means
22 In the mixed model In addition to means, we are trying to fit covariances. We don t have to worry about that with the general linear model because we have assumed that all the observations are independent and thus there is no covariance.
23 One last statistical point Yes, it is really the last one
24 Crossed versus nested factors Often, in PROC MIXED you ll need to specify if your data are nested
25 Crossed factors: Each level of each factor appears in every other level Marital status and employment
26 Nested factors Subjects are usually NESTED within group. A subject will be either an experimental group or a control group.
27 An example and syntax at last! We want to test for differences between control and experimental groups. We d like to take into account our repeated measures, so when we compare our groups later we can say that any differences are due to our wonderful training.
28 Syntax PROC MIXED DATA = mixed ; CLASS group name pre_post ; MODEL score = group pre_post group*pre_post ; REPEATED pre_post / SUBJECT = name(group) TYPE = cs ; LSMEANS group group*pre_post / adjust = tukey ;
29 Yes. That s IT? Now, for each statement
30 PROC MIXED DATA = mixed ; Okay, that s pretty self-evident
31 CLASS group name pre_post ; Identify your categorical variables in the class statement. This INCLUDES your subject identifier
32 MODEL score = group pre_post group*pre_post ; Model dependent = FIXED EFFECTS ;
33 REPEATED pre_post / SUBJECT = name(group) TYPE = cs ; Specify the variable that is repeated Specify the variable that identifies the subject AND IF IT IS NESTED Subject-identifier (variable it is nested within) You don t have to specify a covariance structure type
34 LSMEANS group group*pre_post / adjust = tukey ; LSMEANS requests the means for the variables and subgroups specified / adjust = requests test of differences between means
35 Output!
36 There were no random effects
37 In this example should be 2 * # of subjects


38 Convergence criteria met
39 Here is the estimate for the covariance due to Name (within subjects), the type of covariance matrix is compound symmetry.
40 Akakike Information Criterion Fit statistics are used to compare models. If I re-ran the model without one of the variables, I could see if the resulting model was better or worse.


41 Is your model better than nothing?

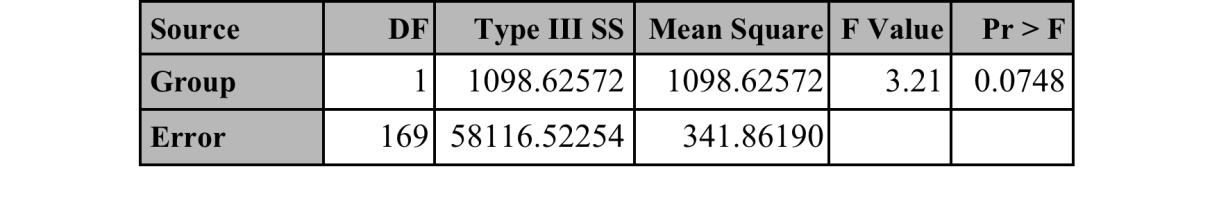
42 Type 3 test of FIXED EFFECTS

43 What hypothesis is being tested? THIS IS REALLY IMPORTANT!!!

44 Test of Mean Differences
45 Compared to PROC GLM NOTE: Dataset is structured differently PROC MIXED multiple observations per subject PROC GLM one observation per subject, with multiple fields for test score
46 GLM MIXED
47 The less than exciting point It is not a very huge difference whether you use PROC GLM or PROC MIXED
48 How about RANDOM effects? Maybe that will be better?
49 Curriculum tested at three sites with pretest and posttest RANDOM effect = school REPEATED = trial

50 At last! More syntax! proc mixed data = mixedr ratio ; class site trial case ; model score = trial ; Random site / subject = case(site); Repeated trial ; lsmeans trial / adjust = tukey ;
51 NOTE Model score = trial ; Only fixed effects on model statement
52 Site is a random effect Random site / subject = case(site); Repeated trial ;

53 We are happy

54
55 Seriously, what difference does it make? Sometimes you can use RANDOM or REPEATED Sometimes RANDOM doesn t matter
56 Random & Repeated Are not the same except when they are. Certain overspecified models can be specified by using a random or repeated statement alone. Unfortunately, one such model is the commonly encountered repeated measures with compound symmetry.
57 Random may not matter Conceptually, you have a random effect if it is sampled from the population of individuals, machines, schools, etc. Statistically, a random effects explains some of the covariance. If there is not any difference among the families/ schools / sites in your sample, the RANDOM statement won t matter.
58 Repeated Measures ANOVA using Proc Mixed With no programming
59 Pre- Post Test Experiment A typical experimental design subjects were either an experimental group or control group. Both groups were given a pre-test and a post-test. You want to test for significance of interaction between group and test. Your hypothesis is that such an interaction exists and the experimental group improved more.
60 What to do & how to do it You could do a mixed model ANOVA It is called mixed because it has two types of effects, fixed and random Your data should be in the format of one record for EACH measurement for each person, i.e., multiple records per person.

61 Select MIXED MODELS task

62 Mixed Model 1. Click on Data 2. Drag ZSCORE under dependent variable 3. Drag NAMEID PRE_POST & GROUP under classification

63 Mixed Model: Continued 1. Select FIXED EFFECTS MODEL 2. Select GROUP & PRE_POST and click on the Main button 3. Select GROUP & PRE_POST at the same time by holding down the shift key and click on the Cross button

64 Mixed Model: Repeated 1. Click on REPEATED EFFECTS 2. Click on the next to Subject Identifier 3. Select NAMEID as the Subject Identifier.

65 Mixed Model: Repeated 1. Click on Name, the NEST button will no longer be grayed out 2. Click on Group 3. Click NEST
66 Mistakes not to make 1. Even though it makes perfect sense to think of the subject identifier as a random effect (which it is) do NOT identify it as a random effect. The random effect is for random effects that are not repeated. In this example, there were no such random effects. 2. Know the difference between crossed & nested effects. Here we have both crossed and nested effects
67 My point!
68 Sorry, but Whether you use REPEATED vs RANDOM, the type of covariance, whether you use PROC GLM vs PROC MIXED. None of it matters a great deal unless your model is borderline. What does matter is if your model is completely WRONG, that is if you leave out the repeated effects, don t realize that subjects are nested within schools
69 So, Chris Rock was wrong. You need to know why*
Chapter 5 Analysis of variance SPSS Analysis of variance
 Chapter 5 Analysis of variance SPSS Analysis of variance Data file used: gss.sav How to get there: Analyze Compare Means One-way ANOVA To test the null hypothesis that several population means are equal,
Introduction to Fixed Effects Methods
 Introduction to Fixed Effects Methods 1 1.1 The Promise of Fixed Effects for Nonexperimental Research... 1 1.2 The Paired-Comparisons t-test as a Fixed Effects Method... 2 1.3 Costs and Benefits of Fixed
Descriptive Statistics
 Descriptive Statistics Primer Descriptive statistics Central tendency Variation Relative position Relationships Calculating descriptive statistics Descriptive Statistics Purpose to describe or summarize
Can SAS Enterprise Guide do all of that, with no programming required? Yes, it can.
 SAS Enterprise Guide for Educational Researchers: Data Import to Publication without Programming AnnMaria De Mars, University of Southern California, Los Angeles, CA ABSTRACT In this workshop, participants
Introduction to proc glm
 Lab 7: Proc GLM and one-way ANOVA STT 422: Summer, 2004 Vince Melfi SAS has several procedures for analysis of variance models, including proc anova, proc glm, proc varcomp, and proc mixed. We mainly will
Model Fitting in PROC GENMOD Jean G. Orelien, Analytical Sciences, Inc.
 Paper 264-26 Model Fitting in PROC GENMOD Jean G. Orelien, Analytical Sciences, Inc. Abstract: There are several procedures in the SAS System for statistical modeling. Most statisticians who use the SAS
Introduction to Longitudinal Data Analysis
 Introduction to Longitudinal Data Analysis Longitudinal Data Analysis Workshop Section 1 University of Georgia: Institute for Interdisciplinary Research in Education and Human Development Section 1: Introduction
Analyzing Intervention Effects: Multilevel & Other Approaches. Simplest Intervention Design. Better Design: Have Pretest
 Analyzing Intervention Effects: Multilevel & Other Approaches Joop Hox Methodology & Statistics, Utrecht Simplest Intervention Design R X Y E Random assignment Experimental + Control group Analysis: t
Chapter 1 Introduction. 1.1 Introduction
 Chapter 1 Introduction 1.1 Introduction 1 1.2 What Is a Monte Carlo Study? 2 1.2.1 Simulating the Rolling of Two Dice 2 1.3 Why Is Monte Carlo Simulation Often Necessary? 4 1.4 What Are Some Typical Situations
A Primer on Mathematical Statistics and Univariate Distributions; The Normal Distribution; The GLM with the Normal Distribution
 A Primer on Mathematical Statistics and Univariate Distributions; The Normal Distribution; The GLM with the Normal Distribution PSYC 943 (930): Fundamentals of Multivariate Modeling Lecture 4: September
Introduction to Data Analysis in Hierarchical Linear Models
 Introduction to Data Analysis in Hierarchical Linear Models April 20, 2007 Noah Shamosh & Frank Farach Social Sciences StatLab Yale University Scope & Prerequisites Strong applied emphasis Focus on HLM
Statistics Review PSY379
 Statistics Review PSY379 Basic concepts Measurement scales Populations vs. samples Continuous vs. discrete variable Independent vs. dependent variable Descriptive vs. inferential stats Common analyses
Session 7 Bivariate Data and Analysis
 Session 7 Bivariate Data and Analysis Key Terms for This Session Previously Introduced mean standard deviation New in This Session association bivariate analysis contingency table co-variation least squares
Additional sources Compilation of sources: http://lrs.ed.uiuc.edu/tseportal/datacollectionmethodologies/jin-tselink/tselink.htm
 Mgt 540 Research Methods Data Analysis 1 Additional sources Compilation of sources: http://lrs.ed.uiuc.edu/tseportal/datacollectionmethodologies/jin-tselink/tselink.htm http://web.utk.edu/~dap/random/order/start.htm
Testing and Interpreting Interactions in Regression In a Nutshell
 Testing and Interpreting Interactions in Regression In a Nutshell The principles given here always apply when interpreting the coefficients in a multiple regression analysis containing interactions. However,
Research Methods & Experimental Design
 Research Methods & Experimental Design 16.422 Human Supervisory Control April 2004 Research Methods Qualitative vs. quantitative Understanding the relationship between objectives (research question) and
HYPOTHESIS TESTING: CONFIDENCE INTERVALS, T-TESTS, ANOVAS, AND REGRESSION
 HYPOTHESIS TESTING: CONFIDENCE INTERVALS, T-TESTS, ANOVAS, AND REGRESSION HOD 2990 10 November 2010 Lecture Background This is a lightning speed summary of introductory statistical methods for senior undergraduate
Binary Logistic Regression
 Binary Logistic Regression Main Effects Model Logistic regression will accept quantitative, binary or categorical predictors and will code the latter two in various ways. Here s a simple model including
MISSING DATA TECHNIQUES WITH SAS. IDRE Statistical Consulting Group
 MISSING DATA TECHNIQUES WITH SAS IDRE Statistical Consulting Group ROAD MAP FOR TODAY To discuss: 1. Commonly used techniques for handling missing data, focusing on multiple imputation 2. Issues that could
Quantitative Research: Reliability and Validity
 Quantitative Research: Reliability and Validity Reliability Definition: Reliability is the consistency of your measurement, or the degree to which an instrument measures the same way each time it is used
Longitudinal Data Analyses Using Linear Mixed Models in SPSS: Concepts, Procedures and Illustrations
 Research Article TheScientificWorldJOURNAL (2011) 11, 42 76 TSW Child Health & Human Development ISSN 1537-744X; DOI 10.1100/tsw.2011.2 Longitudinal Data Analyses Using Linear Mixed Models in SPSS: Concepts,
I L L I N O I S UNIVERSITY OF ILLINOIS AT URBANA-CHAMPAIGN
 Beckman HLM Reading Group: Questions, Answers and Examples Carolyn J. Anderson Department of Educational Psychology I L L I N O I S UNIVERSITY OF ILLINOIS AT URBANA-CHAMPAIGN Linear Algebra Slide 1 of
Chapter 2 Quantitative, Qualitative, and Mixed Research
 1 Chapter 2 Quantitative, Qualitative, and Mixed Research This chapter is our introduction to the three research methodology paradigms. A paradigm is a perspective based on a set of assumptions, concepts,
SPSS Introduction. Yi Li
 SPSS Introduction Yi Li Note: The report is based on the websites below http://glimo.vub.ac.be/downloads/eng_spss_basic.pdf http://academic.udayton.edu/gregelvers/psy216/spss http://www.nursing.ucdenver.edu/pdf/factoranalysishowto.pdf
SP10 From GLM to GLIMMIX-Which Model to Choose? Patricia B. Cerrito, University of Louisville, Louisville, KY
 SP10 From GLM to GLIMMIX-Which Model to Choose? Patricia B. Cerrito, University of Louisville, Louisville, KY ABSTRACT The purpose of this paper is to investigate several SAS procedures that are used in
Chapter 2: Descriptive Statistics
 Chapter 2: Descriptive Statistics **This chapter corresponds to chapters 2 ( Means to an End ) and 3 ( Vive la Difference ) of your book. What it is: Descriptive statistics are values that describe the
Statistics, Research, & SPSS: The Basics
 Statistics, Research, & SPSS: The Basics SPSS (Statistical Package for the Social Sciences) is a software program that makes the calculation and presentation of statistics relatively easy. It is an incredibly
SCHOOL OF HEALTH AND HUMAN SCIENCES DON T FORGET TO RECODE YOUR MISSING VALUES
 SCHOOL OF HEALTH AND HUMAN SCIENCES Using SPSS Topics addressed today: 1. Differences between groups 2. Graphing Use the s4data.sav file for the first part of this session. DON T FORGET TO RECODE YOUR
Module 5: Multiple Regression Analysis
 Using Statistical Data Using to Make Statistical Decisions: Data Multiple to Make Regression Decisions Analysis Page 1 Module 5: Multiple Regression Analysis Tom Ilvento, University of Delaware, College
SAS Software to Fit the Generalized Linear Model
 SAS Software to Fit the Generalized Linear Model Gordon Johnston, SAS Institute Inc., Cary, NC Abstract In recent years, the class of generalized linear models has gained popularity as a statistical modeling
Technical report. in SPSS AN INTRODUCTION TO THE MIXED PROCEDURE
 Linear mixedeffects modeling in SPSS AN INTRODUCTION TO THE MIXED PROCEDURE Table of contents Introduction................................................................3 Data preparation for MIXED...................................................3
Assignments Analysis of Longitudinal data: a multilevel approach
 Assignments Analysis of Longitudinal data: a multilevel approach Frans E.S. Tan Department of Methodology and Statistics University of Maastricht The Netherlands Maastricht, Jan 2007 Correspondence: Frans
Experimental Design and Hypothesis Testing. Rick Balkin, Ph.D.
 Experimental Design and Hypothesis Testing Rick Balkin, Ph.D. 1 Let s s review hypothesis testing and experimental design 3 types of hypothesis testing in experimental research: z-test t-test F-test Balkin,
SUGI 29 Statistics and Data Analysis
 Paper 194-29 Head of the CLASS: Impress your colleagues with a superior understanding of the CLASS statement in PROC LOGISTIC Michelle L. Pritchard and David J. Pasta Ovation Research Group, San Francisco,
Module 3: Correlation and Covariance
 Using Statistical Data to Make Decisions Module 3: Correlation and Covariance Tom Ilvento Dr. Mugdim Pašiƒ University of Delaware Sarajevo Graduate School of Business O ften our interest in data analysis
Consider a study in which. How many subjects? The importance of sample size calculations. An insignificant effect: two possibilities.
 Consider a study in which How many subjects? The importance of sample size calculations Office of Research Protections Brown Bag Series KB Boomer, Ph.D. Director, boomer@stat.psu.edu A researcher conducts
Moderation. Moderation
 Stats - Moderation Moderation A moderator is a variable that specifies conditions under which a given predictor is related to an outcome. The moderator explains when a DV and IV are related. Moderation
SPSS ADVANCED ANALYSIS WENDIANN SETHI SPRING 2011
 SPSS ADVANCED ANALYSIS WENDIANN SETHI SPRING 2011 Statistical techniques to be covered Explore relationships among variables Correlation Regression/Multiple regression Logistic regression Factor analysis
Multivariate Analysis of Variance (MANOVA)
") Multivariate Analysis of Variance (MANOVA) Aaron French, Marcelo Macedo, John Poulsen, Tyler Waterson and Angela Yu Keywords: MANCOVA, special cases, assumptions, further reading, computations Introduction
Multivariate Analysis of Variance (MANOVA) Aaron French, Marcelo Macedo, John Poulsen, Tyler Waterson and Angela Yu Keywords: MANCOVA, special cases, assumptions, further reading, computations Introduction
Chapter 7 Factor Analysis SPSS
 Chapter 7 Factor Analysis SPSS Factor analysis attempts to identify underlying variables, or factors, that explain the pattern of correlations within a set of observed variables. Factor analysis is often
II. DISTRIBUTIONS distribution normal distribution. standard scores
 Appendix D Basic Measurement And Statistics The following information was developed by Steven Rothke, PhD, Department of Psychology, Rehabilitation Institute of Chicago (RIC) and expanded by Mary F. Schmidt,
The State of Split Testing Survey Analysis
 The State of Split Testing Survey Analysis Analysed by Parry Malm CEO, Phrasee parry@phrasee.co.uk www.phrasee.co.uk 1 Welcome to the State of Split Testing Email subject line split testing is nothing
Mind on Statistics. Chapter 2
 Mind on Statistics Chapter 2 Sections 2.1 2.3 1. Tallies and cross-tabulations are used to summarize which of these variable types? A. Quantitative B. Mathematical C. Continuous D. Categorical 2. The table
A Study to Predict No Show Probability for a Scheduled Appointment at Free Health Clinic
 A Study to Predict No Show Probability for a Scheduled Appointment at Free Health Clinic Report prepared for Brandon Slama Department of Health Management and Informatics University of Missouri, Columbia
Confidence Intervals on Effect Size David C. Howell University of Vermont
 Confidence Intervals on Effect Size David C. Howell University of Vermont Recent years have seen a large increase in the use of confidence intervals and effect size measures such as Cohen s d in reporting
SPSS Explore procedure
 SPSS Explore procedure One useful function in SPSS is the Explore procedure, which will produce histograms, boxplots, stem-and-leaf plots and extensive descriptive statistics. To run the Explore procedure,
Chapter 15. Mixed Models. 15.1 Overview. A flexible approach to correlated data.
 Chapter 15 Mixed Models A flexible approach to correlated data. 15.1 Overview Correlated data arise frequently in statistical analyses. This may be due to grouping of subjects, e.g., students within classrooms,
Section 14 Simple Linear Regression: Introduction to Least Squares Regression
 Slide 1 Section 14 Simple Linear Regression: Introduction to Least Squares Regression There are several different measures of statistical association used for understanding the quantitative relationship
Post-hoc comparisons & two-way analysis of variance. Two-way ANOVA, II. Post-hoc testing for main effects. Post-hoc testing 9.
 Two-way ANOVA, II Post-hoc comparisons & two-way analysis of variance 9.7 4/9/4 Post-hoc testing As before, you can perform post-hoc tests whenever there s a significant F But don t bother if it s a main
Business Statistics. Successful completion of Introductory and/or Intermediate Algebra courses is recommended before taking Business Statistics.
 Business Course Text Bowerman, Bruce L., Richard T. O'Connell, J. B. Orris, and Dawn C. Porter. Essentials of Business, 2nd edition, McGraw-Hill/Irwin, 2008, ISBN: 978-0-07-331988-9. Required Computing
MATH 13150: Freshman Seminar Unit 10
 MATH 13150: Freshman Seminar Unit 10 1. Relatively prime numbers and Euler s function In this chapter, we are going to discuss when two numbers are relatively prime, and learn how to count the numbers
Correlational Research. Correlational Research. Stephen E. Brock, Ph.D., NCSP EDS 250. Descriptive Research 1. Correlational Research: Scatter Plots
 Correlational Research Stephen E. Brock, Ph.D., NCSP California State University, Sacramento 1 Correlational Research A quantitative methodology used to determine whether, and to what degree, a relationship
This chapter reviews the general issues involving data analysis and introduces
 Research Skills for Psychology Majors: Everything You Need to Know to Get Started Data Preparation With SPSS This chapter reviews the general issues involving data analysis and introduces SPSS, the Statistical
INTRODUCTION TO DATA MINING SAS ENTERPRISE MINER
 INTRODUCTION TO DATA MINING SAS ENTERPRISE MINER Mary-Elizabeth ( M-E ) Eddlestone Principal Systems Engineer, Analytics SAS Customer Loyalty, SAS Institute, Inc. AGENDA Overview/Introduction to Data Mining
10. Analysis of Longitudinal Studies Repeat-measures analysis
 Research Methods II 99 10. Analysis of Longitudinal Studies Repeat-measures analysis This chapter builds on the concepts and methods described in Chapters 7 and 8 of Mother and Child Health: Research methods.
Chapter Seven. Multiple regression An introduction to multiple regression Performing a multiple regression on SPSS
 Chapter Seven Multiple regression An introduction to multiple regression Performing a multiple regression on SPSS Section : An introduction to multiple regression WHAT IS MULTIPLE REGRESSION? Multiple
Concepts of Experimental Design
 Design Institute for Six Sigma A SAS White Paper Table of Contents Introduction...1 Basic Concepts... 1 Designing an Experiment... 2 Write Down Research Problem and Questions... 2 Define Population...
ASSIGNMENT 4 PREDICTIVE MODELING AND GAINS CHARTS
 DATABASE MARKETING Fall 2015, max 24 credits Dead line 15.10. ASSIGNMENT 4 PREDICTIVE MODELING AND GAINS CHARTS PART A Gains chart with excel Prepare a gains chart from the data in \\work\courses\e\27\e20100\ass4b.xls.
Individual Growth Analysis Using PROC MIXED Maribeth Johnson, Medical College of Georgia, Augusta, GA
 Paper P-702 Individual Growth Analysis Using PROC MIXED Maribeth Johnson, Medical College of Georgia, Augusta, GA ABSTRACT Individual growth models are designed for exploring longitudinal data on individuals
VACA: A Tool for Qualitative Video Analysis
 VACA: A Tool for Qualitative Video Analysis Brandon Burr Stanford University 353 Serra Mall, Room 160 Stanford, CA 94305 USA bburr@stanford.edu Abstract In experimental research the job of analyzing data
CHAPTER 14 Understanding an App s Architecture
 CHAPTER 14 Understanding an App s Architecture Figure 14-1. This chapter examines the structure of an app from a programmer s perspective. It begins with the traditional analogy that an app is like a recipe
IBM SPSS Statistics 20 Part 4: Chi-Square and ANOVA
 CALIFORNIA STATE UNIVERSITY, LOS ANGELES INFORMATION TECHNOLOGY SERVICES IBM SPSS Statistics 20 Part 4: Chi-Square and ANOVA Summer 2013, Version 2.0 Table of Contents Introduction...2 Downloading the
Empirical Methods in Applied Economics
 Empirical Methods in Applied Economics Jörn-Ste en Pischke LSE October 2005 1 Observational Studies and Regression 1.1 Conditional Randomization Again When we discussed experiments, we discussed already
Methods for Interaction Detection in Predictive Modeling Using SAS Doug Thompson, PhD, Blue Cross Blue Shield of IL, NM, OK & TX, Chicago, IL
 Paper SA01-2012 Methods for Interaction Detection in Predictive Modeling Using SAS Doug Thompson, PhD, Blue Cross Blue Shield of IL, NM, OK & TX, Chicago, IL ABSTRACT Analysts typically consider combinations
Imputing Missing Data using SAS
 ABSTRACT Paper 3295-2015 Imputing Missing Data using SAS Christopher Yim, California Polytechnic State University, San Luis Obispo Missing data is an unfortunate reality of statistics. However, there are
The Dummy s Guide to Data Analysis Using SPSS
 The Dummy s Guide to Data Analysis Using SPSS Mathematics 57 Scripps College Amy Gamble April, 2001 Amy Gamble 4/30/01 All Rights Rerserved TABLE OF CONTENTS PAGE Helpful Hints for All Tests...1 Tests
Family economics data: total family income, expenditures, debt status for 50 families in two cohorts (A and B), annual records from 1990 1995.
, annual records from 1990 1995.") Lecture 18 1. Random intercepts and slopes 2. Notation for mixed effects models 3. Comparing nested models 4. Multilevel/Hierarchical models 5. SAS versions of R models in Gelman and Hill, chapter 12 1
Lecture 18 1. Random intercepts and slopes 2. Notation for mixed effects models 3. Comparing nested models 4. Multilevel/Hierarchical models 5. SAS versions of R models in Gelman and Hill, chapter 12 1
Course Text. Required Computing Software. Course Description. Course Objectives. StraighterLine. Business Statistics
 Course Text Business Statistics Lind, Douglas A., Marchal, William A. and Samuel A. Wathen. Basic Statistics for Business and Economics, 7th edition, McGraw-Hill/Irwin, 2010, ISBN: 9780077384470 [This
Your Name: Section: 36-201 INTRODUCTION TO STATISTICAL REASONING Computer Lab Exercise #5 Analysis of Time of Death Data for Soldiers in Vietnam
 Your Name: Section: 36-201 INTRODUCTION TO STATISTICAL REASONING Computer Lab Exercise #5 Analysis of Time of Death Data for Soldiers in Vietnam Objectives: 1. To use exploratory data analysis to investigate
COMP6053 lecture: Relationship between two variables: correlation, covariance and r-squared. jn2@ecs.soton.ac.uk
 COMP6053 lecture: Relationship between two variables: correlation, covariance and r-squared jn2@ecs.soton.ac.uk Relationships between variables So far we have looked at ways of characterizing the distribution
Lesson 1: Comparison of Population Means Part c: Comparison of Two- Means
 Lesson : Comparison of Population Means Part c: Comparison of Two- Means Welcome to lesson c. This third lesson of lesson will discuss hypothesis testing for two independent means. Steps in Hypothesis
University of Hull Department of Computer Science. Wrestling with Python Week 01 Playing with Python
 Introduction Welcome to our Python sessions. University of Hull Department of Computer Science Wrestling with Python Week 01 Playing with Python Vsn. 1.0 Rob Miles 2013 Please follow the instructions carefully.
Top Ten Mistakes in the FCE Writing Paper (And How to Avoid Them) By Neil Harris
 By Neil Harris") Top Ten Mistakes in the FCE Writing Paper (And How to Avoid Them) By Neil Harris Top Ten Mistakes in the FCE Writing Paper (And How to Avoid Them) If you re reading this article, you re probably taking
Top Ten Mistakes in the FCE Writing Paper (And How to Avoid Them) By Neil Harris Top Ten Mistakes in the FCE Writing Paper (And How to Avoid Them) If you re reading this article, you re probably taking
Linear Models in STATA and ANOVA
 Session 4 Linear Models in STATA and ANOVA Page Strengths of Linear Relationships 4-2 A Note on Non-Linear Relationships 4-4 Multiple Linear Regression 4-5 Removal of Variables 4-8 Independent Samples
Service courses for graduate students in degree programs other than the MS or PhD programs in Biostatistics.
 Course Catalog In order to be assured that all prerequisites are met, students must acquire a permission number from the education coordinator prior to enrolling in any Biostatistics course. Courses are
The Doctor-Patient Relationship
 The Doctor-Patient Relationship It s important to feel at ease with your doctor. How well you are able to talk with your doctor is a key part of getting the care that s best for you. It s also important
Examining Differences (Comparing Groups) using SPSS Inferential statistics (Part I) Dwayne Devonish
 using SPSS Inferential statistics (Part I) Dwayne Devonish") Examining Differences (Comparing Groups) using SPSS Inferential statistics (Part I) Dwayne Devonish Statistics Statistics are quantitative methods of describing, analysing, and drawing inferences (conclusions)
Examining Differences (Comparing Groups) using SPSS Inferential statistics (Part I) Dwayne Devonish Statistics Statistics are quantitative methods of describing, analysing, and drawing inferences (conclusions)
STATISTICA Formula Guide: Logistic Regression. Table of Contents
 : Table of Contents... 1 Overview of Model... 1 Dispersion... 2 Parameterization... 3 Sigma-Restricted Model... 3 Overparameterized Model... 4 Reference Coding... 4 Model Summary (Summary Tab)... 5 Summary
Microsoft Azure Machine learning Algorithms
 Microsoft Azure Machine learning Algorithms Tomaž KAŠTRUN @tomaz_tsql Tomaz.kastrun@gmail.com http://tomaztsql.wordpress.com Our Sponsors Speaker info https://tomaztsql.wordpress.com Agenda Focus on explanation
Ordinal Regression. Chapter
 Ordinal Regression Chapter 4 Many variables of interest are ordinal. That is, you can rank the values, but the real distance between categories is unknown. Diseases are graded on scales from least severe
Multiple Regression: What Is It?
 Multiple Regression Multiple Regression: What Is It? Multiple regression is a collection of techniques in which there are multiple predictors of varying kinds and a single outcome We are interested in
1 Theory: The General Linear Model
 QMIN GLM Theory - 1.1 1 Theory: The General Linear Model 1.1 Introduction Before digital computers, statistics textbooks spoke of three procedures regression, the analysis of variance (ANOVA), and the
Chapter Eight: Quantitative Methods
 Chapter Eight: Quantitative Methods RESEARCH DESIGN Qualitative, Quantitative, and Mixed Methods Approaches Third Edition John W. Creswell Chapter Outline Defining Surveys and Experiments Components of
Chapter 1: The Nature of Probability and Statistics
 Chapter 1: The Nature of Probability and Statistics Learning Objectives Upon successful completion of Chapter 1, you will have applicable knowledge of the following concepts: Statistics: An Overview and
Data analysis process
 Data analysis process Data collection and preparation Collect data Prepare codebook Set up structure of data Enter data Screen data for errors Exploration of data Descriptive Statistics Graphs Analysis
Getting Performance From Process Improvement
 IT Metrics and Productivity e-newsletter Article Series: Getting Performance From Process Improvement By Michael West Article 3: Improving Performance Through Process Improvement In the first two articles
Linear Mixed-Effects Modeling in SPSS: An Introduction to the MIXED Procedure
 Technical report Linear Mixed-Effects Modeling in SPSS: An Introduction to the MIXED Procedure Table of contents Introduction................................................................ 1 Data preparation
Illustration (and the use of HLM)
") Illustration (and the use of HLM) Chapter 4 1 Measurement Incorporated HLM Workshop The Illustration Data Now we cover the example. In doing so we does the use of the software HLM. In addition, we will
Illustration (and the use of HLM) Chapter 4 1 Measurement Incorporated HLM Workshop The Illustration Data Now we cover the example. In doing so we does the use of the software HLM. In addition, we will
CHAPTER 18 Programming Your App to Make Decisions: Conditional Blocks
 CHAPTER 18 Programming Your App to Make Decisions: Conditional Blocks Figure 18-1. Computers, even small ones like the phone in your pocket, are good at performing millions of operations in a single second.
Page 18. Using Software To Make More Money With Surveys. Visit us on the web at: www.takesurveysforcash.com
 Page 18 Page 1 Using Software To Make More Money With Surveys by Jason White Page 2 Introduction So you re off and running with making money by taking surveys online, good for you! The problem, as you
Using SAS Proc Mixed for the Analysis of Clustered Longitudinal Data
 Using SAS Proc Mixed for the Analysis of Clustered Longitudinal Data Kathy Welch Center for Statistical Consultation and Research The University of Michigan 1 Background ProcMixed can be used to fit Linear
Overview of Factor Analysis
 Overview of Factor Analysis Jamie DeCoster Department of Psychology University of Alabama 348 Gordon Palmer Hall Box 870348 Tuscaloosa, AL 35487-0348 Phone: (205) 348-4431 Fax: (205) 348-8648 August 1,
Class 19: Two Way Tables, Conditional Distributions, Chi-Square (Text: Sections 2.5; 9.1)
") Spring 204 Class 9: Two Way Tables, Conditional Distributions, Chi-Square (Text: Sections 2.5; 9.) Big Picture: More than Two Samples In Chapter 7: We looked at quantitative variables and compared the
Spring 204 Class 9: Two Way Tables, Conditional Distributions, Chi-Square (Text: Sections 2.5; 9.) Big Picture: More than Two Samples In Chapter 7: We looked at quantitative variables and compared the
RMTD 404 Introduction to Linear Models
 RMTD 404 Introduction to Linear Models Instructor: Ken A., Assistant Professor E-mail: kfujimoto@luc.edu Phone: (312) 915-6852 Office: Lewis Towers, Room 1037 Office hour: By appointment Course Content
Chapter 10. Key Ideas Correlation, Correlation Coefficient (r),
,") Chapter 0 Key Ideas Correlation, Correlation Coefficient (r), Section 0-: Overview We have already explored the basics of describing single variable data sets. However, when two quantitative variables
Chapter 0 Key Ideas Correlation, Correlation Coefficient (r), Section 0-: Overview We have already explored the basics of describing single variable data sets. However, when two quantitative variables
The Mozart effect Methods of Scientific Research
 The Mozart effect Methods of Scientific Research Chapter 2 Experimental Research: p42 49 http://www.mozarteffect.com/ http://www.amazon.com/mozart-sonata-pianos-schubert-fantasia/dp/b0000cf330 http://www.youtube.com/watch?v=hhqn2qjhlcm
In this presentation, you will be introduced to data mining and the relationship with meaningful use.
 In this presentation, you will be introduced to data mining and the relationship with meaningful use. Data mining refers to the art and science of intelligent data analysis. It is the application of machine
Data Mining and Data Warehousing. Henryk Maciejewski. Data Mining Predictive modelling: regression
 Data Mining and Data Warehousing Henryk Maciejewski Data Mining Predictive modelling: regression Algorithms for Predictive Modelling Contents Regression Classification Auxiliary topics: Estimation of prediction
I2B2 TRAINING VERSION 1.6.0.3. Informatics for Integrating Biology and the Bedside
 I2B2 TRAINING VERSION 1.6.0.3 Informatics for Integrating Biology and the Bedside Reference Guide - 10/30/2012 Table of Contents i2b2 3 Will i2b2 benefit research...3 Web Site...3 Using the web site..