Manpower Q Employment Outlook Survey Poland
|
|
|
- Susanna Sims
- 7 years ago
- Views:
Transcription
1 Manpower Q Employment Outlook Survey

2 Manpower Employment Outlook Survey Contents Q2/12 Employment Outlook 1 Regional Comparisons Sector Comparisons Global Employment Outlook 9 International Com parisons Americas International Comparisons Asia Pacific In ternational Comparisons EMEA About the Survey 20 About ManpowerGroup TM 21

3 Employment Outlook The Manpower Employment Outlook Survey for the second quarter 2012 was conducted by interviewing a representative sample of 750 employers in. All survey participants were asked, How do you anticipate total employment at your location to change in the three months to the end of June 2012 as compared to the current quarter? Polish employers expect some employment gains in Quarter With 16% of employers forecasting an increase in staffing levels, 10% predicting a decrease and 69% anticipating no change, the resulting stands at +6%. Throughout this report, we use the term Net Employment Outlook. This figure is derived by taking the percentage of employers anticipating total employment to increase and subtracting from this the percentage expecting to see a decrease in employment at their location in the next quarter. The result of this calculation is the. Employers report a 3 percentage point improvement in hiring prospects when compared with the previous quarter, but the Outlook is 6 percentage points weaker year-over-year. Once the data is adjusted to allow for seasonal variation, the Outlook also stands at +6%. Quarter -over-quarter, hiring prospects remain relatively stable, but the Outlook declines by 6 percentage points year -over-year. From this point forward, all data discussed in the commentary is seasonally adjusted, unless stated otherwise. Increase Decrease No Change Don t Know Seasonally Adjusted Outlook Net Employment Outlook II kwartał 2012 r I kwartał 2012 r IV kwartał 2011 r III kwartał 2011 r II kwartał 2011 r

4 Manpower Employment Outlook Survey Regional Comparisons Employers in all six regions* predict an increase in staffing levels during the next three months. The most optimistic hiring prospects are reported in the South-West, where the stands at +9%. Encouraging signs are also reported in the South and the North-West, where Outlooks stand at +6% and +5%, respectively. An Outlook of +3% is reported in the East, with employers in both North and Central reporting Outlooks of +2%. Quarter-over-quarter, hiring prospects weaken in four of the six regions. The Outlook for the North declines by 7 percentage points and decreases of 4 and 3 percentage points are reported in the East and the South, respectively. Elsewhere, hiring prospects remain relatively stable in the South-West and the North-West, and the Outlook for Central is unchanged. Year-over-year, employers report weaker hiring intentions in all six regions. The most notable decline of 18 percentage points is reported in the Central region. Employers in the East report a 7 percentage point decrease and Outlooks weaken by 4 percentage points in both the South and the North-West. Employers anticipate some payroll gains in five of the six Polish regions during Quarter The one exception is Central where hiring activity is expected to be flat. Hiring prospects improve in four regions quarter-over -quarter, but employers report weaker hiring plans in all six regions year-over-year * Regions of according to Eurostat: Central (łódzkie, mazowieckie), East (lubelskie, podkarpackie, świętokrzyskie, podlaskie), North (kujawsko -pomorskie,warmińsko-mazurskie, pomorskie), North-West (wielkopolskie, zachodniopomorskie, lubuskie), South (małopolskie, śląskie), South-West (dolnośląskie, opolskie). 2

5 Central +2% Slow-paced hiring activity is expected in the Central region during Quarter , with employers reporting a of +2%. The Outlook is unchanged quarter-over-quarter, but declines by a considerable margin of 18 percentage points year -over-year. Based on unadjusted survey data, employers report mixed signals for job seekers in the coming quarter. The Outlook remains relatively stable when compared with the previous quarter but is considerably weaker year-over-year. East +3% Employers in the East forecast the weakest labor market since the survey began in Quarter , reporting a of +3% for the April-June time frame. Hiring prospects weaken by 4 percentage points quarter-over-quarter and by 7 percentage points year-over-year. Based on unadjusted survey data, employers expect some opportunities to grow staffing levels in the coming quarter. The Outlook strengthens moderately quarter -over-quarter, but is moderately weaker year-over-year. No bar indicates of zero. North +2% With a for the upcoming quarter of +2%, employers report cautious hiring intentions. When compared with the previous quarter, the Outlook is 7 percentage points weaker, and it also declines by 2 percentage points year-over-year. Based on unadjusted survey data, employers anticipate a moderate hiring pace in the next three months. The Outlook is slightly stronger quarter-over-quarter but slightly weaker year-over-year. No bar indicates of zero. North-West +5% Regional employers report some encouraging signs for job seekers in Quarter with a Net Employment Outlook of +5%. Quarter-over-quarter, the Outlook remains relatively stable, but hiring prospects are 4 percentage points weaker year-over-year. Based on unadjusted survey data, employers report cautiously optimistic hiring plans for the upcoming quarter. The Outlook is moderately stronger quarter -over-quarter but declines slightly year-over-year. No bar indicates of zero. 3

6 Manpower Employment Outlook Survey South +6% Some payroll gains are forecast in the region for the April-June time frame, with employers reporting a Net Employment Outlook of +6%. However, this is the weakest Outlook since Quarter , following a quarter-over-quarter decline of 3 percentage points. Year-over-year, the Outlook weakens by 4 percentage points. Based on unadjusted survey data, employers predict modest hiring activity in the coming quarter. However, hiring prospects are slightly weaker both quarter-over -quarter and year-over-year. South-West +9% Employers in the South-West report cautiously optimistic hiring intentions for Quarter , with a of +9%, although this is the weakest forecast since Quarter Quarter-over -quarter, the Outlook remains relatively stable, but hiring prospects weaken by 3 percentage points year-over -year. Based on unadjusted survey data, some hiring opportunities are anticipated in the coming quarter. Employers report a moderate quarter-over-quarter improvement, but the Outlook is slightly weaker year -over-year. 4

7 Sector Comparisons Employers in seven of the 10 industry sectors anticipate an increase in staffing levels during the next three months. The most optimistic hiring intentions are reported in the Construction sector, where the Net Employment Outlook stands at +18%. Restaurants & Hotels sector employers report upbeat hiring plans, with an Outlook of +15%, and steady headcount gains are predicted in the Transport, Storage & Communication sector where the Outlook is +11%. Mining & Quarrying sector employers forecast some payroll gains, reporting an Outlook of +8%, while in the Wholesale & Retail Trade sector, the Outlook stands at +7%. Meanwhile, employers in three sectors report negative Outlooks. Weak hiring prospects are indicated by Outlooks of -5% in both the Agriculture, Hunting, Forestry & Fishing sector and the Electricity, Gas & Water Supply sector. Quarter-over-quarter, hiring plans weaken in seven of the 10 industry sectors, according to employers. The most notable Outlook declines of 6 and 5 percentage points are reported in the Manufacturing sector and the Finance, Insurance, Real Estate & Business Services sector, respectively. Elsewhere, hiring intentions strengthen in two sectors. The Restaurants & Hotels sector Outlook improves by 5 percentage points, and a 4 percentage point increase is reported by Electricity, Gas & Water Supply sector employers. Year-over-year, the Outlook weakens in eight of the 10 industry sectors. Manufacturing sector employers report the most noteworthy decline of 20 percentage points, while considerable decreases of 13 and 11 percentage points are reported in the Finance, Insurance, Real Estate & Business Services sector and the Construction sector, respectively. The Agriculture, Hunting, Forestry & Fishing sector Outlook declines by 8 percentage points and a 6 percentage point decrease is reported in the Mining & Quarrying sector. Meanwhile, hiring plans improve by 5 percentage points in the Restaurants & Hotels sector and by 4 percentage points in the Transport, Storage & Communication sector. Based on unadjusted survey data, staffing levels are expected to increase in seven of the 10 industry sectors during the upcoming quarter. The most optimistic forecasts are reported by employers in the Construction sector, the Mining & Quarrying sector and the Restaurants & Hotels sector. Hiring prospects improve in five sectors quarter-over-quarter, but weaken in eight sectors year-over-year. 5

8 Manpower Employment Outlook Survey Agriculture, Hunting, Forestry & Fishing -5% Sector employers report the weakest hiring prospects since the survey began in Quarter , with a Net Employment Outlook of -5% for the upcoming quarter. The Outlook declines by 4 percentage points quarter-over-quarter and by 8 percentage points year-over-year. Based on unadjusted survey data, employers predict a downbeat hiring pace in Quarter Hiring plans are moderately stronger quarter-over-quarter but considerably weaker when compared with Quarter Construction +18% With a of +18%, employers anticipate favorable hiring activity in the next three months. Quarter-over-quarter, the Outlook remains relatively stable, but hiring plans are considerably weaker year-over-year. Based on unadjusted survey data, employers predict solid payroll gains in the coming quarter, following a considerable quarter-over-quarter Outlook improvement. Year-over-year, however, the Outlook is considerably weaker. No bar indicates of zero. Electricity, Gas & Water -5% Employers expect the hiring pace will continue to slump in Quarter , reporting a of -5%. The Outlook strengthens by 4 percentage points quarter-over-quarter and remains relatively stable year -over-year. Based on unadjusted survey data, subdued hiring activity is predicted for the coming quarter, although employers report a considerable quarter-over-quarter improvement in the Outlook. Year-over-year, hiring prospects remain relatively stable. Finance, Insurance, Real Estate & Business Services +6% Some headcount gains are anticipated in the sector during Quarter , with employers reporting a Net Employment Outlook of +6%. However, this is the weakest Outlook since the survey began in Quarter , reflecting declines of 5 percentage points quarter-over -quarter and 13 percentage points year-over-year. Based on unadjusted survey data, employers expect some opportunities to increase staffing levels in the coming quarter. The Outlook is moderately weaker quarter-overquarter and employers report a considerable Outlook decline year-over-year. 6

9 Manufacturing -3% Job seekers are likely to face the weakest hiring climate since Quarter in the April-June time frame, according to employers, who report a Net Employment Outlook of -3%. The Outlook weakens by 6 percentage points when compared with the previous quarter and declines by 20 percentage points year-over-year. Based on unadjusted survey data, employers report sagging hiring prospects for the coming quarter. Quarter-over-quarter, hiring plans weaken slightly, and employers report a considerable year-over-year decline in the Outlook. Mining & Quarrying +8% Employers report cautiously optimistic hiring plans for Quarter with a of +8%. However, the Outlook is the weakest since Quarter , declining by 3 percentage points quarter-over-quarter. Year-over-year, hiring plans weaken by 6 percentage points. Based on unadjusted survey data, positive payroll growth is predicted in the upcoming quarter. Employers report a sharp quarter-over-quarter improvement, but the Outlook is moderately weaker year-over-year. Public & Social +3% Modest workforce gains are anticipated in Quarter , with employers reporting a Net Employment Outlook of +3%. Quarter-over-quarter, hiring prospects remain relatively stable, but the Outlook is slightly weaker year-over-year. Based on unadjusted survey data, employers predict a quiet labor market in the upcoming quarter. Hiring plans are slightly weaker both quarter-over-quarter and year-over-year. Restaurants & Hotels +15% With a of +15%, employers expect a steady increase in staffing levels during the next three months. The Outlook improves by 5 percentage points both quarter-over-quarter and year -over-year. Based on unadjusted survey data, employers report upbeat hiring plans for the coming quarter. Hiring prospects improve considerably when compared with the previous quarter and are moderately stronger year -over-year. No bar indicates of zero. 7

10 Manpower Employment Outlook Survey Transport, Storage & Communication +11% Respectable payroll gains are predicted in Quarter , with employers reporting a Net Employment Outlook of +11% for the second consecutive quarter. Year-over-year, the Outlook improves by 4 percentage points. Based on unadjusted survey data, cautiously optimistic hiring plans are evident in the sector, despite a moderate quarter-over-quarter Outlook decline. The Outlook is slightly stronger year-over-year. Wholesale & Retail Trade +7% Sector employers report some encouraging signs for job seekers in the next three months. The Net Employment Outlook stands at +7, and remains relatively stable quarter-over-quarter. However, employers report a slight Outlook decline year-over-year. Based on unadjusted survey data, employers predict modest headcount gains in the coming quarter. However, the Outlook is slightly weaker both quarter-over-quarter and year-over-year. 8

11 Global Employment Outlook 12 (12) 1 3 (7) 1 6 (6) 1 3 (-1) 1-6 (-6) 1 9
 1-6 (-6) 1 9")
12 Manpower Employment Outlook Survey Each quarter ManpowerGroup conducts research to measure employment trends* in 41 of the world s major labor markets. Over 65,000 employers are interviewed across 41 countries and territories to measure employer hiring expectations between April and June All participants are asked, How do you anticipate total employment at your location to change in the three months to the end of June 2012 as compared to the current quarter? Clearly, many of the economic issues referenced in the first quarter remain unresolved and continue to impact employer confidence. Employers continue to struggle with fluctuating demand, and while there are signs of incremental improvement in select geographies, these improvements are not resulting in meaningful employment growth. Despite ongoing uncertainty, employers in 32 of the 41 countries and territories ManpowerGroup surveys expect to add to their workforces in varying degrees during the second quarter, and hiring optimism strengthens from three months ago in 23 countries and territories. Perhaps a bright note this quarter is that the data indicates added stability with employers in 37 labor markets expecting relatively stable or improved hiring activity from three months ago. In a year-over-year comparison, however, the hiring pace is expected to slow in 24 countries. The global survey holds few surprises this quarter with pockets of opportunity for job seekers counterbalanced by a continuing pattern of negative hiring intentions among some countries in the Europe, Middle East and Africa (EMEA) region. Employers in India, Brazil, Taiwan and Peru report the strongest second-quarter hiring plans, while employers in Greece, Spain, the Czech Republic and Hungary report negative hiring intentions, as well as the weakest s globally. The Services sector continues to be the driving force behind robust forecasts in Brazil and India, while in much of the rest of Asia Pacific, demand in the sector is losing steam. A year-over-year decline in the Finance sector particularly across Europe is notable, although optimism among the sector s employers in the U.S. improves slightly from last quarter and last year. Regionally, employers across the 10 countries in the Americas report positive s, with only employers in Panama reporting a notably weaker forecast compared to Quarter Employers in Brazil continue to report the most vigorous hiring plans in the region. Job prospects in the U.S. are the weakest in the Americas, although the country s is the most optimistic since Quarter Across the eight countries and territories surveyed in Asia Pacific, employers in India continue to report the strongest plans in the region while employers in Hong Kong anticipate the weakest hiring pace. Employers in Japan, meanwhile, report their strongest second -quarter forecast the country s traditional peak hiring quarter since The holding pattern on hiring is most prevalent across the EMEA region with employers in 12 of 23 countries reporting relatively stable hiring plans compared to the first quarter of the year and those in nine anticipating an increase in the hiring pace. The hiring picture is mixed compared to this time last year, with Net Employment Outlooks declining in 13 countries but improving in seven. Regional hiring plans are strongest in Turkey, Israel, Romania and Norway, and weakest in Greece and Spain. * Commentary is based on seasonally adjusted data where available. 10

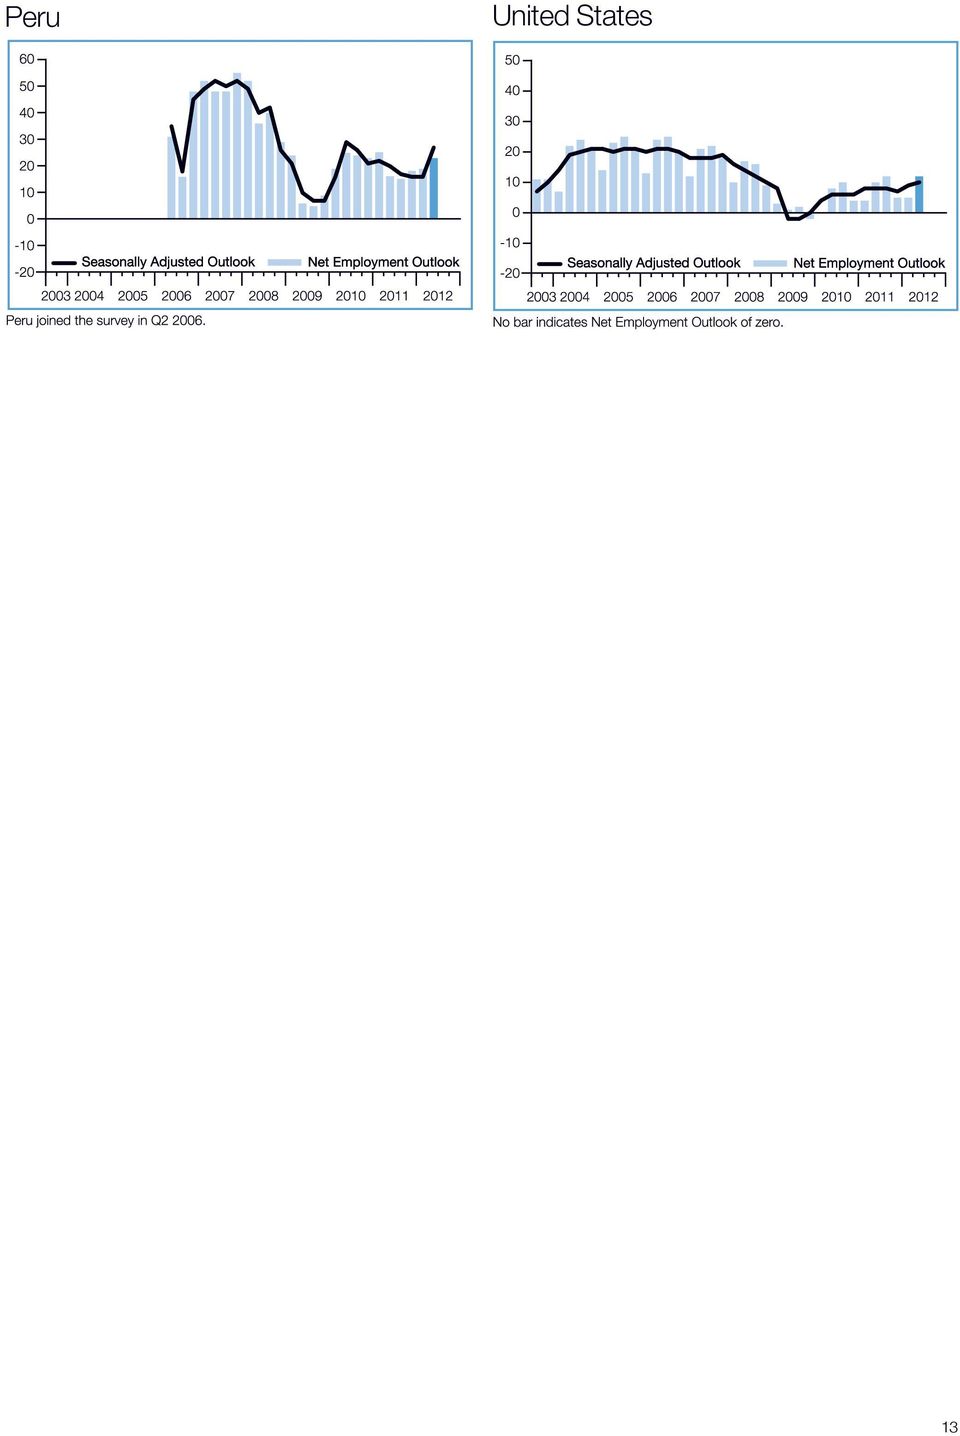
13 Survey Respondents by Region Research for the Quarter Manpower Employment Outlook Survey involved surveying over 65,000 human resources directors and senior hiring managers from public and private organizations worldwide. 46% of respondents come from 10 countries in the Americas; 24% from eight countries and territories across Asia Pacific; and 30% from 23 countries in EMEA. International Comparisons Americas ManpowerGroup interviewed nearly 30,000 employers from 10 countries throughout North, Central and South America to measure employment prospects in Quarter Employers in each country expect the hiring pace to remain positive in the next three months. Net Employment Outlooks improve or remain relatively stable in nine of the 10 countries in comparison to Quarter , and Outlooks improve or remain relatively stable in seven countries when compared to Quarter Employer optimism is strongest in Brazil, Peru and Colombia. Much of the strength in Brazil s labor market is driven by the strongest Outlook to date in the Services sector, where nearly six of every 10 employers report they will add to their payrolls in the April-June time frame. Employers are already hiring in advance of the 2014 World Cup, an event expected to create 700,000 jobs. Yet Brazil s Register of Employed and Unemployed recently indicated that it achieved less than two-thirds of the country s 2011 goal of creating three million jobs perhaps a sign that the available workforce is currently unable to meet employer needs. To the north, hiring in Canada s Mining sector is driving demand for engineers, electricians and construction workers in the province of Alberta, as oil companies work to develop the largest oilfield outside of the Middle East. Regional hiring expectations are least optimistic in the U.S., and although the is still considerably weaker than pre-recession levels, quarter -over-quarter improvements in each of the 13 industry sectors surveyed is boosting the country s Net Employment Outlook to its strongest level since the fourth quarter of Elsewhere, the hiring pace in Mexico is expected to remain upbeat in all industry sectors and regions, with little changing from the previous quarter and last year. A solid labor market forecast in Peru is driven by a bullish Outlook in the country s Finance, Insurance & Real Estate sector, as well as considerable quarter-over-quarter improvements in the country s Wholesale & Retail Trade and Public Administration/Education sectors. 11

14 Manpower Employment Outlook Survey Argentina Brazil Canada Colombia Costa Rica Guatemala Mexico Panama 12

15 Peru United States 13
16 Manpower Employment Outlook Survey International Comparisons Asia Pacific Interviews with nearly 16,000 employers have been conducted across Australia, China, Hong Kong, India, Japan, New Zealand, Singapore and Taiwan to measure anticipated hiring activity in Quarter Job prospects remain positive across the region, with employers in India, Taiwan, China and Singapore reporting the strongest hiring plans. As they have for the previous seven consecutive quarters, employers in India report the most optimistic hiring plans among all countries and territories surveyed. While hiring intentions continue to remain positive in Hong Kong, they are the weakest in the region. Traditionally, the second quarter is Japan s most active recruiting period; the current Outlook is the strongest second-quarter forecast since 2008 and matches the strongest Outlook in nearly four years, suggesting more opportunities for job seekers particularly in the Mining & Construction sector. Australia Employers in six of the eight countries and territories surveyed expect to slow hiring from one year ago, particularly in China and Hong Kong where Outlooks decline across every industry sector surveyed. In year -over-year comparisons, the Services sector Outlook declines in all countries except India and Taiwan. When compared to the first-quarter forecast, Outlooks improve or remain stable in all countries except Hong Kong. In India, nearly six of every 10 Services sector employers indicate they will add to their workforces in the April- June time frame, particularly in the IT and ITes Services segments where employers intend to take advantage of the global slowdown to source better talent at lower costs. In mainland China, the government continues to report that a shrinking labor force attributed partially to the country s one-child policy is forcing companies to raise salaries and improve working conditions in order to attract workers. Yet, as the labor force contracts, so do hiring plans. For the time being, employers are not expanding their workforces as aggressively as they have in the past, and hiring plans in China drop year-overyear across every industry sector and in all but one region. China Hong Kong India 14

17 Japan New Zealand Singapore Taiwan 15

18 Manpower Employment Outlook Survey International Comparisons EMEA Interviews were conducted with more than 19,500 employers across 23 countries in the Europe, Middle East and Africa (EMEA) region to measure anticipated hiring activity for Quarter Outlooks remain relatively stable or improve in 21 of 23 countries surveyed from three months ago, but improve or remain relatively stable in only 12 countries compared to this same time last year. Regional hiring plans are strongest in Turkey, Israel, Romania and Norway. The weakest hiring intentions are reported by employers in Greece and Spain. In addition to Greece and Spain, negative hiring intentions are also reported by employers in five other countries: the Czech Republic, Hungary, Ireland, Italy and South Africa. Job seekers in Germany will likely benefit from a hiring pace that continues to provide opportunities particularly for skilled workers. Employers are stepping up efforts to attract professionals from weaker markets in the region; yet, shortages for in-demand skills such as healthcare professionals, engineers and software developers persist. Despite the respectable second Austria -quarter forecast, the country s Finance & Business Services Outlook is moderately weaker from 12 months ago and highlights a broader weakening trend across the region as large banking and finance concerns continue to restructure and reduce costs. This is particularly true in Switzerland and the Netherlands the Swiss Outlook is the weakest reported in the sector since the survey was established, while the Dutch Outlook matches the sector s weakest forecast, first reported in Quarter Elsewhere, the Outlook in Turkey declines moderately year-over-year as employers anticipate the potential effects of fallout associated with uncertainty in the U.S. and European Union, as well as turmoil associated with Arab Spring protests throughout the region. The pace of hiring in Norway is expected to remain steady: An unemployment rate of 2.8 percent combined with growing employer demand in the Construction and the Mining & Quarrying sectors is forcing many employers to look beyond their own border for the talent they need. Meanwhile, hiring prospects remain gloomy in Greece; fewer Greek employers tell us they intend to shed staff in the quarter ahead, but only time will tell if the recent assurance of EU backing will result in stability sufficient enough to inject confidence into the country s employers. Belgium Bulgaria Czech Republic 16

19 France Germany Greece Hungary Ireland Israel Italy Netherlands 17

20 Manpower Employment Outlook Survey Norway Romania Slovakia Slovenia South Africa Spain Sweden 18

21 Switzerland Turkey UK 19
22 Manpower Employment Outlook Survey About the Manpower Employment Outlook Survey The Manpower Employment Outlook Survey is conducted quarterly to measure employers intentions to increase or decrease the number of employees in their workforces during the next quarter. The survey has been running for 50 years and is one of the most trusted surveys of employment activity in the world. Various factors underpin the success of the Manpower Employment Outlook Survey: Unique: It is unparalleled in its size, scope, longevity and area of focus. Projective: The Manpower Employment Outlook Survey is the most extensive, forward-looking employment survey in the world, asking employers to forecast employment over the next quarter. In contrast, other surveys and studies focus on retrospective data to report on what occurred in the past. Independent: The survey is conducted with a representative sample of employers from throughout the countries in which it is conducted. The survey participants are not derived from Manpower s customer base. Robust: The survey is based on interviews with over 65,000 public and private employers across 41 countries and territories to measure anticipated employment trends each quarter. This sample allows for analysis to be performed across specific sectors and regions to provide more detailed information. Focused: For five decades the survey has derived all of its information from a single question. Survey Question All employers participating in the survey worldwide are asked the same question, How do you anticipate total employment at your location to change in the three months to the end of June 2012 as compared to the current quarter? The regional division of, used for the survey purposes, is define as by Eurostat: Central (łódzkie, mazowieckie), East (lubelskie, podkarpackie, świętokrzyskie, podlaskie), North (kujawsko-pomorskie, warmińsko-mazurskie, pomorskie), North-West (wielkopolskie, zachodniopomorskie, lubuskie), South (małopolskie, śląskie), South-West (dolnośląskie, opolskie). Throughout this report, we use the term Net Employment Outlook. This figure is derived by taking the percentage of employers anticipating an increase in hiring activity and subtracting from this the percentage of employers expecting to see a decrease in employment at their location in the next quarter. The result of this calculation is the Net Employment Outlook.. Seasonal Adjustment Seasonal adjustments have been applied to the data for Argentina, Australia, Austria, Belgium, Canada, Costa Rica, China, the Czech Republic, France, Germany, Greece, Guatemala, Hong Kong, India, Ireland, Italy, Japan, Mexico, Netherlands, New Zealand, Norway, Peru,, Romania, Singapore, South Africa, Spain, Sweden, Switzerland, Taiwan, the United Kingdom and the United States to provide additional insight into the survey data. These adjustments make it possible to review the data without the employment fluctuations that normally occur at the same time each year, thus providing a clearer picture of the data over time. ManpowerGroup intends to add seasonal adjustments to the data for other countries in the future, as more historical data is compiled. Note that in Quarter , ManpowerGroup adopted the TRAMO-SEATS method of seasonal adjustment for data. Methodology The Manpower Employment Outlook Survey is conducted using a validated methodology, in accordance with the highest standards in market research. The research team for the 41 countries and territories where the survey is currently conducted includes ManpowerGroup s internal research team and Infocorp Ltd. The survey has been structured to be representative of each national economy. The margin of error for all national, regional and global data is not greater than +/- 3.9%. The Manpower Employment Outlook Survey for is based on interviews with a representative sample of 750 employers. The margin of sampling error is +/- 3.6%. 20
23 History of the Survey 1962 First generation of the Manpower Employment Outlook Survey launched in the United States and Canada ManpowerGroup s United Kingdom operation launches the equivalent of the United States survey, naming the report the Quarterly Survey of Employment Prospects. The survey adopts the same forward looking research format as the United States survey and is the first of its kind in Europe Second generation of the Manpower Employment Outlook Survey launched in the United States and Canada. Research methodology is updated to evolve with advancements in the field of market research ManpowerGroup United Kingdom's Quarterly Survey of Employment Prospects is updated to adopt an enhanced research methodology. ManpowerGroup's operations in Mexico and Ireland launch the survey in their respective countries Third generation of the Manpower Employment Outlook Survey is launched, expanding the program to a total of 18 countries and territories worldwide: Australia, Austria, Belgium, Canada, France, Germany, Hong Kong, Ireland, Italy, Japan, Mexico, Netherlands, Norway, Singapore, Spain, Sweden, the United Kingdom and the United States ManpowerGroup operations in New Zealand launch the Manpower Employment Outlook Survey ManpowerGroup operations in China, India, Switzerland, and Taiwan launch the Manpower Employment Outlook Survey ManpowerGroup operations in Costa Rica and Peru join the survey program. Surveys in Australia, Austria, About ManpowerGroup Belgium, France, Germany, Hong Kong, Ireland, Italy, Japan, Mexico, Netherlands, Norway, Singapore, Spain and Sweden add seasonally adjusted data in the third quarter. Manpower operations in South Africa launch the Manpower Employment Outlook Survey ManpowerGroup operations in Argentina join the Manpower Employment Outlook Survey. The survey in New Zealand adds seasonally adjusted data in the first quarter ManpowerGroup operations in Colombia, the Czech Republic, Greece, Guatemala, and Romania join the survey program. China and Taiwan add seasonally adjusted data in the second quarter. India and Switzerland add seasonally adjusted data in the third quarter ManpowerGroup operations in Hungary and Brazil launch the Manpower Employment Outlook Survey ManpowerGroup s Panama operation launches the Manpower Employment Outlook Survey in the second quarter. Peru adds seasonally adjusted data in the second quarter. Costa Rica adds seasonally adjusted data in the first quarter Beginning in the first quarter, operations in Bulgaria, Slovenia and Turkey join the Manpower Employment Outlook Survey. Additionally, seasonally adjusted data is added in the first quarter for Argentina and South Africa. Israel and Slovakia launch the Manpower Employment Outlook Survey in the fourth quarter expanding the program to 41 countries and territories worldwide Beginning in the second quarter, ManpowerGroup operations in the Czech Republic, Greece, Guatemala, and Romania initiate reporting of seasonally adjusted data. ManpowerGroup (NYSE: MAN), the world leader in innovative workforce solutions, creates and delivers high-impact solutions that enable our clients to achieve their business goals and enhance their competitiveness. With over 60 years of experience, our $22 billion company creates unique time to value through a comprehensive suite of innovative solutions that help clients win in the Human Age. These solutions cover an entire range of talent-driven needs from recruitment and assessment, training and development, and career management, to outsourcing and workforce consulting. ManpowerGroup maintains the world's largest and industry-leading network of nearly 3,900 offices in 80 countries and territories, generating a dynamic mix of an unmatched global footprint with valuable insight and local expertise to meet the needs of its 400,000 clients per year, across all industry sectors, small and medium-sized enterprises, local, multinational and global companies. By connecting our deep understanding of human potential to the ambitions of clients, ManpowerGroup helps the organizations and individuals we serve achieve more than they imagined because their success leads to our success. And by creating these powerful connections, we create power that drives organizations forward, accelerates personal success and builds more sustainable communities. We help power the world of work. The ManpowerGroup suite of solutions is offered through ManpowerGroup Solutions, Manpower, Experis and Right Management. Learn more about how ManpowerGroup can help you win in the Human Age at About ManpowerGroup in ManpowerGroup, the world leader in innovative workforce solutions, has been helping clients and candidates win in since march With 47 branches in 28 cities across the nation, ManpowerGroup provides unique value to clients and candidates through ManpowerGroup Solutions, Manpower, Experis and Right Management. ManpowerGroup portfolio covers permanent, temporary and contract recruitment; employee assessment and selection; outsourcing and workforce consulting; career management and outplacement. More information on 21
24 ManpowerGroup, ul. Nowogrodzka 68, Warsaw Tel.: (+48) , , ManpowerGroup. All rights reserved.
Q1 2012. Manpower. Employment Outlook Survey Poland. A Manpower Research Report
 Manpower Q1 212 Employment Outlook Survey A Manpower Research Report Manpower Employment Outlook Survey Contents Q1/12 Employment Outlook 1 Regional Comparisons Sector Comparisons Global Employment Outlook
Manpower Q3 2012. Employment Outlook Survey Poland
 Manpower Q3 212 Employment Outlook Survey Manpower Employment Outlook Survey Contents Q3/12 Employment Outlook 1 Regional Comparisons Sector Comparisons Global Employment Outlook 9 International Com parisons
Manpower Employment Outlook Survey Singapore Q3 2014. A Manpower Research Report
 Manpower Employment Outlook Survey Singapore Q3 14 A Manpower Research Report Contents Q3/14 Singapore Employment Outlook 2 Sector Comparisons Global Employment Outlook 6 International Comparisons - Asia
Manpower Employment Outlook Survey Norway
 Manpower Employment Outlook Survey Norway Q2 2015 The Manpower Employment Outlook Survey for the second quarter 2015 was conducted by interviewing a representative sample of 751 employers in Norway. All
Manpower Employment Outlook Survey Ireland
 Manpower Employment Outlook Survey Ireland Q1 215 Country Name Employment Outlook The Manpower Employment Outlook Survey for the first quarter 215 was conducted by interviewing a representative sample
EMBARGOED UNTIL TUESDAY, 12 MARCH 2013 AT 00.01 GMT
 EMBARGOED UNTIL TUESDAY, 12 MARCH 2013 AT 00.01 GMT Media Contact: Juan David Tous (4) 3815151 juan.tous@manpower.com.co LABOR MARKET IN COLOMBIA EXPECTED TO MOVE AT A SLIGHTLY SLOWER PACE ManpowerGroup
The Borderless Workforce 2011. Australia and New Zealand Research Results
 The Borderless Workforce 2011 Australia and New Zealand Research Results Introduction Given the fact that neither Australia or New Zealand are facing problems, like high unemployment rates during the labour
Employer Perspectives on Social Networking: Global Key Findings
 Employer Perspectives on Social Networking: Global Key Findings people technology A Manpower Survey Social Networking: Managing the Next Workplace Transformation A new generation, steeped in the rules
About the Research. Countries Include:
 About the Research To shed light on how organizations are using foreign talent to help ease talent shortages in their workforce, ManpowerGroup conducted research among nearly 25,000 employers across 39
TALENT SHORTAGE SURVEY
 TALENT SHORTAGE SURVEY FOREWORD By Jonas Prising, ManpowerGroup CEO It s ten years since ManpowerGroup conducted our first Talent Shortage Survey, and a great deal has changed. The world has experienced
The big pay turnaround: Eurozone recovering, emerging markets falter in 2015
 The big pay turnaround: Eurozone recovering, emerging markets falter in 2015 Global salary rises up compared to last year But workers in key emerging markets will experience real wage cuts Increase in
TALENT SHORTAGE SURVEY RESEARCH RESULTS
 2013 TALENT SHORTAGE SURVEY RESEARCH RESULTS EXECUTIVE SUMMARY ManpowerGroup recently surveyed over 38,000 employers across 42 countries and territories for our annual Talent Shortage Survey. The 2013
skills mismatches & finding the right talent incl. quarterly mobility, confidence & job satisfaction
 skills mismatches & finding the right talent incl. quarterly mobility, confidence & job satisfaction Randstad Workmonitor Global Press Report wave 3-2012 Randstad Holding nv September 2012 content Chapter
Consumer Credit Worldwide at year end 2012
 Consumer Credit Worldwide at year end 2012 Introduction For the fifth consecutive year, Crédit Agricole Consumer Finance has published the Consumer Credit Overview, its yearly report on the international
7 Seven. Leadership Development Trends
 7 Seven Leadership Development Trends One Complexity is the new normal W N S E According to the Economist Intelligence Unit, organizations are launching more major change initiatives than ever before:
THE TALENT SHORTAGE CONTINUES HOW THE EVER CHANGING ROLE OF HR CAN BRIDGE THE GAP
 THE TALENT SHORTAGE CONTINUES HOW THE EVER CHANGING ROLE OF HR CAN BRIDGE THE GAP EXECUTIVE SUMMARY ManpowerGroup s ninth annual Talent Shortage Survey found 36% of employers globally report talent shortages
U.S. Trade Overview, 2013
 U.S. Trade Overview, 213 Stephanie Han & Natalie Soroka Trade and Economic Analysis Industry and Analysis Department of Commerce International Trade Administration October 214 Trade: A Vital Part of the
Workforce Strategy Survey: Global Key Findings
 Workforce Strategy Survey: Global Key Findings A Manpower Survey Insights on Whether Organizations Workforce Strategies are Aligned to Their Business Strategies and Their People are Prepared to Execute
2015 Growth in data center employment continues but the workforce is changing
 Published in Conjunction with MARKET BRIEFING GLOBAL DATA CENTER EMPLOYMENT 2015 2015 Growth in data center employment continues but the workforce is changing Globally, the number of people working in
The rise of the cross-border transaction. Grant Thornton International Business Report 2013
 The rise of the cross-border transaction Grant Thornton International Business Report 2013 Foreword MIKE HUGHES GLOBAL SERVICE LINE LEADER MERGERS & ACQUISITIONS GRANT THORNTON INTERNATIONAL LTD When reflecting
International investment continues to struggle
 FDI IN FIGURES December 2014 International investment continues to struggle Figures for the first half of 2014 point to stalled FDI flows Findings FDI fell in the first quarter of 2014 before rebounding
Appendix 1: Full Country Rankings
 Appendix 1: Full Country Rankings Below please find the complete rankings of all 75 markets considered in the analysis. Rankings are broken into overall rankings and subsector rankings. Overall Renewable
Global payments trends: Challenges amid rebounding revenues
 34 McKinsey on Payments September 2013 Global payments trends: Challenges amid rebounding revenues Global payments revenue rebounded to $1.34 trillion in 2011, a steep increase from 2009 s $1.1 trillion.
THE AUTONOMOUS AND EMPOWERED WORKFORCE
 kelly Global workforce index THE AUTONOMOUS AND EMPOWERED WORKFORCE 168,000 people release: SEPT 2012 30 countries The new breed of aspirational and dynamic employees 70 % think multiple employers are
SuccessFactors Employee Central: Cloud Core HR Introduction, Overview, and Roadmap Update Joachim Foerderer, SAP AG
 Orange County Convention Center Orlando, Florida June 3-5, 2014 SuccessFactors Employee Central: Cloud Core HR Introduction, Overview, and Roadmap Update Joachim Foerderer, SAP AG SESSION CODE: 1812 Cloud
International Financial Reporting Standards
 International Financial Reporting Standards Of Growing Importance for U.S. Companies Assurance Services there is no longer a choice Three factors may influence your need to consider IFRS. First, many organizations
How To Get A New Phone System For Your Business
 Cisco Phone Systems Telemarketing Script Cold Call 1. Locate Contact: Name listed Owner General Manager / Office Manager Chief BDM (Business Decision Maker) Note: Avoid talking to IT since this is not
Triple-play subscriptions to rocket to 400 mil.
 Triple-play criptions to rocket to 400 mil. Global triple-play criptions will reach 400 million by 2017; up by nearly 300 million on the end-2011 total and up by 380 million on the 2007 total, according
Introducing GlobalStar Travel Management
 Introducing GlobalStar Travel Management GlobalStar is a worldwide travel management company owned and managed by local entrepreneurs. In total over 80 market leading enterprises, representing over US$13
Sulfuric Acid 2013 World Market Outlook and Forecast up to 2017
 Brochure More information from http://www.researchandmarkets.com/reports/2547547/ Sulfuric Acid 2013 World Market Outlook and Forecast up to 2017 Description: Sulfuric Acid 2013 World Market Outlook and
World Consumer Income and Expenditure Patterns
 World Consumer Income and Expenditure Patterns 2014 14th edi tion Euromonitor International Ltd. 60-61 Britton Street, EC1M 5UX TableTypeID: 30010; ITtableID: 22914 Income Algeria Income Algeria Income
Trends in the European Investment Fund Industry. in the Fourth Quarter of 2015. Results for the Full Year of 2015
 Quarterly Statistical Release February 2016, N 64 This release and other statistical releases are available on Efama s website (www.efama.org) Trends in the European Investment Fund Industry in the Fourth
The face of consistent global performance
 Building safety & security global simplified accounts The face of consistent global performance Delivering enterprise-wide safety and security solutions. With more than 500 offices worldwide Johnson Controls
GLOBAL DATA CENTER INVESTMENT 2013
 2013 CENSUS REPORT: Global Data Center Investment 2013 GLOBAL DATA CENTER INVESTMENT 2013 2013 - Healthy Growth in Data Center Investment Globally Globally, the data center industry has continued to maintain
Chapter 4A: World Opinion on Terrorism
 1 Pew Global Attitudes Project, Spring 2007 Now I m going to read you a list of things that may be problems in our country. As I read each one, please tell me if you think it is a very big problem, a moderately
Foreign Taxes Paid and Foreign Source Income INTECH Global Income Managed Volatility Fund
 Income INTECH Global Income Managed Volatility Fund Australia 0.0066 0.0375 Austria 0.0045 0.0014 Belgium 0.0461 0.0138 Bermuda 0.0000 0.0059 Canada 0.0919 0.0275 Cayman Islands 0.0000 0.0044 China 0.0000
BT Premium Event Call and Web Rate Card
 BT Managed Event and BT Self-Managed Event (also referred to as Express, Plus and Premium) Conference Bridge and Call for Booked Audio Conferencing Services will comprise the following for each phone-conference:
WORKFORCE ENGAGEMENT IN SAUDI ARABIA WHAT S WORKING FOR SAUDI NATIONALS AND WHAT EMPLOYERS NEED TO KNOW
 WORKFORCE ENGAGEMENT IN SAUDI ARABIA WHAT S WORKING FOR SAUDI NATIONALS AND WHAT EMPLOYERS NEED TO KNOW Forget the old cliché of a comfortable secure job with a corner desk in a government office. Saudi
WORLD. Geographic Trend Report for GMAT Examinees
 2011 WORLD Geographic Trend Report for GMAT Examinees WORLD Geographic Trend Report for GMAT Examinees The World Geographic Trend Report for GMAT Examinees identifies mobility trends among GMAT examinees
Economic Conditions Snapshot, December 2013
 McKinsey Global Survey results Economic Conditions Snapshot, December 03 Executives economic expectations have reached a high for the year, though they expect only mild improvements in 04 and anticipate
CISCO METRO ETHERNET SERVICES AND SUPPORT
 SERVICES OVERIVEW CISCO METRO ETHERNET SERVICES AND SUPPORT In the ever-changing communications market, incumbent service providers are looking for ways to grow revenue. One method is to deploy service
List of tables. I. World Trade Developments
 List of tables I. World Trade Developments 1. Overview Table I.1 Growth in the volume of world merchandise exports and production, 2010-2014 39 Table I.2 Growth in the volume of world merchandise trade
GfK PURCHASING POWER INTERNATIONAL
 GfK PURCHASING POWER INTERNATIONAL 1 Agenda 1. Europe 3 2. Americas 45 3. Asia & Near East 54 4. Afrika 66 5. Australia 68 6. Overview of countries and available levels 70 2 2 EUROPE 4 GfK
OCTOBER 2010. Russell-Parametric Cross-Sectional Volatility (CrossVol ) Indexes Construction and Methodology
 Indexes Construction and Methodology") OCTOBER 2010 Russell-Parametric Cross-Sectional Volatility (CrossVol ) Indexes Construction and Methodology SEPTEMBER 2010 Russell-Parametric Cross-Sectional Volatility (CrossVol) Indexes Construction
OCTOBER 2010 Russell-Parametric Cross-Sectional Volatility (CrossVol ) Indexes Construction and Methodology SEPTEMBER 2010 Russell-Parametric Cross-Sectional Volatility (CrossVol) Indexes Construction
Insurance Market Outlook
 Munich Re Economic Research May 2014 Premium growth is again slowly gathering momentum After a rather restrained 2013 (according to partly preliminary data), we expect growth in global primary insurance
IMD World Talent Report. By the IMD World Competitiveness Center
 2014 IMD World Talent Report By the IMD World Competitiveness Center November 2014 IMD World Talent Report 2014 Copyright 2014 by IMD: Institute for Management Development, Lausanne, Switzerland For further
Know the Facts. Aon Hewitt Country Profiles can help: Support a decision to establish or not establish operations in a specific country.
 Aon Hewitt Country Profiles Your eguide to employment requirements and practices Profiles for nearly 90 countries worldwide Risk. Reinsurance. Human Resources. Know the Facts Whether you are a newcomer
innovative solutions
 Finding the best talent is humanly possible Recruitment Process Outsourcing Looking for talent? the best Having the best talent is a competitive advantage in today s demanding and complex world. Because
Schedule of Accreditation issued by United Kingdom Accreditation Service 21-47 High Street, Feltham, Middlesex, TW13 4UN, UK
 Schedule of United Kingdom Service 21-47 High Street, Feltham, Middlesex, TW13 4UN, UK ISO/IEC 17021:2011 to provide environmental management systems certification Kitemark Court Davy Avenue Knowlhill
GE Grid Solutions. Providing solutions that keep the world energized Press Conference Call Presentation November 12, 2015. Imagination at work.
 GE Grid Solutions Providing solutions that keep the world energized Press Conference Call Presentation November 12, 2015 Press Conference Call Recording: Toll Free: +1 (855) 859-2056 Toll: +1 (404) 537-3406
What Proportion of National Wealth Is Spent on Education?
 Indicator What Proportion of National Wealth Is Spent on Education? In 2008, OECD countries spent 6.1% of their collective GDP on al institutions and this proportion exceeds 7.0% in Chile, Denmark, Iceland,
The value of accredited certification
 Certified Once Accepted Everywhere The value of accredited certification Survey Report Published May 212 In 21/11, the IAF carried out a global survey to capture market feedback on the value of certification.
How To Win In The Human Age
 To learn more about Talent Based Outsourcing from ManpowerGroup Solutions, visit www.manpowergroupsolutions.com. Or to set up a meeting, please email tbo@manpowergroup.com. 2012 ManpowerGroup. All rights
Global Investment Trends Survey May 2015. A study into global investment trends and saver intentions in 2015
 May 2015 A study into global investment trends and saver intentions in 2015 Global highlights Schroders at a glance Schroders at a glance At Schroders, asset management is our only business and our goals
FTI Consulting +44 (0)20 3727 1340 Richard Mountain / Susanne Yule
20 3727 1340 Richard Mountain / Susanne Yule") 13 October 2015 THIRD QUARTER 2015 INTERIM MANAGEMENT STATEMENT Highlights* 10.2% Group gross profit growth, good contributions from all four regions FX lowered gross profit by c. 7m (c. 18m YTD) Double-digit
13 October 2015 THIRD QUARTER 2015 INTERIM MANAGEMENT STATEMENT Highlights* 10.2% Group gross profit growth, good contributions from all four regions FX lowered gross profit by c. 7m (c. 18m YTD) Double-digit
Strong Hiring Trends in China, Hong Kong, Japan and Singapore Reach Highest Levels in Four Years
 For Immediate Release Contact: Tricia Stevenson Hudson (852) 2919 6153 tricia.stevenson@hudson.com Strong Hiring Trends in China, Hong Kong, Japan and Singapore Reach Highest Levels in Four Years Comprehensive
Global AML Resource Map Over 2000 AML professionals
 www.pwc.co.uk Global AML Resource Map Over 2000 AML professionals January 2016 Global AML Resources: Europe France Italy Jersey / Guernsey 8 Ireland 1 Portugal 7 Luxembourg 5 United Kingdom 1 50 11 Spain
THE ETHICS HELPLINE Worldwide Dialing Instructions April 2012
 COUNTRY DIALING INSTRUCTIONS US, Canada and Virgin Islands The Ethics Helpline is always available, 24/7/365 888 478 6858 (Dialing instructions for other jurisdictions follow) Coming soon internet reporting
A new ranking of the world s most innovative countries: Notes on methodology. An Economist Intelligence Unit report Sponsored by Cisco
 A new ranking of the world s An Economist Intelligence Unit report Sponsored by Cisco Economist Intelligence Unit Limited 2009 A new ranking of the world s Preface In April 2009, the Economist Intelligence
Report on Government Information Requests
 Report on Government Information January 1 - June 30, 2015 Apple takes our commitment to protecting your data very seriously and we work incredibly hard to deliver the most secure hardware, software and
The AGENCY WORK INDUSTRY. around the WORLD. Economic Report. 2013 Edition (based on figures available in 2011) 2013 Economic Report / Ciett / 1
 2013 Economic Report / Ciett / 1") The AGENCY WORK INDUSTRY around the WORLD Economic Report 2013 Edition (based on figures available in 2011) 2013 Economic Report / Ciett / 1 Ciett Tour & Taxis building Avenue du Port 86c - Box 302 B 1000
The AGENCY WORK INDUSTRY around the WORLD Economic Report 2013 Edition (based on figures available in 2011) 2013 Economic Report / Ciett / 1 Ciett Tour & Taxis building Avenue du Port 86c - Box 302 B 1000
Trends in the European Investment Fund Industry. in the First Quarter of 2016
 Quarterly Statistical Release May 2016, N 65 This release and other statistical releases are available on Efama s website (www.efama.org) Trends in the European Investment Fund Industry in the First Quarter
SEPTEMBER 2012 TALENT ASSESSMENT IN M&A THE PEOPLE FACTOR
 SEPTEMBER 2012 TALENT ASSESSMENT IN M&A THE PEOPLE FACTOR It is critical to assess the target company s human capital with the same rigor that s applied toward assessing pension liabilities, inventories,
Supported Payment Methods
 Supported Payment Methods Global In the global payments market, credit cards are the most popular payment method. However, BlueSnap expands the payment selection by including not only the major credit
41 T Korea, Rep. 52.3. 42 T Netherlands 51.4. 43 T Japan 51.1. 44 E Bulgaria 51.1. 45 T Argentina 50.8. 46 T Czech Republic 50.4. 47 T Greece 50.
 Overall Results Climate Change Performance Index 2012 Table 1 Rank Country Score** Partial Score Tendency Trend Level Policy 1* Rank Country Score** Partial Score Tendency Trend Level Policy 21 - Egypt***
E-Seminar. Financial Management Internet Business Solution Seminar
 E-Seminar Financial Management Internet Business Solution Seminar Financial Management Internet Business Solution Seminar 3 Welcome 4 Objectives 5 Financial Management 6 Financial Management Defined 7
THE CISCO CRM COMMUNICATIONS CONNECTOR GIVES EMPLOYEES SECURE, RELIABLE, AND CONVENIENT ACCESS TO CUSTOMER INFORMATION
 CUSTOMER SUCCESS STORY THE CISCO CRM COMMUNICATIONS CONNECTOR GIVES EMPLOYEES SECURE, RELIABLE, AND CONVENIENT ACCESS TO CUSTOMER INFORMATION EXECUTIVE SUMMARY CUSTOMER NAME Coleman Technologies INDUSTRY
MAUVE GROUP GLOBAL EMPLOYMENT SOLUTIONS PORTFOLIO
 MAUVE GROUP GLOBAL SOLUTIONS PORTFOLIO At Mauve Group, we offer a variety of complete employee management services such as Global Employment Solutions (GES), Professional Employment Outsourcing (PEO),
Supported Payment Methods
 Sell Globally in a Snap Supported Payment Methods Global In the global payments market, credit cards are the most popular payment method. However, BlueSnap expands the payment selection by including not
Economic and Market Report. EU Automotive Industry Quarter 3 2015
 Economic and Market Report EU Automotive Industry Quarter 3 2015 December 2015 CONTENTS EU Economic Outlook... 2 Passenger cars... 4 Registrations... 4 World... 4 The European Union... 7 Production...
Global Corporate Capital Flows, 2008/9 to 2013/14
 Global Corporate Capital Flows, 2008/9 to 2013/14 A study of the investment intentions of companies in 15 countries around the world. June 2008 TAX Across KPMG s global network of member firms, we have
Global Long-Term Incentives: Trends and Predictions Results from the 2013 iquantic Global Long-Term Incentive Practices Survey
 Global Long-Term Incentives: Trends and Predictions Results from the 2013 iquantic Global Long-Term Incentive Practices Survey Jon F. Doyle and Sandra Sussman October 8, 2013 Presenters Jon F. Doyle Attorney
WORLDWIDE RETAIL ECOMMERCE SALES: EMARKETER S UPDATED ESTIMATES AND FORECAST THROUGH 2019
 WORLDWIDE RETAIL ECOMMERCE SALES: EMARKETER S UPDATED ESTIMATES AND FORECAST THROUGH 2019 Worldwide retail sales including in-store and internet purchases will surpass $22 trillion in 2015, up 5.6% from
TRADING STATEMENT FINANCIAL YEAR 2014/15
 METRO GROUP TRADING STATEMENT FINANCIAL YEAR 2014/15 P. 1 TRADING STATEMENT FINANCIAL YEAR 2014/15 METRO GROUP achieves sales target and confirms EBIT guidance Like-for-like sales growth of 1.5% in financial
Carat forecasts growth of 5.0% for 2012 and 5.3% in 2013 with digital advertising overtaking newspapers sooner than expected
 23 August 2012 Carat forecasts growth of 5.0% for 2012 and 5.3% in 2013 with digital advertising overtaking newspapers sooner than expected Carat, the world s leading independent media communications agency,
Q3 FDI flows are up, but 2013 is heading towards a second annual decline
 USD billions FDI IN FIGURES February 214 International investment struggles Q3 FDI flows are up, but 213 is heading towards a second annual decline Key findings Despite strong performance in Q3, global
Project Management Salary Survey Ninth Edition Project Management Institute Newtown Square, Pennsylvania, USA
 Project Management Salary Survey Ninth Edition Project Management Institute Newtown Square, Pennsylvania, USA 2015 Project Management Institute, Inc. (PMI). All rights reserved. No part of this work may
Insights into IT Professionals (Australia) Manpower Market Insights Paper
 Manpower Market Insights Paper") Insights into IT Professionals (Australia) Manpower Market Insights Paper April 2009 Australia Building and maintaining a sustainable and world-class ICT workforce and ICT skills base is necessary to meet
Insights into IT Professionals (Australia) Manpower Market Insights Paper April 2009 Australia Building and maintaining a sustainable and world-class ICT workforce and ICT skills base is necessary to meet
World Manufacturing Production
 Quarterly Report World Manufacturing Production Statistics for Quarter III, 2013 Statistics Unit www.unido.org/statistics Report on world manufacturing production, Quarter III, 2013 UNIDO Statistics presents
Brochure More information from http://www.researchandmarkets.com/reports/1339929/
 Brochure More information from http://www.researchandmarkets.com/reports/1339929/ The 2011 World Forecasts of Machine Tools That Remove Material by Laser or Light, Photon, Ultrasonic, Electro-Discharge,
CMMI for SCAMPI SM Class A Appraisal Results 2011 End-Year Update
 CMMI for SCAMPI SM Class A 2011 End-Year Update Software Engineering Institute Carnegie Mellon University Pittsburgh, PA 15213 1 Outline Introduction Current Status Community Trends Organizational Trends
CONSUMER CONFIDENCE CONCERNS AND SPENDING INTENTIONS AROUND THE WORLD QUARTER 2, 2014 2014 CONSUMER CONFIDENCE SERIES 2 ND EDITION
 CONSUMER CONFIDENCE CONCERNS AND SPENDING INTENTIONS AROUND THE WORLD QUARTER 2, 214 214 CONSUMER CONFIDENCE SERIES 2 ND EDITION GLOBAL CONSUMER CONFIDENCE MODESTLY ADVANCES AS OPTIMISM CONTINUES TO RISE
FDI gains momentum in second half of 2014
 FDI IN FIGURES April 2015 FDI gains momentum in second half of 2014 Global FDI flows picked up in the second half of 2014, increasing 17% in Q3 and 3% in Q4, representing an overall 9% increase in the
World Manufacturing Production
 Quarterly Report World Manufacturing Production Statistics for Quarter IV, 2013 Statistics Unit www.unido.org/statistics Report on world manufacturing production, Quarter IV, 2013 UNIDO Statistics presents
Business Entities - Review of the PageGroup: Large, High Potential Markets
 Second Quarter 2014 Trading Update 15 July 2014 PageGroup Second Quarter 2014 Trading Update 2 Overview Group Q2 Gross Profit +9% in constant currency +2% in reported rates Y-o-Y growth in all regions
Table 1: TSQM Version 1.4 Available Translations
 Quintiles, Inc. 1 Tables 1, 2, & 3 below list the existing and available translations for the TSQM v1.4, TSQM vii, TSQM v9. If Quintiles does not have a translation that your Company needs, the Company
Economic and Market Outlook. EU Automobile Industry
 Economic and Market Outlook EU Automobile Industry March 2015 Report 1 of 4 2015 CONTENTS EU ECONOMIC FORECASTS... 2 PASSENGER CARS... 4 REGISTRATIONS... 4 WORLD... 4 THE EUROPEAN UNION... 6 PRODUCTION...
A Bird s Eye View of Global Real Estate Markets: 2012 Update
 A Bird s Eye View of Global Real Estate Markets: 2012 Update FEBRUARY 2012 US Research Paul Fiorilla Vice President paul.fiorilla@prudential.com Manidipa Kapas, CFA Director manidipa.kapas@prudential.com
Logix5000 Clock Update Tool V2.00.36. 12/13/2005 Copyright 2005 Rockwell Automation Inc., All Rights Reserved. 1
 Logix5000 Clock Update Tool V2.00.36. 1 Overview Logix5000 Clock Update Tool 1. 1. What is is it? it? 2. 2. How will it it help me? 3. 3. How do do I I use it? it? 4. 4. When can I I get get it? it? 2
Excerpt Sudan Fixed Telecommunications: Low Penetration Rates Get a Boost from Broadband Internet and VoIP Services
 Excerpt Sudan Fixed Telecommunications: Low Penetration Rates Get a Boost from Broadband Internet and VoIP Services This report is part of Pyramid Research s series of Africa & Middle East Country Intelligence
relating to household s disposable income. A Gini Coefficient of zero indicates
 Gini Coefficient The Gini Coefficient is a measure of income inequality which is based on data relating to household s disposable income. A Gini Coefficient of zero indicates perfect income equality, whereas
EMEA BENEFITS BENCHMARKING OFFERING
 EMEA BENEFITS BENCHMARKING OFFERING COVERED COUNTRIES SWEDEN FINLAND NORWAY ESTONIA R U S S I A DENMARK LITHUANIA LATVIA IRELAND PORTUGAL U. K. NETHERLANDS POLAND BELARUS GERMANY BELGIUM CZECH REP. UKRAINE
DIRECT MARKETING STRATEGY. Web & Software Development Services
 DIRECT MARKETING STRATEGY Web & Software Development Services Document created by : Rakesh Negi Business Development & Market Research Consultant New Delhi, India Skype: rakesh_negi1 MSN: rakesh_negi1@hotmail.com
European SME Export Report - FRANCE Export / import trends and behaviours of SMEs in France
 SOUS EMBARGO JUSQU AU 8 JUILLET A 8H00 European SME Export Report - FRANCE Export / import trends and behaviours of SMEs in France July 2015 European SME Export Report Small and medium-sized enterprises
July 2012 Decoding Global Investment Attitudes
 July 2012 Decoding Global Investment Attitudes Investment decisions and matters of personal wealth vary by gender, age and geographic region Globally, men are 36% more active than women with investments
99/2015-9 June 2015. EU28, euro area and United States GDP growth rates % change over the previous quarter
 2005Q1 2005Q2 2005Q3 2005Q4 2006Q1 2006Q2 2006Q3 2006Q4 2007Q1 2007Q2 2007Q3 2007Q4 2008Q1 2008Q2 2008Q3 2008Q4 2009Q1 2009Q2 2009Q3 2009Q4 2010Q1 2010Q2 2010Q3 2010Q4 2011Q1 2011Q2 2011Q3 2011Q4 2012Q1
Accuracy counts! SENSORS WITH ANALOG OUTPUT
 Accuracy counts! SENSORS WITH ANALOG OUTPUT OTHER APPLICATIONS: KEY ADVANTAGES: Distance measurement Positioning Profile detection Deformation monitoring Vibration monitoring Process monitoring Detection
Global Dynamism Index (GDI) 2013 summary report. Model developed by the Economist Intelligence Unit (EIU)
 2013 summary report. Model developed by the Economist Intelligence Unit (EIU)") Global Dynamism Index (GDI) 2013 summary report Model developed by the Economist Intelligence Unit (EIU) What is the Global Dynamism Index (GDI)? the GDI assesses the dynamism of 60 of the world's largest
Global Dynamism Index (GDI) 2013 summary report Model developed by the Economist Intelligence Unit (EIU) What is the Global Dynamism Index (GDI)? the GDI assesses the dynamism of 60 of the world's largest
Second Quarter and First Half 2015 Trading Update
 Second Quarter and First Half 2015 Trading Update Trading Performance Year-on-Year Gross Profit Reported ( m) Constant 2015 2014 % % Q2 145.3 137.1 +6.0% +10.6% H1 281.0 263.7 +6.6% +10.8% Q2 Gross Profit