Estimating Weighing Uncertainty From Balance Data Sheet Specifications
|
|
|
- Erin Knight
- 9 years ago
- Views:
Transcription
1 Estimating Weighing Uncertainty From Balance Data Sheet Specifications Sources Of Measurement Deviations And Uncertainties Determination Of The Combined Measurement Bias Estimation Of The Combined Measurement Uncertainty METTLER TOLEDO, Arthur Reichmuth March 000 Uncertainty & Specs 1.1

2 Abstract To a lesser or greater extent, the performance of any scale or balance is limited. These limitations are given in the specification sheet. It is common practice to accompany the measurement result with its uncertainty. This paper shows how the uncertainty of a weighing or the minimum allowable weight can be estimated from the specifications of a balance given in the data sheet. The model and assumptions used for this deduction, together with its limitations and neglections, are discussed.

3 1 Sources Of Measurement Deviations And Uncertainties Sources of measurement deviations and uncertainties with laboratory balances are (including, but not limited to): Readability rounding of the measurement value to the last digit inherently introduces quantization noise Repeatability noise of the electronic circuits (especially by the A/D converter s reference, predominantly 1/f and burst noise) wind draft at the site of the balance (especially with resolutions of 1mg and below) vibrations pressure fluctuations Non-Linearity kinematic non-linearities of the weighing cell, especially of the parallel guiding mechanism and the lever (where present) load dependent deformations of the weighing cell the electrodynamic transducer s inherent non-linearity between current and force non-linear A/D conversion Sensitivity Accuracy And Sensitivity Temperature Coefficient Adjustment tolerance, or determination accuracy, of the calibration weight Without re-calibration and adjustment: deviations induced by both temperature and spontaneous drift of the lever's mechanical advantage, the electrodynamic transducer s magnetic flux, and the A/D converter's reference
 load dependent deformations of the weighing cell the electrodynamic transducer s inherent non-linearity between current and force")
4 Determination Of The Combined Measurement Bias Systematic deviations (bias) of the balance's transfer characteristic from weighing load to reading provided, they are of systematic origin and invariable are eliminated either through adjustment after assembly, or measured and stored in the balance, such that these deviations can be compensated on-line by means of signal processing algorithms. These include: non-linearity correction correction of temperature influence (with on-line measurement of the temperature) correction of the calibration weight s adjustment deviation on-site adjustments for sensitivity and sometimes non-linearity with many balances The remaining deviations after adjustment or compensation are provided, they are of systematic origin too small by definition to be compensated (had they been large enough, they would have been compensated); are time dependent in an unknown manner (unknown systematic deviations); are caused by unknown ambient conditions (such as temperature or humidity); are of entirely unknown origin neither their source or amount, nor their course over time are known and therefore are by definition not identifiable as systematic deviations. Hence, these influences must be regarded as random contributions, and are treated here as such. Estimation Of The Combined Measurement Uncertainty The basis for the following strategy is derived from probability theory. From error analysis, it is known that the variances of multiple random influences on a measurement provided they are mutually independent, or at least uncorrelated may be added; this resulting sum of variances may be used as variance of all influences combined.
 correction of the calibration weight s adjustment deviation on-site")
5 3 We now apply this method to a balance, while considering the following influences: readability repeatability non-linearity sensitivity temperature coefficient (of sensitivity) However, we do not consider here influences caused by eccentric loading Readability The internal measurement value is generally rounded halfway between the readability steps d of the balance (4-5 rounding). The variance introduced by this process can be calculated as follows s RD = 1 1 d. unit: [g ] Generally, with laboratory balances the display step is smaller compared to repeatability. In this case, not only the uncertainty introduced by rounding may be neglected in favor of repeatability, but there is also no bias introduced. What is more, for practical reasons repeatability can not be determined isolated from the contribution of readability, since both their contributions will be measured at the same time 1 ). Without further notice, it is understood here that the uncertainty contribution from readability is included in the measurement or specification of the repeatability. Therefore, the readability s contribution as such need not be considered any further and therefore it will be dismissed here. ) Repeatability Repeatability of the balance is specified by the standard deviation. It is valid for one weighing and can usually be found in the data sheet. For some balance models there may be 1) Unless a smaller readability (smaller step size) is available when determining repeatability. In this case, the influence of readability can be eliminated. ) Particularly the ±1 count specification, often seen in this context, is inappropriate.
![The variance introduced by this process can be calculated as follows s RD = 1 1 d. unit: [g ] Generally, with laboratory balances the display step is smaller compared to repeatability.](/docs-images/46/21113823/images/page_5.jpg "In this case, not only the uncertainty introduced by rounding may be neglected in favor of repeatability, but there is also no bias introduced.")
6 4 multiple repeatability specifications given, ranked according to weighing load. This would reflect the fact that repeatability depends on total load (sum of tare and weighing sample), usually increasing with weighing load. The repeatability s variance that accompanies the weighing result equals the square of the repeatability specification s RP = SPC 3 RP ). unit: [g ] As a rule, the repeatability specification describes the corresponding property of the balance, not the one of the weighing object. To determine the repeatability specification, uncritical test loads are used, usually weight standards or other compact metal weights. If the weighing object possesses a large surface, or other properties detrimental to the weighing process, it may degrade the repeatability of the weighing process. In such cases, or when no figure for repeatability is available, it may be sensible to determine the repeatability on-site, preferably with the weighing object in question. With laboratory balances, a measurement series of ten weighings is usually carried out, which is evaluated as follows: s RP = n 1 1 n Σ i = 1 x i x., where unit: [g ] x i is a single measurement value (a weighing), obtained as the difference of the reading when the tare alone is placed on the weighing pan, and the reading when the tare and sample weight together are placed on the weighing pan (pair of readings, making up the weighing of an object 4 ); 3) SPC stands here, and in all following instances, for the value of a property's specification as given in the data sheet. 4) i) If there is no tare weight (such as a beaker, boat, or other container), the reading is taken with empty pan instead. ii) If the balance is re-zeroed at any load, then the first reading is zero, by definition. Consequently, the reading with the sample is then equal to the second reading (of the tare and sample weight), and the difference need not be calculated by the operator, as the balance took the first reading and has already subtracted it from the second reading.

7 n Σ 5 x= n 1 x i is the mean of this measurement series (or i = 1 weighings, i.e., differences of pairs of readings); n is the number of measurements (or weighings, i.e., differences of pairs of readings) 5 ). Non-Linearity The non-linearity of a balance can be read from the data sheet, too. This specification describes the largest deviation between the actual and the ideal, i.e., linear characteristic curve 6 ) SPC NL max y NL. As the characteristic curve of an individual balance, although a systematic deviation, is generally unknown to the user, we have to treat the actual deviation for any given load as a random contribution. Because the non-linearity specification only gives the limits within which the linearity deviation lies, we have to make an assumption about its random distribution to determine its variance. For lack of further knowledge, we assume here a uniform distribution of the non-linearity within the specified limits: p NL x = 1 SPC NL within SPC NL x SPC NL With this assumption we are able to evaluate an equivalent variance of the non-linearity: SPC NL = x p NL x dx = x 1 dx SPC NL s NL SPC NL SPC NL = SPC NL 5) Be aware, that even with as many as 10 weighings, the standard deviation derived from such a series may vary considerably, as its outcome is itself a random process, hence subject to stray. This applies even more with fewer weighings. 6) The characteristic curve of a balance is the relationship between displayed value and load. To get hold of a balance s characteristic curve, one has to load the balance from zero load to its full capacity, in small (enough) load steps, and record all corresponding readings.

8 6 = 1 SPC NL 1 3 x 3 SPC NL = 1 x SPC NL 6 SPC 3 SPC NL SPC NL = NL = 1 6SPC NL SPC NL 3 SPC NL 3 = 1 3 SPC NL [g ] Sensitivity (Deviation) With the assumption that the balance s sensitivity was adjusted with an internal or external calibration weight, we first have to deal with the weight s tolerance. Usually its deviation is given in the data sheet as a tolerance band SPC CAL max m CAL, and we find ourselves in the same situation as we were when deriving a variance for the non-linearity. With the same reasoning we can write for the variance of the calibration weight deviation s CAL = 1 3 SPC CAL. unit: [g ] Furthermore, as calibration can only take place through a weighing of the calibration weight, strictly speaking, we would have to consider the repeatability of this calibration weighing. However, calibration is a special case insofar as a special signal processing is applied to it, i.e., usually a stronger filtering and a longer measurement interval, thereby improving the repeatability of the calibration weighing. For practical reasons, this contribution may therefore be neglected, which we will do here. A further complication occurs if the calibration weight does not amount to the balance s full weighing capacity. When the calibration weight is smaller than the weighing capacity, the obtained calibration measurement is extrapolated to the corresponding calibration value at full capacity. Unfortunately, this calculation increases a potential linearity deviation occurring at the load of the calibration weight by the same factor. Particularly with precision balances, possessing weighing capacities of several kilograms, it is for practical reasons not always possible to build in a calibration weight equal to its full capacity. With analytical balances, on the other hand, the built-in calibration weight usually embraces the full weighing capacity of the balance.

9 7 We do not further pursue here the consequences of this contribution. Remark: As we will show later, it is sometimes more convenient to use the relative calibration deviation, instead of the absolute one. The relative deviation is the absolute deviation normalized to the mass of the calibration weight. The corresponding expressions are SPC CAL,rel = SPC CAL m CAL s CAL,rel = s CAL m = 1 3 CAL max SPC CAL m CAL m CAL m CAL unit: [1] unit: [1] Temperature Coefficient The temperature coefficient of sensitivity may also be taken from the data sheet (if this item is specified). This specification describes the largest static sensitivity deviation caused by a change in ambient temperature. SPC TCS max TC S. Again, we use the same procedure to obtain the variance from the band limits (see derivation under the linearity deviation) s TCS = 1 3 SPC TCS. unit: [1/K ] About the properties of the temperature excursion we can only speculate here. Unless there is additional knowledge available about the course of ambient temperature, the following assumptions seem reasonable: If the temperature at the location of the weighing is constant, we can drop the influence of the temperature (coefficient) altogether. The temperature excursion at the location of the weighing stays within a band of ±d t degrees. If an automatically induced calibration (for example FACT ) is active, then it is realistic to assume that a maximum temperature change of ± C may occur, before the balance gets adjusted.

10 8 In the latter two cases, the assumption d t max t, with d t C is justifiable, if we assume a temperature band of ± C (or ±K). For the variance of the ambient temperature we get using the well known assumption of uniform distribution s t = 1 3 d t. unit: [K ] We obtain the change of the balance s sensitivity as product of temperature coefficient and temperature change d TS = d TCS d t. unit: [1] As a last step, we need to determine the variance of this deviation. Because we have a product of two individual contributions, its derivation is not trivial. It can be shown, however, that the product of the variances is a reasonable approximation, which we will use here s TS = s TCS s t. Finally, we get s TS = 1 3 SPC 1 TCS 3 d t = 1 9 SPC TCSd t unit: [1]
![unit: [K ] We obtain the change of the balance s sensitivity as product of temperature coefficient and temperature change d TS = d TCS d t.](/docs-images/46/21113823/images/page_10.jpg "unit: [1] As a last step, we need to determine the variance of this deviation. Because we have a product of two individual contributions, its derivation is not trivial.")
11 9 Combination Of The Variances 7) The combined variance of all deviations considered, can now be obtained by adding all single variances of the individual deviations. s TOT n = s i i = 1. A required condition to justify this operation is statistical independence, or at least uncorrelatedness, between the single contributions. It can be shown that the individual causes for the balance s deviation from its ideal performance are independent from each other. All contributions to a single measurement the difference of a tare-weighing and a sample weighing (i.e., tare and weighing object) now produce the following result: Repeatability Repeatability is an absolute deviation and by definition was determined from the difference of pairs of readings. Therefore, its contribution to one weighing (i.e., difference of two readings) is the simple variance s RP. unit: [g ] Non-Linearity Non-linearity is an absolute deviation. It occurs when weighing the tare, as well as the sample (tare and weighing ob- 7) We do not consider corner load deviations that may occur, if the weighing object is not placed in the center of the weighing pan. (If the weighing object is placed in the center of the platform, this deviation vanishes.) Neither do we consider any other influences on the weighing process, besides those explicitly stated in the text. Particularly, we do not consider influences such as (including, but not limited to): ambient climate (rapid temperature change, humidity change), air draft, pressure fluctuation, heat radiation, mechanical influence (leveling, vibration), electromagnetic influence (electrostatic or magnetic), air buoyancy. In case of such influences, the effects have to be dealt with separately.

12 10 ject) 8 ). Since the two loadings are statistically independent 9 ), their contribution is twice the variance s NL. unit: [g ] Tolerance Of Calibration Weight The normalized calibration weight tolerance is a relative deviation. The deviation of a weighing (i.e., difference of pair of readings) is proportional to the sample weight m. Its contribution is the simple variance times the square of the sample weight s CAL,rel m. unit: [g ] Sensitivity Drift Sensitivity temperature drift is a relative deviation. The deviation of a weighing (i.e., difference of pair of readings) is proportional to the sample weight m. Its contribution is the simple variance times the square of the sample weight s TS m. unit: [g ] Total Variance Under these assumptions, we get for the combined variance of a weighing (i.e., difference of pair of readings) s = s RP +s NL +s CAL,rel m +s TS m = = s RP +s NL +m s CAL,rel +s TS. We now substitute the variances with their previously determined expressions and obtain s = SPC RP + 3 SPC NL m SPC CAL,rel SPC TCSd t unit: [g ] Total Variance, Normalized To Sample Weight Most often we are interested in the normalized variance, i.e., the quotient of absolute variance and sample weight. We find 8) With the exception of weighings that include either zero load, full capacity, or weighings with zero sample weight. All three cases are but of academic interest, therefore they are not considered here. 9) There may be a dependence of the readings for small samples. If there is knowledge about such a correlation, it can be used; here, we do not consider it for the sake of simplicity.
![Its contribution is the simple variance times the square of the sample weight s CAL,rel m. unit: [g ] Sensitivity Drift Sensitivity temperature drift is a relative deviation.](/docs-images/46/21113823/images/page_12.jpg "The deviation of a weighing (i.e., difference of pair of readings) is proportional to the sample weight m. Its contribution is the simple variance times the square of the sample weight s TS m.")
13 11 this value by dividing the former expression by the square of the sample mass s rel = s m = = 1 m SPC RP + 3 SPC NL SPC CAL,rel SPC TCSd t unit: [1] From this variance, we can derive the normalized standard deviation for one weighing (i.e., difference of pair of readings). This yields s rel = = 1 m SPC RP + 3 SPC NL SPC CAL,rel SPC TCSd t 10) unit: [1] Measurement Uncertainty It is reasonable to assume that a balance s combined measurement deviation resembles a normal distribution. As one of its justifications we mention the fact that some contributions themselves are normally distributed already (e.g., repeatability). A second reason is that there are multiple contributing sources of independent deviations which favors a normal distribution of their combined deviation. From the combined standard deviation we can determine an uncertainty interval from the laws of normal distribution, provided a confidence level is given. We first derive from the confidence level the expansion (or coverage) factor k, i.e., the quotient relating uncertainty to the standard deviation k P = u s, 10) This combined standard deviation considers the influences of repeatability, non-linearity, calibration weight adjustment and temperature coefficient, under the assumption of a temperature band. Not considered are, among others, eccentric load and deviation due to calibration weights not comprising the weighing capacity.
![This yields s rel = = 1 m SPC RP + 3 SPC NL + 1 3 SPC CAL,rel + 1 3 SPC TCSd t 10) unit: [1] Measurement Uncertainty It is reasonable to assume that a balance s combined measurement deviation](/docs-images/46/21113823/images/page_13.jpg "resembles a normal distribution. As one of its justifications we mention the fact that some contributions themselves are normally distributed already (e.g., repeatability).")
14 1 which is a function of the confidence level P 11 ). Multiplying the standard deviation with this factor yields the (single sided) uncertainty interval u = k P s. Hence, with a probability of P, the true value can be assumed to lie between the limits R u m R+u where R is the weighing result (i.e., the difference of two readings), and m the true sample weight 1 ). With a probability of Q = 1 P the true value will lie outside these limits. Example: Determining The Weighing Uncertainty On An Analytical Balance Balance Type: AT01: 00g/0.01mg Using this balance, a sample of 1g shall be weighed in a 190g container. What is the resulting uncertainty of this weighing, conforming to a 95% confidence level? 11) Expansion Factor Confidence Level Expected Missing (Single Sided) (Expectation Prob.) Probability k P Q=1 P % 31.73% % 10% % 5% 95.45% 4.55% % 1% % 0.7% % 0.006% % % 1) To keep things simple, we have consequently refrained from determining, or correcting for, the degree of freedom. Of course, nothing stands against the notion of correcting for the degree of freedom, if it is known of all individual contributions. An instruction for how to determine the correction factor can be found in Guide To The Expression Of Uncertainty In Measurement, first edition [1995], ISBN

15 13 Specifications from data sheet Spec (SPC) SPC Readability 0.01mg 1x10 10 g Repeatability up to 50g 0.015mg.3x10 10 g 50-00g 0.04mg 1.6x10 9 g Non-Linearity within 10g 0.03mg 9x10 10 g within 00g 0.1mg 1.4x10 8 g Calibration Weight Tolerance 1.5ppm.3x10 1 Temperature Coefficient 1.5ppm/K.3x10 1 K Environment (Assumption) Spec (SPC) SPC Ambient Temp. Excursion K 4 K The formula valid for the combined normalized standard deviation for a single sample weighing is s rel = 1 m SPC RP + 3 SPC NL SPC CAL,rel SPC TCS d t As the repeatability specification at 191g is unavailable, we use the 00g specification instead. Thus, we obtain as standard deviation for a 1g sample: s rel = 1 1g g g K 4K = = = Conclusion: The mass of a 1g sample, weighed in a 00g container, can be determined on this balance with a relative standard deviation of approximately s rel < Based on a confidence level of 95%, the corresponding uncertainty amounts to twice the standard deviation, namely u rel = s rel = Remark: It can be seen from this example that with small sample weights 13 ) the contribution to uncertainty originating from the balance s sensitivity (calibration weight tolerance and un- 13) small compared to the balance s weighing capacity

16 14
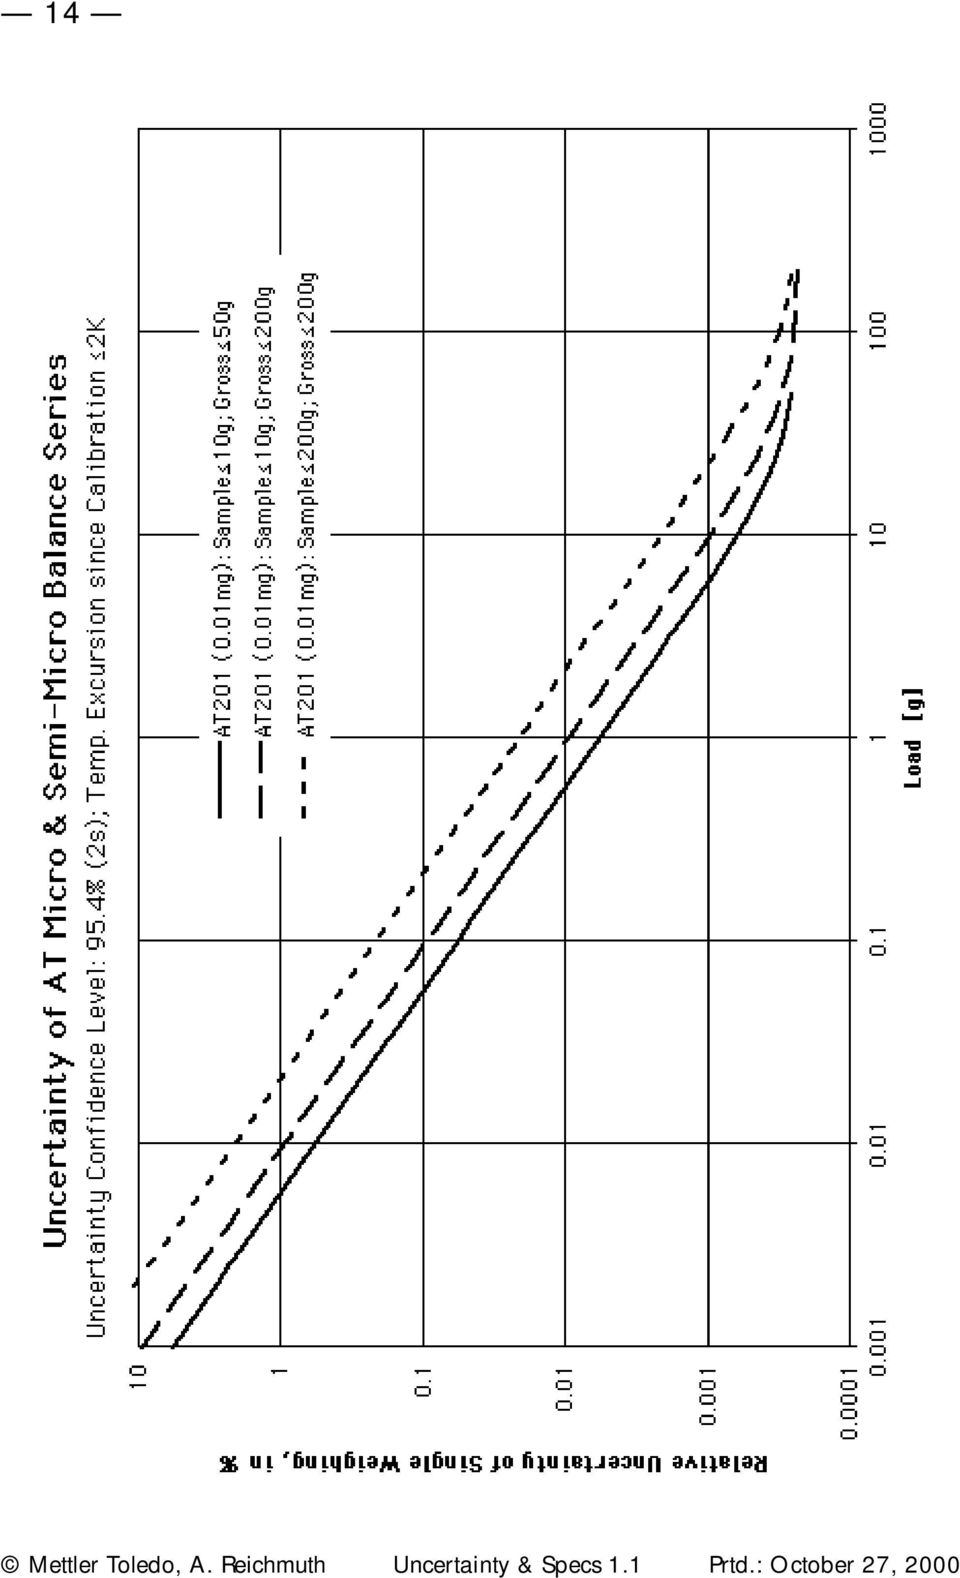
17 15 certainty due to drifting temperature) are minor, compared to those stemming from repeatability and non-linearity. This applies to most balance types. We will use this property later when determining the minimum sample weight. The diagram on the opposite page shows the relative uncertainty versus sample weight and (total) load, respectively. Minimum Sample Weight The minimum sample weight to be weighed conformally on a balance (a.k.a. minimum (sample) weight ) can be estimated, provided the specifications of the balance, as well as the uncertainty and confidence level to be met, are given. To this end, we need once more the expansion factor k, this time as quotient of relative uncertainty and relative standard deviation k P = u rel = u /m s rel s/m = u, s which is clearly the same function of the confidence level P as introduced above. From the required properties of the sample weighing, namely the relative uncertainty and the confidence level, from which the expansion factor was determined, we derive the standard deviation s rel = u rel. k( P) The formula used in the previous chapter for the relative standard deviation we now solve for the sample weight m. We obtain m = SPC RP + 3 SPC NL s rel 1 3 SPC CAL,rel SPC TCSd t 1 m MIN. Substituting the expression for the relative standard deviation yields for the minimum sample weight m MIN u rel k( P) SPC RP + 3 SPC NL 1 3 SPC CAL,rel SPC TCSd t 1.

18 16 Approximations Revisiting the figures of the previous example, we recognize that with a sample weight of 1 /00 of the weighing capacity, the variance of the sensitivity deviation, calibration weight tolerance and temperature coefficient, equals , an amount negligible compared to the variance due to repeatability and non-linearity ( ). It may be presumed, that this be the case for all small sample weights. We will show that this is true. Taking the radicand of the relative uncertainty 1 m SPC RP + 3 SPC NL SPC CAL,rel SPC TCSd t and expanding it by m, we get SPC RP + 3 SPC NL + m 3 SPC CAL,rel SPC TCSd t According to the assumption, that m is small (minimum sample weight!), a fact which is even more true for its square ( m ), we may drop the second term in favor of the first, and we get as an approximation s 1 rel m SPC RP + 3 SPC NL = = m 1 SPC RP + 3 SPC NL (valid for small samples). Respecting the previous requirements, we determine from this formula the approximate sample weight to be m 1 MIN SPC s RP + 3 SPC NL = rel = u k SPC RP + rel 3 SPC NL (valid for small samples). From this we conclude that the minimum sample weight is essentially determined by the two specifications of repeatability and non-linearity; calibration weight tolerance and temperature coefficient do not occur in the formula. Traditionally, sensitivity adjustment is given too much attention when dealing with small sample weights: With the exception of

19 17 weighing heavy samples 14 ), sensitivity plays but an inferior role. If, for any reason, additional information is available about the linearity deviation of a balance which shows that nonlinearity is inferior compared to repeatability, the contribution of non-linearity may be neglected, too. Such information could be gained by on-site measurements, or could stem from other sources. If the non-linearity specification (SPC NL ) is 1 / of the repeatability spec (SPC RP ), its contribution reduces to 14% of the combined uncertainty, if non-linearity amounts to 1 /3 of repeatability, its contribution is 7%. Regarding these figures, one may decide to drop this term altogether. In this case the formula for minimum weight would reduce to m MIN = k u rel SPC RP = k u rel SPC RP (valid for small non-linearity). Example: Determining The Minimum Sample Weight On An Analytical Balance Balance Type: AT01: 00g/0.01mg What is the minimum sample weight required using a 190g container, observing a relative uncertainty of 0.1% at a confidence level of 95% (corresponding to k )? Specifications from data sheet Spec (SPC) SPC Readability 0.01mg 1x10 10 g Repeatability up to 50g 0.015mg.3x10 10 g 50-00g 0.04mg 1.6x10 9 g Non-Linearity within 10g 0.03mg 9x10 10 g within 00g 0.1mg 1.4x10 8 g Calibration Weight Tolerance 1.5ppm.3x10 1 Temperature Coefficient 1.5ppm/K.3x10 1 K Environment (Assumption) Spec (SPC) SPC Ambient Temp. Excursion K 4 K 14) usually larger than 1 /10 to 1 /4 of the balance s weighing capacity, yet independent of total load
 is 1 / of the repeatability spec (SPC RP ), its contribution reduces to 14% of the combined uncertainty, if non-linearity amounts to 1 /3 of")
20 18 Since we are dealing here with a minimum sample weight, we may use the approximation formula m k MIN SPC u RP + 3 SPC NL. rel As the repeatability specification at 191g is unavailable, we use the 00g specification instead. Thus, we obtain as a minimum sample mass m MIN g g = g = = g = g = 94 mg. If the sample amounts to about 100mg or more, then we can be assured that the given requirements, namely the mass determination with 0.1% uncertainty at 95% confidence, can be achieved on this balance. If we had additional information about this balance, such that its linearity deviation is smaller than 0.0mg, this figure would amount to 1 / of repeatability (0.04mg). In this case, its contribution is small, as can be seen m MIN g g = = g g = g = = g = 86 mg, and we may decide to neglect it after all. We then have as a minimal weight estimation m MIN mg = mg = 80 mg.

21 19 Conclusion In many instances, the weighing result needs to be qualified. To this end, the measurement uncertainty accompanying the weighing process is required, but usually not readily available, not least because it is dependent on the application at hand. At other times, the operator needs to know the minimum amount of mass he/she is able to conformally weigh to a required relative uncertainty and confidence level (minimum weight). This paper explains how uncertainty and minimum weight can be estimated from the data sheet specifications of a balance. The assumptions and restrictions, under which this deduction is valid, as well as when, and under which conditions, neglections can be made, are discussed. Two examples with actual data from analytical balances are given as illustrations. The theory and examples provided enables the user to estimate the appropriate figures of uncertainty or minimum sample weight for his/her balance application.
Balance Accuracy. FlexiWeigh
 FlexiWeigh The balance is an integral part of the FlexiWeigh workstation. The role and limitations of the balance are important to understand in this environment. This technical note describes the different
OMCL Network of the Council of Europe QUALITY MANAGEMENT DOCUMENT
 OMCL Network of the Council of Europe QUALITY MANAGEMENT DOCUMENT PA/PH/OMCL (12) 77 7R QUALIFICATION OF EQUIPMENT ANNEX 8: QUALIFICATION OF BALANCES Full document title and reference Document type Qualification
Estimates of Uncertainty of the Calibration of Balances
 Estimates of Uncertainty of the Calibration of Balances Chart shows the uncertainty (estimates) of the calibration of representative electronic balances. Chart. Uncertainty of calibration (estimates) Minimum
User checks and maintenance of laboratory balances
 Technical Note 13 March 2014 Issued: July 1995 Amended and reissued: July 2005, July 2007, October 2007, May 2010, March 2013, March 2014 User checks and maintenance of laboratory balances Copyright National
Training Material for Balances (1) Prepared by R&D Division 1. Marketing Department A&D Company, Limited
 Prepared by R&D Division 1. Marketing Department A&D Company, Limited") Training Material for Balances (1) Prepared by R&D Division 1 Marketing Department A&D Company, Limited 1 Contents Things you should know before using a balance --------------------------- P.3 1. Convection
Training Material for Balances (1) Prepared by R&D Division 1 Marketing Department A&D Company, Limited 1 Contents Things you should know before using a balance --------------------------- P.3 1. Convection
Procon Engineering. Technical Document PELR 1002. TERMS and DEFINITIONS
 Procon Engineering Technical Document PELR 1002 TERMS and DEFINITIONS The following terms are widely used in the weighing industry. Informal comment on terms is in italics and is not part of the formal
AP Physics 1 and 2 Lab Investigations
 AP Physics 1 and 2 Lab Investigations Student Guide to Data Analysis New York, NY. College Board, Advanced Placement, Advanced Placement Program, AP, AP Central, and the acorn logo are registered trademarks
COMMUNICATING using MEASUREMENTS In Engineering we use a great many measuring instruments.
 COMMUNICATING using MEASUREMENTS In Engineering we use a great many measuring instruments. Scales Verniers Micrometers Gauges Comparators Thermometers Thermistors + Indicator Thermocouples + Indicator
Gravimetric determination of pipette errors
 Gravimetric determination of pipette errors In chemical measurements (for instance in titrimetric analysis) it is very important to precisely measure amount of liquid, the measurement is performed with
99.37, 99.38, 99.38, 99.39, 99.39, 99.39, 99.39, 99.40, 99.41, 99.42 cm
 Error Analysis and the Gaussian Distribution In experimental science theory lives or dies based on the results of experimental evidence and thus the analysis of this evidence is a critical part of the
Assessment of Accuracy and Precision
 2 chapter Assessment of Accuracy and Precision S.S. Nielsen, Food Analysis Laboratory Manual, Food Science Texts Series, DOI 10.1007/978-1-4419-1463-7_2, Springer Science+Business Media, LLC 2010 9 Chapter
Statistical estimation using confidence intervals
 0894PP_ch06 15/3/02 11:02 am Page 135 6 Statistical estimation using confidence intervals In Chapter 2, the concept of the central nature and variability of data and the methods by which these two phenomena
Force measurement. Forces VECTORIAL ISSUES ACTION ET RÉACTION ISOSTATISM
 Force measurement Forces VECTORIAL ISSUES In classical mechanics, a force is defined as "an action capable of modifying the quantity of movement of a material point". Therefore, a force has the attributes
The Effects of Start Prices on the Performance of the Certainty Equivalent Pricing Policy
 BMI Paper The Effects of Start Prices on the Performance of the Certainty Equivalent Pricing Policy Faculty of Sciences VU University Amsterdam De Boelelaan 1081 1081 HV Amsterdam Netherlands Author: R.D.R.
American Association for Laboratory Accreditation
 Page 1 of 12 The examples provided are intended to demonstrate ways to implement the A2LA policies for the estimation of measurement uncertainty for methods that use counting for determining the number
Balance Calibration A Method for Assigning a Direct-Reading Uncertainty to an Electronic Balance
 INL/CON-10-18643 PREPRINT Balance Calibration A Method for Assigning a Direct-Reading Uncertainty to an Electronic Balance 2010 NCSL International Workshop and Symposium Michael Stears July 2010 This is
The Analytical Balance
 Chemistry 119: Experiment 1 The Analytical Balance Operation of the Single-Pan Analytical Balance Receive instruction from your teaching assistant concerning the proper operation of the Sartorius BP 210S
Measurement and Calibration
 Adapted from: H. A. Neidig and J. N. Spencer Modular Laboratory Program in Chemistry Thompson Learning;, University of Pittsburgh Chemistry 0110 Laboratory Manual, 1998. Purpose To gain an understanding
Spectrophotometry and the Beer-Lambert Law: An Important Analytical Technique in Chemistry
 Spectrophotometry and the Beer-Lambert Law: An Important Analytical Technique in Chemistry Jon H. Hardesty, PhD and Bassam Attili, PhD Collin College Department of Chemistry Introduction: In the last lab
CALCULATIONS & STATISTICS
 CALCULATIONS & STATISTICS CALCULATION OF SCORES Conversion of 1-5 scale to 0-100 scores When you look at your report, you will notice that the scores are reported on a 0-100 scale, even though respondents
VALIDATION OF ANALYTICAL PROCEDURES: TEXT AND METHODOLOGY Q2(R1)
") INTERNATIONAL CONFERENCE ON HARMONISATION OF TECHNICAL REQUIREMENTS FOR REGISTRATION OF PHARMACEUTICALS FOR HUMAN USE ICH HARMONISED TRIPARTITE GUIDELINE VALIDATION OF ANALYTICAL PROCEDURES: TEXT AND METHODOLOGY
INTERNATIONAL CONFERENCE ON HARMONISATION OF TECHNICAL REQUIREMENTS FOR REGISTRATION OF PHARMACEUTICALS FOR HUMAN USE ICH HARMONISED TRIPARTITE GUIDELINE VALIDATION OF ANALYTICAL PROCEDURES: TEXT AND METHODOLOGY
HOW ACCURATE ARE THOSE THERMOCOUPLES?
 HOW ACCURATE ARE THOSE THERMOCOUPLES? Deggary N. Priest Priest & Associates Consulting, LLC INTRODUCTION Inevitably, during any QC Audit of the Laboratory s calibration procedures, the question of thermocouple
Good Weighing Practice In Pharmaceutical Industry. Pharmacy Risk Assessment For Mass Measurement Processes - 1 -
 Good Weighing Practice In Pharmaceutical Industry Pharmacy Risk Assessment For Mass Measurement Processes - 1 - Content Introduction...3 2. Measurement errors...4 2.1. Gross error...4 2.2. Systematic error...4
Sound Power Measurement
 Sound Power Measurement A sound source will radiate different sound powers in different environments, especially at low frequencies when the wavelength is comparable to the size of the room 1. Fortunately
Section 3. Sensor to ADC Design Example
 Section 3 Sensor to ADC Design Example 3-1 This section describes the design of a sensor to ADC system. The sensor measures temperature, and the measurement is interfaced into an ADC selected by the systems
LAB 4 INSTRUCTIONS CONFIDENCE INTERVALS AND HYPOTHESIS TESTING
 LAB 4 INSTRUCTIONS CONFIDENCE INTERVALS AND HYPOTHESIS TESTING In this lab you will explore the concept of a confidence interval and hypothesis testing through a simulation problem in engineering setting.
6.4 Logarithmic Equations and Inequalities
 6.4 Logarithmic Equations and Inequalities 459 6.4 Logarithmic Equations and Inequalities In Section 6.3 we solved equations and inequalities involving exponential functions using one of two basic strategies.
POLYNOMIAL FUNCTIONS
 POLYNOMIAL FUNCTIONS Polynomial Division.. 314 The Rational Zero Test.....317 Descarte s Rule of Signs... 319 The Remainder Theorem.....31 Finding all Zeros of a Polynomial Function.......33 Writing a
4. Continuous Random Variables, the Pareto and Normal Distributions
 4. Continuous Random Variables, the Pareto and Normal Distributions A continuous random variable X can take any value in a given range (e.g. height, weight, age). The distribution of a continuous random
Guidelines on the Calibration of Static Torque Measuring Devices
 European Association of National Metrology Institutes Guidelines on the Calibration of Static Torque Measuring Devices EURAMET cg-14 Version.0 (03/011) Previously EA-10/14 Calibration Guide EURAMET cg-14
Grammage of paper and paperboard (weight per unit area) (Revision of T 410 om-08) (underscores and strikeouts indicate changes from Draft 1)
 (Revision of T 410 om-08) (underscores and strikeouts indicate changes from Draft 1)") NOTICE: This is a DRAFT of a TAPPI Standard in ballot. Although available for public viewing, it is still under TAPPI s copyright and may not be reproduced or distributed without permission of TAPPI. This
NOTICE: This is a DRAFT of a TAPPI Standard in ballot. Although available for public viewing, it is still under TAPPI s copyright and may not be reproduced or distributed without permission of TAPPI. This
Glassware Calibration Guidelines Laura B. Secor and Dwight R. Stoll, 02/01/2012 Adapted from National Bureau of Standards Document 74-461
 Glassware Calibration Guidelines Laura B. Secor and Dwight R. Stoll, 02/0/202 Adapted from National Bureau of Standards Document 74-46 The purpose of calibrating glassware is to determine the volume of
A PRIMARY CALIBRATION SYSTEM FOR THE SUPPORT OF HIGH PERFORMANCE GAS FLOW TRANSFER STANDARDS
 Presented 2006 May 16-18 2006 ISFFM Queretaro, Mexico A PRIMARY CALIBRATION SYSTEM FOR THE SUPPORT OF HIGH PERFORMANCE GAS FLOW TRANSFER STANDARDS P. Delajoud, M. Bair, C. Rombouts, M. Girard DH Instruments,
Testing Your Laboratory Balance
 Testing Your Laboratory Balance If you use a laboratory balance in your day-to-day work, you may have wondered whether it is accurate. Here are four tests that you can use to confirm your instrument's
Validation and Calibration. Definitions and Terminology
 Validation and Calibration Definitions and Terminology ACCEPTANCE CRITERIA: The specifications and acceptance/rejection criteria, such as acceptable quality level and unacceptable quality level, with an
Guidance for Industry
 Guidance for Industry Q2B Validation of Analytical Procedures: Methodology November 1996 ICH Guidance for Industry Q2B Validation of Analytical Procedures: Methodology Additional copies are available from:
How to Verify Performance Specifications
 How to Verify Performance Specifications VERIFICATION OF PERFORMANCE SPECIFICATIONS In 2003, the Centers for Medicare and Medicaid Services (CMS) updated the CLIA 88 regulations. As a result of the updated
4 SENSORS. Example. A force of 1 N is exerted on a PZT5A disc of diameter 10 mm and thickness 1 mm. The resulting mechanical stress is:
 4 SENSORS The modern technical world demands the availability of sensors to measure and convert a variety of physical quantities into electrical signals. These signals can then be fed into data processing
Sample Analysis Design Step 2 Calibration/Standard Preparation Choice of calibration method dependent upon several factors:
 Step 2 Calibration/Standard Preparation Choice of calibration method dependent upon several factors: 1. potential matrix effects 2. number of samples 3. consistency of matrix across samples Step 2 Calibration/Standard
The Standard Normal distribution
 The Standard Normal distribution 21.2 Introduction Mass-produced items should conform to a specification. Usually, a mean is aimed for but due to random errors in the production process we set a tolerance
On Correlating Performance Metrics
 On Correlating Performance Metrics Yiping Ding and Chris Thornley BMC Software, Inc. Kenneth Newman BMC Software, Inc. University of Massachusetts, Boston Performance metrics and their measurements are
ICH Topic Q 2 (R1) Validation of Analytical Procedures: Text and Methodology. Step 5
 Validation of Analytical Procedures: Text and Methodology. Step 5") European Medicines Agency June 1995 CPMP/ICH/381/95 ICH Topic Q 2 (R1) Validation of Analytical Procedures: Text and Methodology Step 5 NOTE FOR GUIDANCE ON VALIDATION OF ANALYTICAL PROCEDURES: TEXT AND
European Medicines Agency June 1995 CPMP/ICH/381/95 ICH Topic Q 2 (R1) Validation of Analytical Procedures: Text and Methodology Step 5 NOTE FOR GUIDANCE ON VALIDATION OF ANALYTICAL PROCEDURES: TEXT AND
Measuring Line Edge Roughness: Fluctuations in Uncertainty
 Tutor6.doc: Version 5/6/08 T h e L i t h o g r a p h y E x p e r t (August 008) Measuring Line Edge Roughness: Fluctuations in Uncertainty Line edge roughness () is the deviation of a feature edge (as
Agilent AN 1316 Optimizing Spectrum Analyzer Amplitude Accuracy
 Agilent AN 1316 Optimizing Spectrum Analyzer Amplitude Accuracy Application Note RF & Microwave Spectrum Analyzers Table of Contents 3 3 4 4 5 7 8 8 13 13 14 16 16 Introduction Absolute versus relative
Experiment 1: Measurement and Density
 Experiment 1: Measurement and Density Chemistry 140 Learning Objectives Become familiar with laboratory equipment and glassware Begin to see the link between measurement and chemical knowledge Begin to
Simple Regression Theory II 2010 Samuel L. Baker
 SIMPLE REGRESSION THEORY II 1 Simple Regression Theory II 2010 Samuel L. Baker Assessing how good the regression equation is likely to be Assignment 1A gets into drawing inferences about how close the
Determining Measurement Uncertainty for Dimensional Measurements
 Determining Measurement Uncertainty for Dimensional Measurements The purpose of any measurement activity is to determine or quantify the size, location or amount of an object, substance or physical parameter
Keywords: Torque, calibration, uncertainty, torque tools, torque testers. Contents
 Measurement uncertainty in torque calibration Luca G. Bochese, ASQ CQE, CRE (Boch - Milano), [email protected], www.boch.net Dr. A. Bochese ( Feanor - Tallinn), [email protected], www.feanor.com Keywords: Torque,
Signal to Noise Instrumental Excel Assignment
 Signal to Noise Instrumental Excel Assignment Instrumental methods, as all techniques involved in physical measurements, are limited by both the precision and accuracy. The precision and accuracy of a
Experiment 6 ~ Joule Heating of a Resistor
 Experiment 6 ~ Joule Heating of a Resistor Introduction: The power P absorbed in an electrical resistor of resistance R, current I, and voltage V is given by P = I 2 R = V 2 /R = VI. Despite the fact that
UNCERTAINTY AND CONFIDENCE IN MEASUREMENT
 Ελληνικό Στατιστικό Ινστιτούτο Πρακτικά 8 ου Πανελληνίου Συνεδρίου Στατιστικής (2005) σελ.44-449 UNCERTAINTY AND CONFIDENCE IN MEASUREMENT Ioannis Kechagioglou Dept. of Applied Informatics, University
Accuracy and Pharmacutical
 Accuracy and Pharmacutical Solution Weighing Team Contents Weighing Errors Weighing Technology Accurate scale with Pharmaceutical Why is accuracy / precision important? Knowing the error of your results
Characterizing Digital Cameras with the Photon Transfer Curve
 Characterizing Digital Cameras with the Photon Transfer Curve By: David Gardner Summit Imaging (All rights reserved) Introduction Purchasing a camera for high performance imaging applications is frequently
STANDARD CLEANING AND CALIBRATION PROCEDURE FOR TGA-50(H) AND TGA-51(H)
 AND TGA-51(H)") STANDARD CLEANING AND CALIBRATION PROCEDURE FOR TGA-50(H) AND TGA-51(H) by Joseph F. Greenbeck, Jr. And Courtney W. Taylor INTRODUCTION The following procedure is to be used for the maintenance and calibration
STANDARD CLEANING AND CALIBRATION PROCEDURE FOR TGA-50(H) AND TGA-51(H) by Joseph F. Greenbeck, Jr. And Courtney W. Taylor INTRODUCTION The following procedure is to be used for the maintenance and calibration
X X X a) perfect linear correlation b) no correlation c) positive correlation (r = 1) (r = 0) (0 < r < 1)
 perfect linear correlation b) no correlation c) positive correlation (r = 1) (r = 0) (0 < r < 1)") CORRELATION AND REGRESSION / 47 CHAPTER EIGHT CORRELATION AND REGRESSION Correlation and regression are statistical methods that are commonly used in the medical literature to compare two or more variables.
CORRELATION AND REGRESSION / 47 CHAPTER EIGHT CORRELATION AND REGRESSION Correlation and regression are statistical methods that are commonly used in the medical literature to compare two or more variables.
An Overview of Calibration Methods and Procedures for Process and Inventory Weigh Systems
 BLH NOBEL Weighing Systems Brands of VPG Process Weighing Solutions for Process Weighing and Force Measurement Handbook TC0010 Procedures for Process and Inventory Weigh Systems Allen-Bradley Automation
Means, standard deviations and. and standard errors
 CHAPTER 4 Means, standard deviations and standard errors 4.1 Introduction Change of units 4.2 Mean, median and mode Coefficient of variation 4.3 Measures of variation 4.4 Calculating the mean and standard
Least-Squares Intersection of Lines
 Least-Squares Intersection of Lines Johannes Traa - UIUC 2013 This write-up derives the least-squares solution for the intersection of lines. In the general case, a set of lines will not intersect at a
Content Sheet 7-1: Overview of Quality Control for Quantitative Tests
 Content Sheet 7-1: Overview of Quality Control for Quantitative Tests Role in quality management system Quality Control (QC) is a component of process control, and is a major element of the quality management
CHAPTER 13 SIMPLE LINEAR REGRESSION. Opening Example. Simple Regression. Linear Regression
 Opening Example CHAPTER 13 SIMPLE LINEAR REGREION SIMPLE LINEAR REGREION! Simple Regression! Linear Regression Simple Regression Definition A regression model is a mathematical equation that descries the
Carbon Dioxide and an Argon + Nitrogen Mixture. Measurement of C p /C v for Argon, Nitrogen, Stephen Lucas 05/11/10
 Carbon Dioxide and an Argon + Nitrogen Mixture Measurement of C p /C v for Argon, Nitrogen, Stephen Lucas 05/11/10 Measurement of C p /C v for Argon, Nitrogen, Carbon Dioxide and an Argon + Nitrogen Mixture
AN INSTRUMENT FOR GRAVIMETRIC CALIBRATION OF FLOW DEVICES WITH CORROSIVE GASES. J. O. Hylton C. J. Remenyik Oak Ridge National Laboratory *
 AN INSTRUMENT FOR GRAVIMETRIC CALIBRATION OF FLOW DEVICES WITH CORROSIVE GASES J. O. Hylton C. J. Remenyik Oak Ridge National Laboratory * Paper prepared for the 4 th International Symposium on Fluid Flow
Normality Testing in Excel
 Normality Testing in Excel By Mark Harmon Copyright 2011 Mark Harmon No part of this publication may be reproduced or distributed without the express permission of the author. [email protected]
Uncertainty of Force Measurements
 European Association of National Metrology Institutes Uncertainty of Force Measurements EURAMET cg-4 Version.0 (03/011) Previously EA-10/04 Calibration Guide EURAMET cg-4 Version.0 (03/011) UNCERTAINTY
CHI-SQUARE: TESTING FOR GOODNESS OF FIT
 CHI-SQUARE: TESTING FOR GOODNESS OF FIT In the previous chapter we discussed procedures for fitting a hypothesized function to a set of experimental data points. Such procedures involve minimizing a quantity
The Do s and Don ts of Pressure Transducers
 The Do s and Don ts of Pressure Transducers ABSTRACT When specifying a pressure transducer for a process measurement, a number of items have to be considered. Some of the more important ones are discussed
Determination of g using a spring
 INTRODUCTION UNIVERSITY OF SURREY DEPARTMENT OF PHYSICS Level 1 Laboratory: Introduction Experiment Determination of g using a spring This experiment is designed to get you confident in using the quantitative
So, using the new notation, P X,Y (0,1) =.08 This is the value which the joint probability function for X and Y takes when X=0 and Y=1.
 =.08 This is the value which the joint probability function for X and Y takes when X=0 and Y=1.") Joint probabilit is the probabilit that the RVs & Y take values &. like the PDF of the two events, and. We will denote a joint probabilit function as P,Y (,) = P(= Y=) Marginal probabilit of is the probabilit
Joint probabilit is the probabilit that the RVs & Y take values &. like the PDF of the two events, and. We will denote a joint probabilit function as P,Y (,) = P(= Y=) Marginal probabilit of is the probabilit
G104 - Guide for Estimation of Measurement Uncertainty In Testing. December 2014
 Page 1 of 31 G104 - Guide for Estimation of Measurement Uncertainty In Testing December 2014 2014 by A2LA All rights reserved. No part of this document may be reproduced in any form or by any means without
Figure 1. A typical Laboratory Thermometer graduated in C.
 SIGNIFICANT FIGURES, EXPONENTS, AND SCIENTIFIC NOTATION 2004, 1990 by David A. Katz. All rights reserved. Permission for classroom use as long as the original copyright is included. 1. SIGNIFICANT FIGURES
Optical Encoders. K. Craig 1. Actuators & Sensors in Mechatronics. Optical Encoders
 Any transducer that generates a coded reading of a measurement can be termed an encoder. Shaft Encoders are digital transducers that are used for measuring angular displacements and velocities. Relative
Experiment #1, Analyze Data using Excel, Calculator and Graphs.
 Physics 182 - Fall 2014 - Experiment #1 1 Experiment #1, Analyze Data using Excel, Calculator and Graphs. 1 Purpose (5 Points, Including Title. Points apply to your lab report.) Before we start measuring
Method For Calculating Output Voltage Tolerances in Adjustable Regulators
 Method For Calculating Output Voltage Tolerances in Adjustable Regulators Introduction When working with voltage regulator circuits, the designer is often confronted with the need to calculate the tolerance
18.6.1 Terms concerned with internal quality control procedures
 18.6.1 Terms concerned with internal quality control procedures Quality assurance in analytical laboratories Quality assurance is the essential organisational infrastructure that underlies all reliable
Physics 41, Winter 1998 Lab 1 - The Current Balance. Theory
 Physics 41, Winter 1998 Lab 1 - The Current Balance Theory Consider a point at a perpendicular distance d from a long straight wire carrying a current I as shown in figure 1. If the wire is very long compared
Introduction to Error Analysis
 UNIVERSITÄT BASEL DEPARTEMENT CHEMIE Introduction to Error Analysis Physikalisch Chemisches Praktikum Dr. Nico Bruns, Dr. Katarzyna Kita, Dr. Corinne Vebert 2012 1. Why is error analysis important? First
Laboratory Report Scoring and Cover Sheet
 Laboratory Report Scoring and Cover Sheet Title of Lab _Newton s Laws Course and Lab Section Number: PHY 1103-100 Date _23 Sept 2014 Principle Investigator _Thomas Edison Co-Investigator _Nikola Tesla
Integration. Topic: Trapezoidal Rule. Major: General Engineering. Author: Autar Kaw, Charlie Barker. http://numericalmethods.eng.usf.
 Integration Topic: Trapezoidal Rule Major: General Engineering Author: Autar Kaw, Charlie Barker 1 What is Integration Integration: The process of measuring the area under a function plotted on a graph.
Module 1, Lesson 3 Temperature vs. resistance characteristics of a thermistor. Teacher. 45 minutes
 Module 1, Lesson 3 Temperature vs. resistance characteristics of a thermistor 45 minutes Teacher Purpose of this lesson How thermistors are used to measure temperature. Using a multimeter to measure the
NCSS Statistical Software Principal Components Regression. In ordinary least squares, the regression coefficients are estimated using the formula ( )
") Chapter 340 Principal Components Regression Introduction is a technique for analyzing multiple regression data that suffer from multicollinearity. When multicollinearity occurs, least squares estimates
Chapter 340 Principal Components Regression Introduction is a technique for analyzing multiple regression data that suffer from multicollinearity. When multicollinearity occurs, least squares estimates
DEFINING AND COMPUTING EQUIVALENT INDUCTANCES OF GAPPED IRON CORE REACTORS
 ISEF 20 - XV International Symposium on Electromagnetic Fields in Mechatronics, Electrical and Electronic Engineering Funchal, Madeira, September -3, 20 DEFINING AND COMPUTING EQUIVALENT INDUCTANCES OF
Measurement Systems Correlation MSC for Suppliers
 Measurement Systems Correlation MSC for Suppliers Copyright 2003-2007 Raytheon Company. All rights reserved. R6σ is a Raytheon trademark registered in the United States and Europe. Raytheon Six Sigma is
Chapter 3 RANDOM VARIATE GENERATION
 Chapter 3 RANDOM VARIATE GENERATION In order to do a Monte Carlo simulation either by hand or by computer, techniques must be developed for generating values of random variables having known distributions.
Week 4: Standard Error and Confidence Intervals
 Health Sciences M.Sc. Programme Applied Biostatistics Week 4: Standard Error and Confidence Intervals Sampling Most research data come from subjects we think of as samples drawn from a larger population.
Coupling Magnetic Signals to a SQUID Amplifier
 SQUID Application Note 105-0 Coupling Magnetic Signals to a SQUID Amplifier Matching the effective inductances of the Pickup Coil and the Input Coil to detect and couple magnetic flux maximizes the sensitivity
Forecasting in supply chains
 1 Forecasting in supply chains Role of demand forecasting Effective transportation system or supply chain design is predicated on the availability of accurate inputs to the modeling process. One of the
5.1 Identifying the Target Parameter
 University of California, Davis Department of Statistics Summer Session II Statistics 13 August 20, 2012 Date of latest update: August 20 Lecture 5: Estimation with Confidence intervals 5.1 Identifying
Application Note for SDP600 and SDP1000 Series Measuring Differential Pressure and Air Volume with Sensirion s CMOSens technology
 Application Note for SDP600 and SDP1000 Series Measuring Differential Pressure and Air Volume with Sensirion s CMOSens technology Summary The increasing customer requirements for comfort and safety and
Statistical Confidence Calculations
 Statistical Confidence Calculations Statistical Methodology Omniture Test&Target utilizes standard statistics to calculate confidence, confidence intervals, and lift for each campaign. The student s T
Check-list for auditors. Audit visit at candidate registered laboratories
 Check-list for auditors Audit visit at candidate registered laboratories 1 Contents Introduction Laboratory documentation required by the standard(s), available for inspection by the auditor Items to be
IAS CALIBRATION and TESTING LABORATORY ACCREDITATION PROGRAMS DEFINITIONS
 REFERENCES NIST Special Publication 330 IAS CALIBRATION and TESTING LABORATORY ACCREDITATION PROGRAMS DEFINITIONS Revised October 2013 International vocabulary of metrology Basic and general concepts and
LINEAR EQUATIONS IN TWO VARIABLES
 66 MATHEMATICS CHAPTER 4 LINEAR EQUATIONS IN TWO VARIABLES The principal use of the Analytic Art is to bring Mathematical Problems to Equations and to exhibit those Equations in the most simple terms that
Basic RTD Measurements. Basics of Resistance Temperature Detectors
 Basic RTD Measurements Basics of Resistance Temperature Detectors Platinum RTD resistances range from about 10 O for a birdcage configuration to 10k O for a film type, but the most common is 100 O at 0
Calibration of Volumetric Glassware
 CHEM 311L Quantitative Analysis Laboratory Revision 2.3 Calibration of Volumetric Glassware In this laboratory exercise, we will calibrate the three types of glassware typically used by an analytical chemist;
Application Note. So You Need to Measure Some Inductors?
 So You Need to Measure Some nductors? Take a look at the 1910 nductance Analyzer. Although specifically designed for production testing of inductors and coils, in addition to measuring inductance (L),
Applying Statistics Recommended by Regulatory Documents
 Applying Statistics Recommended by Regulatory Documents Steven Walfish President, Statistical Outsourcing Services [email protected] 301-325 325-31293129 About the Speaker Mr. Steven
Digital pressure gauge for industrial applications Model DG-10-S, Standard version Model DG-10-E, Enhanced version
 Electronic pressure measurement Digital pressure gauge for industrial applications Model DG-10-S, Standard version Model DG-10-E, Enhanced version WIKA data sheet PE 81.66 Applications Machine building
Regression III: Advanced Methods
 Lecture 16: Generalized Additive Models Regression III: Advanced Methods Bill Jacoby Michigan State University http://polisci.msu.edu/jacoby/icpsr/regress3 Goals of the Lecture Introduce Additive Models
DESCRIPTIVE STATISTICS. The purpose of statistics is to condense raw data to make it easier to answer specific questions; test hypotheses.
 DESCRIPTIVE STATISTICS The purpose of statistics is to condense raw data to make it easier to answer specific questions; test hypotheses. DESCRIPTIVE VS. INFERENTIAL STATISTICS Descriptive To organize,