Bandwidth Selection for Nonparametric Distribution Estimation
|
|
|
- Maryann Horton
- 7 years ago
- Views:
Transcription
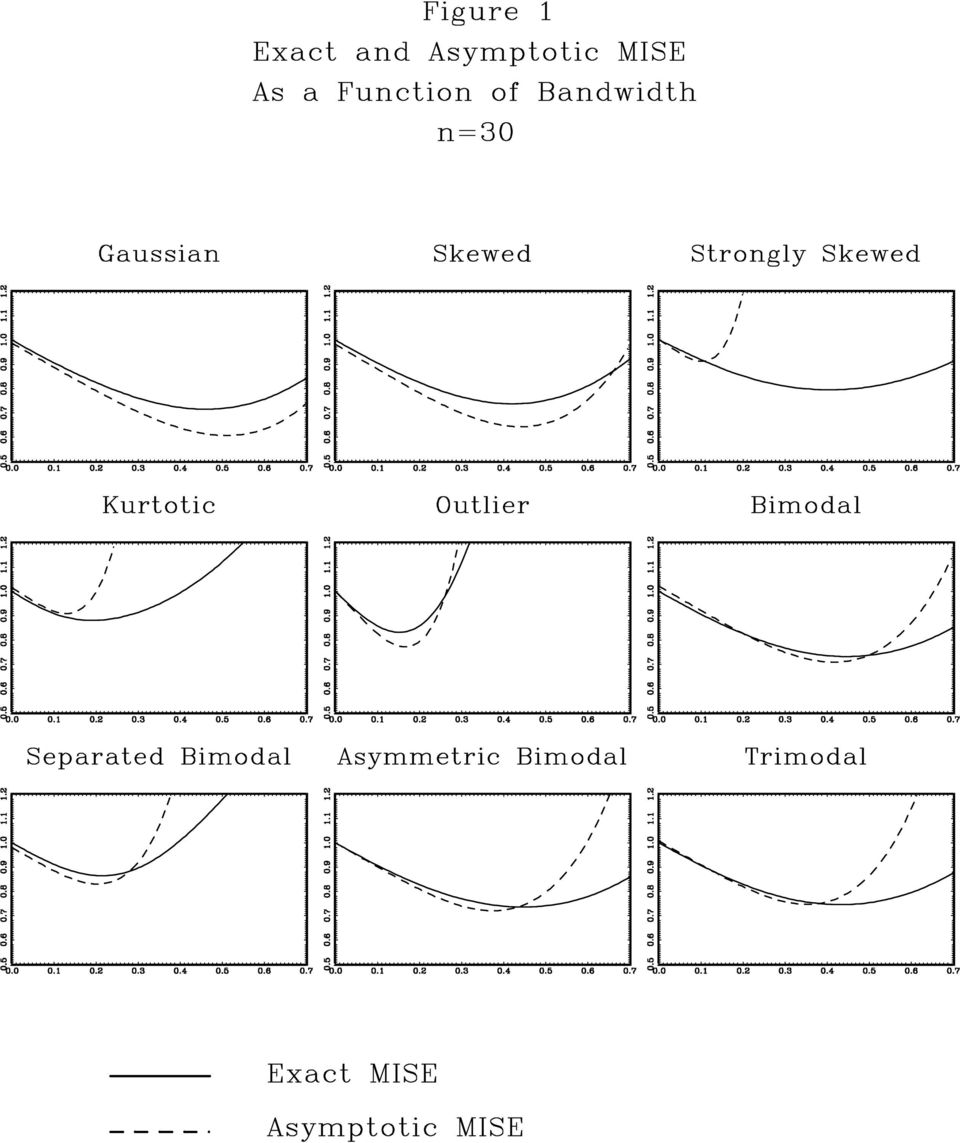
1 Bandwidth Selection for Nonparametric Distribution Estimation Bruce E. Hansen University of Wisconsin May 2004 Abstract The mean-square efficiency of cumulative distribution function estimation can be improved through kernel smoothing. We propose a plug-in bandwidth rule, which minimizes an estimate of the asymptotic mean integrated squared error. Research supported by the National Science Foundation. Department of Economics, 1180 Observatory Drive, University of Wisconsin, Madison, WI

2 1 Introduction The classic nonparametric estimator of the distribution function is the empirical distribution function (EDF). This estimator is widely used in practice despite the known fact that smoothing can produce efficiency gains in finite samples. Proposals to use kernel smoothing for distribution estimation dates back to Nadaraya (1964), and demonstrations of the resulting asymptotic efficiency gains include Azzalini (1981), Reiss (1981), and Jin and Shao (1999). Kernel smoothing requires the choice of a bandwidth parameter. This choice is critical, as under- or over-smoothing can substantially reduce precision. A cross-validation selection method was proposed by Sarda (1993), but this method has deficiencies as shown by Altman and Leger (1995). The latter proposed a plug-in estimate which minimizes an estimate of the mean weighted integrated squared error, using the density function as a weight function. This weighting choice can result in oversmoothing in the tails, whose sampling error has been downweighted. Instead, our measure of precision is the unweighted mean integrated squared error (MISE). This results in a simple expression for the MISE, as shown by Jones (1990). The optimal bandwidth only depends on the roughness of the first derivative of the density, which is straightforward to estimate. We show how to construct reference and plug-in estimators of the optimal bandwidth. A simulation study illustrates the gains achieved by smoothing. Gauss code to implement the method is available on the author s webpage. 2 Distribution Estimation For a random variable Y with random sample {Y 1,..., Y n } let F (y) denote its distribution function, f(y) the density, and f (m) (y) its m th derivative. Let Z ³ R m = f (m) (y) 2 dy (1) denote the roughness of f (m). Furthermore, let φ(y) and Φ(y) denote the standard normal density and distribution, respectively. Let k(x) denote any symmetric 2 0 nd order kernel normalized to have unit variance. (That is, R x2 k(x)dx = 1.) For a bandwidth h>0 let k h (u) =h 1 k(u/h). The kernel estimator of f(y) is ˆf h (y) = 1 n nx k h (y Y i ). (2) i=1 The density estimator can be integrated to obtain the smoothed distribution function (SDF) estimator of F (x) ˆF h (y) = Z y ˆf h (u)du = 1 n nx K h (y Y i ) i=1 1
. Kernel smoothing requires the choice of a bandwidth parameter. This choice is critical, as under- or over-smoothing can substantially reduce precision.")
3 where K(x) = Z x k(u)du is the integrated kernel and K h (u) =K(u/h). For example, if k(x) =φ(x) then K(x) =Φ(x). As shown by Jones (1990) if hn 1/2 as n then AMISE(h) = Z E ³ ˆF h (y) F (y) 2 dy = V n hψ n + h4 R 1 4 where V = R F (y)(1 F (y))dy, R 1 is definedin(1) and Z ψ =2 xk(x)k(x)dx > 0 + O(h 4 ) is a constant which depends only on the kernel. For example, if k(x) =φ(x), then ψ = 1/ π. The AMISE is minimized by setting h equal to The optimal AMISE is h 0 =(ψ/r 1 ) 1/3 n 1/3. (3) AMISE(h 0 )= V n 3ψ4/3 n 4/3 4R 1/3 1 which is lower than that of the EDF. From this expression we learn the following. First, while the improvement over the SDF disappears as n, it does so at the slow rate of n 1/3, which suggests that the SDF may have meaningful finite sample gains over the EDF. Second, the improvement of the SDF is inversely proportional to R 1. Thus we expect the gains to be minimal when the density is steep. Third, the choice of kernel k only affects the AMISE through ψ (larger values reduce the AMISE). As shown by Jones (1990), this is maximized by the uniform kernel, but the difference relative to other standard kernels is small and is unlikely to have a small sample effect on efficiency. 3 Bandwidth Selection The AMISE optimal bandwidth (3) depends on the unknown roughness R 1. A simple choice is a normal scale estimate. If f = φ σ then Z ³ Z R 1 = φ (1) 2 1 σ (y) dx = σ 3 y 2 φ(y) 2 1 dx = σ 3 4 π. Thus a reference bandwidth is ĥ 0 =ˆσ 4 πψ 1/3 n 1/3 (4) 2
 AMISE(h 0 )= V n 3ψ4/3 n 4/3 4R 1/3 1 which is lower than that of the EDF. From this expression we learn the following.")
4 where ˆσ is the sample standard deviation. In particular, for the normal kernel (k = φ) then ĥ1 = 1.59ˆσn 1/3. The reference bandwidth, however, may work poorly for distributions which are far from the normal. A plug-in bandwidth replaces R 1 in (3) by an estimate. Efficient estimation relies on knowledge of higher order derivatives. By repeated integration by parts, R m as definedin(1) equals the expectation Z R m = ( 1) m f (2m) (y)f(y)dy An estimate of f (2m) (y) using a Gaussian kernel with bandwidth a is = ( 1) m Ef (2m) (Y ). (5) ˆf a (2m) (y) = 1 n Computationally, it is useful to observe that ³ y ³ y φ (2m) a (y) =a (1+2m) He 2m φ a a nx i=1 φ (2m) a (y Y i ). (6) where He m (x) is the m 0 th Hermite polynomial, the orthogonal polynomials with respect to φ(x). For example, He 0 (x) =1,He 1 (x) =x, and He 2 (x) =x 2 1. The Hermite polynomials satisfy the recursive relation He m+1 (x) =xhe m (x) mhe m 1 (x). Equations (5) and (6) motivate the Jones and Sheather (1991) estimator ˆR m (a) = ( 1) m 1 n nx j=1 = ( 1) m 1 n 2 nx i,j=1 ˆf (2m) a (Y j ) φ (2m) a (Y j Y i ). (7) Jones and Sheather (1991) Result 2 show that the bandwidth a which minimizes the asymptotic mean-square error of ˆR m (a) is a m (R m+1 ) = = = Ã! 1/(2m+3) ( 1) m 2φ (2m) (0) R m+1 n µ (2m)! 1/(2m+3) m!2 m 1/2 πr m+1 n à 2 m+1/2 Γ! m + 1 1/(2m+3) 2 (8) πr m+1 n where the second equality uses equation (7.2) of Marron and Wand (1992), and the third is an algebraic 3
 equals the expectation Z R m = ( 1) m f (2m) (y)f(y)dy An estimate of f (2m) (y) using a Gaussian kernel with bandwidth a is = ( 1) m Ef (2m) (Y")
5 simplification. We write a m (R m+1 ) as a explicit function of R m+1 to emphasize the dependence on the unknown roughness. (7) and (8) can be combined to write the estimate of R m as a function of the input R m+1. ˆR m (R m+1 )= ˆR m (a m (R m+1 )). This relationship suggests the sequential plug-in rule. Fix ³ J 1 and take R J+1 as given. Then estimate R J by ˆR J = ˆR J (R J+1 ), R J 1 by ˆR J 1 = ˆR J 1 ˆR J, etc, until we obtain an estimate ³ ˆR 1 = ˆR 1 ˆR 2 for R 1. We can write this as an explicit function of the input R J+1 : ³ ³ ˆR 1 (R J+1 )= ˆR 1 ˆR 2 ˆR 3 ³ ˆR J (R J+1 ). As this sequential plug-in estimator depends on the input R J+1, we suggest a Gaussian reference estimate. When f = φ σ then R J+1 = R 0 (2J +2)! J+1 = σ 2J+3 (J + 1)!2 2J+3 π = Γ J σ 2J+3 2π (see equations (7.1) and (7.2) of Marron and Wand (1992)). The scale σ can be replaced by the sample standard deviation. This yields the J th-step estimate of R 1 ˆR 1,J = ˆR 1 R 0 J+1 and the J th-step plug-in bandwidth ĥ J = ³ ψ/ ˆR 1,J 1/3 n 1/3 (9) 4 Simulation The finite sample performance of the SDF estimator is explored in a simple simulation experiment. The observations are generated by the first nine mixture-normal test densities of Marron and Wand (1992), normalized to have unit variance. These densities cover a broad range of shapes and characteristics. Samples of size n = 10, 30, 60 and 120 are investigated. The Gaussian kernel and 10,000 simulation draws are used for each sample size and model. We first investigate the accuracy of the AMISE approximation AMISE(h) ' V n h n π + h4 R 1 4. (10) The constant V is calculated by numerical integration using 51 gridpoints over the region [-2.5, 2.5]. The roughness R 1 is calculated analytically using Theorem 4.1 of Marron and Wand (1992). The exact MISE is calculated by numerical integration (using the same gridpoints) over the simulation draws. 4
= ˆR 1 ˆR 2 ˆR 3 ³ ˆR J (R J+1 ).")
6 The exact MISE and AMISE are displayed in Figure 1 for n =30. The graphs for other sample sizes are qualitatively similar. The MISE and AMISE have been normalized by the MISE for h =0(the EDF), and are graphed as functions of the bandwidth h. The solid lines are the exact MISE (computed by simulation), the dashed lines the AMISE (10). The asymptotic approximation (10) should equal the exact MISE for h =0. The slight differences between the curves at h =0observed in Figure 1 are therefore due to simulation and integration error. From Figure 1 we observe the following. First, the MISE and AMISE have similar shapes across models. In many cases the two curves are quite close, especially for small values of h. For large bandwidths, however, the can be quite divergent. A common observation is that for large h, the exact MISE curve lies significantly below the AMISE curve. Second, the bandwidth which minimizes the exact MISE and the AMISE are typically quite close. A notable exception is the Strongly Skewed distribution, for which the AMISE is a poor approximation to the exact MISE, and the bandwidth which minimizes the former is much smaller than that which minimizes the latter. Third, we observe that the MISE curves vary considerably across distributions. These observations suggest the following lessons. The diversity of the MISE curves across distributions indicates that reference (rule-of-thumb) bandwidths may perform quite poorly if the true distribution is not close to the reference distribution. Thus data-based bandwidth selection rules are necessary for implementation. The similarity of the exact MISE and AMISE curves indicates that bandwidth selection can be based on estimates of the AMISE, such as the plug-in rules of section 3. We next examine the performance of the SDF estimator with empirically-selected bandwidths. Again, our performance measure is the MISE, expressed as a ratio to the MISE for the EDF (h =0). We calculate the SDF using the reference bandwidth (4) and the plug-in bandwidths (9) for j = 1 through 8. Table 1 reports the results. The first column reports the relative MISE for the reference bandwidth. As expected, we see that the results depend strongly on the true distribution. For six of the nine distributions, the MISE of the SDF is lower than that of the EDF, but for three other distributions (Kurtotic, Outlier, and Separated Bimodal) the MISE of the SDF can be substantially higher. The remaining columns report the relative MISE for the plug-in bandwidths ĥj. For the distributions where the reference bandwidth had a low MISE, the plug-in bandwidths yield similar MISE results. The notable differences arise for the three other distributions. In these cases, the use of a plug-in bandwidth substantially reduces the MISE. If a plug-in bandwidth of order four or higher is used, the MISE of the SDF dominates that of the EDF for all distributions and sample sizes investigated. Increasing the order of the plug-in bandwidth above four has mixed benefits. In summary, we conclude that the fourth-order plug-in bandwidth ĥ4 yields a distribution function estimator which has uniformly excellent MISE, and is recommended for empirical practice. The bandwidth ĥ4 and estimator ˆF h (y) are quite straightforward to calculate. Gauss code is available on the author s webpage. 5

7 References [1] Altman, Naomi and Christian Leger (1995): Bandwidth selection for kernel distribution function estimation, Journal of Statistical Planning and Inference, 46, [2] Azzalini, A. (1981): A note on the estimation of a distribution function and quantiles by a kernel method, Biometrika, 68, [3] Jin, Zhezhen and Yongzhao Shao (1999): On kernel estimation of a multivariate distribution function, Statistics and Probability Letters, 41, [4] Jones, M.C. (1990): The performance of kernel density functions in kernel distribution function estimation, Statistics and Probability Letters, 9, [5] Jones, M.C. and S. J. Sheather (1991): Using non-stochastic terms to advantage in kernel-based estimation of integrated squared density derivatives, Statistics and Probability Letters, 11, [6] Marron, J.S. and M.P. Wand (1992): Exact mean integrated squared error, Annals of Statistics, 20, [7] Reiss, R.D. (1981): Nonparametric estimation of smooth distribution functions, Scandinavian Journal of Statistics, 8, [8] Sarda, Pascal (1993): Smoothing parameter selection for smooth distribution functions, Journal of Statistical Planning and Inference, 35, [9] Shao, Yongzhao and Xiaojing Xiang (1997): Some extensions of the asymptotics of a kernel estimator of a distribution function, Statistics and Probability Letters, 334,
![[3] Jin, Zhezhen and Yongzhao Shao (1999): On kernel estimation of a multivariate distribution function, Statistics and Probability Letters, 41, 163-168. [4] Jones, M.C.](/docs-images/47/21011675/images/page_7.jpg "(1990): The performance of kernel density functions in kernel distribution function estimation, Statistics and Probability Letters, 9,129-132. [5] Jo")
8 Table 1: Distribution Function Estimation Normalized MISE of Smooth Distribution Function Sample Size Density Bandwidth Method ĥ 0 ĥ 1 ĥ 2 ĥ 3 ĥ 4 ĥ 5 ĥ 6 ĥ 7 ĥ 8 n = 10 Gaussian Skewed Strongly Skewed Kurtotic Outlier Bimodal Separated Bimodal Asymmetric Bimodal n =30 Gaussian Skewed Strongly Skewed Kurtotic Outlier Bimodal Separated Bimodal Asymmetric Bimodal n =60 Gaussian Skewed Strongly Skewed Kurtotic Outlier Bimodal Separated Bimodal Asymmetric Bimodal n = 120 Gaussian Skewed Strongly Skewed Kurtotic Outlier Bimodal Separated Bimodal Asymmetric Bimodal

9
Non Parametric Inference
 Maura Department of Economics and Finance Università Tor Vergata Outline 1 2 3 Inverse distribution function Theorem: Let U be a uniform random variable on (0, 1). Let X be a continuous random variable
Chapter 4. Probability and Probability Distributions
 Chapter 4. robability and robability Distributions Importance of Knowing robability To know whether a sample is not identical to the population from which it was selected, it is necessary to assess the
ON THE EXISTENCE AND LIMIT BEHAVIOR OF THE OPTIMAL BANDWIDTH FOR KERNEL DENSITY ESTIMATION
 Statistica Sinica 17(27), 289-3 ON THE EXISTENCE AND LIMIT BEHAVIOR OF THE OPTIMAL BANDWIDTH FOR KERNEL DENSITY ESTIMATION J. E. Chacón, J. Montanero, A. G. Nogales and P. Pérez Universidad de Extremadura
The Normal distribution
 The Normal distribution The normal probability distribution is the most common model for relative frequencies of a quantitative variable. Bell-shaped and described by the function f(y) = 1 2σ π e{ 1 2σ
Basics of Statistical Machine Learning
 CS761 Spring 2013 Advanced Machine Learning Basics of Statistical Machine Learning Lecturer: Xiaojin Zhu jerryzhu@cs.wisc.edu Modern machine learning is rooted in statistics. You will find many familiar
How Bandwidth Selection Algorithms Impact Exploratory Data Analysis Using Kernel Density Estimation. Jared K. Harpole
 How Bandwidth Selection Algorithms Impact Exploratory Data Analysis Using Kernel Density Estimation By Jared K. Harpole Submitted to the Department of Psychology and the Graduate Faculty of the University
Online Appendix to Stochastic Imitative Game Dynamics with Committed Agents
 Online Appendix to Stochastic Imitative Game Dynamics with Committed Agents William H. Sandholm January 6, 22 O.. Imitative protocols, mean dynamics, and equilibrium selection In this section, we consider
Using kernel methods to visualise crime data
 Submission for the 2013 IAOS Prize for Young Statisticians Using kernel methods to visualise crime data Dr. Kieran Martin and Dr. Martin Ralphs kieran.martin@ons.gov.uk martin.ralphs@ons.gov.uk Office
Variance Reduction. Pricing American Options. Monte Carlo Option Pricing. Delta and Common Random Numbers
 Variance Reduction The statistical efficiency of Monte Carlo simulation can be measured by the variance of its output If this variance can be lowered without changing the expected value, fewer replications
Kernel density estimation with adaptive varying window size
 Pattern Recognition Letters 23 (2002) 64 648 www.elsevier.com/locate/patrec Kernel density estimation with adaptive varying window size Vladimir Katkovnik a, Ilya Shmulevich b, * a Kwangju Institute of
Density Curve. A density curve is the graph of a continuous probability distribution. It must satisfy the following properties:
 Density Curve A density curve is the graph of a continuous probability distribution. It must satisfy the following properties: 1. The total area under the curve must equal 1. 2. Every point on the curve
MATH4427 Notebook 2 Spring 2016. 2 MATH4427 Notebook 2 3. 2.1 Definitions and Examples... 3. 2.2 Performance Measures for Estimators...
 MATH4427 Notebook 2 Spring 2016 prepared by Professor Jenny Baglivo c Copyright 2009-2016 by Jenny A. Baglivo. All Rights Reserved. Contents 2 MATH4427 Notebook 2 3 2.1 Definitions and Examples...................................
4. Continuous Random Variables, the Pareto and Normal Distributions
 4. Continuous Random Variables, the Pareto and Normal Distributions A continuous random variable X can take any value in a given range (e.g. height, weight, age). The distribution of a continuous random
Chapter 3 RANDOM VARIATE GENERATION
 Chapter 3 RANDOM VARIATE GENERATION In order to do a Monte Carlo simulation either by hand or by computer, techniques must be developed for generating values of random variables having known distributions.
BNG 202 Biomechanics Lab. Descriptive statistics and probability distributions I
 BNG 202 Biomechanics Lab Descriptive statistics and probability distributions I Overview The overall goal of this short course in statistics is to provide an introduction to descriptive and inferential
6.4 Normal Distribution
 Contents 6.4 Normal Distribution....................... 381 6.4.1 Characteristics of the Normal Distribution....... 381 6.4.2 The Standardized Normal Distribution......... 385 6.4.3 Meaning of Areas under
Spatial Statistics Chapter 3 Basics of areal data and areal data modeling
 Spatial Statistics Chapter 3 Basics of areal data and areal data modeling Recall areal data also known as lattice data are data Y (s), s D where D is a discrete index set. This usually corresponds to data
Overview of Violations of the Basic Assumptions in the Classical Normal Linear Regression Model
 Overview of Violations of the Basic Assumptions in the Classical Normal Linear Regression Model 1 September 004 A. Introduction and assumptions The classical normal linear regression model can be written
Lecture 3: Linear methods for classification
 Lecture 3: Linear methods for classification Rafael A. Irizarry and Hector Corrada Bravo February, 2010 Today we describe four specific algorithms useful for classification problems: linear regression,
Variables. Exploratory Data Analysis
 Exploratory Data Analysis Exploratory Data Analysis involves both graphical displays of data and numerical summaries of data. A common situation is for a data set to be represented as a matrix. There is
Interpretation of Somers D under four simple models
 Interpretation of Somers D under four simple models Roger B. Newson 03 September, 04 Introduction Somers D is an ordinal measure of association introduced by Somers (96)[9]. It can be defined in terms
CHAPTER 6: Continuous Uniform Distribution: 6.1. Definition: The density function of the continuous random variable X on the interval [A, B] is.
![CHAPTER 6: Continuous Uniform Distribution: 6.1. Definition: The density function of the continuous random variable X on the interval [A, B] is.](/thumbs/40/21160284.jpg "CHAPTER 6: Continuous Uniform Distribution: 6.1. Definition: The density function of the continuous random variable X on the interval [A, B] is.") Some Continuous Probability Distributions CHAPTER 6: Continuous Uniform Distribution: 6. Definition: The density function of the continuous random variable X on the interval [A, B] is B A A x B f(x; A,
Some Continuous Probability Distributions CHAPTER 6: Continuous Uniform Distribution: 6. Definition: The density function of the continuous random variable X on the interval [A, B] is B A A x B f(x; A,
Accuracy of the coherent potential approximation for a onedimensional array with a Gaussian distribution of fluctuations in the on-site potential
 Accuracy of the coherent potential approximation for a onedimensional array with a Gaussian distribution of fluctuations in the on-site potential I. Avgin Department of Electrical and Electronics Engineering,
5/31/2013. 6.1 Normal Distributions. Normal Distributions. Chapter 6. Distribution. The Normal Distribution. Outline. Objectives.
 The Normal Distribution C H 6A P T E R The Normal Distribution Outline 6 1 6 2 Applications of the Normal Distribution 6 3 The Central Limit Theorem 6 4 The Normal Approximation to the Binomial Distribution
An Introduction to Basic Statistics and Probability
 An Introduction to Basic Statistics and Probability Shenek Heyward NCSU An Introduction to Basic Statistics and Probability p. 1/4 Outline Basic probability concepts Conditional probability Discrete Random
Lesson 4 Measures of Central Tendency
 Outline Measures of a distribution s shape -modality and skewness -the normal distribution Measures of central tendency -mean, median, and mode Skewness and Central Tendency Lesson 4 Measures of Central
UNIT I: RANDOM VARIABLES PART- A -TWO MARKS
 UNIT I: RANDOM VARIABLES PART- A -TWO MARKS 1. Given the probability density function of a continuous random variable X as follows f(x) = 6x (1-x) 0
A.II. Kernel Estimation of Densities
 A.II. Kernel Estimation of Densities Olivier Scaillet University of Geneva and Swiss Finance Institute Outline 1 Introduction 2 Issues with Empirical Averages 3 Kernel Estimator 4 Optimal Bandwidth 5 Bivariate
Sales forecasting # 2
 Sales forecasting # 2 Arthur Charpentier arthur.charpentier@univ-rennes1.fr 1 Agenda Qualitative and quantitative methods, a very general introduction Series decomposition Short versus long term forecasting
Statistical Analysis of Non-stationary Waves off the Savannah Coast, Georgia, USA
 1 Statistical Analysis of Non-stationary Waves off the Savannah Coast, Xiufeng Yang School of Civil and Environmental Engineering, Georgia Institute of Technology, Atlanta, GA, USA, 30332 (xfyang@gatech.edu)
Monte Carlo and Empirical Methods for Stochastic Inference (MASM11/FMS091)
") Monte Carlo and Empirical Methods for Stochastic Inference (MASM11/FMS091) Magnus Wiktorsson Centre for Mathematical Sciences Lund University, Sweden Lecture 5 Sequential Monte Carlo methods I February
Monte Carlo and Empirical Methods for Stochastic Inference (MASM11/FMS091) Magnus Wiktorsson Centre for Mathematical Sciences Lund University, Sweden Lecture 5 Sequential Monte Carlo methods I February
Descriptive Statistics
 Descriptive Statistics Suppose following data have been collected (heights of 99 five-year-old boys) 117.9 11.2 112.9 115.9 18. 14.6 17.1 117.9 111.8 16.3 111. 1.4 112.1 19.2 11. 15.4 99.4 11.1 13.3 16.9
Monte Carlo Simulation
 1 Monte Carlo Simulation Stefan Weber Leibniz Universität Hannover email: sweber@stochastik.uni-hannover.de web: www.stochastik.uni-hannover.de/ sweber Monte Carlo Simulation 2 Quantifying and Hedging
Dongfeng Li. Autumn 2010
 Autumn 2010 Chapter Contents Some statistics background; ; Comparing means and proportions; variance. Students should master the basic concepts, descriptive statistics measures and graphs, basic hypothesis
Introduction to General and Generalized Linear Models
 Introduction to General and Generalized Linear Models General Linear Models - part I Henrik Madsen Poul Thyregod Informatics and Mathematical Modelling Technical University of Denmark DK-2800 Kgs. Lyngby
Parallel Computing of Kernel Density Estimates with MPI
 Parallel Computing of Kernel Density Estimates with MPI Szymon Lukasik Department of Automatic Control, Cracow University of Technology, ul. Warszawska 24, 31-155 Cracow, Poland Szymon.Lukasik@pk.edu.pl
Syntax Menu Description Options Remarks and examples Stored results Methods and formulas References Also see. Description
 Title stata.com lpoly Kernel-weighted local polynomial smoothing Syntax Menu Description Options Remarks and examples Stored results Methods and formulas References Also see Syntax lpoly yvar xvar [ if
99.37, 99.38, 99.38, 99.39, 99.39, 99.39, 99.39, 99.40, 99.41, 99.42 cm
 Error Analysis and the Gaussian Distribution In experimental science theory lives or dies based on the results of experimental evidence and thus the analysis of this evidence is a critical part of the
1 Prior Probability and Posterior Probability
 Math 541: Statistical Theory II Bayesian Approach to Parameter Estimation Lecturer: Songfeng Zheng 1 Prior Probability and Posterior Probability Consider now a problem of statistical inference in which
Least-Squares Intersection of Lines
 Least-Squares Intersection of Lines Johannes Traa - UIUC 2013 This write-up derives the least-squares solution for the intersection of lines. In the general case, a set of lines will not intersect at a
Probability and Statistics Prof. Dr. Somesh Kumar Department of Mathematics Indian Institute of Technology, Kharagpur
 Probability and Statistics Prof. Dr. Somesh Kumar Department of Mathematics Indian Institute of Technology, Kharagpur Module No. #01 Lecture No. #15 Special Distributions-VI Today, I am going to introduce
Probability and Statistics Vocabulary List (Definitions for Middle School Teachers)
") Probability and Statistics Vocabulary List (Definitions for Middle School Teachers) B Bar graph a diagram representing the frequency distribution for nominal or discrete data. It consists of a sequence
Probability and Statistics Vocabulary List (Definitions for Middle School Teachers) B Bar graph a diagram representing the frequency distribution for nominal or discrete data. It consists of a sequence
Key Concept. Density Curve
 MAT 155 Statistical Analysis Dr. Claude Moore Cape Fear Community College Chapter 6 Normal Probability Distributions 6 1 Review and Preview 6 2 The Standard Normal Distribution 6 3 Applications of Normal
CHI-SQUARE: TESTING FOR GOODNESS OF FIT
 CHI-SQUARE: TESTING FOR GOODNESS OF FIT In the previous chapter we discussed procedures for fitting a hypothesized function to a set of experimental data points. Such procedures involve minimizing a quantity
5.1 Identifying the Target Parameter
 University of California, Davis Department of Statistics Summer Session II Statistics 13 August 20, 2012 Date of latest update: August 20 Lecture 5: Estimation with Confidence intervals 5.1 Identifying
Exploratory Data Analysis
 Exploratory Data Analysis Johannes Schauer johannes.schauer@tugraz.at Institute of Statistics Graz University of Technology Steyrergasse 17/IV, 8010 Graz www.statistics.tugraz.at February 12, 2008 Introduction
How To Solve A Sequential Mca Problem
 Monte Carlo-based statistical methods (MASM11/FMS091) Jimmy Olsson Centre for Mathematical Sciences Lund University, Sweden Lecture 6 Sequential Monte Carlo methods II February 3, 2012 Changes in HA1 Problem
Accounting for severity of risk when pricing insurance products
 UB Riskcenter Working Paper Series University of Barcelona Research Group on Risk in Insurance and Finance www.ub.edu/riskcenter Working paper 2014/05 \\ Number of pages 25 Accounting for severity of risk
Descriptive Statistics. Purpose of descriptive statistics Frequency distributions Measures of central tendency Measures of dispersion
 Descriptive Statistics Purpose of descriptive statistics Frequency distributions Measures of central tendency Measures of dispersion Statistics as a Tool for LIS Research Importance of statistics in research
STT315 Chapter 4 Random Variables & Probability Distributions KM. Chapter 4.5, 6, 8 Probability Distributions for Continuous Random Variables
 Chapter 4.5, 6, 8 Probability Distributions for Continuous Random Variables Discrete vs. continuous random variables Examples of continuous distributions o Uniform o Exponential o Normal Recall: A random
Week 3&4: Z tables and the Sampling Distribution of X
 Week 3&4: Z tables and the Sampling Distribution of X 2 / 36 The Standard Normal Distribution, or Z Distribution, is the distribution of a random variable, Z N(0, 1 2 ). The distribution of any other normal
Electromagnetism - Lecture 2. Electric Fields
 Electromagnetism - Lecture 2 Electric Fields Review of Vector Calculus Differential form of Gauss s Law Poisson s and Laplace s Equations Solutions of Poisson s Equation Methods of Calculating Electric
Descriptive Statistics
 Y520 Robert S Michael Goal: Learn to calculate indicators and construct graphs that summarize and describe a large quantity of values. Using the textbook readings and other resources listed on the web
Signal detection and goodness-of-fit: the Berk-Jones statistics revisited
 Signal detection and goodness-of-fit: the Berk-Jones statistics revisited Jon A. Wellner (Seattle) INET Big Data Conference INET Big Data Conference, Cambridge September 29-30, 2015 Based on joint work
AP Statistics Solutions to Packet 2
 AP Statistics Solutions to Packet 2 The Normal Distributions Density Curves and the Normal Distribution Standard Normal Calculations HW #9 1, 2, 4, 6-8 2.1 DENSITY CURVES (a) Sketch a density curve that
Fitting Subject-specific Curves to Grouped Longitudinal Data
 Fitting Subject-specific Curves to Grouped Longitudinal Data Djeundje, Viani Heriot-Watt University, Department of Actuarial Mathematics & Statistics Edinburgh, EH14 4AS, UK E-mail: vad5@hw.ac.uk Currie,
SENSITIVITY ANALYSIS AND INFERENCE. Lecture 12
 This work is licensed under a Creative Commons Attribution-NonCommercial-ShareAlike License. Your use of this material constitutes acceptance of that license and the conditions of use of materials on this
Kernel Testing as an Alternative to χ 2 Analysis for Investigating the Distribution of Quantitative Traits
 Kernel Testing as an Alternative to χ 2 Analysis for Investigating the Distribution of Quantitative Traits Jeffrey D. Hart, Anna Hale, J. Creighton Miller, Jr. Summary. Chi-square analysis is a popular
Department of Mathematics, Indian Institute of Technology, Kharagpur Assignment 2-3, Probability and Statistics, March 2015. Due:-March 25, 2015.
 Department of Mathematics, Indian Institute of Technology, Kharagpur Assignment -3, Probability and Statistics, March 05. Due:-March 5, 05.. Show that the function 0 for x < x+ F (x) = 4 for x < for x
An explicit link between Gaussian fields and Gaussian Markov random fields; the stochastic partial differential equation approach
 Intro B, W, M, & R SPDE/GMRF Example End An explicit link between Gaussian fields and Gaussian Markov random fields; the stochastic partial differential equation approach Finn Lindgren 1 Håvard Rue 1 Johan
GRADES 7, 8, AND 9 BIG IDEAS
 Table 1: Strand A: BIG IDEAS: MATH: NUMBER Introduce perfect squares, square roots, and all applications Introduce rational numbers (positive and negative) Introduce the meaning of negative exponents for
1 Sufficient statistics
 1 Sufficient statistics A statistic is a function T = rx 1, X 2,, X n of the random sample X 1, X 2,, X n. Examples are X n = 1 n s 2 = = X i, 1 n 1 the sample mean X i X n 2, the sample variance T 1 =
Some stability results of parameter identification in a jump diffusion model
 Some stability results of parameter identification in a jump diffusion model D. Düvelmeyer Technische Universität Chemnitz, Fakultät für Mathematik, 09107 Chemnitz, Germany Abstract In this paper we discuss
A logistic approximation to the cumulative normal distribution
 A logistic approximation to the cumulative normal distribution Shannon R. Bowling 1 ; Mohammad T. Khasawneh 2 ; Sittichai Kaewkuekool 3 ; Byung Rae Cho 4 1 Old Dominion University (USA); 2 State University
HEDGE FUND RETURNS WEIGHTED-SYMMETRY AND THE OMEGA PERFORMANCE MEASURE
 HEDGE FUND RETURNS WEIGHTED-SYMMETRY AND THE OMEGA PERFORMANCE MEASURE by Pierre Laroche, Innocap Investment Management and Bruno Rémillard, Department of Management Sciences, HEC Montréal. Introduction
A Primer on Mathematical Statistics and Univariate Distributions; The Normal Distribution; The GLM with the Normal Distribution
 A Primer on Mathematical Statistics and Univariate Distributions; The Normal Distribution; The GLM with the Normal Distribution PSYC 943 (930): Fundamentals of Multivariate Modeling Lecture 4: September
PS 271B: Quantitative Methods II. Lecture Notes
 PS 271B: Quantitative Methods II Lecture Notes Langche Zeng zeng@ucsd.edu The Empirical Research Process; Fundamental Methodological Issues 2 Theory; Data; Models/model selection; Estimation; Inference.
Practice problems for Homework 11 - Point Estimation
 Practice problems for Homework 11 - Point Estimation 1. (10 marks) Suppose we want to select a random sample of size 5 from the current CS 3341 students. Which of the following strategies is the best:
Logistic Regression. Jia Li. Department of Statistics The Pennsylvania State University. Logistic Regression
 Logistic Regression Department of Statistics The Pennsylvania State University Email: jiali@stat.psu.edu Logistic Regression Preserve linear classification boundaries. By the Bayes rule: Ĝ(x) = arg max
Lecture 2: Descriptive Statistics and Exploratory Data Analysis
 Lecture 2: Descriptive Statistics and Exploratory Data Analysis Further Thoughts on Experimental Design 16 Individuals (8 each from two populations) with replicates Pop 1 Pop 2 Randomly sample 4 individuals
Determining distribution parameters from quantiles
 Determining distribution parameters from quantiles John D. Cook Department of Biostatistics The University of Texas M. D. Anderson Cancer Center P. O. Box 301402 Unit 1409 Houston, TX 77230-1402 USA cook@mderson.org
ECE302 Spring 2006 HW5 Solutions February 21, 2006 1
 ECE3 Spring 6 HW5 Solutions February 1, 6 1 Solutions to HW5 Note: Most of these solutions were generated by R. D. Yates and D. J. Goodman, the authors of our textbook. I have added comments in italics
Robert Collins CSE598G. More on Mean-shift. R.Collins, CSE, PSU CSE598G Spring 2006
 More on Mean-shift R.Collins, CSE, PSU Spring 2006 Recall: Kernel Density Estimation Given a set of data samples x i ; i=1...n Convolve with a kernel function H to generate a smooth function f(x) Equivalent
An Internal Model for Operational Risk Computation
 An Internal Model for Operational Risk Computation Seminarios de Matemática Financiera Instituto MEFF-RiskLab, Madrid http://www.risklab-madrid.uam.es/ Nicolas Baud, Antoine Frachot & Thierry Roncalli
. (3.3) n Note that supremum (3.2) must occur at one of the observed values x i or to the left of x i.
 n Note that supremum (3.2) must occur at one of the observed values x i or to the left of x i.") Chapter 3 Kolmogorov-Smirnov Tests There are many situations where experimenters need to know what is the distribution of the population of their interest. For example, if they want to use a parametric
Chapter 3 Kolmogorov-Smirnov Tests There are many situations where experimenters need to know what is the distribution of the population of their interest. For example, if they want to use a parametric
Review of Basic Options Concepts and Terminology
 Review of Basic Options Concepts and Terminology March 24, 2005 1 Introduction The purchase of an options contract gives the buyer the right to buy call options contract or sell put options contract some
Department of Econometrics and Business Statistics
 ISSN 1440-771X Australia Department of Econometrics and Business Statistics http://www.buseco.monash.edu.au/depts/ebs/pubs/wpapers/ A Approach to Bandwidth Selection for Multivariate Kernel Regression
Summary of Formulas and Concepts. Descriptive Statistics (Ch. 1-4)
") Summary of Formulas and Concepts Descriptive Statistics (Ch. 1-4) Definitions Population: The complete set of numerical information on a particular quantity in which an investigator is interested. We assume
Summary of Formulas and Concepts Descriptive Statistics (Ch. 1-4) Definitions Population: The complete set of numerical information on a particular quantity in which an investigator is interested. We assume
LOGNORMAL MODEL FOR STOCK PRICES
 LOGNORMAL MODEL FOR STOCK PRICES MICHAEL J. SHARPE MATHEMATICS DEPARTMENT, UCSD 1. INTRODUCTION What follows is a simple but important model that will be the basis for a later study of stock prices as
11 Linear and Quadratic Discriminant Analysis, Logistic Regression, and Partial Least Squares Regression
 Frank C Porter and Ilya Narsky: Statistical Analysis Techniques in Particle Physics Chap. c11 2013/9/9 page 221 le-tex 221 11 Linear and Quadratic Discriminant Analysis, Logistic Regression, and Partial
Nonparametric Statistics
 Nonparametric Statistics References Some good references for the topics in this course are 1. Higgins, James (2004), Introduction to Nonparametric Statistics 2. Hollander and Wolfe, (1999), Nonparametric
Lecture 8. Generating a non-uniform probability distribution
 Discrete outcomes Lecture 8 Generating a non-uniform probability distribution Last week we discussed generating a non-uniform probability distribution for the case of finite discrete outcomes. An algorithm
Estimating the Degree of Activity of jumps in High Frequency Financial Data. joint with Yacine Aït-Sahalia
 Estimating the Degree of Activity of jumps in High Frequency Financial Data joint with Yacine Aït-Sahalia Aim and setting An underlying process X = (X t ) t 0, observed at equally spaced discrete times
Errata and updates for ASM Exam C/Exam 4 Manual (Sixteenth Edition) sorted by page
 sorted by page") Errata for ASM Exam C/4 Study Manual (Sixteenth Edition) Sorted by Page 1 Errata and updates for ASM Exam C/Exam 4 Manual (Sixteenth Edition) sorted by page Practice exam 1:9, 1:22, 1:29, 9:5, and 10:8
Errata for ASM Exam C/4 Study Manual (Sixteenth Edition) Sorted by Page 1 Errata and updates for ASM Exam C/Exam 4 Manual (Sixteenth Edition) sorted by page Practice exam 1:9, 1:22, 1:29, 9:5, and 10:8
Measuring Line Edge Roughness: Fluctuations in Uncertainty
 Tutor6.doc: Version 5/6/08 T h e L i t h o g r a p h y E x p e r t (August 008) Measuring Line Edge Roughness: Fluctuations in Uncertainty Line edge roughness () is the deviation of a feature edge (as
A Coefficient of Variation for Skewed and Heavy-Tailed Insurance Losses. Michael R. Powers[ 1 ] Temple University and Tsinghua University
![A Coefficient of Variation for Skewed and Heavy-Tailed Insurance Losses. Michael R. Powers[ 1 ] Temple University and Tsinghua University](/thumbs/35/17199255.jpg "A Coefficient of Variation for Skewed and Heavy-Tailed Insurance Losses. Michael R. Powers[ 1 ] Temple University and Tsinghua University") A Coefficient of Variation for Skewed and Heavy-Tailed Insurance Losses Michael R. Powers[ ] Temple University and Tsinghua University Thomas Y. Powers Yale University [June 2009] Abstract We propose a
A Coefficient of Variation for Skewed and Heavy-Tailed Insurance Losses Michael R. Powers[ ] Temple University and Tsinghua University Thomas Y. Powers Yale University [June 2009] Abstract We propose a
Nonparametric adaptive age replacement with a one-cycle criterion
 Nonparametric adaptive age replacement with a one-cycle criterion P. Coolen-Schrijner, F.P.A. Coolen Department of Mathematical Sciences University of Durham, Durham, DH1 3LE, UK e-mail: Pauline.Schrijner@durham.ac.uk
Christfried Webers. Canberra February June 2015
 c Statistical Group and College of Engineering and Computer Science Canberra February June (Many figures from C. M. Bishop, "Pattern Recognition and ") 1of 829 c Part VIII Linear Classification 2 Logistic
8. THE NORMAL DISTRIBUTION
 8. THE NORMAL DISTRIBUTION The normal distribution with mean μ and variance σ 2 has the following density function: The normal distribution is sometimes called a Gaussian Distribution, after its inventor,
Permutation Tests for Comparing Two Populations
 Permutation Tests for Comparing Two Populations Ferry Butar Butar, Ph.D. Jae-Wan Park Abstract Permutation tests for comparing two populations could be widely used in practice because of flexibility of
Def: The standard normal distribution is a normal probability distribution that has a mean of 0 and a standard deviation of 1.
 Lecture 6: Chapter 6: Normal Probability Distributions A normal distribution is a continuous probability distribution for a random variable x. The graph of a normal distribution is called the normal curve.
Lesson19: Comparing Predictive Accuracy of two Forecasts: Th. Diebold-Mariano Test
 Lesson19: Comparing Predictive Accuracy of two Forecasts: The Diebold-Mariano Test Dipartimento di Ingegneria e Scienze dell Informazione e Matematica Università dell Aquila, umberto.triacca@univaq.it
CA200 Quantitative Analysis for Business Decisions. File name: CA200_Section_04A_StatisticsIntroduction
 CA200 Quantitative Analysis for Business Decisions File name: CA200_Section_04A_StatisticsIntroduction Table of Contents 4. Introduction to Statistics... 1 4.1 Overview... 3 4.2 Discrete or continuous
Monte Carlo-based statistical methods (MASM11/FMS091)
") Monte Carlo-based statistical methods (MASM11/FMS091) Jimmy Olsson Centre for Mathematical Sciences Lund University, Sweden Lecture 5 Sequential Monte Carlo methods I February 5, 2013 J. Olsson Monte Carlo-based
Monte Carlo-based statistical methods (MASM11/FMS091) Jimmy Olsson Centre for Mathematical Sciences Lund University, Sweden Lecture 5 Sequential Monte Carlo methods I February 5, 2013 J. Olsson Monte Carlo-based
Testing against a Change from Short to Long Memory
 Testing against a Change from Short to Long Memory Uwe Hassler and Jan Scheithauer Goethe-University Frankfurt This version: December 9, 2007 Abstract This paper studies some well-known tests for the null
Understanding and Applying Kalman Filtering
 Understanding and Applying Kalman Filtering Lindsay Kleeman Department of Electrical and Computer Systems Engineering Monash University, Clayton 1 Introduction Objectives: 1. Provide a basic understanding
Maximum Likelihood Estimation
 Math 541: Statistical Theory II Lecturer: Songfeng Zheng Maximum Likelihood Estimation 1 Maximum Likelihood Estimation Maximum likelihood is a relatively simple method of constructing an estimator for
INDIRECT INFERENCE (prepared for: The New Palgrave Dictionary of Economics, Second Edition)
") INDIRECT INFERENCE (prepared for: The New Palgrave Dictionary of Economics, Second Edition) Abstract Indirect inference is a simulation-based method for estimating the parameters of economic models. Its
INDIRECT INFERENCE (prepared for: The New Palgrave Dictionary of Economics, Second Edition) Abstract Indirect inference is a simulation-based method for estimating the parameters of economic models. Its
A teaching experience through the development of hypertexts and object oriented software.
 A teaching experience through the development of hypertexts and object oriented software. Marcello Chiodi Istituto di Statistica. Facoltà di Economia-Palermo-Italy 1. Introduction (1) This paper is concerned
About the Gamma Function
 About the Gamma Function Notes for Honors Calculus II, Originally Prepared in Spring 995 Basic Facts about the Gamma Function The Gamma function is defined by the improper integral Γ) = The integral is