TI-Inspire manual 1. I n str uctions. Ti-Inspire for statistics. General Introduction
|
|
|
- Marvin Nichols
- 7 years ago
- Views:
Transcription
1 TI-Inspire manual 1 I n str uctions Ti-Inspire for statistics General Introduction

 #4 is notes #5 is for opening saved files Use the to navigate among the choices.")
2 TI-Inspire manual 2 General instructions Press the Home Button to go to home page Pages you will use the most #1 is a page for doing calculations such as adding number #2 is graphing #3 has columns for data entry(you will use this a lot) #4 is notes #5 is for opening saved files Use the to navigate among the choices. A brief description of each appears at the bottom of the page

3 TI-Inspire manual 3 To select an option press or or the number Important If you try to divide numbers TI-Inspire will give you a fraction since decimal is only an approximation 1 Deleting Items from memory Choose use 1Which I am more than happy to live with to select document and then hit clear a


4 TI-Inspire manual 4 Finding Mean, Median and Mode Step 1) Press Open a list so you can enter you data to create a new Lists & Spreadsheet page. A new document opens with Lists & Spreadsheet on the page. Enter your data in a column ( could use any column )

![TI-Inspire manual 5 Click [Menu] Choose 4: Statistics Use](/docs-images/40/20774953/images/5-0.png "arrow on navigator button to move left Choose 1: Stat")
5 TI-Inspire manual 5 Click [Menu] Choose 4: Statistics Use arrow on navigator button to move left Choose 1: Stat Calculation


6 TI-Inspire manual 6 Use navigator arrow again Choose 1: One-Variable Statistics Choosing is done by either using the [Enter] button Or the hand in the center of the navigator button
![done by either using the [Enter] button Or](/docs-images/47/20774953/images/page_6.jpg "the hand in the center of the navigator")
 leave num")

7 TI-Inspire manual 7 Step 2) leave num of lists on "1" and and then press [OK]

 Scroll down for median and other data Clearing column and/ or rows of Data First columns Use Go")
8 TI-Inspire manual 8 Use navigator button to navigate up and down results = mean (pronounced X bar ) Scroll down for median and other data Clearing column and/ or rows of Data First columns Use Go to


9 TI-Inspire manual 9 use center navigator button to go up to the top of the column which will cause it to highlight when column highlights hit and the column will be empty. Second rows: Again use the center navigator to go all the way to the left. When the row blackens hit the [Clear] button to empty the row Several rows or several columns at the same time: Drag to select additional rows or columns Copying rows or columns Use the same procedure as above to highlight the row or column. When it is highlighted press C to copy a column or row and V to paste it. Constructing a Box plot to get a graph screen
![When the row blackens hit the [Clear] button to empty the row Several rows or several columns at the same time: Drag to select additional rows or](/docs-images/47/20774953/images/page_9.jpg "columns Copying rows or columns Use the same procedure as above to highlight the row or column.")
10 TI-Inspire manual 10 Use navigator button to move cursor over "click to add variable" phrase at the bottom

11 TI-Inspire manual 11 Click the hand button in the center of the navigator button. The name of your column of data will appear. If you have several columns of data they will all appear. Use the arrow to get to the correct one which will highlighted and click the hand.

12 TI-Inspire manual 12 Then choose 1: plot Type Then 2: Box Plot the number that appears is the where the outliers start. In this case 43 is not an outlier but anything greater is

13 TI-Inspire manual 13 Move the hand to the bottom of the box and it will give you Q1 Moving it to the middle line gives you the median, etc.

14 TI-Inspire manual 14 How to find Standard Deviation Press Home 3: List & spread sheet Enter data and give column name if you wish 4:Statistics 1: Stat Calculations

15 TI-Inspire manual 15 1:One Variable Statistics Press center button Leave num of lists on 1 Tab to [OK] and press

16 TI-Inspire manual 16 leave Frequency list on "1" In the first slot put the letter or name of the column that holds the data you want the Standard Deviation of Tab to the last slot Put the letter of the column where you want the results to appear. Generally choose an empty column Use navigator button to move up and down the results

17 TI-Inspire manual 17 Sx is the standard deviation for a sample and the one you want to use

18 TI-Inspire manual 18 σx is the standard deviation for a population

19 TI-Inspire manual 19 One sample T-tests The United States has the highest teen pregnancy rate in the western world, despite the fact that US teens are not more sexually active than Swedish teens, Canadian teens, or British teens. The mean teenage pregnancy rate in the US is 11.85% The rates for states in the this area ( based on survey of year olds) Arkansas 17.28% Mississippi Louisiana 17.05% Texas 15.25% HO: There is no significant difference in the pregnancy rate of the states of Arkansas, Mississippi, Louisiana and Texas compared to the rest of the nation HA: There is no significant difference in the mean teenage pregnancy rate of the four states sample and the US average. Other Alternative hypothesis are of course possible.

20 TI-Inspire manual 20 The data (the rates for Arkansas, Mississippi, Louisiana, & Texas) is in the form of a list it should be enter in column A on the Lists and Spreadsheet page and given a title. then choose 4: Statistics then choose 4:Stat Tests

21 TI-Inspire manual 21 Choose 2:tTest. It is designed to test your sample against a larger or national known mean Choose Data because you entered your data into a column on the List and Spreadsheet page..click [OK]
22 TI-Inspire manual 22 µ0: is for the sample or national mean you a comparing to List: is the column where you put the data from your sample Frequency: always 1 Alternate Hyp: Three hypothesis are possible A two sided Ha: µ µ0 My sample mean is significantly different from the population mean, great or less it doesn t matter it s just significantly different. Two one sided or directional Ha: µ > µ0 My sample is greater, bigger, more than, etc. the national mean Ha: µ < µ0 My sample is less than, fewer, smaller, etc. the national mean
23 TI-Inspire manual 23 1st result column: says it will put the results in the first available column. You can overwrite previous results by changing the column letter. Try Draw plot for the fun of it but generally it doesn t give you the information you want. [OK] These results would be reported as t(3) = 7.29, P <.006. However, if you are given the mean for the data the procedure is different
24 TI-Inspire manual 24 The average age of mothers in the US when they give birth to their first child is The average age of a sample of 200 women from the Arkansas Delta region is 21.7 Sx = 2.6. Our hypothesis is: Ha: The age of mothers giving birth to their first child is significantly lower in the Delta region of Arkansas than the national average of the sample is significantly lower than the national average. Ha: µ < µ0 4: Statistics 4:Stat Tests" 2:t-test choose "Stats" this time
25 TI-Inspire manual 25 Pick a column for the results and skip "plot" These results would be written: A significant difference (p<.000)was found in the mean age for mother giving birth to their first child in the Arkansas Delta region than the national average. t (199) = , p <.000. With the mean for the nation being 25.1 and the mean for the delta region of Arkansas being Means are usually given in addition to the t scores when the difference is significant. Two Independent Sample T-Test This t-test is used when you have two separate sample that you are comparing, they do not have to be the same size. Ie. Rainfall in one city to rainfall in another, female scores on a selfesteem test compared to males scores on the same test. The Inspire has a 2-Sample T-Test Enter the data for the two groups you are comparing in two, usually columns 1 & 2. Give them a title
26 TI-Inspire manual 26 [menu] 4:Statistics 4:Stat Tests 4:2 Sample t Test If you entered data in the columns choose "Data" If you have μ, σ and n then use "Stats"
27 TI-Inspire manual 27 List 1 is your first column of data. Click on the Down arrow and pick your column title from the list List 2 is your second column of data again pick the name form the list Leave both frequencies as 1 Choose you Alternative hypothesis (Ha:) from the drop down list µ1>µ2 the first group is significantly more, faster, greater, etc. than the second group µ1<µ2 the first group is significantly less than, smaller, etc, than the second group µ1 µ2 the difference between group 1 and group 2 is not significant If you feel the two populations are generally drawn from the same group Use "pooled". If unsure use "no" Pick an empty column to put results in Skip Draw [OK]
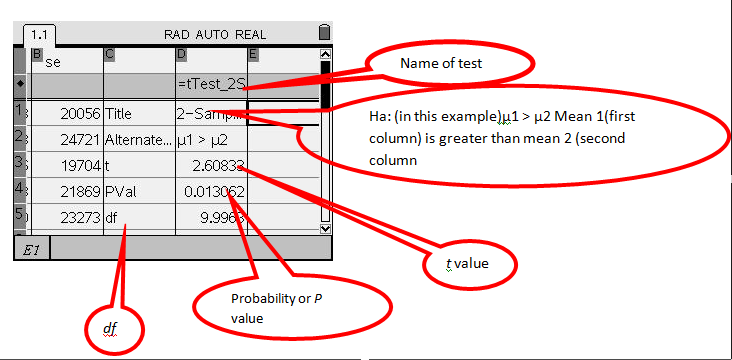
28 TI-Inspire manual 28
29 TI-Inspire manual 29 Matched pairs t-test Put Data in Column A and Column B move to the third column "C" and title it \ in the area just below the title but above the data area type the following formula =a[ ]-b[ ] this tells the calculator to subtract the data in column 2 from column 1 and put results in column 3
30 TI-Inspire manual 30 Go to Menu 4: Statistics 4: Stat Test 2:t test you are not using the 2 sample t-test because you are measuring the actual difference against 0 which is what the average difference would be if there is no difference
31 TI-Inspire manual 31 Data Input method" is "data" For μ use "0" List: where you want the results Frequency: "1" Deciding on Ha: is a little tricky Between the first results in the first column (A) and the second column (B) what kind of change are you expecting? 1) You believe there will be a difference but uncertain of the direction Ha: μ μ0 2) You believe the second group will be more, be great, bigger etc.than the first or the first less than the second (these are the same thing). So you are subtracting a bigger number from smaller and if you are correct will get a negative number (or less than 0) Ha: μ < μ0
32 TI-Inspire manual 32 3) You believe the second group will be less, fewer, decreased, etc, compared to the first. So you will be subtracting a smaller number from a larger and if correct will get a difference greater than 0. Ha: μ > μ0
33 TI-Inspire manual 33 Anova Doing an ANOVA on the TI is amazing simple if you have been doing t-tests Push the[[home] button 3: List and Spreadsheets Put each list of data in a different column (this example has Menu] 4: Statistics 4: Stat Test C:ANOVA hand Choose "data" Enter the number of groups
34 TI-Inspire manual 34 Choose the names of the groups or use a, b etc. Put results in empty column [OK] Read results and create a Source or Summary Table Results are reported both in form of a Source table and as F (3, 20)= 32.68; p<.01 Source SS df MS F p Between <.001 Within Total
35 TI-Inspire manual 35 Correlations Enter the data you want to correlate into two columns in the Data and Spreadsheet. This would usually be columns a and b, title them if you wish. Punch [menu] "4:Statistics" "1: Stat Calculations" [hand] "4:Linear Regressions(a+bx) There is also a 3: Linear Regression with the formula (mx+b) This one will give you a correlation but it will also give you extra data you don t want to bother with. Avoid it.
36 TI-Inspire manual 36
37 TI-Inspire manual 37 r = correlation
38 TI-Inspire manual 38 Chi Square As an example assume the following Chi Square or matrix Believes in Santa Does not Believe in Santa Undecided about The jolly old man male female To produce a matrix that your calculator can evaluated Push Choose 1: Calculator [Enter]
39 TI-Inspire manual 39 On the calculator page type a: = [35,43,27;43,25,10] Type data across rows In the above example the matrix is designated by the letter a. Any letter or name could have been used. Follow letter and name with a colon Put numbers in brackets [] Separate cells from each other with a comma Separate rows with a semi-colon If uncertain about how to type [] or : or ; or = see below Pressing Control and Colon produces a semi-colon on the screen
40 TI-Inspire manual 40 A matrix now appears on the screen and it is designated as matrix a
41 TI-Inspire manual 41 [Menu] 5: Statistics 7: stat tests 8: χ22-way Test [Enter] Choose the letter a or whatever you designated the matrix as for the Observed Matrix: [OK] You now have both χ2 and you p value
42 TI-Inspire manual 42 Goodness of Fit 1 X Put observed numbers in column a(and name if you wish) Put expected number in column b ( and name if you wish) Expected can be Total divided by number of factors; You are saying that all factors will have equal amounts i.e. In the case of bags of M&M s you would be saying that there is an equal number of each color in each bag A known statistic you are comparing your results to./ ie. We compare the number of M&M s, by color, in a sample of bags to the number the of each color the company claims on its website. [Menu] 4: Statistics 4: Stat Tests χ2gof
43 TI-Inspire manual 43 [ENTER] The results gives us our χ2 and probability
44 TI-Inspire manual 44 Downloading files to another TI-Inspire Sending a document 1. Press [Ho m e] 7 to o p en My Docu m e nts o n the s endin g unit. 2. Press the up and d o w n k eys to hi g hlig ht the d o cu m e nt y ou w a nt to s end. 3. Press [Contr ol] [Ho m e] 1 5 to s el e ct Send fro m the d o cu m e nt m e nu. 4. When the file transfer is c o m pl ete, a m e s sa g e displays o n the rec ei vin g unit.
TI-Inspire manual 1. Instructions. Ti-Inspire for statistics. General Introduction
 TI-Inspire manual 1 General Introduction Instructions Ti-Inspire for statistics TI-Inspire manual 2 TI-Inspire manual 3 Press the On, Off button to go to Home page TI-Inspire manual 4 Use the to navigate
The Dummy s Guide to Data Analysis Using SPSS
 The Dummy s Guide to Data Analysis Using SPSS Mathematics 57 Scripps College Amy Gamble April, 2001 Amy Gamble 4/30/01 All Rights Rerserved TABLE OF CONTENTS PAGE Helpful Hints for All Tests...1 Tests
Data Analysis Tools. Tools for Summarizing Data
 Data Analysis Tools This section of the notes is meant to introduce you to many of the tools that are provided by Excel under the Tools/Data Analysis menu item. If your computer does not have that tool
Two Related Samples t Test
 Two Related Samples t Test In this example 1 students saw five pictures of attractive people and five pictures of unattractive people. For each picture, the students rated the friendliness of the person
Using Excel for inferential statistics
 FACT SHEET Using Excel for inferential statistics Introduction When you collect data, you expect a certain amount of variation, just caused by chance. A wide variety of statistical tests can be applied
GeoGebra Statistics and Probability
 GeoGebra Statistics and Probability Project Maths Development Team 2013 www.projectmaths.ie Page 1 of 24 Index Activity Topic Page 1 Introduction GeoGebra Statistics 3 2 To calculate the Sum, Mean, Count,
Instructions for applying data validation(s) to data fields in Microsoft Excel
 to data fields in Microsoft Excel") 1 of 10 Instructions for applying data validation(s) to data fields in Microsoft Excel According to Microsoft Excel, a data validation is used to control the type of data or the values that users enter
1 of 10 Instructions for applying data validation(s) to data fields in Microsoft Excel According to Microsoft Excel, a data validation is used to control the type of data or the values that users enter
Excel Tutorial. Bio 150B Excel Tutorial 1
 Bio 15B Excel Tutorial 1 Excel Tutorial As part of your laboratory write-ups and reports during this semester you will be required to collect and present data in an appropriate format. To organize and
USING EXCEL 2010 TO SOLVE LINEAR PROGRAMMING PROBLEMS MTH 125 Chapter 4
 ONE-TIME ONLY SET UP INSTRUCTIONS Begin by verifying that the computer you are using has the Solver Add-In enabled. Click on Data in the menu across the top of the window. On the far right side, you should
DESCRIPTIVE STATISTICS & DATA PRESENTATION*
 Level 1 Level 2 Level 3 Level 4 0 0 0 0 evel 1 evel 2 evel 3 Level 4 DESCRIPTIVE STATISTICS & DATA PRESENTATION* Created for Psychology 41, Research Methods by Barbara Sommer, PhD Psychology Department
SPSS (Statistical Package for the Social Sciences)
") SPSS (Statistical Package for the Social Sciences) What is SPSS? SPSS stands for Statistical Package for the Social Sciences The SPSS home-page is: www.spss.com 2 What can you do with SPSS? Run Frequencies
SPSS (Statistical Package for the Social Sciences) What is SPSS? SPSS stands for Statistical Package for the Social Sciences The SPSS home-page is: www.spss.com 2 What can you do with SPSS? Run Frequencies
CALCULATIONS & STATISTICS
 CALCULATIONS & STATISTICS CALCULATION OF SCORES Conversion of 1-5 scale to 0-100 scores When you look at your report, you will notice that the scores are reported on a 0-100 scale, even though respondents
Introduction to the TI-Nspire CX
 Introduction to the TI-Nspire CX Activity Overview: In this activity, you will become familiar with the layout of the TI-Nspire CX. Step 1: Locate the Touchpad. The Touchpad is used to navigate the cursor
TIPS FOR DOING STATISTICS IN EXCEL
 TIPS FOR DOING STATISTICS IN EXCEL Before you begin, make sure that you have the DATA ANALYSIS pack running on your machine. It comes with Excel. Here s how to check if you have it, and what to do if you
Creating a Gradebook in Excel
 Creating a Spreadsheet Gradebook 1 Creating a Gradebook in Excel Spreadsheets are a great tool for creating gradebooks. With a little bit of work, you can create a customized gradebook that will provide
How Does My TI-84 Do That
 How Does My TI-84 Do That A guide to using the TI-84 for statistics Austin Peay State University Clarksville, Tennessee How Does My TI-84 Do That A guide to using the TI-84 for statistics Table of Contents
EXCEL Analysis TookPak [Statistical Analysis] 1. First of all, check to make sure that the Analysis ToolPak is installed. Here is how you do it:
![EXCEL Analysis TookPak [Statistical Analysis] 1. First of all, check to make sure that the Analysis ToolPak is installed. Here is how you do it:](/thumbs/30/14272010.jpg "EXCEL Analysis TookPak [Statistical Analysis] 1. First of all, check to make sure that the Analysis ToolPak is installed. Here is how you do it:") EXCEL Analysis TookPak [Statistical Analysis] 1 First of all, check to make sure that the Analysis ToolPak is installed. Here is how you do it: a. From the Tools menu, choose Add-Ins b. Make sure Analysis
EXCEL Analysis TookPak [Statistical Analysis] 1 First of all, check to make sure that the Analysis ToolPak is installed. Here is how you do it: a. From the Tools menu, choose Add-Ins b. Make sure Analysis
Using SPSS, Chapter 2: Descriptive Statistics
 1 Using SPSS, Chapter 2: Descriptive Statistics Chapters 2.1 & 2.2 Descriptive Statistics 2 Mean, Standard Deviation, Variance, Range, Minimum, Maximum 2 Mean, Median, Mode, Standard Deviation, Variance,
One-Way ANOVA using SPSS 11.0. SPSS ANOVA procedures found in the Compare Means analyses. Specifically, we demonstrate
 1 One-Way ANOVA using SPSS 11.0 This section covers steps for testing the difference between three or more group means using the SPSS ANOVA procedures found in the Compare Means analyses. Specifically,
Sample Table. Columns. Column 1 Column 2 Column 3 Row 1 Cell 1 Cell 2 Cell 3 Row 2 Cell 4 Cell 5 Cell 6 Row 3 Cell 7 Cell 8 Cell 9.
 Working with Tables in Microsoft Word The purpose of this document is to lead you through the steps of creating, editing and deleting tables and parts of tables. This document follows a tutorial format
SAS Analyst for Windows Tutorial
 Updated: August 2012 Table of Contents Section 1: Introduction... 3 1.1 About this Document... 3 1.2 Introduction to Version 8 of SAS... 3 Section 2: An Overview of SAS V.8 for Windows... 3 2.1 Navigating
Microsoft Excel Basics
 COMMUNITY TECHNICAL SUPPORT Microsoft Excel Basics Introduction to Excel Click on the program icon in Launcher or the Microsoft Office Shortcut Bar. A worksheet is a grid, made up of columns, which are
Projects Involving Statistics (& SPSS)
") Projects Involving Statistics (& SPSS) Academic Skills Advice Starting a project which involves using statistics can feel confusing as there seems to be many different things you can do (charts, graphs,
Projects Involving Statistics (& SPSS) Academic Skills Advice Starting a project which involves using statistics can feel confusing as there seems to be many different things you can do (charts, graphs,
4. Descriptive Statistics: Measures of Variability and Central Tendency
 4. Descriptive Statistics: Measures of Variability and Central Tendency Objectives Calculate descriptive for continuous and categorical data Edit output tables Although measures of central tendency and
EXCEL Tutorial: How to use EXCEL for Graphs and Calculations.
 EXCEL Tutorial: How to use EXCEL for Graphs and Calculations. Excel is powerful tool and can make your life easier if you are proficient in using it. You will need to use Excel to complete most of your
How to Make APA Format Tables Using Microsoft Word
 How to Make APA Format Tables Using Microsoft Word 1 I. Tables vs. Figures - See APA Publication Manual p. 147-175 for additional details - Tables consist of words and numbers where spatial relationships
Excel Level Two. Introduction. Contents. Exploring Formulas. Entering Formulas
 Introduction Excel Level Two This workshop introduces you to formulas, functions, moving and copying data, using autofill, relative and absolute references, and formatting cells. Contents Introduction
Using Microsoft Excel to Manage and Analyze Data: Some Tips
 Using Microsoft Excel to Manage and Analyze Data: Some Tips Larger, complex data management may require specialized and/or customized database software, and larger or more complex analyses may require
How to Concatenate Cells in Microsoft Access
 How to Concatenate Cells in Microsoft Access This tutorial demonstrates how to concatenate cells in Microsoft Access. Sometimes data distributed over multiple columns is more efficient to use when combined
MS Excel. Handout: Level 2. elearning Department. Copyright 2016 CMS e-learning Department. All Rights Reserved. Page 1 of 11
 MS Excel Handout: Level 2 elearning Department 2016 Page 1 of 11 Contents Excel Environment:... 3 To create a new blank workbook:...3 To insert text:...4 Cell addresses:...4 To save the workbook:... 5
Opgaven Onderzoeksmethoden, Onderdeel Statistiek
 Opgaven Onderzoeksmethoden, Onderdeel Statistiek 1. What is the measurement scale of the following variables? a Shoe size b Religion c Car brand d Score in a tennis game e Number of work hours per week
Bill Burton Albert Einstein College of Medicine william.burton@einstein.yu.edu April 28, 2014 EERS: Managing the Tension Between Rigor and Resources 1
 Bill Burton Albert Einstein College of Medicine william.burton@einstein.yu.edu April 28, 2014 EERS: Managing the Tension Between Rigor and Resources 1 Calculate counts, means, and standard deviations Produce
A Guide to Using Excel in Physics Lab
 A Guide to Using Excel in Physics Lab Excel has the potential to be a very useful program that will save you lots of time. Excel is especially useful for making repetitious calculations on large data sets.
How to make a line graph using Excel 2007
 How to make a line graph using Excel 2007 Format your data sheet Make sure you have a title and each column of data has a title. If you are entering data by hand, use time or the independent variable in
Dealing with Data in Excel 2010
 Dealing with Data in Excel 2010 Excel provides the ability to do computations and graphing of data. Here we provide the basics and some advanced capabilities available in Excel that are useful for dealing
How to Make the Most of Excel Spreadsheets
 How to Make the Most of Excel Spreadsheets Analyzing data is often easier when it s in an Excel spreadsheet rather than a PDF for example, you can filter to view just a particular grade, sort to view which
When to use Excel. When NOT to use Excel 9/24/2014
 Analyzing Quantitative Assessment Data with Excel October 2, 2014 Jeremy Penn, Ph.D. Director When to use Excel You want to quickly summarize or analyze your assessment data You want to create basic visual
The Chi-Square Test. STAT E-50 Introduction to Statistics
 STAT -50 Introduction to Statistics The Chi-Square Test The Chi-square test is a nonparametric test that is used to compare experimental results with theoretical models. That is, we will be comparing observed
Hypothesis Testing: Two Means, Paired Data, Two Proportions
 Chapter 10 Hypothesis Testing: Two Means, Paired Data, Two Proportions 10.1 Hypothesis Testing: Two Population Means and Two Population Proportions 1 10.1.1 Student Learning Objectives By the end of this
RA MODEL VISUALIZATION WITH MICROSOFT EXCEL 2013 AND GEPHI
 RA MODEL VISUALIZATION WITH MICROSOFT EXCEL 2013 AND GEPHI Prepared for Prof. Martin Zwick December 9, 2014 by Teresa D. Schmidt (tds@pdx.edu) 1. DOWNLOADING AND INSTALLING USER DEFINED SPLIT FUNCTION
Simple Linear Regression, Scatterplots, and Bivariate Correlation
 1 Simple Linear Regression, Scatterplots, and Bivariate Correlation This section covers procedures for testing the association between two continuous variables using the SPSS Regression and Correlate analyses.
SPSS/Excel Workshop 3 Summer Semester, 2010
 SPSS/Excel Workshop 3 Summer Semester, 2010 In Assignment 3 of STATS 10x you may want to use Excel to perform some calculations in Questions 1 and 2 such as: finding P-values finding t-multipliers and/or
Probability Distributions
 CHAPTER 5 Probability Distributions CHAPTER OUTLINE 5.1 Probability Distribution of a Discrete Random Variable 5.2 Mean and Standard Deviation of a Probability Distribution 5.3 The Binomial Distribution
KSTAT MINI-MANUAL. Decision Sciences 434 Kellogg Graduate School of Management
 KSTAT MINI-MANUAL Decision Sciences 434 Kellogg Graduate School of Management Kstat is a set of macros added to Excel and it will enable you to do the statistics required for this course very easily. To
To launch the Microsoft Excel program, locate the Microsoft Excel icon, and double click.
 EDIT202 Spreadsheet Lab Assignment Guidelines Getting Started 1. For this lab you will modify a sample spreadsheet file named Starter- Spreadsheet.xls which is available for download from the Spreadsheet
Using Excel for descriptive statistics
 FACT SHEET Using Excel for descriptive statistics Introduction Biologists no longer routinely plot graphs by hand or rely on calculators to carry out difficult and tedious statistical calculations. These
Bowerman, O'Connell, Aitken Schermer, & Adcock, Business Statistics in Practice, Canadian edition
 Bowerman, O'Connell, Aitken Schermer, & Adcock, Business Statistics in Practice, Canadian edition Online Learning Centre Technology Step-by-Step - Excel Microsoft Excel is a spreadsheet software application
Coins, Presidents, and Justices: Normal Distributions and z-scores
 activity 17.1 Coins, Presidents, and Justices: Normal Distributions and z-scores In the first part of this activity, you will generate some data that should have an approximately normal (or bell-shaped)
Chapter 3. The Normal Distribution
 Chapter 3. The Normal Distribution Topics covered in this chapter: Z-scores Normal Probabilities Normal Percentiles Z-scores Example 3.6: The standard normal table The Problem: What proportion of observations
Lesson 1: Comparison of Population Means Part c: Comparison of Two- Means
 Lesson : Comparison of Population Means Part c: Comparison of Two- Means Welcome to lesson c. This third lesson of lesson will discuss hypothesis testing for two independent means. Steps in Hypothesis
SPSS Manual for Introductory Applied Statistics: A Variable Approach
 SPSS Manual for Introductory Applied Statistics: A Variable Approach John Gabrosek Department of Statistics Grand Valley State University Allendale, MI USA August 2013 2 Copyright 2013 John Gabrosek. All
Adobe Acrobat X Pro Creating & Working with PDF Documents
 Adobe Acrobat X Pro Creating & Working with PDF Documents Overview Creating PDF documents is useful when you want to maintain the format of your document(s). As a PDF document, your file maintains its
There are six different windows that can be opened when using SPSS. The following will give a description of each of them.
 SPSS Basics Tutorial 1: SPSS Windows There are six different windows that can be opened when using SPSS. The following will give a description of each of them. The Data Editor The Data Editor is a spreadsheet
Lab 1: The metric system measurement of length and weight
 Lab 1: The metric system measurement of length and weight Introduction The scientific community and the majority of nations throughout the world use the metric system to record quantities such as length,
Years after 2000. US Student to Teacher Ratio 0 16.048 1 15.893 2 15.900 3 15.900 4 15.800 5 15.657 6 15.540
 To complete this technology assignment, you should already have created a scatter plot for your data on your calculator and/or in Excel. You could do this with any two columns of data, but for demonstration
MS Excel Short Course in Data Handling & Statistical Function
 MS Excel Short Course in Data Handling & Statistical Function A basic course for new users of MS Excel with a special emphasis on data handling, data organizational and statistical functions. Developed
Stats on the TI 83 and TI 84 Calculator
 Stats on the TI 83 and TI 84 Calculator Entering the sample values STAT button Left bracket { Right bracket } Store (STO) List L1 Comma Enter Example: Sample data are {5, 10, 15, 20} 1. Press 2 ND and
Excel Reports and Macros
 Excel Reports and Macros Within Microsoft Excel it is possible to create a macro. This is a set of commands that Excel follows to automatically make certain changes to data in a spreadsheet. By adding
CHARTS AND GRAPHS INTRODUCTION USING SPSS TO DRAW GRAPHS SPSS GRAPH OPTIONS CAG08
 CHARTS AND GRAPHS INTRODUCTION SPSS and Excel each contain a number of options for producing what are sometimes known as business graphics - i.e. statistical charts and diagrams. This handout explores
Using Microsoft Excel to Analyze Data from the Disk Diffusion Assay
 Using Microsoft Excel to Analyze Data from the Disk Diffusion Assay Entering and Formatting Data Open Excel. Set up the spreadsheet page (Sheet 1) so that anyone who reads it will understand the page (Figure
HYPOTHESIS TESTING: CONFIDENCE INTERVALS, T-TESTS, ANOVAS, AND REGRESSION
 HYPOTHESIS TESTING: CONFIDENCE INTERVALS, T-TESTS, ANOVAS, AND REGRESSION HOD 2990 10 November 2010 Lecture Background This is a lightning speed summary of introductory statistical methods for senior undergraduate
The Center for Teaching, Learning, & Technology
 The Center for Teaching, Learning, & Technology Instructional Technology Workshops Microsoft Excel 2010 Formulas and Charts Albert Robinson / Delwar Sayeed Faculty and Staff Development Programs Colston
Google Sites. How to create a site using Google Sites
 Contents How to create a site using Google Sites... 2 Creating a Google Site... 2 Choose a Template... 2 Name Your Site... 3 Choose A Theme... 3 Add Site Categories and Descriptions... 3 Launch Your Google
Merging Labels, Letters, and Envelopes Word 2013
 Merging Labels, Letters, and Envelopes Word 2013 Merging... 1 Types of Merges... 1 The Merging Process... 2 Labels - A Page of the Same... 2 Labels - A Blank Page... 3 Creating Custom Labels... 3 Merged
Academic Support Center. Using the TI-83/84+ Graphing Calculator PART II
 Academic Support Center Using the TI-83/84+ Graphing Calculator PART II Designed and Prepared by The Academic Support Center Revised June 2012 1 Using the Graphing Calculator (TI-83+ or TI-84+) Table of
Gestation Period as a function of Lifespan
 This document will show a number of tricks that can be done in Minitab to make attractive graphs. We work first with the file X:\SOR\24\M\ANIMALS.MTP. This first picture was obtained through Graph Plot.
Using Excel for Statistical Analysis
 Using Excel for Statistical Analysis You don t have to have a fancy pants statistics package to do many statistical functions. Excel can perform several statistical tests and analyses. First, make sure
Engineering Problem Solving and Excel. EGN 1006 Introduction to Engineering
 Engineering Problem Solving and Excel EGN 1006 Introduction to Engineering Mathematical Solution Procedures Commonly Used in Engineering Analysis Data Analysis Techniques (Statistics) Curve Fitting techniques
Excel 2003 A Beginners Guide
 Excel 2003 A Beginners Guide Beginner Introduction The aim of this document is to introduce some basic techniques for using Excel to enter data, perform calculations and produce simple charts based on
USING EXCEL ON THE COMPUTER TO FIND THE MEAN AND STANDARD DEVIATION AND TO DO LINEAR REGRESSION ANALYSIS AND GRAPHING TABLE OF CONTENTS
 USING EXCEL ON THE COMPUTER TO FIND THE MEAN AND STANDARD DEVIATION AND TO DO LINEAR REGRESSION ANALYSIS AND GRAPHING Dr. Susan Petro TABLE OF CONTENTS Topic Page number 1. On following directions 2 2.
hp calculators HP 50g Trend Lines The STAT menu Trend Lines Practice predicting the future using trend lines
 The STAT menu Trend Lines Practice predicting the future using trend lines The STAT menu The Statistics menu is accessed from the ORANGE shifted function of the 5 key by pressing Ù. When pressed, a CHOOSE
This activity will show you how to draw graphs of algebraic functions in Excel.
 This activity will show you how to draw graphs of algebraic functions in Excel. Open a new Excel workbook. This is Excel in Office 2007. You may not have used this version before but it is very much the
Basic Formulas in Excel. Why use cell names in formulas instead of actual numbers?
 Understanding formulas Basic Formulas in Excel Formulas are placed into cells whenever you want Excel to add, subtract, multiply, divide or do other mathematical calculations. The formula should be placed
Using Excel for Statistical Analysis
 2010 Using Excel for Statistical Analysis Microsoft Excel is spreadsheet software that is used to store information in columns and rows, which can then be organized and/or processed. Excel is a powerful
SPREADSHEETS. TIP! Whenever you get some new data, save it under a new name! Then if you mess things up, you can always go back to the original.
 SPREADSHEETS Spreadsheets are great tools for sorting, filtering and running calculations on tables of data. Journalists who know the basics can interview data to find stories and trends that others may
Scatter Plots with Error Bars
 Chapter 165 Scatter Plots with Error Bars Introduction The procedure extends the capability of the basic scatter plot by allowing you to plot the variability in Y and X corresponding to each point. Each
Introduction to Microsoft Excel 2010
 Introduction to Microsoft Excel 2010 Screen Elements Quick Access Toolbar The Ribbon Formula Bar Expand Formula Bar Button File Menu Vertical Scroll Worksheet Navigation Tabs Horizontal Scroll Bar Zoom
Tools for Excel Modeling. Introduction to Excel2007 Data Tables and Data Table Exercises
 Tools for Excel Modeling Introduction to Excel2007 Data Tables and Data Table Exercises EXCEL REVIEW 2009-2010 Preface Data Tables are among the most useful of Excel s tools for analyzing data in spreadsheet
Computer Skills Microsoft Excel Creating Pie & Column Charts
 Computer Skills Microsoft Excel Creating Pie & Column Charts In this exercise, we will learn how to display data using a pie chart and a column chart, color-code the charts, and label the charts. Part
Confidence Intervals
 Section 6.1 75 Confidence Intervals Section 6.1 C H A P T E R 6 4 Example 4 (pg. 284) Constructing a Confidence Interval Enter the data from Example 1 on pg. 280 into L1. In this example, n > 0, so the
Copyright 2007 by Laura Schultz. All rights reserved. Page 1 of 5
 Using Your TI-83/84 Calculator: Linear Correlation and Regression Elementary Statistics Dr. Laura Schultz This handout describes how to use your calculator for various linear correlation and regression
Excel 2007 A Beginners Guide
 Excel 2007 A Beginners Guide Beginner Introduction The aim of this document is to introduce some basic techniques for using Excel to enter data, perform calculations and produce simple charts based on
Part 3. Comparing Groups. Chapter 7 Comparing Paired Groups 189. Chapter 8 Comparing Two Independent Groups 217
 Part 3 Comparing Groups Chapter 7 Comparing Paired Groups 189 Chapter 8 Comparing Two Independent Groups 217 Chapter 9 Comparing More Than Two Groups 257 188 Elementary Statistics Using SAS Chapter 7 Comparing
Statgraphics Getting started
 Statgraphics Getting started The aim of this exercise is to introduce you to some of the basic features of the Statgraphics software. Starting Statgraphics 1. Log in to your PC, using the usual procedure
Data exploration with Microsoft Excel: analysing more than one variable
 Data exploration with Microsoft Excel: analysing more than one variable Contents 1 Introduction... 1 2 Comparing different groups or different variables... 2 3 Exploring the association between categorical
Instructions for Creating Silly Survey Database
 Instructions for Creating Silly Survey Database Create a New Database 1. Find the shortcut or the file that starts MS Access and click it to activate the program. 2. In the Create a New Database Using
Directions for using SPSS
 Directions for using SPSS Table of Contents Connecting and Working with Files 1. Accessing SPSS... 2 2. Transferring Files to N:\drive or your computer... 3 3. Importing Data from Another File Format...
SPSS Resources. 1. See website (readings) for SPSS tutorial & Stats handout
 for SPSS tutorial & Stats handout") Analyzing Data SPSS Resources 1. See website (readings) for SPSS tutorial & Stats handout Don t have your own copy of SPSS? 1. Use the libraries to analyze your data 2. Download a trial version of SPSS
Analyzing Data SPSS Resources 1. See website (readings) for SPSS tutorial & Stats handout Don t have your own copy of SPSS? 1. Use the libraries to analyze your data 2. Download a trial version of SPSS
Instructions for creating a data entry form in Microsoft Excel
 1 of 5 You have several options when you want to enter data manually in Excel. You can enter data in one cell, in several cells at the same time, or on more than one worksheet (worksheet/spreadsheet: The
APPLYING BENFORD'S LAW This PDF contains step-by-step instructions on how to apply Benford's law using Microsoft Excel, which is commonly used by
 APPLYING BENFORD'S LAW This PDF contains step-by-step instructions on how to apply Benford's law using Microsoft Excel, which is commonly used by internal auditors around the world in their day-to-day
S P S S Statistical Package for the Social Sciences
 S P S S Statistical Package for the Social Sciences Data Entry Data Management Basic Descriptive Statistics Jamie Lynn Marincic Leanne Hicks Survey, Statistics, and Psychometrics Core Facility (SSP) July
Analyzing calorimetry data using pivot tables in Excel
 Analyzing calorimetry data using pivot tables in Excel 1. Set up the Source Table: Start in format 1. a. Remove the table of weights from the top to a separate page so the top row has the column labels.
Easy Calculations in Excel
 Easy Calculations in Excel (2007 and newer) Any time you have a list of numbers that require some sort of calculation like percent change from one year to the next, percent of total, average or just a
Using Excel for Analyzing Survey Questionnaires Jennifer Leahy
 University of Wisconsin-Extension Cooperative Extension Madison, Wisconsin PD &E Program Development & Evaluation Using Excel for Analyzing Survey Questionnaires Jennifer Leahy G3658-14 Introduction You
Formatting Text in Microsoft Word
 Formatting Text - 1 of 44 Formatting Text in Microsoft Word Page Setup 2 Centering Text 3 Line Spacing 4 Paragraph Spacing 4 Indenting a Paragraph s First Line 5 Hanging Indentation 5 Indenting an Entire
Chapter Table & Graph
 Chapter Table & Graph The Table & Graph menu makes it possible to generate numeric tables from functions stored in memory. You can also use multiple functions to generate tables. Since Table & Graph uses
SPSS Explore procedure
 SPSS Explore procedure One useful function in SPSS is the Explore procedure, which will produce histograms, boxplots, stem-and-leaf plots and extensive descriptive statistics. To run the Explore procedure,
paragraph(s). The bottom mark is for all following lines in that paragraph. The rectangle below the marks moves both marks at the same time.
. The bottom mark is for all following lines in that paragraph. The rectangle below the marks moves both marks at the same time.") MS Word, Part 3 & 4 Office 2007 Line Numbering Sometimes it can be helpful to have every line numbered. That way, if someone else is reviewing your document they can tell you exactly which lines they have
MS Word, Part 3 & 4 Office 2007 Line Numbering Sometimes it can be helpful to have every line numbered. That way, if someone else is reviewing your document they can tell you exactly which lines they have
Using Excel in Research. Hui Bian Office for Faculty Excellence
 Using Excel in Research Hui Bian Office for Faculty Excellence Data entry in Excel Directly type information into the cells Enter data using Form Command: File > Options 2 Data entry in Excel Tool bar:
An Introduction to SPSS. Workshop Session conducted by: Dr. Cyndi Garvan Grace-Anne Jackman
 An Introduction to SPSS Workshop Session conducted by: Dr. Cyndi Garvan Grace-Anne Jackman Topics to be Covered Starting and Entering SPSS Main Features of SPSS Entering and Saving Data in SPSS Importing