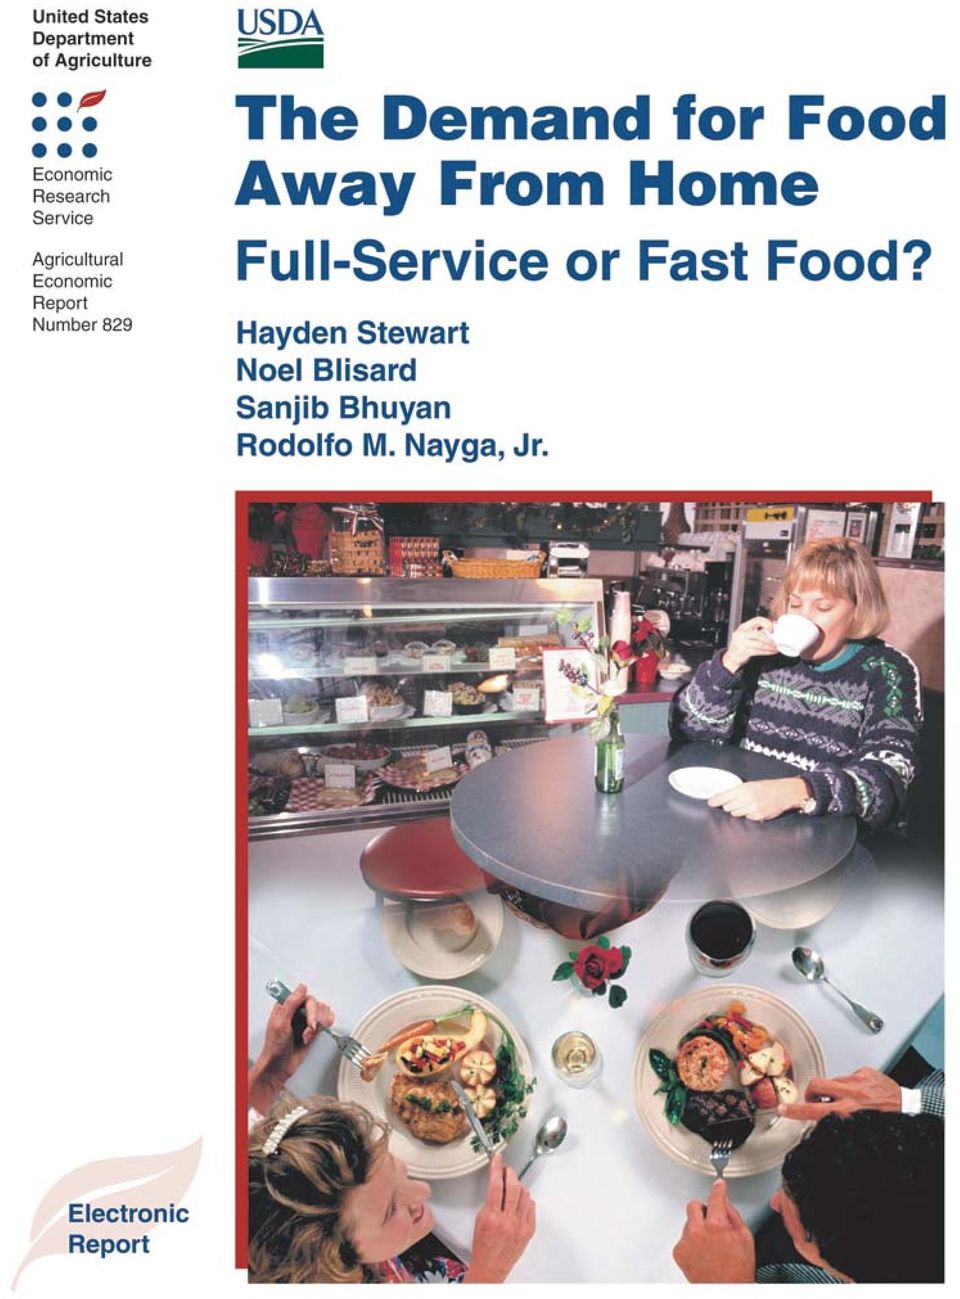
The Demand for Food Away From Home Full-Service or Fast Food?
|
|
|
- Anis Stanley
- 7 years ago
- Views:
Transcription
1
2 United States Department of Agriculture Electronic Report from te Economic Researc Service Agricultural Economic Report No. 829 January 2004 Te Demand for Food Away From Home Full-Service or Fast Food? Hayden Stewart, Noel Blisard, Sanjib Buyan, and Rodolfo M. Nayga, Jr. Abstract Consumer spending at full-service and fast food restaurants will continue to grow over te remainder of tis decade and te next. However, te larger increase is predicted to occur at full-service restaurants. Simulations assuminodest growt in ouseold income plus expected demograpic developments sow tat per capita spending could rise by 18 percent at full-service restaurants and by 6 percent for fast food between 2000 and Te assumed increase in income alone causes suc spending to rise by almost 15 percent and 7 percent at full-service and fast food restaurants, respectively. Te increasing proportion of ouseolds containing a single person or multiple adults witout live-at-ome cildren will cause per person spending to rise by anoter 1 to 2 percent in eac of tese segments. However, te aging of te population will decrease spending on fast food by about 2 percent per capita. Keywords: full-service restaurants, fast food restaurants, food spending, ouseold income. Acknowledgments Te autors tank Mark Denbaly and Nicole Ballenger for teir assistance in preparing tis report. For review comments on earlier drafts, we also tank Oral Capps, Jr., Jon Park, Cung Huang, Wen Cern, and Geoffrey Paulin. Tanks too to Dale Simms for editing and production. Any remaining errors and omissions are solely te te responsibility of te autors.

3 Contents Summary iii Introduction Determinants of Consumer Demand Effect of Houseold Caracteristics on Demand Statistical Model of Away-From-Home Expenditures Simulating Future Away-From-Home Expenditures Implications for Market Composition References Appendix ii Demand for Food Away From Home / AER-829 Economic Researc Service/USDA

4 Summary Consumer spending at full-service and fast food restaurants will continue to grow over te remainder of tis decade and te next. However, te larger increase will likely occur at fullservice restaurants. Simulations assuminodest growt in ouseold income plus expected demograpic developments sow tat per capita spending could rise by 18 percent at full-service restaurants and by 6 percent for fast food between 2000 and Te assumed increase in income alone causes suc spending to rise by almost 15 percent and 7 percent at full-service and fast food restaurants, respectively. Te increasing proportion of ouseolds containing a single person or multiple adults witout live-at-ome cildren will cause per person spending to rise by anoter 1 to 2 percent in eac of tese segments. However, te aging of te population will decrease per person spending on fast food by about 2 percent per capita. Fast food restaurants ad been increasing teir sare of te growing away-from-ome market until te middle of te 1990s. Sales at fast food restaurants briefly surpassed tose at full-service restaurants around te same time. However, te fast food sare of te awayfrom-ome market as been relatively steady since ten. In 2002, full-service restaurants again accounted for a sligtly larger sare of total sales. A ouseolds demand for food away from ome depends on its income as well as on its demograpics. A 10-percent increase in a typical ouseolds per capita income would cause it to spend 6.4 percent and 3.2 percent more per capita at full-service and fast food restaurants, respectively. Away-from-ome expenditures are typically iger for single-person ouseolds and ouseolds containinultiple adults witout live-at-ome cildren. For instance, a single person spends almost $3 more per person eac week at eac type of establisment tan an oterwise identical person wo is married and as live-at-ome cildren. Current and future canges in te away-from-ome market could reflect canges in te diet and ealt of American consumers. Any sift in market sare between fast food and fullservice restaurants may reflect important canges in wat people are eating away from ome, because fast food tends to ave different quantities of fat and calories tan meals prepared at full-service restaurants. Tis study also represents a necessary first step in understanding ow and wy te structure of te foodservice industry is canging. As te demand for meals and snacks at full-service restaurants increases relative to te demand for fast food, restaurant companies will be motivated to adjust wat menu items and services tey offer. To be sure, suc adjustments migt also alter any projected canges in market sare between full-service and fast food establisments. Economic Researc Service/USDA Demand for Food Away From Home / AER-829 iii

5 Te Demand for Food Away From Home Full-Service or Fast Food? Hayden Stewart, Noel Blisard, Sanjib Buyan, and Rodolfo M. Nayga, Jr. * Introduction Americans now spend nearly alf of teir food dollars on meals and snacks at foodservice facilities, suc as restaurants, otels, and scools. Total away-fromome expenditures, defined to include all food dispensed for immediate consumption outside of te consumers ome, amounted to $415 billion in Tat is about 58 percent greater tan annual awayfrom-ome expenditures in 1992 wic totaled $263 billion. Even after accounting for inflation and business cycles (fig. 1), expenditures still increased by 23 percent between 1992 and We anticipate tat ouseolds will continue to increase teir spending on foodservice meals and snacks at an annual rate of about 1.2 percent in real (inflation-adjusted) terms (Blisard et al., 2003). 2 Rising ouseold incomes and demograpic developments, suc as smaller ouseold sizes, will account for tis. However, it is not clear wat types of foodservice facilities will be selling tese meals and snacks. * Sanjib Buyan is a member of te faculty at te Department of Agricultural, Food, and Resource Economics at Rutgers University. Rodolfo M. Nayga, Jr., is a member of te faculty at te Department of Agricultural Economics at Texas A&M University. 1 Figures reported in tis study are supplied by te Economic Researc Service (ERS) and do not include alcool. However, estimates of total expenditures do include te value of food consumed away from ome, even if not purcased, suc as te value of food distributed in some institutional facilities, as well as taxes and tips. See Mancester (1987) for a more detailed explanation of ow ERS figures are calculated, including te distinction between sales and expenditures. Oter sources report similar estimates of te markets size even toug tese sources base teir calculations on very different formulas. Te National Restaurant Association, for one, empasizes te value of sales by restaurant companies. For 2002, it estimated te value of sales at $407.8 billion. 2 Industry studies ave also projected te continued growt of te market including analyses by te National Restaurant Association (Restaurant Industry 2010: Te Road Aead) and a consulting firm (Foodservice 2010). A diverse array of foodservice firms full-service restaurants, fast food establisments, otels, retail stores, recreation places, bars, and operators of vending macines compete for te consumers awayfrom-ome dollar. However, full-service and fast food restaurants ave captured te bulk of te market, wit 39.9 percent and 37.9 percent of total sales in 2002 (fig. 2). 3 Full-service restaurants, defined as establisments wit waitstaff, tend to offer more varied menus and dining amenities. Fast food establisments tend to empasize convenience (table 1). Te composition of te away-from-ome market is dynamic. Te full-service and fast food segments now command a similar sare of te market, but it is unclear wic segment is poised to expand relative to te oter. Until te middle of te 1990s, sales of fast food were increasing faster, and briefly surpassed tose at full-service restaurants. Tis upsurge was buoyed by te strategic location of new fast food outlets. Convenience is a major sales point for fast food operators. If driving to an outlet takes longer tan cooking at ome, ten fast food is not truly convenient. 4 Tus, as fast food companies open more outlets per square mile in appropriate locations, consumers ave to travel less for fast food, on average. In turn, tese new store openings ave stimulated te demand for fast food (Jekanowski et al., 2001). Te proliferation of fast food restaurants can be seen in a trend known as cannel-blurring, wereby gas stations and retail stores, suc as Wal-Mart and Target, are osting foodservice cains like Pizza Hut and Taco Bell. 3 Te National Restaurant Association estimates tat, in 2002, sales by full-service restaurants totaled $146 billion and sales by fast food restaurants amounted to $116 billion (Restaurant Industry Forecast 2003). 4 Making a meal convenient includes building outlets near were consumers live, work, and sop. Convenience also means speedy service. For example, wen it comes to drive-tru service, it appears tat a goal among fast food cains is to serve customers in under 3 minutes. In 2002, te average service time from wen a car reaces te speaker to te cars driver receiving is or er food at 25 major cains was about 187 seconds (Tutor, 2003). Economic Researc Service/USDA Demand for Food Away From Home / AER-829 1

6 Table 1 Segments of te market at a glance Item Full-service Fast food Sare of sales in 2002 (percent) Number of outlets 2 191, ,774 Number of paid employees (million) Sales points and dining amenities Variety Convenience 1 CPI, Prices, and Expenditures: Expenditure Tables. USDA/ERS. Te remainder, 22.2 percent, is for sales at otels/motels, scools and colleges, retail stores, recreational places, and oter foodservice establisments Economic Census. Accommodation and Foodservice. Bureau of te Census. Te relative expansion of te fast food market segment appears to ave stalled in recent years. In 2002, sales at full-service restaurants accounted for a sligtly larger sare of total away-from-ome spending, wile, in 2003, McDonalds reduced its estimates for nearterm sales growt from 15 percent to 2 percent (Gogoi and Arndt, 2003). Meanwile, Burger King was sold to a group of investors in December 2002 for $1.5 billion. Five monts earlier, tese same investors ad offered $2.26 billion for te company. Reasons cited by te investors for scaling back teir offer included te competitive environment in wic Burger King and oter fast food cains now operate. Te full-service restaurant segment is seemingly poised to expand its sare of te away-from-ome market (Restaurant Industry 2010: Te Road Aead). 5 Te National Restaurant Association believes tat te overall growt of te market will depend on rising incomes and demograpic canges. However, it also argues tat tese demand forces will ave te greatest 5 Foodservice 2010, a report by a consulting company, McKinsey & Co., also expresses tis same view. Figure 1 Annual away-from-ome expenditures Expenditures ($bil.) Nominal Real Source: Food CPI, Prices, and Expenditures: Expenditure Tables. Economic Researc Service. impact on te kinds of services and types of menus typically available at full-service restaurants. Any sift in market sare between fast food and fullservice restaurants may furter affect wat foods and services restaurants of bot types offer. If trends in demand favor full-service restaurants, te market could soon include more full-service restaurants offering more varied menus and a wider range of dining amenities. Fast food restaurants migt also introduce many of tese same foods and services temselves. Developments in te demand for foodservice meals and snacks could also reflect important canges in te diet and ealt of te American population. Fast food tends to ave different quantities of fat and calories tan meals prepared at full-service restaurants (Lin and Frazao, 1999). Tus, to te extent tat any sift in expenditures reflects canges in consumption, it is likely tat canges also are occurring in te ealtfulness of wat consumers are eating away from ome. Tis study examines ow te demand for food away from ome is canging, ow tese canges could affect te size of te full-service and fast food segments, and te implications for ow restaurants migt respond. In particular, we focus on ow developments in te economic and demograpic caracteristics of te Nations population may be leading to canges in demand for te foods and services supplied by restaurants. Important trends in te U.S. population include rising incomes, an aging population, smaller ouseold sizes, and an increasingly ig proportion of ouseolds containing single people or multiple adults witout live-at-ome cildren. Tese developments could prompt canges in te demand for food away from ome tat will affect bot te supply of restaurant foods and services as well as te diet and ealt of te consumers wo demand tose items. Figure 2 Te away-from-ome market by outlet type Percent of sales 40 Full-service Fast food Source: Food CPI, Prices, and Expenditures: Expenditure Tables. Economic Researc Service. 2 Demand for Food Away From Home / AER-829 Economic Researc Service/USDA

7 Determinants of Consumer Demand Te teory of ouseold production, outlined by Becker (1965), extends classical demand teory to consider ow prices, income, demograpics, and time constraints can all influence a ouseolds purcases of items like food. Tis economic model of ouseold beavior olds tat te costs of consumption can include prices as well as time spent eating food, preparing food, and cleaning up after a meal or snack. A ouseold must terefore decide weter to spend time on all aspects of te activity of eating a meal (i.e., prepare food at ome) or outsource some aspects like preparation and cleaning up (i.e., purcase food away from ome). Te optimal decision depends on many factors, including te ouseolds finances, te opportunity cost of its managers time, and ow well te ouseold manager can cook. In te context of Beckers model, a ouseold manager can be defined as te person primarily responsible for sopping, cooking, cleaning, and oter ouseold cores. Empirical analyses ave furter sown ow specific economic and demograpic caracteristics of a ouseold can influence its demand for food away from ome by market segment. Four suc studies use ouseold survey data from te 1970s and 1980s. McCracken and Brandt (1987) and Byrne et al. (1998) analyzed te relationsip between some key ouseold caracteristics and expenditures at eac type of restaurant. Nayga and Capps (1994) studied te relationsip between a ouseolds caracteristics and its frequency of dining at eac type of facility. Also, Hiemstra and Kim (1995) analyzed te impact of ouseold caracteristics on expenditure by eating occasion and market segment. 6 Caracteristics found to be important in tese studies include te ouseolds income, time constraints faced by te ouseold manager, te ouseold managers age, number of people in te ouseold, education level of te ouseold manager, te ouseolds region of residence, and te ouseolds race and etnicity. Houseolds wit iger incomes tend to spend more on products and services, including leisure, variety, and dining amenities like waitstaff, ambience, and alcool service. Food away from ome is a form of 6 Eating occasion was defined to include, for example, breakfast, lunc, and dinner. leisure were leisure is defined as time spent outside of bot te labor force and ouseold production. Bot fast food and full-service restaurants can provide leisure for a ouseold manager wo is freed from cooking, cleaning, and sopping. Moreover, along wit te additional leisure, ouseolds wit more income may also buy more variety and oter dining amenities. Tus, ouseolds wit iger incomes ave been sown to ave iger expenditures for bot fast food and full-service meals and snacks, but spending at full-service restaurants is most responsive to any canges in income (e.g., McCracken and Brandt, 1987; Byrne et al., 1998). Houseolds also may demand more food away from ome as teir manager works longer ours outside te ome. In particular, fast food may come to represent a convenient meal option, if suc a restaurant is reasonably accessible. Spending for fast food as been sown to increase along wit te number of ours worked by a ouseold manager in te labor force (e.g., Byrne et al., 1998). By contrast, dining at a fullservice restaurant can take as long as preparing, eating, and cleaning up after a meal at ome. Tus, tere is neiter a clear teoretical nor empirical relationsip between a ouseolds demand for food at full-service restaurants and its time constraints. Te number of people living in a ouseold also may influence its demand for meals and snacks away from ome. In particular, as a ouseold adds more members, food prepared at ome may become more economical. For example, it migt take 20 minutes to prepare a meal for one person at ome, but just 30 minutes to prepare a meal for four people. Wen cooking at ome, te ouseold wit more members can also benefit by purcasing larger package sizes wit lower per unit costs. In total, single-person ouseolds will likely ave te igest time and monetary costs per person for eating at ome, wile larger ouseolds will incur lower costs per capita. Empirical studies do find tat larger ouseolds tend to spend less money per capita away from ome (e.g., McCracken and Brandt, 1987). A ouseolds demand for food away from ome also may depend on te ages of its members. One reason is tat tastes may cange as people age. For example, if te sensitivity of taste buds diminises wit age, older people may demand foods wit bolder flavors (Friddle et al., 2001). Also, older and younger people may ave different opportunities to socialize, so if tey Economic Researc Service/USDA Demand for Food Away From Home / AER-829 3
 or outsource some aspects like preparation and cleaning up (i.e., purcase food away from ome).")
8 eat out for different reasons, tey may logically go to different kinds of establisments. On balance, empirical studies find tat ouseolds wit younger members tend to spend more money on fast food, wile ouseolds wit older people tend to spend more money on full-service dining (Byrne et al., 1998). Te impact of aging on demand is complicated by uncertainty about weter generations will retain teir distinctive eating abits as tey age. For example, will an elderly person in 2020 ave te same expenditure patterns as an elderly person now wit similar caracteristics? Peraps not. Younger generations know less about cooking tan earlier generations did at te same point in teir life (Foodservice 2010). However, even if tis argument is true, younger generations may still evolve like older generations. Younger generations may compensate for teir lack of skills by taking advantage of te growing array of prepared foods and convenience appliances. In fact, Blisard (2001) finds tat members of different generations tend to ave similar beavior away from ome at te same points in teir lives. Does te structure of a ouseold also influence its demand for meals and snacks away from ome? For instance, a married couple wit cildren is likely to ave different preferences and preparation capabilities tan a single-parent family, a single-person ouseold, and multiple adults living togeter witout cildren. Even after controlling for ours worked in te labor force and income, members of eac of tese types of ouseold may not sare te same opportunities to socialize or face te same time constraints. Tis is a subject area not taken up by previous researc. Effect of Houseold Caracteristics on Demand Our first step in tis analysis is to identify te caracteristics of a ouseold tat are potential determinants of its demand for food away from ome. In addition to caracteristics identified in past studies, we include te structure of a ouseold, weter it is comprised of a married couple wit cildren, a single parent wit cildren, a single person, or multiple adults witout live-at-ome cildren. A data set must also be identified to empirically examine te relationsips between te caracteristics of a ouseold and tat ouseolds demand for meals and snacks at bot fast food and full-service restaurants. Canging Structure of Houseolds Te increasing incidence of alternative types of ouseold in te U.S. as been muc publicized (e.g., Kinsey, 1990). In tis study, we define a traditional ouseold as a married couple wit live-at-ome cildren. Traditional ouseolds accounted for 30.2 percent of all ouseolds in 1980, but just 23.5 percent in 2000 (Cromartie, 2002). Single-person ouseolds, single-parent families, and ouseolds of multiple adults witout a live-at-ome cild are on te rise (see box, Canging Structure of American Houseolds ). Differences are likely to exist in te preferences and ouseold production capabilities of diverse types of ouseolds. Members of single-person ouseolds may be more likely to socialize and date tan members of a traditional family. But do tese pursuits inflate ones expenditures at full-service or fast food establisments? For example, datinigt lend itself to fullservice restaurants promising a leisurely dining experience, wile fast food establisments wit play facilities may appeal more to families wit cildren. Single-parent ouseolds also may differ from traditional ouseolds in tat tey are more likely to contend wit limited social opportunities, financial insecurity, and greater time constraints. Tese factors could influence a single-parent ouseolds demand for convenience or oter amenities associated wit dining away from ome. A ouseold wit multiple adults and no cild rearing responsibilities could also be very different. Having no cildren to raise could increase te ouseolds ability to finance dining away from ome, and expand its set of social opportunities. Greater financial resources and fewer time constraints migt encourage te ouseold to spend more money at full-service restaurants in particular. Data Used in te Analysis To test ypoteses about ow a ouseolds demand for food away from ome is affected by its structure and oter caracteristics, we need a data set wit information on ouseolds, teir caracteristics, and ow muc tey spend in eac market segment. Te ideal set of data for tis study would include information on at least several tousand ouseolds, te caracteristics of eac ouseold, and ow muc eac 4 Demand for Food Away From Home / AER-829 Economic Researc Service/USDA

9 Canging Structure of American Houseolds Te structure of te American ouseold is canging. Te average age is iger, people are better educated, and tere are fewer members per ouseolds. More Americans are also living outside of a traditional family (a married couple wit live-atome cildren). A ouseolds structure can ave significant implications for ow it buys and prepares food. For example, families wit tree or more cildren are considered a prime market for te basic food ingredients and volume discounts traditionally provided by grocery stores (Kinsey, 1990). Demograpic canges are beind te increasing frequency of nontraditional ouseolds. Tere are more "empty nest" adults living togeter after teir cildren ave grown up, as well as more unmarried people wo are peraps waiting longer to get married or wo ave been widowed (Cromartie, 2002). Tis report seeks to determine weter nontraditional ouseolds eat out more or less often tan teir traditional counterparts, and were tey tend to spend teir money. For example, as compared wit a married couple engaged in cild rearing, single people may ave more social opportunities to dine out at full-service restaurants. Multiple adults, no cildren (39.8%) Multiple adults, no Cildren (41.5%) Traditional Family (23.5%) Single person (22.7%) Single parent (7.3%) Traditional Family (30.2%) Single person (25.8%) Single parent (9.2%) Source: Derived from Cromartie, 2002, wo provides projections for traditional, single-person, and single-parent ouseolds. He also provides a projection for married couples witout cildren. However, tese four categories are not all encompassing. Some ouseold types do not belong to any group, e.g., unmarried, coabitating adults witout cildren. Tus, in tis study, we derived projections for ouseolds comprised of multiple adults witout cildren by determining te percentage of ouseolds not belonging to any one of te oter tree groups. It follows tat tis fourt group includes all ouseolds wit multiple adults and no cildren. Multiple adults, no cildren (46%) 2020 (Projected) Traditional Family (16.7%) Single person (28.6%) Single parent (8.7%) Economic Researc Service/USDA Demand for Food Away From Home / AER-829 5

10 ouseold spent in eac market segment. Moreover, it would follow tis sample of ouseolds over 20 to 50 years, and report on ow eac ouseolds caracteristics and expenditures ave canged. By witnessing ow eac ouseolds food spending canged wit its caracteristics, we migt project ow spending is likely to furter evolve as eac current ouseold becomes wealtier, older, or different in structure. Unfortunately, tese data are not available. Still, employing some assumptions, we can adapt existing sources of data to undertake te same sort of analysis. Te Bureau of Labor Statistics (BLS) provides te only public survey of ouseold caracteristics and ouseold expenditures. 7 Te BLS Consumer Expenditure Survey (CES) is an annual representative sample of spending by American ouseolds. 8 In te diary section of te survey, eac ouseold reports its expenditures on food away from ome and oter goods for 2 weeks. Tese data can also be matced wit information about eac ouseold, suc as its income, number of members, region, and race. Te CES does not follow te same ouseolds over time, and it does not classify ouseold expenditures away from ome prior to Te BLS surveys a ouseold for one 2-week period, and ten drops tis ouseold from its survey. Tus, eac annual survey contains a completely different set of ouseolds. Moreover, because te BLS did not break down awayfrom-ome spending on fast food versus food at fullservice restaurants prior to 1998, we can only use data on ouseold caracteristics and teir spending patterns for 1998, 1999, and An additional limitation of ouseold surveys in general, including te CES, is tat tey do not include 7 Te National Panel Diary Group (NPD) also undertakes suc a survey, Consumer Reports on Eating Sare Trends (CREST). However, tese data ave not been available for use by outside researcers in recent years. 8 It includes only noninstitutional ouseolds. An institutional ouseold would include people living in institutions, suc as prisons or military facilities. 9 We also removed ouseolds providing incomplete information on key caracteristics and/or reporting negative incomes from te sample. Te CES designates ouseolds as "complete" or "incomplete" income reporters, depending on teir response to income questions. Te distinction between complete and incomplete reporters is based, in general, on weter or not te respondent provided values for major sources of income, suc as wages and salaries, self-employment income, and Social Security income. However, even complete income reporters may not ave provided a full accounting of all income from all sources. It is also possible expenditures by businesses or for people in institutions. It follows tat te analysis in tis study does not capture all of te away-from-ome market. In order to determine ow muc of te market is captured by te CES, we undertook a back of te envelope calculation. In 2000, among ouseolds completing te survey, we find tat per capita away-from-ome spending averaged $19.21 eac week, not including alcool. It follows tat ouseolds in te United States spent about $1,000 per person per year. Tus, since te U.S. population equaled 281 million in 2000, it can be furter estimated tat spending by all ouseolds was around $281 billion. We estimate tat te CES captures about 75 percent of te total market, since te size of te away-from-ome market was approximately $385 billion in 2000 (fig. 1). Statistical Model of Away- From-Home Expenditures Te statistical model used in tis report relates a ouseolds pattern of spending away from ome to its economic and demograpic caracteristics, but not to prices. We recognize tat prices are an important determinant of demand. However, since te CES does not contain information on prices and our data were collected over a sort period of time, we assume tat tere was little variation in te price of fast food relative to te price of food at full-service restaurants over te period wen te data were collected. In oter words, ouseolds are assumed to ave faced similar relative prices. 10 Tis assumption allows us to view a ouseolds expenditures on meals and snacks as value-weigted quantities. For example, a meal at a full-service restaurant may be more costly tan a meal at a fast food restaurant. It is terefore possible tat a ouseold eats fast food more often tan full-service meals, but reports similar expenditures in bot market segments. In tis case, price differences serve to for complete reporters to report negative incomes due to selfemployment or oter income losses. In tis study, incomplete income reporters and complete reporters wit negative incomes are excluded. In eac year, te final sample includes about 5,000 ouseolds. 10 Our data were collected over 3 years. We allow prices to vary from year to year. We also allow prices to depend upon te season of te year wen te survey was administered as well as upon te region of te country in wic te ouseold resides. Houseolds are assumed to face similar prices oterwise. Studies of te awayfrom-ome market commonly make tis same assumption, including McCracken and Brandt (1987) and Byrne et al. (1998). 6 Demand for Food Away From Home / AER-829 Economic Researc Service/USDA
 provides te only public survey of ouseold caracteristics and ouseold expenditures.")
11 weigt te value of purcases to te ouseold. In fact, a similarity of expenditures in te two segments would suggest tat te ouseold receives similar levels of satisfaction from its total purcases of bot types of food away from ome. Viewing prices as weigts for aggregating purcases in tis way is consistent wit classical demand teory (Green, 1964). Te Statistical Model Te statistical model will provide more accurate estimates of te relationsips between a ouseolds caracteristics and its spending away from ome, if we simultaneously estimate te equations for spending on fast food and spending at full-service restaurants. For instance, because of variation in ow muc ouseold managers enjoy (or dislike) cooking, some ouseolds may eat out relatively infrequently (or frequently) at bot types of facility. If so, a correlation is said to exist between a ouseolds spending at full-service restaurants and te same ouseolds spending on fast food. Including tis correlation in te model will improve its accuracy, wic can be accomplised using existing procedures for simultaneously estimating models wit multiple equations. 11 Obtaining accurate estimates of te relationsip between ouseold caracteristics and away-fromome expenditures requires a special statistical procedure to account for ouseolds tat do not ave any suc expenditures. During te 2-week survey period, 21 percent of ouseolds completing te CES spent no money on fast food, and 45 percent spent no money at a full-service restaurant. Tis lack of purcases is known as zero-censoring, and raises some estimation problems. If te data contain many zero-expenditure observations, results based on usual metods of estimation could be biased. Models tat allow a researcer to estimate multiple equations simultaneously and to account for zero-censoring include tose developed by Heien and Wessells (1990) and Sonkwiler and Yen (1999). Here, we apply te latter model because it appears to be te most accurate and is state-of-te-art. 12 A brief description of tis model follows, and a more detailed description is supplied in te appendix. Te Sonkwiler and Yen metod proceeds in two steps to correct for te problem of zero-censoring. In our study, te first step analyzes weter eac ouseold completing te CES ad non-zero expenditures in eac market segment. In particular, te probability tat a ouseold spends some money on fast food is estimated as a function of te ouseolds income, time constraints, and demograpic caracteristics. Te same equation is also estimated for eac ouseolds decision about weter to spend some money at fullservice restaurants. Tese results are ten used in te second step. At tis point, we derive equations relating a ouseolds income and demograpic caracteristics to its expenditures in bot market segments. Tese equations contain an adjustment to correct for te fact tat many ouseolds spent noting, wic is based on te results of estimating te aforementioned probabilities in te first step. Te adjusted equations for spending at fast food and at full-service restaurants can ten be estimated using ordinary tecniques for te simultaneous estimation of multiple equations. Definition of Variables Data in te CES must be prepared for use in te statistical model before te analysis can be conducted. In particular, variables must be calculated from te raw data in te CES. We specify and create several variables, suc as measures of ouseold expenditures, ouseold income, ours worked by ouseold managers, ouseold structure, te age of a ouseold manager, and te number of people living in a ouseold (table 2). To calculate te values of per capita expenditures at fast food and full-service restaurants, we divided a ouseolds weekly expenditures at eac type of facility by te number of members in te ouseold. Inflation-adjusted spending was ten determined by dividing expenditures by te Consumer Price Index (CPI) 13 for all items. 11 Tis procedure is known as a seemingly unrelated regression. 12 Te metod of Heien and Wessells (1990) as been widely applied over te past decade, including by Byrne et al. (1998). However, Sonkwiler and Yen (1999) ave found a sortcoming of tis model and present an alternative specification. Furtermore, tey use Monte Carlo tecniques to demonstrate tat teir proposed specification is statistically more accurate. Te metod of Sonkwiler and Yen (1999) as been recently applied in several studies (e.g., Su and Yen, 2000 ; Yen et al., 2002). 13 Fourt quarter of 2000 = 100. Economic Researc Service/USDA Demand for Food Away From Home / AER-829 7

12 Table 2 Variables measuring expenditures and ouseold caracteristics, calculated from CES Variable Mean Definition Expenditures: Full-service restaurant $8.43 Per capita, average weekly spending at full-service restaurants Fast food $8.15 Per capita, average weekly spending on fast food Houseold caracteristics: Income $ Houseolds per capita, average weekly, real, before-tax income Hours worked by manager 24.2 Hours spent in te labor force by te ouseold manager Age of manager Age of te ouseold manager College-educated manager 0.25 Indicator variable of weter ouseold manager as a college education Size of ouseold 2.56 Number of members reported to be living in te ouseold Race: Asian Indicator variable of weter respondent or spouse identified temselves as Asian Black 0.09 Indicator variable of weter respondent or spouse identified temselves as Black Hispanic 0.11 Indicator variable of weter respondent or spouse identified temselves as Hispanic Houseold type: Traditional 0.27 Indicator variable of weter respondent is married wit live-at-ome cildren Single 0.28 Indicator variable of weter respondent lives alone Multiple adults witout cildren 0.35 Indicator variable of weter respondent lives wit at least one oter adult but no cildren Single parent 0.10 Indicator variable of weter respondent is an unmarried adult wit live-at-ome cildren Since income is a key variable tat explains spending, we calculated tis variable from data in te CES as well. To do so, we divided a ouseolds total income by te number of ouseold members to obtain per capita income. Per capita income was ten made weekly (divided by 52) and stated in real terms (divided by te CPI). Data in te CES were also used to calculate ours worked eac week outside of te ome by te ouseold manager. However, te CES does not identify te ouseold manager te person primarily responsible for ouseold cores. Yen (1993), wo also used te CES, circumvented tis issue by studying te impact of ours worked by married women. However, tis study takes a sligtly different approac. Eac ouseolds manager is defined as te survey respondent if te person was single. For married respondents, te ouseold manager is assumed to be te spouse wo works te fewest ours outside te ome. 14 Tree binary variables were also created to capture ouseold structure. Eac variable corresponds to one of te tree nontraditional types of ouseold identified in tis report. Tese variables equal one if te ouseold belongs to a certain type, and zero oterwise. For example, one variable identifies weter a ouseold includes only a single person. It equals one for te 28 percent of ouseolds in our sample wo are single, and zero for te oter 72 percent. All ouseolds were classified as belonging to eiter one 14 Tis approac is straigtforward for ouseolds wit eiter only one adult or a married couple. However, it may be less clear wen applied to ouseolds wit multiple unmarried adults, e.g., samesex couples. In suc a case, te ouseold manager is always te survey respondent. Tere are two reasons for tis default approac. First, te CES does not include information on adults in a ouseold wo are not married to te survey respondent. Second, it is arguable tat te action of responding to te CES is itself a domestic core. If so, it is furter likely tat te person wo maintains te diary section of te CES is te primary ouseold manager. 9 Demand for Food Away From Home / AER-829 Economic Researc Service/USDA

13 of te tree types of nontraditional ouseold or as being a traditional ouseold. 15 Oter ouseold caracteristics in our model include te age of te ouseold manager; number of people living in te ouseold; weter te ouseold manager ad completed college or attained a iger level of education; ouseold region; year te survey was completed; season in wic te survey was completed; and weter a member of te ouseold described imself or erself as belonging to a minority group including Black, Asian, or Hispanic. Results of Model Estimation Te results of our statistical analysis agree wit bot economic teory and past studies. Houseold structure, a variable not considered in past studies, also is found to ave a statistically significant impact on ow muc a ouseold spends in eac segment of te market. Estimated relationsips are evaluated at te sample means sown in table 2. Te results describe ow an average ouseold could be expected to adjust its expenditures in response to a cange in a variable, suc as its income or ouseold type (table 3). Oter statistical results are supplied in te appendix. Spending in bot market segments responds positively to an increase in per capita income. However, a 10- percent increase in per capita income would cause a typical ouseold to augment its per capita expenditures on fast food by about 3.2 percent, versus 6.4 percent for full-service restaurants. Like past studies, including Byrne et al. (1998) and McCracken and Brandt (1987), our analysis suggests tat ouseolds wit more income buy more leisure as well as more of oter dining amenities. Time spent by te ouseold manager in te labor force also as significant implications for ow muc a 15 For tis reason, we did not include a variable to account for weter a ouseold was traditional. Since eac ouseold in te data is classified as belonging to one type and only one type, a proper statistical analysis requires tat we omit one category of ouseold from te analysis. Tis omission creates te ortogonal relationsip among predictor variables tat is required for estimating a covariance matrix and conducting ypotesis tests. Te consequence is tat te identified relationsips between te tree variables in te model and expenditures must be interpreted as a measure of te difference in per capita weekly spending by tese ouseolds and traditional ouseolds. Table 3 Relationsip between ouseold caracteristics and expected expenditures Caracteristic Full-service Fast food Cange in expenditures due to a 10-percent increase in te variable: Percent Income Hours worked by manager Size of ouseold Age of manager Absolute cange in expenditure due to ouseold taking on te caracteristic: Dollars College-educated manager Single-person ouseold Single-parent family Multiple adults witout cildren Asian ouseold Black ouseold Hispanic ouseold ouseold spends away from ome. Spending for fast food is especially sensitive. A typical ouseold increases its per capita spending on fast food by about 1.4 percent following a 10-percent increase in te number of ours worked outside te ome by its manager. By contrast, tis same ouseold would increase its per person spending at full-service restaurants by only about 0.5 percent. Te link between time constraints and spending for fast food but not for fullservice restaurants as been establised. Te impact of aging also varies by market segment. Houseolds wit older managers dine at fast food establisments less frequently and, as a consequence, spend less money. An increase of 10 percent in te age of a ouseold manager reduces te same ouseolds per capita expenditures on fast food by about 6 percent. However, te same increase in age does not negatively affect spending at full-service restaurants (table 3). As oter studies ave found, peoples preferences for food and services may tend to favor fullservice restaurants as tey age. Larger ouseolds spend less money per capita in bot market segments. Tis finding supports prior researc arguing tat economies exist in purcasing and preparing meals at ome. A typical ouseold can be expected to reduce suc spending in bot market segments about 2 Economic Researc Service/USDA Demand for Food Away From Home / AER

14 percent following a 10-percent increase in te number of people living in te ouseold (table 3). Houseold structure also is important. However, because of te way variables capturing tis structure are defined, we must be careful to interpret our results. Te most appropriate interpretation of variables capturing ouseold structure is to consider ow a nontraditional ouseold wit oterwise typical caracteristics would likely adjust its spending away from ome if it became a traditional ouseold. For example, as compared wit a traditional ouseold, iger per capita expenditures are typical of singleperson and cildless ouseolds. Indeed, a single person spends almost $3 more per person at eac type of establisment. Tus, a single person could be expected to reduce is or er per capita spending away from ome by $3 (for bot fast food and full-service food) if e or se married and ad a cild. Single parents and teir cildren are te only type of ouseold tending to spend less per capita tan traditional ouseolds. Single parents spend about 83 cents less per person at eac type of establisment tan do teir married counterparts. It follows tat a married person wit cildren and oterwise typical caracteristics can be expected to reduce spending on fast food by 83 cents per person per week sould e or se divorce or become widowed. Oter variables, like race and education, are also significant determinants of ow muc a ouseold spends away from ome. For instance, between 1998 and 2000, wen all oter variables are set at teir mean value, a Black ouseold still spent $2.87 less per person at full-service restaurants tan did oter ouseolds (table 3). Tis finding is consistent wit past studies, and may reflect differences in tastes, or possibly more limited access to foodservice establisments. Simulating Future Away-From- Home Expenditures Future canges in demand can be simulated by incorporating into our statistical model expectations about ow key variables may cange. Tese projected canges are based on modest growt in income, no cange in ours worked by ouseold managers, and te likely evolution of demograpic variables, suc as age of ouseold managers, between 2000 and Tis same procedure as been used by Blaylock and Smallwood (1986), Blisard and Blaylock (1993), and Blisard et al. (2003). One way to interpret our simulation is as a snapsot of ow people would ave beaved in 2000, if te projected canges in te population for 2020 were already in place in For instance, we migt ask ow spending on fast food would ave been different in 2000 if ouseold types assumed te same proportions as we expect in Tis interpretation is te best one because of a number of assumptions we ave to make. First, we assume tere will be no cange in te price of fast food relative to te price of food at fullservice restaurants. If suc a cange were to occur, it could cause ouseolds to spend more or less tan te simulated amount. Second, we assume tat ouseold caracteristics will continue to influence consumer beavior in te same way. For example, as a consumer moves from one demograpic group to anoter, is or er preferences will take on te caracteristics of te new group. Tus, an elderly person in 2020 is assumed to ave te same expenditure patterns as an elderly person in 2000 wit similar caracteristics (some evidence to justify tis latter assumption is provided by Blisard (2001) for te case of spending away from ome). Tird, our simulation olds constant factors like te number and location of restaurants as well as te mix of food and services supplied by restaurants. For instance, it is assumed tat fast food restaurants will continue to supply te same types of food and te same dining amenities as tey did in We will later consider te significance of relaxing tis assumption, i.e., fast food restaurants offering more varied menus and eigtened services. Projected canges in te U.S. population include modest growt in ouseold incomes. Real per capita disposable income increased by 1.2 percent per year on average between 1988 and 1998 (Saunders and Su, 1999). Tus, we assume tat per capita incomes will rise by 1 percent per year on an inflation-adjusted basis between 2000 and No cange is projected in te time constraints faced by ouseold managers, as we ave found no compelling evidence to suggest tat suc canges will occur. In recent years, te growt in labor force participation among adult women as slowed. Te BLS reports tat participation was 51.6 percent in January 1980, 57.7 percent in January 1990, and 60.3 percent in January 16 Tis same assumption was made in Blisard et al. (2003). 11 Demand for Food Away From Home / AER-829 Economic Researc Service/USDA

15 Table 4 Current and projected future population caracteristics, used in simulation Caracteristic Based on BLS reports: Income 1 $ $ Hours worked by manager ours 24.2 ours Based on Census projections: Size of ouseold 2.5 members 2.4 members Age of manager years 49.4 years College-educated manager 23.5% of ouseolds 26.4% of ouseolds Single-person ouseold 25.8% of ouseolds 28.6% of ouseolds Single-parent ouseold 9.2% of ouseolds 8.7% of ouseolds Multiple adults, no cildren % of ouseolds 46% of ouseolds Asian ouseold 3.9% of ouseolds 5% of ouseolds Black ouseold 12.3% of ouseolds 12.9% of ouseolds Hispanic ouseold 12.6% of ouseolds 18% of ouseolds 1 Future income is calculated assuming a 1-percent rate of growt in per capita, real income. In particular, we used te formula for future value and continuous compounding, i.e., Income2020 = Income2000(1+0.01)20 2 No cange is assumed in ours worked by ouseold managers. Our assumption is based on te observation tat measures of te working status of adult Americans, suc as te female labor force rate, ave been relatively stable over te past 10 years. 3 Te age of a ouseold manager is derived from projections in Cromartie (2002). It is te average age of all people older tan 19 years. 4 Derived from Cromartie, 2002, wo provides projections for traditional, single-person, and single-parent ouseolds. He also provides a projection for married couples witout cildren. However, tese four categories are not all encompassing. Some ouseold types do not belong to any group, e.g., unmarried, coabitating adults witout cildren. Tus, in tis study, we derived projections for ouseolds comprised of multiple adults by determining te percentage of ouseolds wo could not be classified as belonging to any one of te oter tree groups. It follows tat tis fourt group includes all ouseolds wit multiple adults and no cildren It ten fell back to 59.8 percent in December We assume tat, between 2000 and 2020, tere will be no furter canges in labor force participation, nor in ow muc a typical ouseold manager works outside of te ome. Te future demograpic caracteristics of ouseolds are derived from Cromartie (2002). 17 Population, ouseold, and education projections used ere are derived from reports by te U.S. Census Bureau. Te Census Bureau population series includes projections by single year of age, sex, race, Hispanic origin, and nativity (foreign-born or native) out to te year By contrast, educational attainment projections by sex and race are available for te years 2003 and 2028, so 17 Furter information on ow te projections in Cromartie (2002) are calculated can be found in Blisard et al. (2003). our numbers represent interpolations between tese two dates. Projections derived from Cromartie (2002) are not intended as forecasts or predictions; rater, tey represent assumptions about future trends in population, ouseold formation, scooling, and te economy at large. For instance, in te population series, projections are based on assumptions about fertility, mortality, and immigration. In fact, differing assumptions were presented to provide tree different projection series, representing ig, middle, and low alternatives. Tis study uses projections based upon te middle series. Despite uncertainty about te extent of canges, te finding in Cromartie (2002) is tat te Nations future population will be older, better educated, live in smaller ouseolds, be racially and etnically more diverse, and live in more nontraditional types of ouseolds (table 4). Economic Researc Service/USDA Demand for Food Away From Home / AER

16 Future Spending at Full-Service Restaurants Te simulated net effect of all developments in te population is to lift per capita spending by about 18 percent at full-service restaurants between 2000 and Rising incomes, canging ouseold structures, and decreasing ouseold sizes contribute significantly to tis growt (table 5). Aging and oter projected developments in te population ave only a small impact on spending in tis market segment. 19 Rising incomes ave te greatest impact of all projected developments in te population on per capita spending at full-service restaurants. According to our simulation, if incomes rise by 1 percent annually between 2000 and 2020 and all oter variables remain uncanged, spending at full-service restaurants will increase by just under 15 percent per capita by In te near future, ouseolds wit more income will be buyinore leisure, variety, and dining amenities. Expected developments in ouseold structure ave te next largest impact on spending at full-service restaurants. As te proportion of ouseolds caracterized as traditional decreases, spending at full-service restaurants will increase by about 2 percent per person. Toug small relative to te effect of canges in income, tis impact is still significant given te dollar size of tis market. Decreasing ouseold sizes will furter increase per person spending at full-service restaurants by just under 1 percent. Larger ouseolds spend less away from ome (per capita) because of economies in purcasing and preparineals and snacks at ome. 18 Simulated growt is in real terms, i.e, inflation-adjusted dollars (base = fourt quarter of 2000). Moreover, tis simulation is for per capita spending. It does not reflect likely growt in total spending at full-service restaurants. Tis result is simulated by furter considering te impact of increased growt in te size of te population. In total, assuming te population will expand from 281 million to 332 million people (Cromartie, 2002), expenditures at full-service restaurants could rise by 40 percent. 19 Some of tese oter variables may very important determinants of demand. However, between 2000 and 2020, tey are not expected to cange in ways tat significantly alters expenditures away from ome. For example, as sown in table 2, Black ouseolds spend muc less at full-service restaurants tan non-black ouseolds. Table 5 Simulated cange in per capita spending due to economic and demograpic trends Trend Full-service Fast food Percent 1-percent annual growt in real income Increasing proportion of alternative ouseold types Aging Decreasing ouseold sizes Increased levels of education Racial and etnic diversity Net effect of all anticipated developments Future Spending on Fast Food Te simulated net effect of all developments in te U.S. population is to lift per capita spending by about 6 percent on fast food between 2000 and Rising incomes, canging ouseold structures, decreasing ouseold sizes, and aging will all be influential. However, unlike te oter developments, te aging of te population will subdue growt in per capita spending on fast food (table 5). Per capita spending on fast food increases wit incomes. If all oter variables remain uncanged and incomes increase by 1 percent annually, suc spending would increase by just under 7 percent by Houseolds wit more income are likely to buy more leisure for teir manager. Canges in ouseold structure and decreasing ouseold sizes sould lead to increased spending for fast food. Te net effect of tese developments is to increase per capita spending for fast food by about 2 percent. For example, as smaller ouseolds find 20 Once again, simulated growt is in real terms, i.e, inflationadjusted dollars (base = fourt quarter of 2000). Moreover, tis simulation is for per capita spending. Total growt in te market is simulated by considering te projected growt in te size of te population from 281 million to 332 million people. According to our simulation, te total spending by all ouseolds on fast food will grow by 26 percent. 13 Demand for Food Away From Home / AER-829 Economic Researc Service/USDA

17 Te Canging Face of Fast Food Many fast food restaurant companies are offering an increasingly wide range of goods and services. In fact, a new kind of restaurant concept is also emerging, fast-casual, wic tries to combine te convenience of fast food wit te kinds of menus more typically found in a full-service restaurant. Tis canging face of fast food can be seen in te istory of one of Americas best-known restaurant cains, McDonalds. McDonalds began as a fast food concept in 1948, wen te McDonald broters eliminated many of te menu items and dining amenities previously available at teir full-service restaurant. Te remaining core menu ad six products - amburgers, ceeseburgers, fries, soft drinks, coffee, and sakes. Te broters also ceased to employ waitstaff, and replaced teir sort-order cooks wit workers wo specialized at specific tasks like grilling burgers. Says te company, "tis limited menu concept triggered te fast food concept, because focusing on just a few items tat were prepared wit standardized procedures made food service a model of efficiency" (McDonalds Corporation, media website). Te menu at McDonalds as gradually expanded to again include a wider variety of menu items. Te first addition to McDonalds original menu was te Filet-O-Fis in A andful of oter now well-known products were ten promoted over te next few decades including te Big Mac (1968), apple pie (1968), Egg McMuffin (1973), cookies (1974), and Cicken McNuggets (1983). However, according to Consortium Members, a group representing about 350 McDonalds francisees, more recent new product introductions ave been te most "ambitious" in te companys istory (Zuber, 2001). Efforts to improve te atmospere at McDonalds stores ave accompanied efforts to expand menu items. In fact, te first McDonalds restaurant built to accommodate indoor seating was opened in However, te most noticeable efforts appear to be aimed at families wit cildren. Ray Kroc, wo became te companys francising agent in 1954 and later purcased te McDonalds cain in 1961, is credited wit focusing te companys marketing strategy on cildren troug caracters like Ronald McDonald. "A cild wo loves our TV commercials," Kroc is quoted as saying, "and brings er grandparents to a McDonalds gives us two more customers" (Sclosser, 2001). Notable cild-oriented goods and services include packagineals for cildren wit toys, known as Happy Meals (1979), and installing play equipment in selected restaurants, known as a Playland (1971). Offerinore goods and services as required McDonalds to retink ow its operates. In fact, in 1998, te company replaced its muc-touted kitcens wit te "Made for You" production system. According to te company, "Food is prepared to order for eac customer. Somebody doesnt want pickles on a Big Mac or wants mustard on a grilled cicken sandwic? No problem Wats especially exciting is tat tis is far more tan just an operating system. It provides a platform for food innovation because it makes it easier to serve a greater variety of products" (McDonalds Corporation, 1998 Annual Report). Many companies are promoting a newer concept, fast-casual, wic strives to combine te food and atmospere of full-service restaurants wit te convenience of fast food. Examples include Boston Market, Cilis Express, and Sclotzskys Deli. As of 2003, te McDonalds Corporation continues to own Boston Market. Economic Researc Service/USDA Demand for Food Away From Home / AER

18 cooking at ome relatively less economical tan larger ones, spending on fast food will grow. Te aging of te population will subdue any increase in spending due to canges in ouseold structure and size. Our simulation suggests tat per person spending on fast food may decrease by over 2 percent wit te aging of te population. One possibility is tat older people derive less satisfaction from te foods and services traditionally offered at tese establisments. Implications for Market Composition Canges in demand are driving canges in te relative sizes of eac segment of te away-from-ome market. Rising incomes, te growing incidence of nontraditional ouseolds, and oter developments in te U.S. population will allow for growt in bot of te two largest market segments. However, population trends seem to favor increased spending at full-service restaurants relative to fast food. How migt restaurant companies adjust teir businesses in response to te identified sift in demand? Our simulation as made some strict assumptions about prices and te beavior of consumers and firms. We now relax te assumption about firm beavior. One plausible response by fast food companies would be to introduce more of te foods and services traditionally offered by full-service restaurants. In fact, among some companies, suc a response appears to be underway. For example, many Subway restaurants accept debit and credit cards, and McDonalds as announced te same despite reservations about its effect on te speed of its service. However, in tests using ig-speed connections, McDonalds found tat electronic payments can now be processed in only 5 seconds, versus 8 to 10 seconds for cas payments (CNNMoney, November 2002). Many fast food restaurants are also expanding te variety of teir menus. A study by te National Restaurant Association estimated tat more tan 75 percent of fast food restaurants introduced new menu items in 2000, wile 66 percent intended to add new food items in 2001 (Operations Report 2001). At McDonalds restaurants, for example, Big Macs are now sold alongside newer products like breakfast bagels, salads, fruit and yogurt parfaits, and soft-serve ice cream wit candy mix-ins. In 2003, te company was furter considering an increase in its scope of ealty menu items, including sliced fruits and vegetables (see box, Te Canging Face of Fast Food ). Te response of fast food restaurant companies varies by firm, and te ability of many suc restaurant companies to adapt may be limited. Marketing and logistics will likely prevent many fast food cains from aggressively expanding teir menus and/or scope of services. First, some cains appear to worry about confusing teir brand identity. Cick-fil-A, for one, added its first new category in 6 years in 2001, a portable salad line called Cool Wraps. Te vice president of brand development conceded tat We are kind of a slow poke for development because we believe in continuance of te menu (Yee, 2001). 21 Second, fast food cains may jeopardize te speed of teir service in offering too many services or menu items. Tere is also te beavior of full-service restaurant companies to consider. Tese companies could bot open more outlets and offer more variety/dining amenities at eac establisment. In fact, in 2001, fullservice restaurants were offering 31.6 percent more items on teir menu tan in 1997 (Yee, 2001). Tey were also increasing te scope of teir services, including new options for takeout. In sort, full-service restaurants may try to capture te growing demand for varied menu items among consumers wo also remain time-starved. In conclusion, te relative growt of te fast food segment appears to ave stalled. Trends in demand now favor full-service dining. However, any canges in market sare between te two segments will also depend on oter factors, suc as ow firms in bot market segments cange te mix of foods and services supplied to teir customers. Future researc is needed to better understand tese later canges as well as teir implications for industry structure and te ealt of te American population Tis survey did not include fine dining establisments (i.e., restaurants wit wite tableclots and a maitred). 22 ERS is currently undertaking a study of restaurants to determine ow tey are adapting teir menus and services. Evidence on tis subject admittedly is anecdotal at tis point in time. 15 Demand for Food Away From Home / AER-829 Economic Researc Service/USDA

19 References Becker, G. A Teory of te Allocation of Time, Economic Journal 75(1965): Blaylock, J., and D. Smallwood. U.S. Demand for Food: Houseold Expenditures, Demograpics, and Projections, U.S. Department of Agriculture, Economic Researc Service, TB-1713, Blisard, N., and J. Blaylock. U.S. Demand for Food: Houseold Expenditures, Demograpics, and Projections for , U.S. Department of Agriculture, Economic Researc Service, TB-1818, Blisard, N. Income and Food Expenditures Decomposed by Coort, Age, and Time Effects, U.S. Department of Agriculture, Economic Researc Service, TB-1896, Blisard, N., J. Variyam, and J. Cromartie. Food Expenditures by U.S. Houseolds: Looking Aead to 2020, U.S. Department of Agriculture, Economic Researc Service, AER-821, Byrne, P., O. Capps, Jr., and A. Saa. Analysis of Food-Away-from-Home Expenditure Patterns for U.S. Houseolds, , American Journal of Agricultural Economics 78(1996): Byrne, P., O. Capps Jr., and A. Saa. Analysis of Quick-serve, Mid-scale, and Up-scale Food Away from Home Expenditures, Te International Food and Agribusiness Management Review 1(1998): CNNMoney. McDonalds to accept plastic, 11/26/2002. [Online]: Consumer Expenditure Survey. Bureau of Labor Statistics. 1998, 1999, and Cromartie, J. Population Growt and Demograpic Cange, , FoodReview 25,1 (2002): Food CPI, Prices, and Expenditures: Expenditure Tables. Economic Researc Service. 04/30/03. [Online]: Expenditures. Friddle, C., S. Mangaraj, and J. Kinsey. Te Food Service Industry: Trends and Canging Structure in te New Millenium, Working Paper #01-02, Te Retail Food Industry Center, University of Minnesota, Gogoi, P., and M. Arndt. Hamburger Hell, Business Week, 3/3/2003, pp Green, H. Aggregation in Economic Analysis, Princeton University Press, Heien, D., and C. Wessells. Demand Systems Estimation wit Microdata: A Censored Regression Approac, Journal of Business and Economic Statistics 8(1990): Hiemstra, S., and W.G. Kim. Factors Affecting Expenditures for Food Away From Home in Commercial Establisment by Type of Eating Place and Meal Occasion, Hospitality Researc Journal 19(1995): Jekanowski, M., J. Binkley, and J. Eales. Convenience, Accessibility, and te Demand for Fast Food, Journal of Agricultural and Resource Economics 26(2001): Kinsey, J. A grapic look at key economic figures. Diverse demograpics drive te food industry, Coices 5(1990): Lin, B., and E. Frazao. Away-From-Home Foods Increasingly Important to Quality of American Diet, U.S. Department of Agriculture, Economic Researc Service, AIB-749, Mancester, A. Developing an Integrated Information System for te Food Sector, U.S. Department of Agriculture, Economic Researc Service, AER-575, McCracken, V., and J. Brandt. Houseold Consumption of Food Away from Home: Total Expenditure and by Type of Food Facility, American Journal of Agricultural Economics 69(1987): Murpy, K., and R. Topel. Estimation and Inference in Two-step Econometric Models, Journal of Business and Economic Statistics 3(1985): Foodservice McKinsey & Company, Economic Researc Service/USDA Demand for Food Away From Home / AER

20 Nayga, Jr., R.M., and O. Capps, Jr. Impact of Socio- Economic and Demograpic Factors on Food Away from Home Consumption: Number of Meals and by Type of Facility, Journal of Restaurant and Foodservice Marketing 1(1994): Operations Report 2001, National Restaurant Association, Wasington, DC, Restaurant Industry 2010: Te Road Aead, National Restaurant Association, Wasington, DC, Restaurant Industry Forecast 2003, National Restaurant Association, Wasington, DC, Saunders, N., and B. Su. Te U.S. Economy to 2008: A Decade of Continued Growt, Montly Labor Review. U.S. Dept. Commerce, Bureau of Labor Statistics, Nov Sclosser, E. Fast Food Nation. New York: Hougton Mifflin Company, Sonkwiler, J.S., and S. Yen. Two-Step Estimation of a Censored System of Equations. American Journal of Agricultural Economics 81(1999): Smallwood, D., and J. Blaylock. Impact of Houseold Size and Income on Food Spending Patterns, United States Department of Agriculture, Economic Researc Service, TB-1650, Su, S., and S. Yen. A Censored System of Cigarette and Alcool Consumption, Applied Economics 32(2000): Yee, L. Bold New Day, Restaurants and Institutions, 07/15/2001, pp Ù Yen, S. Working Wives and Food away from Home: Te Box-Cox Double Hurdle Model, American Journal of Agricultural Economics 75(1993): Yen, S., K. Kan, and S. Su. Houseold Demand for Fats and Oils Two-Step Estimation of a Censored Demand System, Applied Economics 34(2002): Zuber, A. McD president says cain will empasize food, not trim menu offerings, Nations Restaurant News, 04/16/2001, p Demand for Food Away From Home / AER-829 Economic Researc Service/USDA

ANALYTICAL REPORT ON THE 2010 URBAN EMPLOYMENT UNEMPLOYMENT SURVEY
 THE FEDERAL DEMOCRATIC REPUBLIC OF ETHIOPIA CENTRAL STATISTICAL AGENCY ANALYTICAL REPORT ON THE 2010 URBAN EMPLOYMENT UNEMPLOYMENT SURVEY Addis Ababa December 2010 STATISTICAL BULLETIN TABLE OF CONTENT
The Dynamics of Movie Purchase and Rental Decisions: Customer Relationship Implications to Movie Studios
 Te Dynamics of Movie Purcase and Rental Decisions: Customer Relationsip Implications to Movie Studios Eddie Ree Associate Professor Business Administration Stoneill College 320 Wasington St Easton, MA
How To Ensure That An Eac Edge Program Is Successful
 Introduction Te Economic Diversification and Growt Enterprises Act became effective on 1 January 1995. Te creation of tis Act was to encourage new businesses to start or expand in Newfoundland and Labrador.
M(0) = 1 M(1) = 2 M(h) = M(h 1) + M(h 2) + 1 (h > 1)
 = 1 M(1) = 2 M(h) = M(h 1) + M(h 2) + 1 (h > 1)") Insertion and Deletion in VL Trees Submitted in Partial Fulfillment of te Requirements for Dr. Eric Kaltofen s 66621: nalysis of lgoritms by Robert McCloskey December 14, 1984 1 ackground ccording to Knut
Insertion and Deletion in VL Trees Submitted in Partial Fulfillment of te Requirements for Dr. Eric Kaltofen s 66621: nalysis of lgoritms by Robert McCloskey December 14, 1984 1 ackground ccording to Knut
Can a Lump-Sum Transfer Make Everyone Enjoy the Gains. from Free Trade?
 Can a Lump-Sum Transfer Make Everyone Enjoy te Gains from Free Trade? Yasukazu Icino Department of Economics, Konan University June 30, 2010 Abstract I examine lump-sum transfer rules to redistribute te
Geometric Stratification of Accounting Data
 Stratification of Accounting Data Patricia Gunning * Jane Mary Horgan ** William Yancey *** Abstract: We suggest a new procedure for defining te boundaries of te strata in igly skewed populations, usual
2.23 Gambling Rehabilitation Services. Introduction
 2.23 Gambling Reabilitation Services Introduction Figure 1 Since 1995 provincial revenues from gambling activities ave increased over 56% from $69.2 million in 1995 to $108 million in 2004. Te majority
Instantaneous Rate of Change:
 Instantaneous Rate of Cange: Last section we discovered tat te average rate of cange in F(x) can also be interpreted as te slope of a scant line. Te average rate of cange involves te cange in F(x) over
SAMPLE DESIGN FOR THE TERRORISM RISK INSURANCE PROGRAM SURVEY
 ASA Section on Survey Researc Metods SAMPLE DESIG FOR TE TERRORISM RISK ISURACE PROGRAM SURVEY G. ussain Coudry, Westat; Mats yfjäll, Statisticon; and Marianne Winglee, Westat G. ussain Coudry, Westat,
College Planning Using Cash Value Life Insurance
 College Planning Using Cas Value Life Insurance CAUTION: Te advisor is urged to be extremely cautious of anoter college funding veicle wic provides a guaranteed return of premium immediately if funded
2.12 Student Transportation. Introduction
 Introduction Figure 1 At 31 Marc 2003, tere were approximately 84,000 students enrolled in scools in te Province of Newfoundland and Labrador, of wic an estimated 57,000 were transported by scool buses.
Lecture 10: What is a Function, definition, piecewise defined functions, difference quotient, domain of a function
 Lecture 10: Wat is a Function, definition, piecewise defined functions, difference quotient, domain of a function A function arises wen one quantity depends on anoter. Many everyday relationsips between
Theoretical calculation of the heat capacity
 eoretical calculation of te eat capacity Principle of equipartition of energy Heat capacity of ideal and real gases Heat capacity of solids: Dulong-Petit, Einstein, Debye models Heat capacity of metals
Math 113 HW #5 Solutions
 Mat 3 HW #5 Solutions. Exercise.5.6. Suppose f is continuous on [, 5] and te only solutions of te equation f(x) = 6 are x = and x =. If f() = 8, explain wy f(3) > 6. Answer: Suppose we ad tat f(3) 6. Ten
The modelling of business rules for dashboard reporting using mutual information
 8 t World IMACS / MODSIM Congress, Cairns, Australia 3-7 July 2009 ttp://mssanz.org.au/modsim09 Te modelling of business rules for dasboard reporting using mutual information Gregory Calbert Command, Control,
Derivatives Math 120 Calculus I D Joyce, Fall 2013
 Derivatives Mat 20 Calculus I D Joyce, Fall 203 Since we ave a good understanding of its, we can develop derivatives very quickly. Recall tat we defined te derivative f x of a function f at x to be te
Torchmark Corporation 2001 Third Avenue South Birmingham, Alabama 35233 Contact: Joyce Lane 972-569-3627 NYSE Symbol: TMK
 News Release Torcmark Corporation 2001 Tird Avenue Sout Birmingam, Alabama 35233 Contact: Joyce Lane 972-569-3627 NYSE Symbol: TMK TORCHMARK CORPORATION REPORTS FOURTH QUARTER AND YEAR-END 2004 RESULTS
An inquiry into the multiplier process in IS-LM model
 An inquiry into te multiplier process in IS-LM model Autor: Li ziran Address: Li ziran, Room 409, Building 38#, Peing University, Beijing 00.87,PRC. Pone: (86) 00-62763074 Internet Address: jefferson@water.pu.edu.cn
DEPARTMENT OF ECONOMICS HOUSEHOLD DEBT AND FINANCIAL ASSETS: EVIDENCE FROM GREAT BRITAIN, GERMANY AND THE UNITED STATES
 DEPARTMENT OF ECONOMICS HOUSEHOLD DEBT AND FINANCIAL ASSETS: EVIDENCE FROM GREAT BRITAIN, GERMANY AND THE UNITED STATES Sara Brown, University of Leicester, UK Karl Taylor, University of Leicester, UK
Unemployment insurance/severance payments and informality in developing countries
 Unemployment insurance/severance payments and informality in developing countries David Bardey y and Fernando Jaramillo z First version: September 2011. Tis version: November 2011. Abstract We analyze
THE ROLE OF LABOUR DEMAND ELASTICITIES IN TAX INCIDENCE ANALYSIS WITH HETEROGENEOUS LABOUR
 THE ROLE OF LABOUR DEMAND ELASTICITIES IN TAX INCIDENCE ANALYSIS WITH HETEROGENEOUS LABOUR Kesab Battarai 1,a and 1, a,b,c Jon Walley a Department of Economics, University of Warwick, Coventry, CV4 7AL,
Macroeconomic conditions influence consumers attitudes,
 Yu Ma, Kusum L. Ailawadi, Dines K. Gauri, & Druv Grewal An Empirical Investigation of te Impact of Gasoline Prices on Grocery Sopping Beavior Te autors empirically examine te effect of gas prices on grocery
Math Test Sections. The College Board: Expanding College Opportunity
 Taking te SAT I: Reasoning Test Mat Test Sections Te materials in tese files are intended for individual use by students getting ready to take an SAT Program test; permission for any oter use must be sougt
1.6. Analyse Optimum Volume and Surface Area. Maximum Volume for a Given Surface Area. Example 1. Solution
 1.6 Analyse Optimum Volume and Surface Area Estimation and oter informal metods of optimizing measures suc as surface area and volume often lead to reasonable solutions suc as te design of te tent in tis
Strategic trading in a dynamic noisy market. Dimitri Vayanos
 LSE Researc Online Article (refereed) Strategic trading in a dynamic noisy market Dimitri Vayanos LSE as developed LSE Researc Online so tat users may access researc output of te Scool. Copyrigt and Moral
Working Capital 2013 UK plc s unproductive 69 billion
 2013 Executive summary 2. Te level of excess working capital increased 3. UK sectors acieve a mixed performance 4. Size matters in te supply cain 6. Not all companies are overflowing wit cas 8. Excess
Beef Demand: What is Driving the Market?
 Beef Demand: What is Driving the Market? Ronald W. Ward Food and Economics Department University of Florida Demand is a term we here everyday. We know it is important but at the same time hard to explain.
Catalogue no. 12-001-XIE. Survey Methodology. December 2004
 Catalogue no. 1-001-XIE Survey Metodology December 004 How to obtain more information Specific inquiries about tis product and related statistics or services sould be directed to: Business Survey Metods
Guide to Cover Letters & Thank You Letters
 Guide to Cover Letters & Tank You Letters 206 Strebel Student Center (315) 792-3087 Fax (315) 792-3370 TIPS FOR WRITING A PERFECT COVER LETTER Te resume never travels alone. Eac time you submit your resume
Pioneer Fund Story. Searching for Value Today and Tomorrow. Pioneer Funds Equities
 Pioneer Fund Story Searcing for Value Today and Tomorrow Pioneer Funds Equities Pioneer Fund A Cornerstone of Financial Foundations Since 1928 Te fund s relatively cautious stance as kept it competitive
- 1 - Handout #22 May 23, 2012 Huffman Encoding and Data Compression. CS106B Spring 2012. Handout by Julie Zelenski with minor edits by Keith Schwarz
 CS106B Spring 01 Handout # May 3, 01 Huffman Encoding and Data Compression Handout by Julie Zelenski wit minor edits by Keit Scwarz In te early 1980s, personal computers ad ard disks tat were no larger
Average and Instantaneous Rates of Change: The Derivative
 9.3 verage and Instantaneous Rates of Cange: Te Derivative 609 OBJECTIVES 9.3 To define and find average rates of cange To define te derivative as a rate of cange To use te definition of derivative to
Environmental Policy and Competitiveness: The Porter Hypothesis and the Composition of Capital 1
 Journal of Environmental Economics and Management 7, 65 8 Ž 999. Article ID jeem.998.6, available online at ttp: www.idealibrary.com on Environmental Policy and Competitiveness: Te Porter ypotesis and
The EOQ Inventory Formula
 Te EOQ Inventory Formula James M. Cargal Matematics Department Troy University Montgomery Campus A basic problem for businesses and manufacturers is, wen ordering supplies, to determine wat quantity of
a joint initiative of Cost of Production Calculator
 a joint initiative of Cost of Production Calculator 1 KEY BENEFITS Learn to use te MAKING MORE FROM SHEEP cost of production calculator to: Measure te performance of your seep enterprise year on year Compare
THE NEISS SAMPLE (DESIGN AND IMPLEMENTATION) 1997 to Present. Prepared for public release by:
 1997 to Present. Prepared for public release by:") THE NEISS SAMPLE (DESIGN AND IMPLEMENTATION) 1997 to Present Prepared for public release by: Tom Scroeder Kimberly Ault Division of Hazard and Injury Data Systems U.S. Consumer Product Safety Commission
THE NEISS SAMPLE (DESIGN AND IMPLEMENTATION) 1997 to Present Prepared for public release by: Tom Scroeder Kimberly Ault Division of Hazard and Injury Data Systems U.S. Consumer Product Safety Commission
ACT Math Facts & Formulas
 Numbers, Sequences, Factors Integers:..., -3, -2, -1, 0, 1, 2, 3,... Rationals: fractions, tat is, anyting expressable as a ratio of integers Reals: integers plus rationals plus special numbers suc as
Determine the perimeter of a triangle using algebra Find the area of a triangle using the formula
 Student Name: Date: Contact Person Name: Pone Number: Lesson 0 Perimeter, Area, and Similarity of Triangles Objectives Determine te perimeter of a triangle using algebra Find te area of a triangle using
Area-Specific Recreation Use Estimation Using the National Visitor Use Monitoring Program Data
 United States Department of Agriculture Forest Service Pacific Nortwest Researc Station Researc Note PNW-RN-557 July 2007 Area-Specific Recreation Use Estimation Using te National Visitor Use Monitoring
Yale ICF Working Paper No. 05-11 May 2005
 Yale ICF Working Paper No. 05-11 May 2005 HUMAN CAPITAL, AET ALLOCATION, AND LIFE INURANCE Roger G. Ibbotson, Yale cool of Management, Yale University Peng Cen, Ibbotson Associates Mose Milevsky, culic
Human Capital, Asset Allocation, and Life Insurance
 Human Capital, Asset Allocation, and Life Insurance By: P. Cen, R. Ibbotson, M. Milevsky and K. Zu Version: February 25, 2005 Note: A Revised version of tis paper is fortcoming in te Financial Analysts
Note nine: Linear programming CSE 101. 1 Linear constraints and objective functions. 1.1 Introductory example. Copyright c Sanjoy Dasgupta 1
 Copyrigt c Sanjoy Dasgupta Figure. (a) Te feasible region for a linear program wit two variables (see tet for details). (b) Contour lines of te objective function: for different values of (profit). Te
Referendum-led Immigration Policy in the Welfare State
 Referendum-led Immigration Policy in te Welfare State YUJI TAMURA Department of Economics, University of Warwick, UK First version: 12 December 2003 Updated: 16 Marc 2004 Abstract Preferences of eterogeneous
A strong credit score can help you score a lower rate on a mortgage
 NET GAIN Scoring points for your financial future AS SEEN IN USA TODAY S MONEY SECTION, JULY 3, 2007 A strong credit score can elp you score a lower rate on a mortgage By Sandra Block Sales of existing
Free Shipping and Repeat Buying on the Internet: Theory and Evidence
 Free Sipping and Repeat Buying on te Internet: eory and Evidence Yingui Yang, Skander Essegaier and David R. Bell 1 June 13, 2005 1 Graduate Scool of Management, University of California at Davis (yiyang@ucdavis.edu)
For Sale By Owner Program. We can help with our for sale by owner kit that includes:
 Dawn Coen Broker/Owner For Sale By Owner Program If you want to sell your ome By Owner wy not:: For Sale Dawn Coen Broker/Owner YOUR NAME YOUR PHONE # Look as professional as possible Be totally prepared
What is Advanced Corporate Finance? What is finance? What is Corporate Finance? Deciding how to optimally manage a firm s assets and liabilities.
 Wat is? Spring 2008 Note: Slides are on te web Wat is finance? Deciding ow to optimally manage a firm s assets and liabilities. Managing te costs and benefits associated wit te timing of cas in- and outflows
Pressure. Pressure. Atmospheric pressure. Conceptual example 1: Blood pressure. Pressure is force per unit area:
 Pressure Pressure is force per unit area: F P = A Pressure Te direction of te force exerted on an object by a fluid is toward te object and perpendicular to its surface. At a microscopic level, te force
Comparison between two approaches to overload control in a Real Server: local or hybrid solutions?
 Comparison between two approaces to overload control in a Real Server: local or ybrid solutions? S. Montagna and M. Pignolo Researc and Development Italtel S.p.A. Settimo Milanese, ITALY Abstract Tis wor
Research on the Anti-perspective Correction Algorithm of QR Barcode
 Researc on te Anti-perspective Correction Algoritm of QR Barcode Jianua Li, Yi-Wen Wang, YiJun Wang,Yi Cen, Guoceng Wang Key Laboratory of Electronic Tin Films and Integrated Devices University of Electronic
Optimized Data Indexing Algorithms for OLAP Systems
 Database Systems Journal vol. I, no. 2/200 7 Optimized Data Indexing Algoritms for OLAP Systems Lucian BORNAZ Faculty of Cybernetics, Statistics and Economic Informatics Academy of Economic Studies, Bucarest
Chapter 10: Refrigeration Cycles
 Capter 10: efrigeration Cycles Te vapor compression refrigeration cycle is a common metod for transferring eat from a low temperature to a ig temperature. Te above figure sows te objectives of refrigerators
SAT Subject Math Level 1 Facts & Formulas
 Numbers, Sequences, Factors Integers:..., -3, -2, -1, 0, 1, 2, 3,... Reals: integers plus fractions, decimals, and irrationals ( 2, 3, π, etc.) Order Of Operations: Aritmetic Sequences: PEMDAS (Parenteses
THE IMPACT OF INTERLINKED INDEX INSURANCE AND CREDIT CONTRACTS ON FINANCIAL MARKET DEEPENING AND SMALL FARM PRODUCTIVITY
 THE IMPACT OF INTERLINKED INDEX INSURANCE AND CREDIT CONTRACTS ON FINANCIAL MARKET DEEPENING AND SMALL FARM PRODUCTIVITY Micael R. Carter Lan Ceng Alexander Sarris University of California, Davis University
Children as insurance
 J Popul Econ 2001) 14: 119±136 999 2001 Cildren as insurance Claus Cr. PoÈrtner University of Copenagen, Institute of Economics, Studiestraede 6, 1455 Copenagen K, Denmark Fax: 45-35323085, e-mail: claus.poertner@econ.ku.dk)
FINITE DIFFERENCE METHODS
 FINITE DIFFERENCE METHODS LONG CHEN Te best known metods, finite difference, consists of replacing eac derivative by a difference quotient in te classic formulation. It is simple to code and economic to
Chapter 7 Numerical Differentiation and Integration
 45 We ave a abit in writing articles publised in scientiþc journals to make te work as Þnised as possible, to cover up all te tracks, to not worry about te blind alleys or describe ow you ad te wrong idea
An Orientation to the Public Health System for Participants and Spectators
 An Orientation to te Public Healt System for Participants and Spectators Presented by TEAM ORANGE CRUSH Pallisa Curtis, Illinois Department of Public Healt Lynn Galloway, Vermillion County Healt Department
2 Limits and Derivatives
 2 Limits and Derivatives 2.7 Tangent Lines, Velocity, and Derivatives A tangent line to a circle is a line tat intersects te circle at exactly one point. We would like to take tis idea of tangent line
EC201 Intermediate Macroeconomics. EC201 Intermediate Macroeconomics Problem set 8 Solution
 EC201 Intermediate Macroeconomics EC201 Intermediate Macroeconomics Prolem set 8 Solution 1) Suppose tat te stock of mone in a given econom is given te sum of currenc and demand for current accounts tat
Analyzing the Effects of Insuring Health Risks:
 Analyzing te Effects of Insuring Healt Risks: On te Trade-off between Sort Run Insurance Benefits vs. Long Run Incentive Costs Harold L. Cole University of Pennsylvania and NBER Soojin Kim University of
Asymmetric Trade Liberalizations and Current Account Dynamics
 Asymmetric Trade Liberalizations and Current Account Dynamics Alessandro Barattieri January 15, 2015 Abstract Te current account deficits of Spain, Portugal and Greece are te result of large deficits in
New Vocabulary volume
 -. Plan Objectives To find te volume of a prism To find te volume of a cylinder Examples Finding Volume of a Rectangular Prism Finding Volume of a Triangular Prism 3 Finding Volume of a Cylinder Finding
Tis Problem and Retail Inventory Management
 Optimizing Inventory Replenisment of Retail Fasion Products Marsall Fiser Kumar Rajaram Anant Raman Te Warton Scool, University of Pennsylvania, 3620 Locust Walk, 3207 SH-DH, Piladelpia, Pennsylvania 19104-6366
Tangent Lines and Rates of Change
 Tangent Lines and Rates of Cange 9-2-2005 Given a function y = f(x), ow do you find te slope of te tangent line to te grap at te point P(a, f(a))? (I m tinking of te tangent line as a line tat just skims
Operation go-live! Mastering the people side of operational readiness
 ! I 2 London 2012 te ultimate Up to 30% of te value of a capital programme can be destroyed due to operational readiness failures. 1 In te complex interplay between tecnology, infrastructure and process,
Schedulability Analysis under Graph Routing in WirelessHART Networks
 Scedulability Analysis under Grap Routing in WirelessHART Networks Abusayeed Saifulla, Dolvara Gunatilaka, Paras Tiwari, Mo Sa, Cenyang Lu, Bo Li Cengjie Wu, and Yixin Cen Department of Computer Science,
Verifying Numerical Convergence Rates
 1 Order of accuracy Verifying Numerical Convergence Rates We consider a numerical approximation of an exact value u. Te approximation depends on a small parameter, suc as te grid size or time step, and
CHAPTER TWO. f(x) Slope = f (3) = Rate of change of f at 3. x 3. f(1.001) f(1) Average velocity = 1.1 1 1.01 1. s(0.8) s(0) 0.8 0
 Slope = f (3) = Rate of change of f at 3. x 3. f(1.001) f(1) Average velocity = 1.1 1 1.01 1. s(0.8) s(0) 0.8 0") CHAPTER TWO 2.1 SOLUTIONS 99 Solutions for Section 2.1 1. (a) Te average rate of cange is te slope of te secant line in Figure 2.1, wic sows tat tis slope is positive. (b) Te instantaneous rate of cange
CHAPTER TWO 2.1 SOLUTIONS 99 Solutions for Section 2.1 1. (a) Te average rate of cange is te slope of te secant line in Figure 2.1, wic sows tat tis slope is positive. (b) Te instantaneous rate of cange
Writing Mathematics Papers
 Writing Matematics Papers Tis essay is intended to elp your senior conference paper. It is a somewat astily produced amalgam of advice I ave given to students in my PDCs (Mat 4 and Mat 9), so it s not
How To Find Out How A Person'S Consumption Is Affected By A Social Security Card
 Te Journal of Risk and Uncertainty, 25:1; 5 20, 2002 c 2002 Kluwer Academic Publisers. Manufactured in Te Neterlands. Explicit Versus Implicit Income Insurance THOMAS J. KNIESNER Center for Policy Researc,
f(a + h) f(a) f (a) = lim
 f(a) f (a) = lim") Lecture 7 : Derivative AS a Function In te previous section we defined te derivative of a function f at a number a (wen te function f is defined in an open interval containing a) to be f (a) 0 f(a + )
Lecture 7 : Derivative AS a Function In te previous section we defined te derivative of a function f at a number a (wen te function f is defined in an open interval containing a) to be f (a) 0 f(a + )
His solution? Federal law that requires government agencies and private industry to encrypt, or digitally scramble, sensitive data.
 NET GAIN Scoring points for your financial future AS SEEN IN USA TODAY S MONEY SECTION, FEBRUARY 9, 2007 Tec experts plot to catc identity tieves Politicians to security gurus offer ideas to prevent data
Welfare, financial innovation and self insurance in dynamic incomplete markets models
 Welfare, financial innovation and self insurance in dynamic incomplete markets models Paul Willen Department of Economics Princeton University First version: April 998 Tis version: July 999 Abstract We
An Introduction to Milankovitch Cycles
 An Introduction to Milankovitc Cycles Wat Causes Glacial Cycles? Ricard McGeee kiloyear bp 45 4 35 3 5 15 1 5 4 - -4-6 -8 temperature -1 Note te period of about 1 kyr. Seminar on te Matematics of Climate
Article. Variance inflation factors in the analysis of complex survey data. by Dan Liao and Richard Valliant
 Component of Statistics Canada Catalogue no. -00-X Business Survey etods Division Article Variance inflation factors in te analysis of complex survey data by Dan Liao and Ricard Valliant June 0 Survey
MATHEMATICS FOR ENGINEERING DIFFERENTIATION TUTORIAL 1 - BASIC DIFFERENTIATION
 MATHEMATICS FOR ENGINEERING DIFFERENTIATION TUTORIAL 1 - BASIC DIFFERENTIATION Tis tutorial is essential pre-requisite material for anyone stuing mecanical engineering. Tis tutorial uses te principle of
A system to monitor the quality of automated coding of textual answers to open questions
 Researc in Official Statistics Number 2/2001 A system to monitor te quality of automated coding of textual answers to open questions Stefania Maccia * and Marcello D Orazio ** Italian National Statistical
RECOMMENDATIONS FOR ADJUSTING WEIGHTS FOR ZAMBIA POST-HARVEST SURVEY DATA SERIES AND IMPROVING ESTIMATION METHODOLOGY FOR FUTURE SURVEYS
 FOOD SECURITY RESEARCH PROJECT RECOENDATIONS FOR ADJUSTING WEIGHTS FOR ZABIA POST-HARVEST SURVEY DATA SERIES AND IPROVING ESTIATION ETHODOLOGY FOR FUTURE SURVEYS By David J. egill WORKING PAPER No. 13
Shell and Tube Heat Exchanger
 Sell and Tube Heat Excanger MECH595 Introduction to Heat Transfer Professor M. Zenouzi Prepared by: Andrew Demedeiros, Ryan Ferguson, Bradford Powers November 19, 2009 1 Abstract 2 Contents Discussion
Predicting the behavior of interacting humans by fusing data from multiple sources
 Predicting te beavior of interacting umans by fusing data from multiple sources Erik J. Sclict 1, Ritcie Lee 2, David H. Wolpert 3,4, Mykel J. Kocenderfer 1, and Brendan Tracey 5 1 Lincoln Laboratory,
Warm medium, T H T T H T L. s Cold medium, T L
 Refrigeration Cycle Heat flows in direction of decreasing temperature, i.e., from ig-temperature to low temperature regions. Te transfer of eat from a low-temperature to ig-temperature requires a refrigerator
Ending tobacco smoking in Britain. Radical strategies for prevention and harm reduction in nicotine addiction
 Ending tobacco smoking in Britain Radical strategies for prevention and arm reduction in nicotine addiction A report by te Tobacco Advisory Group of te Royal College of Pysicians, September 2008 Acknowledgements
Digital evolution Where next for the consumer facing business?
 Were next for te consumer facing business? Cover 2 Digital tecnologies are powerful enablers and lie beind a combination of disruptive forces. Teir rapid continuous development demands a response from
NAFN NEWS SPRING2011 ISSUE 7. Welcome to the Spring edition of the NAFN Newsletter! INDEX. Service Updates Follow That Car! Turn Back The Clock
 NAFN NEWS ISSUE 7 SPRING2011 Welcome to te Spring edition of te NAFN Newsletter! Spring is in te air at NAFN as we see several new services cropping up. Driving and transport emerged as a natural teme
Keskustelualoitteita #65 Joensuun yliopisto, Taloustieteet. Market effiency in Finnish harness horse racing. Niko Suhonen
 Keskustelualoitteita #65 Joensuun yliopisto, Taloustieteet Market effiency in Finnis arness orse racing Niko Suonen ISBN 978-952-219-283-7 ISSN 1795-7885 no 65 Market Efficiency in Finnis Harness Horse
Pre-trial Settlement with Imperfect Private Monitoring
 Pre-trial Settlement wit Imperfect Private Monitoring Mostafa Beskar University of New Hampsire Jee-Hyeong Park y Seoul National University July 2011 Incomplete, Do Not Circulate Abstract We model pretrial
Government Debt and Optimal Monetary and Fiscal Policy
 Government Debt and Optimal Monetary and Fiscal Policy Klaus Adam Manneim University and CEPR - preliminary version - June 7, 21 Abstract How do di erent levels of government debt a ect te optimal conduct
In other words the graph of the polynomial should pass through the points
 Capter 3 Interpolation Interpolation is te problem of fitting a smoot curve troug a given set of points, generally as te grap of a function. It is useful at least in data analysis (interpolation is a form
Rewards-Supply Aggregate Planning in the Management of Loyalty Reward Programs - A Stochastic Linear Programming Approach
 Rewards-Supply Aggregate Planning in te Management of Loyalty Reward Programs - A Stocastic Linear Programming Approac YUHENG CAO, B.I.B., M.Sc. A tesis submitted to te Faculty of Graduate and Postdoctoral
Strategic trading and welfare in a dynamic market. Dimitri Vayanos
 LSE Researc Online Article (refereed) Strategic trading and welfare in a dynamic market Dimitri Vayanos LSE as developed LSE Researc Online so tat users may access researc output of te Scool. Copyrigt
The U.S. labor force the number of
 Employment outlook: 14 Labor force projections to 2014: retiring boomers The baby boomers exit from the prime-aged workforce and their movement into older age groups will lower the overall labor force
Research on Risk Assessment of PFI Projects Based on Grid-fuzzy Borda Number
 Researc on Risk Assessent of PFI Projects Based on Grid-fuzzy Borda Nuber LI Hailing 1, SHI Bensan 2 1. Scool of Arcitecture and Civil Engineering, Xiua University, Cina, 610039 2. Scool of Econoics and
OPTIMAL FLEET SELECTION FOR EARTHMOVING OPERATIONS
 New Developments in Structural Engineering and Construction Yazdani, S. and Sing, A. (eds.) ISEC-7, Honolulu, June 18-23, 2013 OPTIMAL FLEET SELECTION FOR EARTHMOVING OPERATIONS JIALI FU 1, ERIK JENELIUS
WORKING PAPER SERIES THE INFORMATIONAL CONTENT OF OVER-THE-COUNTER CURRENCY OPTIONS NO. 366 / JUNE 2004. by Peter Christoffersen and Stefano Mazzotta
 WORKING PAPER SERIES NO. 366 / JUNE 24 THE INFORMATIONAL CONTENT OF OVER-THE-COUNTER CURRENCY OPTIONS by Peter Cristoffersen and Stefano Mazzotta WORKING PAPER SERIES NO. 366 / JUNE 24 THE INFORMATIONAL
Bacon Trends. Provided by: National Pork Board
 Bacon Trends Provided by: National Pork Board The Bacon Market Evolution of the bacon market Foodservice industry led bacon growth by adding bacon where it hadn t been before sandwiches salads combination
f(x + h) f(x) h as representing the slope of a secant line. As h goes to 0, the slope of the secant line approaches the slope of the tangent line.
 f(x) h as representing the slope of a secant line. As h goes to 0, the slope of the secant line approaches the slope of the tangent line.") Derivative of f(z) Dr. E. Jacobs Te erivative of a function is efine as a limit: f (x) 0 f(x + ) f(x) We can visualize te expression f(x+) f(x) as representing te slope of a secant line. As goes to 0,
Derivative of f(z) Dr. E. Jacobs Te erivative of a function is efine as a limit: f (x) 0 f(x + ) f(x) We can visualize te expression f(x+) f(x) as representing te slope of a secant line. As goes to 0,
Bonferroni-Based Size-Correction for Nonstandard Testing Problems
 Bonferroni-Based Size-Correction for Nonstandard Testing Problems Adam McCloskey Brown University October 2011; Tis Version: October 2012 Abstract We develop powerful new size-correction procedures for
CHAPTER 7. Di erentiation
 CHAPTER 7 Di erentiation 1. Te Derivative at a Point Definition 7.1. Let f be a function defined on a neigborood of x 0. f is di erentiable at x 0, if te following it exists: f 0 fx 0 + ) fx 0 ) x 0 )=.
Chapter 11. Limits and an Introduction to Calculus. Selected Applications
 Capter Limits and an Introduction to Calculus. Introduction to Limits. Tecniques for Evaluating Limits. Te Tangent Line Problem. Limits at Infinit and Limits of Sequences.5 Te Area Problem Selected Applications