Course on Functional Analysis. ::: Gene Set Enrichment Analysis - GSEA -
|
|
|
- Amos Flowers
- 10 years ago
- Views:
Transcription
1 Course on Functional Analysis ::: Madrid, June 31st, Gonzalo Gómez, PhD. Bioinformatics Unit CNIO

2 ::: Contents. 1. Introduction. 2. GSEA Software 3. Data Formats 4. Using GSEA 5. GSEA Output 6. GSEA Results 7. Leading Edge Analysis

3 ::: Contents. 1. Introduction. 2. GSEA Software 3. Data Formats 4. Using GSEA 5. GSEA Output 6. GSEA Results 7. Leading Edge Analysis

4 ::: Introduction. GSEA MIT Broad Institute v 2.0 available since Jan 2007 v available since Feb 16th 2007 Version 2.0 includes Biocarta, Broad Institute, GeneMAPP, KEGG annotations and more... Platforms: Affymetrix, Agilent, CodeLink, custom... (Subramanian et al. PNAS )

5 ::: Introduction. ::: How works GSEA? GSEA applies Kolmogorov-Smirnof test to find assymmetrical distributions for defined blocks of genes in datasets whole distribution. Is this particular Gene Set enriched in my experiment? Genes selected by researcher, Biocarta pathways, GeneMAPP sets, genes sharing cytoband, genes targeted by common mirnas up to you

6 ::: Introduction. ::: K-S test The Kolmogorov Smirnov test is used to determine whether two underlying one-dimensional probability distributions differ, or whether an underlying probability distribution differs from a hypothesized distribution, in either case based on finite samples. The one-sample KS test compares the empirical distribution function with the cumulative distribution functionspecified by the null hypothesis. The main applications are testing goodness of fit with the normal and uniform distributions. The two-sample KS test is one of the most useful and general nonparametric methods for comparing two samples, as it is sensitive to differences in both location and shape of the empirical cumulative distribution functions of the two samples. Dataset distribution Gene set 1 distribution Gene set 2 distribution Number of genes Gene Expression Level

7 ::: Introduction. ClassA ClassB ::: How works GSEA? FDR< testing genes independently... ttest cut-off FDR<0.05 Biological meaning?

8 ::: Introduction. ::: How works GSEA? - ClassA ClassB Gene Set 1 Gene Set 2 Gene Set 3 Gene set 3 enriched in Class B ttest cut-off ES/NES statistic Gene set 2 enriched in Class A +

9 ::: Introduction. ES examples :::

10 ::: Introduction. The Enrichment Score ::: NES pval FDR Benjamini-Hochberg

11 ::: Contents. 1. Introduction. 2. GSEA Software 3. Data Formats 4. Using GSEA 5. GSEA Output 6. GSEA Results 7. Leading Edge Analysis

12 ::: GSEA software. Download :::

13 ::: GSEA software. Main Window :::

14 ::: GSEA software. Loading data :::!!!

15 ::: GSEA software. Running GSEA :::

16 ::: GSEA software. Leading Edge Analysis :::

17 ::: GSEA software. MSigDB ::: Chip to Chip Mapping :::

18 ::: Contents. 1. Introduction. 2. GSEA Software 3. Data Formats 4. Using GSEA 5. GSEA Output 6. GSEA Results 7. Leading Edge Analysis

19 ::: Data Formats.
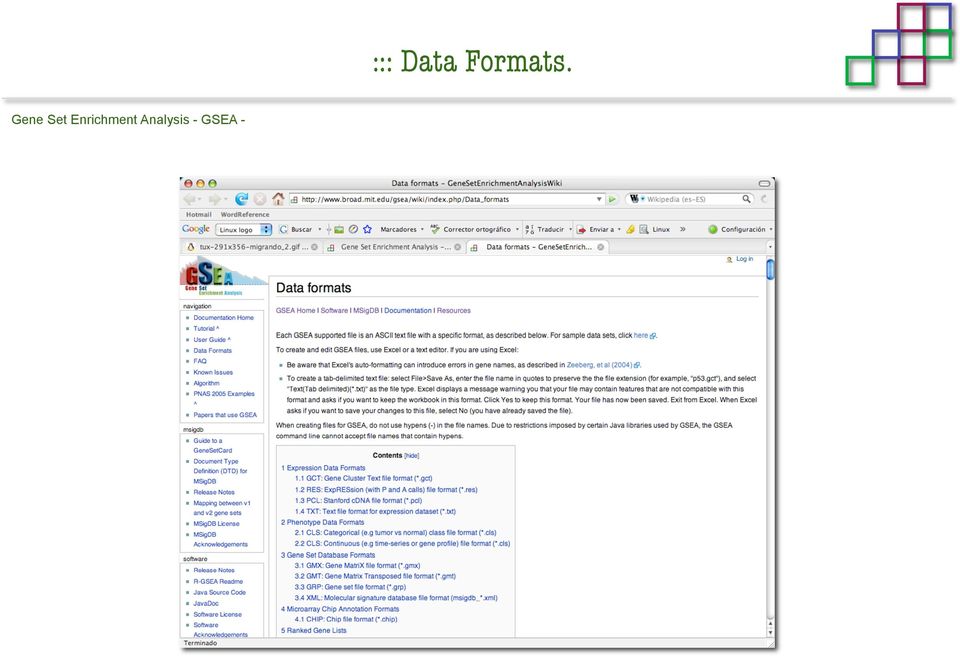
20 ::: Data Formats.

21 ::: Data Formats. Expression datasets ::: *.gct
22 ::: Data Formats. Expression datasets ::: *.res
23 ::: Data Formats. Expression datasets ::: *.pcl
24 ::: Data Formats. Expression datasets ::: *.txt
25 ::: Data Formats. Phenotype datasets ::: *.cls For categorical phenotypes (e.g. Tumor vs Control)
26 ::: Data Formats. Phenotype datasets ::: For continuous phenotypes (e.g. Gene correlated to GeneSet) Time serie (each 30 minutes) Peak profile wanted For continuous phenotypes (e.g. Gene vs Time Series)
27 ::: Data Formats. Gene Set Database ::: *.gmx
28 ::: Data Formats. Gene Set Database ::: *.gmt
29 ::: Data Formats. Other formats::: *.chip *.grp
30 ::: Data Formats. Ranked list format ::: *.rnk
31 ::: Contents. 1. Introduction. 2. GSEA Software 3. Data Formats 4. Using GSEA 5. GSEA Output 6. GSEA Results 7. Leading Edge Analysis
32 ::: Using GSEA. Loading data :::
33 ::: Using GSEA. Loading data :::
34 ::: Using GSEA. Running GSEA :::
35 ::: Using GSEA. ::: MSigDB. gsea_home
36 ::: Using GSEA. Running GSEA ::: 1. Choose true (default) to have GSEA collapse each probe set in your expression dataset into a single gene vector, which is identified by its HUGO gene symbol. In this case, you are using HUGO gene symbols for the analysis. The gene sets that you use for the analysis must use HUGO gene symbols to identify the genes in the gene sets. 2. Choose false to use your expression dataset "as is." In this case, you are using the probe identifiers that are in your expression dataset for the analysis. The gene sets that you use for the analysis must also use these probe identifiers to identify the genes in the gene sets.
37 ::: Using GSEA. Running GSEA ::: Phenotype Gene Sets (few samples)
38 ::: Using GSEA. Running GSEA :::
39 ::: Using GSEA. Chip2Chip mapping ::: Chip2Chip translates the gene identifiers in a gene sets from HUGO gene symbols to the probe identifiers for a selected DNA chip.
40 ::: Using GSEA. Enrichment statistic ::: To calculate the enrichment score, GSEA first walks down the ranked list of genes increasing a running-sum statistic when a gene is in the gene set and decreasing it when it is not. The enrichment score is the maximum deviation from zero encountered during that walk. This parameter affects the running-sum statistic used for the analysis.
41 ::: Using GSEA. Ranking Metric ::: Signal2Noise ttest Cosine Euclidean Manhatten Pearson (time series) Ratio of Classes Diff of Classes Log2_Ratio_of_Classes Categorical phenotypes Continuous phenotypes
42 ::: Using GSEA. Ranking Metric :::
43 ::: Using GSEA. Ranking Metric :::
44 ::: Using GSEA. More parameters ::: real abs parameter to determine whether to sort the genes in descending (default) or ascending order.
45 ::: Using GSEA. Launching Analysis :::
46 ::: Contents. 1. Introduction. 2. GSEA Software 3. Data Formats 4. Using GSEA 5. GSEA Output 6. GSEA Results 7. Leading Edge Analysis
47 ::: GSEA output. By default in gsea_home Results Accession ::: C:\Documents and settings\username\gsea_home /Users/yourhome/gsea_home
48 ::: Contents. 1. Introduction. 2. GSEA Software 3. Data Formats 4. Using GSEA 5. GSEA Output 6. GSEA Results 7. Leading Edge Analysis
49 ::: GSEA results. Index.html ::: Heat map of the top 50 features for each phenotype and a plot showing the correlation between the ranked genes and the phenotypes. In a heat map, expression values are represented as colors, where the range of colors (red, pink, light blue, dark blue) shows the range of expression values (high, moderate, low, lowest).
50 ::: GSEA results. Enrichment results in html :::
51 ::: GSEA results. Enrichment results in html :::
52 ::: GSEA results. Enrichment results in html ::: How can I decide about my results? FDR 0.25 NOM p-val 0.05
53 ::: Contents. 1. Introduction. 2. GSEA Software 3. Data Formats 4. Using GSEA 5. GSEA Output 6. GSEA Results 7. Leading Edge Analysis
54 ::: GSEA results. Leading Edge Analysis :::
55 ::: GSEA results. Leading Edge Analysis ::: HeatMap Set-to-Set Histogram Gene in Subsets
56 ::: GSEA results. Leading Edge Analysis ::: Heat Map The heat map shows the (clustered) genes in the leading edge subsets. In a heat map, expression values are represented as colors, where the range of colors (red, pink, light blue, dark blue) shows the range of expression values (high, moderate, low, lowest).
57 ::: GSEA results. Leading Edge Analysis ::: Set-to-Set The graph uses color intensity to show the overlap between subsets: the darker the color, the greater the overlap between the subsets.. When you compare a leading edge subset to itself, its members completely overlap so the corresponding cell is dark green. When you compare two subsets that have no overlapping members, the corresponding cell is white.
58 ::: GSEA results. Leading Edge Analysis ::: Gene in Subsets The graph shows each gene and the number of subsets in which it appears.
59 ::: GSEA results. Leading Edge Analysis ::: Histogram The last plot is a histogram, where the Jacquard is the intersection divided by the union for a pair of leading edge subsets. Number of Occurrences is the number of leading edge subset pairs in a particular bin. In this example, most subset pairs have no overlap (Jacquard = 0).
60 ::: GSEA & FatiScan. Detects significant functions with Gene Ontology InterPro motifs, Swissprot KW and KEGG pathways in lists of genes ordered according to differents characteristics.
61 T H A N K S
Tutorial for proteome data analysis using the Perseus software platform
 Tutorial for proteome data analysis using the Perseus software platform Laboratory of Mass Spectrometry, LNBio, CNPEM Tutorial version 1.0, January 2014. Note: This tutorial was written based on the information
Package GSA. R topics documented: February 19, 2015
 Package GSA February 19, 2015 Title Gene set analysis Version 1.03 Author Brad Efron and R. Tibshirani Description Gene set analysis Maintainer Rob Tibshirani Dependencies impute
Gene Enrichment Analysis
 a Analysis of DNA Chips and Gene Networks Spring Semester, 2009 Lecture 14a: January 21, 2010 Lecturer: Ron Shamir Scribe: Roye Rozov Gene Enrichment Analysis 14.1 Introduction This lecture introduces
Analyzing microrna Data and Integrating mirna with Gene Expression Data in Partek Genomics Suite 6.6
 Analyzing microrna Data and Integrating mirna with Gene Expression Data in Partek Genomics Suite 6.6 Overview This tutorial outlines how microrna data can be analyzed within Partek Genomics Suite. Additionally,
Hierarchical Clustering Analysis
 Hierarchical Clustering Analysis What is Hierarchical Clustering? Hierarchical clustering is used to group similar objects into clusters. In the beginning, each row and/or column is considered a cluster.
Time series experiments
 Time series experiments Time series experiments Why is this a separate lecture: The price of microarrays are decreasing more time series experiments are coming Often a more complex experimental design
Projects Involving Statistics (& SPSS)
") Projects Involving Statistics (& SPSS) Academic Skills Advice Starting a project which involves using statistics can feel confusing as there seems to be many different things you can do (charts, graphs,
Projects Involving Statistics (& SPSS) Academic Skills Advice Starting a project which involves using statistics can feel confusing as there seems to be many different things you can do (charts, graphs,
Identification of rheumatoid arthritis and osteoarthritis patients by transcriptome-based rule set generation
 Identification of rheumatoid arthritis and osterthritis patients by transcriptome-based rule set generation Bering Limited Report generated on September 19, 2014 Contents 1 Dataset summary 2 1.1 Project
Package empiricalfdr.deseq2
 Type Package Package empiricalfdr.deseq2 May 27, 2015 Title Simulation-Based False Discovery Rate in RNA-Seq Version 1.0.3 Date 2015-05-26 Author Mikhail V. Matz Maintainer Mikhail V. Matz
Exercise with Gene Ontology - Cytoscape - BiNGO
 Exercise with Gene Ontology - Cytoscape - BiNGO This practical has material extracted from http://www.cbs.dtu.dk/chipcourse/exercises/ex_go/goexercise11.php In this exercise we will analyze microarray
MultiExperiment Viewer Quickstart Guide
 MultiExperiment Viewer Quickstart Guide Table of Contents: I. Preface - 2 II. Installing MeV - 2 III. Opening a Data Set - 2 IV. Filtering - 6 V. Clustering a. HCL - 8 b. K-means - 11 VI. Modules a. T-test
Methods for network visualization and gene enrichment analysis July 17, 2013. Jeremy Miller Scientist I [email protected]
 Methods for network visualization and gene enrichment analysis July 17, 2013 Jeremy Miller Scientist I [email protected] Outline Visualizing networks using R Visualizing networks using outside
AGILENT S BIOINFORMATICS ANALYSIS SOFTWARE
 ACCELERATING PROGRESS IS IN OUR GENES AGILENT S BIOINFORMATICS ANALYSIS SOFTWARE GENESPRING GENE EXPRESSION (GX) MASS PROFILER PROFESSIONAL (MPP) PATHWAY ARCHITECT (PA) See Deeper. Reach Further. BIOINFORMATICS
CNV Univariate Analysis Tutorial
 CNV Univariate Analysis Tutorial Release 8.1 Golden Helix, Inc. March 18, 2014 Contents 1. Overview 2 2. CNAM Optimal Segmenting 4 A. Performing CNAM Optimal Segmenting..................................
ProteinQuest user guide
 ProteinQuest user guide 1. Introduction... 3 1.1 With ProteinQuest you can... 3 1.2 ProteinQuest basic version 4 1.3 ProteinQuest extended version... 5 2. ProteinQuest dictionaries... 6 3. Directions for
Minería de Datos ANALISIS DE UN SET DE DATOS.! Visualization Techniques! Combined Graph! Charts and Pies! Search for specific functions
 Minería de Datos ANALISIS DE UN SET DE DATOS! Visualization Techniques! Combined Graph! Charts and Pies! Search for specific functions Data Mining on the DAG ü When working with large datasets, annotation
HYPOTHESIS TESTING WITH SPSS:
 HYPOTHESIS TESTING WITH SPSS: A NON-STATISTICIAN S GUIDE & TUTORIAL by Dr. Jim Mirabella SPSS 14.0 screenshots reprinted with permission from SPSS Inc. Published June 2006 Copyright Dr. Jim Mirabella CHAPTER
t Tests in Excel The Excel Statistical Master By Mark Harmon Copyright 2011 Mark Harmon
 t-tests in Excel By Mark Harmon Copyright 2011 Mark Harmon No part of this publication may be reproduced or distributed without the express permission of the author. [email protected] www.excelmasterseries.com
Normality Testing in Excel
 Normality Testing in Excel By Mark Harmon Copyright 2011 Mark Harmon No part of this publication may be reproduced or distributed without the express permission of the author. [email protected]
Non-Inferiority Tests for One Mean
 Chapter 45 Non-Inferiority ests for One Mean Introduction his module computes power and sample size for non-inferiority tests in one-sample designs in which the outcome is distributed as a normal random
II. DISTRIBUTIONS distribution normal distribution. standard scores
 Appendix D Basic Measurement And Statistics The following information was developed by Steven Rothke, PhD, Department of Psychology, Rehabilitation Institute of Chicago (RIC) and expanded by Mary F. Schmidt,
TIPS FOR DOING STATISTICS IN EXCEL
 TIPS FOR DOING STATISTICS IN EXCEL Before you begin, make sure that you have the DATA ANALYSIS pack running on your machine. It comes with Excel. Here s how to check if you have it, and what to do if you
Module 5: Statistical Analysis
 Module 5: Statistical Analysis To answer more complex questions using your data, or in statistical terms, to test your hypothesis, you need to use more advanced statistical tests. This module reviews the
Biomedicine The background. The main interest. The tools
 1 Biomedicine The background The main interest? Bioinformatics Clinical informatics The tools 2 Outline 3 Outline 4 Working on Network Data Analysis HH RR Infrastructure Training BIOCOMPUTATION & STRUCTURAL
Analysis of the colorectal tumor microenvironment using integrative bioinformatic tools
 MLECNIK Bernhard & BINDEA Gabriela Analysis of the colorectal tumor microenvironment using integrative bioinformatic tools INSERM U872, Jérôme Galon Team15: Integrative Cancer Immunology Cordeliers Research
Step-by-Step Guide to Basic Expression Analysis and Normalization
 Step-by-Step Guide to Basic Expression Analysis and Normalization Page 1 Introduction This document shows you how to perform a basic analysis and normalization of your data. A full review of this document
Package copa. R topics documented: August 9, 2016
 Package August 9, 2016 Title Functions to perform cancer outlier profile analysis. Version 1.41.0 Date 2006-01-26 Author Maintainer COPA is a method to find genes that undergo
Analyzing the Effect of Treatment and Time on Gene Expression in Partek Genomics Suite (PGS) 6.6: A Breast Cancer Study
 6.6: A Breast Cancer Study") Analyzing the Effect of Treatment and Time on Gene Expression in Partek Genomics Suite (PGS) 6.6: A Breast Cancer Study The data for this study is taken from experiment GSE848 from the Gene Expression
Analyzing the Effect of Treatment and Time on Gene Expression in Partek Genomics Suite (PGS) 6.6: A Breast Cancer Study The data for this study is taken from experiment GSE848 from the Gene Expression
Medical Information Management & Mining. You Chen Jan,15, 2013 [email protected]
 Medical Information Management & Mining You Chen Jan,15, 2013 [email protected] 1 Trees Building Materials Trees cannot be used to build a house directly. How can we transform trees to building materials?
MEASURES OF LOCATION AND SPREAD
 Paper TU04 An Overview of Non-parametric Tests in SAS : When, Why, and How Paul A. Pappas and Venita DePuy Durham, North Carolina, USA ABSTRACT Most commonly used statistical procedures are based on the
A Streamlined Workflow for Untargeted Metabolomics
 A Streamlined Workflow for Untargeted Metabolomics Employing XCMS plus, a Simultaneous Data Processing and Metabolite Identification Software Package for Rapid Untargeted Metabolite Screening Baljit K.
MTH 140 Statistics Videos
 MTH 140 Statistics Videos Chapter 1 Picturing Distributions with Graphs Individuals and Variables Categorical Variables: Pie Charts and Bar Graphs Categorical Variables: Pie Charts and Bar Graphs Quantitative
Chapter G08 Nonparametric Statistics
 G08 Nonparametric Statistics Chapter G08 Nonparametric Statistics Contents 1 Scope of the Chapter 2 2 Background to the Problems 2 2.1 Parametric and Nonparametric Hypothesis Testing......................
Descriptive Statistics
 Descriptive Statistics Primer Descriptive statistics Central tendency Variation Relative position Relationships Calculating descriptive statistics Descriptive Statistics Purpose to describe or summarize
Using Illumina BaseSpace Apps to Analyze RNA Sequencing Data
 Using Illumina BaseSpace Apps to Analyze RNA Sequencing Data The Illumina TopHat Alignment and Cufflinks Assembly and Differential Expression apps make RNA data analysis accessible to any user, regardless
To create a histogram, you must organize the data in two columns on the worksheet. These columns must contain the following data:
 You can analyze your data and display it in a histogram (a column chart that displays frequency data) by using the Histogram tool of the Analysis ToolPak. This data analysis add-in is available when you
Comparative genomic hybridization Because arrays are more than just a tool for expression analysis
 Microarray Data Analysis Workshop MedVetNet Workshop, DTU 2008 Comparative genomic hybridization Because arrays are more than just a tool for expression analysis Carsten Friis ( with several slides from
Package dsstatsclient
 Maintainer Author Version 4.1.0 License GPL-3 Package dsstatsclient Title DataSHIELD client site stattistical functions August 20, 2015 DataSHIELD client site
Introduction to Exploratory Data Analysis
 Introduction to Exploratory Data Analysis A SpaceStat Software Tutorial Copyright 2013, BioMedware, Inc. (www.biomedware.com). All rights reserved. SpaceStat and BioMedware are trademarks of BioMedware,
IBM SPSS Statistics 20 Part 4: Chi-Square and ANOVA
 CALIFORNIA STATE UNIVERSITY, LOS ANGELES INFORMATION TECHNOLOGY SERVICES IBM SPSS Statistics 20 Part 4: Chi-Square and ANOVA Summer 2013, Version 2.0 Table of Contents Introduction...2 Downloading the
Testing for differences I exercises with SPSS
 Testing for differences I exercises with SPSS Introduction The exercises presented here are all about the t-test and its non-parametric equivalents in their various forms. In SPSS, all these tests can
Exiqon Array Software Manual. Quick guide to data extraction from mircury LNA microrna Arrays
 Exiqon Array Software Manual Quick guide to data extraction from mircury LNA microrna Arrays March 2010 Table of contents Introduction Overview...................................................... 3 ImaGene
Tutorial 5: Hypothesis Testing
 Tutorial 5: Hypothesis Testing Rob Nicholls [email protected] MRC LMB Statistics Course 2014 Contents 1 Introduction................................ 1 2 Testing distributional assumptions....................
Nonparametric Two-Sample Tests. Nonparametric Tests. Sign Test
 Nonparametric Two-Sample Tests Sign test Mann-Whitney U-test (a.k.a. Wilcoxon two-sample test) Kolmogorov-Smirnov Test Wilcoxon Signed-Rank Test Tukey-Duckworth Test 1 Nonparametric Tests Recall, nonparametric
Pearson's Correlation Tests
 Chapter 800 Pearson's Correlation Tests Introduction The correlation coefficient, ρ (rho), is a popular statistic for describing the strength of the relationship between two variables. The correlation
Statistical issues in the analysis of microarray data
 Statistical issues in the analysis of microarray data Daniel Gerhard Institute of Biostatistics Leibniz University of Hannover ESNATS Summerschool, Zermatt D. Gerhard (LUH) Analysis of microarray data
Unit 26: Small Sample Inference for One Mean
 Unit 26: Small Sample Inference for One Mean Prerequisites Students need the background on confidence intervals and significance tests covered in Units 24 and 25. Additional Topic Coverage Additional coverage
Institute of Actuaries of India Subject CT3 Probability and Mathematical Statistics
 Institute of Actuaries of India Subject CT3 Probability and Mathematical Statistics For 2015 Examinations Aim The aim of the Probability and Mathematical Statistics subject is to provide a grounding in
Quality Assessment of Exon and Gene Arrays
 Quality Assessment of Exon and Gene Arrays I. Introduction In this white paper we describe some quality assessment procedures that are computed from CEL files from Whole Transcript (WT) based arrays such
Why Taking This Course? Course Introduction, Descriptive Statistics and Data Visualization. Learning Goals. GENOME 560, Spring 2012
 Why Taking This Course? Course Introduction, Descriptive Statistics and Data Visualization GENOME 560, Spring 2012 Data are interesting because they help us understand the world Genomics: Massive Amounts
EXCEL Analysis TookPak [Statistical Analysis] 1. First of all, check to make sure that the Analysis ToolPak is installed. Here is how you do it:
![EXCEL Analysis TookPak [Statistical Analysis] 1. First of all, check to make sure that the Analysis ToolPak is installed. Here is how you do it:](/thumbs/30/14272010.jpg "EXCEL Analysis TookPak [Statistical Analysis] 1. First of all, check to make sure that the Analysis ToolPak is installed. Here is how you do it:") EXCEL Analysis TookPak [Statistical Analysis] 1 First of all, check to make sure that the Analysis ToolPak is installed. Here is how you do it: a. From the Tools menu, choose Add-Ins b. Make sure Analysis
EXCEL Analysis TookPak [Statistical Analysis] 1 First of all, check to make sure that the Analysis ToolPak is installed. Here is how you do it: a. From the Tools menu, choose Add-Ins b. Make sure Analysis
INTERPRETING THE ONE-WAY ANALYSIS OF VARIANCE (ANOVA)
") INTERPRETING THE ONE-WAY ANALYSIS OF VARIANCE (ANOVA) As with other parametric statistics, we begin the one-way ANOVA with a test of the underlying assumptions. Our first assumption is the assumption of
INTERPRETING THE ONE-WAY ANALYSIS OF VARIANCE (ANOVA) As with other parametric statistics, we begin the one-way ANOVA with a test of the underlying assumptions. Our first assumption is the assumption of
Guide for Data Visualization and Analysis using ACSN
 Guide for Data Visualization and Analysis using ACSN ACSN contains the NaviCell tool box, the intuitive and user- friendly environment for data visualization and analysis. The tool is accessible from the
User Manual. Transcriptome Analysis Console (TAC) Software. For Research Use Only. Not for use in diagnostic procedures. P/N 703150 Rev.
 Software. For Research Use Only. Not for use in diagnostic procedures. P/N 703150 Rev.") User Manual Transcriptome Analysis Console (TAC) Software For Research Use Only. Not for use in diagnostic procedures. P/N 703150 Rev. 1 Trademarks Affymetrix, Axiom, Command Console, DMET, GeneAtlas,
User Manual Transcriptome Analysis Console (TAC) Software For Research Use Only. Not for use in diagnostic procedures. P/N 703150 Rev. 1 Trademarks Affymetrix, Axiom, Command Console, DMET, GeneAtlas,
WISE Power Tutorial All Exercises
 ame Date Class WISE Power Tutorial All Exercises Power: The B.E.A.. Mnemonic Four interrelated features of power can be summarized using BEA B Beta Error (Power = 1 Beta Error): Beta error (or Type II
January 26, 2009 The Faculty Center for Teaching and Learning
 THE BASICS OF DATA MANAGEMENT AND ANALYSIS A USER GUIDE January 26, 2009 The Faculty Center for Teaching and Learning THE BASICS OF DATA MANAGEMENT AND ANALYSIS Table of Contents Table of Contents... i
Statistics I for QBIC. Contents and Objectives. Chapters 1 7. Revised: August 2013
 Statistics I for QBIC Text Book: Biostatistics, 10 th edition, by Daniel & Cross Contents and Objectives Chapters 1 7 Revised: August 2013 Chapter 1: Nature of Statistics (sections 1.1-1.6) Objectives
NAG C Library Chapter Introduction. g08 Nonparametric Statistics
 g08 Nonparametric Statistics Introduction g08 NAG C Library Chapter Introduction g08 Nonparametric Statistics Contents 1 Scope of the Chapter... 2 2 Background to the Problems... 2 2.1 Parametric and Nonparametric
Data Analysis Tools. Tools for Summarizing Data
 Data Analysis Tools This section of the notes is meant to introduce you to many of the tools that are provided by Excel under the Tools/Data Analysis menu item. If your computer does not have that tool
Chapter 2 Probability Topics SPSS T tests
 Chapter 2 Probability Topics SPSS T tests Data file used: gss.sav In the lecture about chapter 2, only the One-Sample T test has been explained. In this handout, we also give the SPSS methods to perform
IBM SPSS Direct Marketing 23
 IBM SPSS Direct Marketing 23 Note Before using this information and the product it supports, read the information in Notices on page 25. Product Information This edition applies to version 23, release
Getting Started with the ArcGIS Predictive Analysis Add-In
 Getting Started with the ArcGIS Predictive Analysis Add-In Table of Contents ArcGIS Predictive Analysis Add-In....................................... 3 Getting Started 4..............................................
SPSS Tests for Versions 9 to 13
 SPSS Tests for Versions 9 to 13 Chapter 2 Descriptive Statistic (including median) Choose Analyze Descriptive statistics Frequencies... Click on variable(s) then press to move to into Variable(s): list
Cluster software and Java TreeView
 Cluster software and Java TreeView To download the software: http://bonsai.hgc.jp/~mdehoon/software/cluster/software.htm http://bonsai.hgc.jp/~mdehoon/software/cluster/manual/treeview.html Cluster 3.0
UNIVERSITY OF NAIROBI
 UNIVERSITY OF NAIROBI MASTERS IN PROJECT PLANNING AND MANAGEMENT NAME: SARU CAROLYNN ELIZABETH REGISTRATION NO: L50/61646/2013 COURSE CODE: LDP 603 COURSE TITLE: RESEARCH METHODS LECTURER: GAKUU CHRISTOPHER
Protein Protein Interaction Networks
 Functional Pattern Mining from Genome Scale Protein Protein Interaction Networks Young-Rae Cho, Ph.D. Assistant Professor Department of Computer Science Baylor University it My Definition of Bioinformatics
How To Cluster
 Data Clustering Dec 2nd, 2013 Kyrylo Bessonov Talk outline Introduction to clustering Types of clustering Supervised Unsupervised Similarity measures Main clustering algorithms k-means Hierarchical Main
Lecture 11 Data storage and LIMS solutions. Stéphane LE CROM [email protected]
 Lecture 11 Data storage and LIMS solutions Stéphane LE CROM [email protected] Various steps of a DNA microarray experiment Experimental steps Data analysis Experimental design set up Chips on catalog
STATISTICA Formula Guide: Logistic Regression. Table of Contents
 : Table of Contents... 1 Overview of Model... 1 Dispersion... 2 Parameterization... 3 Sigma-Restricted Model... 3 Overparameterized Model... 4 Reference Coding... 4 Model Summary (Summary Tab)... 5 Summary
IBM SPSS Direct Marketing 22
 IBM SPSS Direct Marketing 22 Note Before using this information and the product it supports, read the information in Notices on page 25. Product Information This edition applies to version 22, release
Improving the Performance of Data Mining Models with Data Preparation Using SAS Enterprise Miner Ricardo Galante, SAS Institute Brasil, São Paulo, SP
 Improving the Performance of Data Mining Models with Data Preparation Using SAS Enterprise Miner Ricardo Galante, SAS Institute Brasil, São Paulo, SP ABSTRACT In data mining modelling, data preparation
Analysis of ChIP-seq data in Galaxy
 Analysis of ChIP-seq data in Galaxy November, 2012 Local copy: https://galaxy.wi.mit.edu/ Joint project between BaRC and IT Main site: http://main.g2.bx.psu.edu/ 1 Font Conventions Bold and blue refers
Microarray Data Analysis. A step by step analysis using BRB-Array Tools
 Microarray Data Analysis A step by step analysis using BRB-Array Tools 1 EXAMINATION OF DIFFERENTIAL GENE EXPRESSION (1) Objective: to find genes whose expression is changed before and after chemotherapy.
Testing Random- Number Generators
 Testing Random- Number Generators Raj Jain Washington University Saint Louis, MO 63130 [email protected] Audio/Video recordings of this lecture are available at: http://www.cse.wustl.edu/~jain/cse574-08/
An introduction to IBM SPSS Statistics
 An introduction to IBM SPSS Statistics Contents 1 Introduction... 1 2 Entering your data... 2 3 Preparing your data for analysis... 10 4 Exploring your data: univariate analysis... 14 5 Generating descriptive
SCHOOL OF HEALTH AND HUMAN SCIENCES DON T FORGET TO RECODE YOUR MISSING VALUES
 SCHOOL OF HEALTH AND HUMAN SCIENCES Using SPSS Topics addressed today: 1. Differences between groups 2. Graphing Use the s4data.sav file for the first part of this session. DON T FORGET TO RECODE YOUR
Diagrams and Graphs of Statistical Data
 Diagrams and Graphs of Statistical Data One of the most effective and interesting alternative way in which a statistical data may be presented is through diagrams and graphs. There are several ways in
Visualization Quick Guide
 Visualization Quick Guide A best practice guide to help you find the right visualization for your data WHAT IS DOMO? Domo is a new form of business intelligence (BI) unlike anything before an executive
Bowerman, O'Connell, Aitken Schermer, & Adcock, Business Statistics in Practice, Canadian edition
 Bowerman, O'Connell, Aitken Schermer, & Adcock, Business Statistics in Practice, Canadian edition Online Learning Centre Technology Step-by-Step - Excel Microsoft Excel is a spreadsheet software application
An SPSS companion book. Basic Practice of Statistics
 An SPSS companion book to Basic Practice of Statistics SPSS is owned by IBM. 6 th Edition. Basic Practice of Statistics 6 th Edition by David S. Moore, William I. Notz, Michael A. Flinger. Published by
Accountable Care Organization Quality Explorer. Quick Start Guide
 Accountable Care Organization Quality Explorer Quick Start Guide 1 P age Background HealthLandscape (a division of the American Academy of Family Physicians [AAFP]) and the Robert Graham Center for Policy
. (3.3) n Note that supremum (3.2) must occur at one of the observed values x i or to the left of x i.
 n Note that supremum (3.2) must occur at one of the observed values x i or to the left of x i.") Chapter 3 Kolmogorov-Smirnov Tests There are many situations where experimenters need to know what is the distribution of the population of their interest. For example, if they want to use a parametric
Chapter 3 Kolmogorov-Smirnov Tests There are many situations where experimenters need to know what is the distribution of the population of their interest. For example, if they want to use a parametric
They can be obtained in HQJHQH format directly from the home page at: http://www.engene.cnb.uam.es/downloads/kobayashi.dat
 HQJHQH70 *XLGHG7RXU This document contains a Guided Tour through the HQJHQH platform and it was created for training purposes with respect to the system options and analysis possibilities. It is not intended
Introduction to Statistics with GraphPad Prism (5.01) Version 1.1
 Version 1.1") Babraham Bioinformatics Introduction to Statistics with GraphPad Prism (5.01) Version 1.1 Introduction to Statistics with GraphPad Prism 2 Licence This manual is 2010-11, Anne Segonds-Pichon. This manual
Babraham Bioinformatics Introduction to Statistics with GraphPad Prism (5.01) Version 1.1 Introduction to Statistics with GraphPad Prism 2 Licence This manual is 2010-11, Anne Segonds-Pichon. This manual
containing Kendall correlations; and the OUTH = option will create a data set containing Hoeffding statistics.
 Getting Correlations Using PROC CORR Correlation analysis provides a method to measure the strength of a linear relationship between two numeric variables. PROC CORR can be used to compute Pearson product-moment
Additional sources Compilation of sources: http://lrs.ed.uiuc.edu/tseportal/datacollectionmethodologies/jin-tselink/tselink.htm
 Mgt 540 Research Methods Data Analysis 1 Additional sources Compilation of sources: http://lrs.ed.uiuc.edu/tseportal/datacollectionmethodologies/jin-tselink/tselink.htm http://web.utk.edu/~dap/random/order/start.htm
Microarray Data Mining: Puce a ADN
 Microarray Data Mining: Puce a ADN Recent Developments Gregory Piatetsky-Shapiro KDnuggets EGC 2005, Paris 2005 KDnuggets EGC 2005 Role of Gene Expression Cell Nucleus Chromosome Gene expression Protein
Analysis of gene expression data. Ulf Leser and Philippe Thomas
 Analysis of gene expression data Ulf Leser and Philippe Thomas This Lecture Protein synthesis Microarray Idea Technologies Applications Problems Quality control Normalization Analysis next week! Ulf Leser:
Step-by-Step Guide to Bi-Parental Linkage Mapping WHITE PAPER
 Step-by-Step Guide to Bi-Parental Linkage Mapping WHITE PAPER JMP Genomics Step-by-Step Guide to Bi-Parental Linkage Mapping Introduction JMP Genomics offers several tools for the creation of linkage maps
Supervised and unsupervised learning - 1
 Chapter 3 Supervised and unsupervised learning - 1 3.1 Introduction The science of learning plays a key role in the field of statistics, data mining, artificial intelligence, intersecting with areas in
BIOINF 525 Winter 2016 Foundations of Bioinformatics and Systems Biology http://tinyurl.com/bioinf525-w16
 Course Director: Dr. Barry Grant (DCM&B, [email protected]) Description: This is a three module course covering (1) Foundations of Bioinformatics, (2) Statistics in Bioinformatics, and (3) Systems
MIC - Detecting Novel Associations in Large Data Sets. by Nico Güttler, Andreas Ströhlein and Matt Huska
 MIC - Detecting Novel Associations in Large Data Sets by Nico Güttler, Andreas Ströhlein and Matt Huska Outline Motivation Method Results Criticism Conclusions Motivation - Goal Determine important undiscovered
Data Analysis. Using Excel. Jeffrey L. Rummel. BBA Seminar. Data in Excel. Excel Calculations of Descriptive Statistics. Single Variable Graphs
 Using Excel Jeffrey L. Rummel Emory University Goizueta Business School BBA Seminar Jeffrey L. Rummel BBA Seminar 1 / 54 Excel Calculations of Descriptive Statistics Single Variable Graphs Relationships
Principles of Data Visualization for Exploratory Data Analysis. Renee M. P. Teate. SYS 6023 Cognitive Systems Engineering April 28, 2015
 Principles of Data Visualization for Exploratory Data Analysis Renee M. P. Teate SYS 6023 Cognitive Systems Engineering April 28, 2015 Introduction Exploratory Data Analysis (EDA) is the phase of analysis
DATA ANALYSIS. QEM Network HBCU-UP Fundamentals of Education Research Workshop Gerunda B. Hughes, Ph.D. Howard University
 DATA ANALYSIS QEM Network HBCU-UP Fundamentals of Education Research Workshop Gerunda B. Hughes, Ph.D. Howard University Quantitative Research What is Statistics? Statistics (as a subject) is the science
Advanced Excel for Institutional Researchers
 Advanced Excel for Institutional Researchers Presented by: Sandra Archer Helen Fu University Analysis and Planning Support University of Central Florida September 22-25, 2012 Agenda Sunday, September 23,