Spectrofluorophotometer RF-6000 C125-E009
|
|
|
- Domenic Bishop
- 8 years ago
- Views:
Transcription
1 Spectrofluorophotometer RF-6000 C125-E009
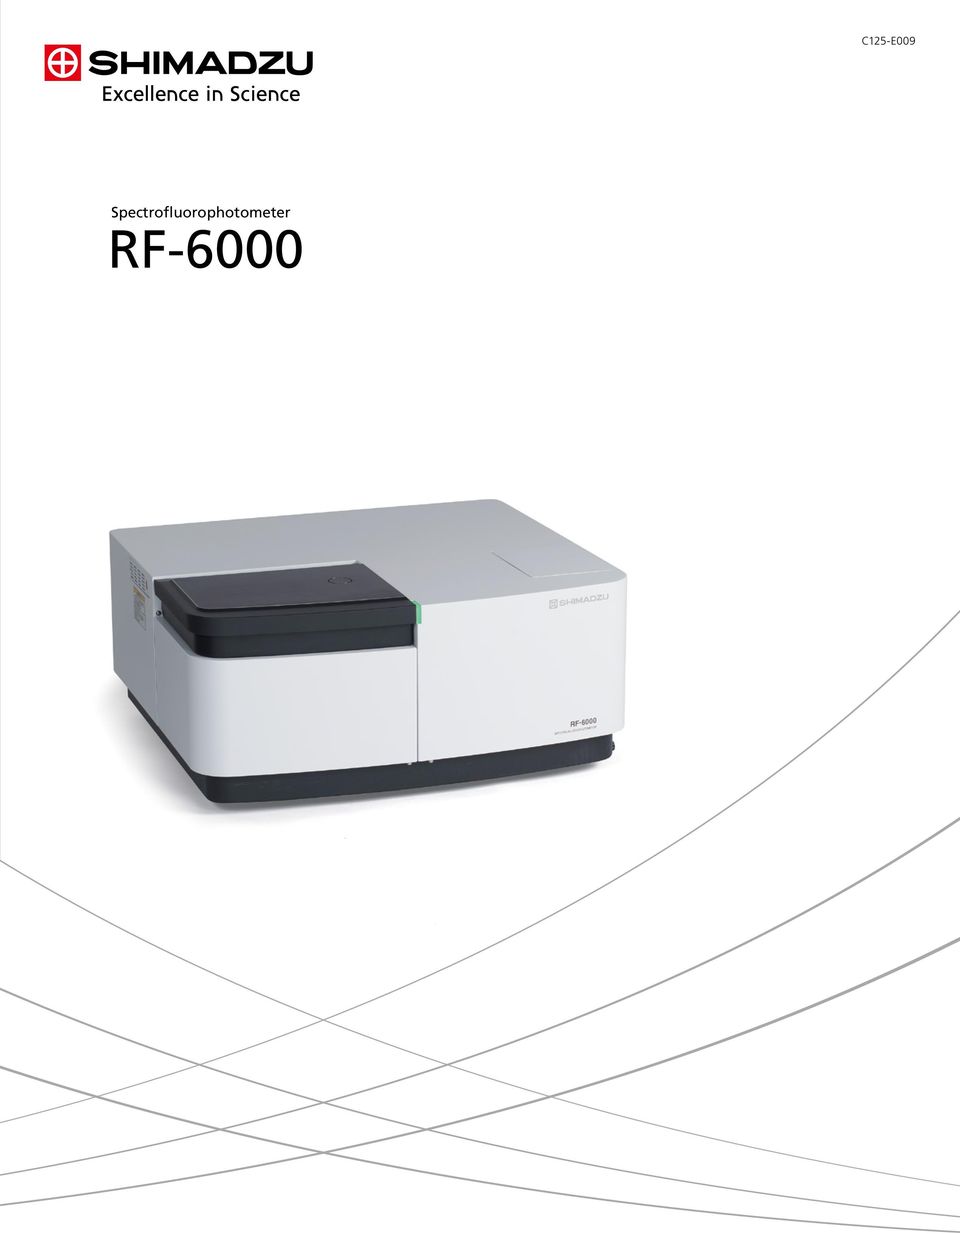
2 Striving for the Ultimate in Accuracy and Easy Operability By combining new technologies with those cultivated over Shimadzu's long history, the Shimadzu spectrofluorophotometer has been reborn as the RF Combined with new LabSolutions RF software, designed for unrivaled measurement accuracy and easy operation, the RF-6000 offers the ultimate performance for a diverse range of customers' measurement needs. Spectrofluorophotometer RF-6000

3 Wide Variety of Spectral Techniques Enhanced sensitivity and dynamic range enable fluorescence as well as bioluminescence, chemiluminescence, and electro-luminescence measurements. High-speed 3D scanning enables rapid acquisition of 3D spectra. Spectral-Corrected Excitation and Emission spectra can be scanned. Fluorescence quantum yield and Fluorescence quantum efficiency measurements are available. High Sensitivity, High Stability and High Speed Highest level SNR in its class: 1,000 or more (RMS) /350 or more (P-P) High-speed scanning of 60,000 nm/min minimizes scan time. 2,000 hour long life Xe lamp. Extended range PMT offers scan wavelength range to 900nm. Excellent Usability Easy-to-use LabSolutions RF software simplifies analysis. Validation routines included. Status bar in LabSolutions RF indicates lamp and accessory status. Large sample compartment for all analytical needs.
 /350 or more (P-P) High-speed scanning of 60,000 nm/min minimizes scan time.")

4 Wide Variety of Spectral Techniques Supports Applications in a Wide Variety of Fields Pharmaceuticals Analysis of components in compounds Quality control of API or drug products Chemicals Identification of artificial photosynthesis mechanisms Analysis of coumarin in light diesel oil Life Sciences Spectral properties of fluorescence probes Foods Quantitative analysis of additives Quality control of packaging Environmental Evaluation of low-level contaminants in rivers and soils Electrical/Electronics Spectral properties of fluorescent materials Measurement of quantum efficiency and quantum yield Analysis of LEDs, solar cells, and organic EL materials 4

5 Electrical/Electronics Evaluating the Luminous Efficiency of Solid-State Semiconductor Materials A 100 mm diameter Spectralon integrating sphere unit was used to measure the fluorescence quantum efficiency of the light-emitting layer of a solid-state semiconductor material (tris(8-hydroxyquinolinato)aluminum) used in an organic EL device. Using the quantum efficiency measurement application of LabSolutions RF software allows determining the fluorescence quantum efficiency easily using intuitive software commands. The integrating sphere unit fits completely inside the sample compartment, eliminating the need for additional installation space. Chemicals Measuring the Fluorescence Quantum Efficiency of Solution Samples In addition to film and powder samples, the integrating sphere can secure a cuvette for measuring liquid samples. The fluorescence quantum efficiency of a 1 N aqueous sulfate solution of quinine sulfate was measured (on an NIST SRM 936a substrate). Even tedious fluorescence quantum efficiency calculations can be performed readily using the LabSolutions RF quantum efficiency measurement function. RF-6000 Spectrofluorophotometer 5


6 Chemicals Long Wavelength Measurements The standard configuration can measure fluorescent wavelengths up to 900 nm, which means it can be used to research photosynthetic proteins for determining the mechanisms involved in artificial photosynthesis. In this case, a Thylakoid membrene solution was measured. *1, 2 The fluorescence spectrum shows that the system can accurately measure the fluorescence peaks in the long wavelength region. A spectral correction function, allowing the accurate measurement of spectral shapes in real time, is also included standard Fluorescence Intensity nm Fluorescence Spectrum of Thylakoid membrene solution Cooled by Liquid Nitrogen *1: Measured with the help of professor Jian-Ren Shen of Okayama University. *2: Measured using a low-temperature measurement unit. Contact Shimadzu for further details about the low-temperature measurement unit. 6

7 Chemicals Potential for Identifying the Source of Minerals Calcite is a clear and colorless mineral consisting primarily of lime rock. Any impurities in the calcite may cause coloration. This example shows 3D fluorescence measurement (Excitation vs Emission) data for three types of calcite. Calcite A and B are clear and yellow whereas calcite C is clear and pink. 3D fluorescence patterns of calcite A and B were the same. In contrast, on the 3D fluorescence patterns of calcite C, there was a fluorescence peak at about 370 nm (EX; about 205 nm) and a strong fluorescence at about 430 nm (EX; about 225 nm). This fluorescence might be caused by metal-ions such as the manganese ion, which makes calcite pink. Because the fluorescence wavelengths caused by metal-ions are very sensitive against the size of the crystal field, they may readily show changes with mineral content. A B C RF-6000 Spectrofluorophotometer 7
 and a strong fluorescence at about 430 nm (EX; about 225 nm).")

8 Pharmaceuticals Measuring Duloxetine Hydrochloride (USP) Duloxetine hydrochloride is a compound used as an antidepressant. In this example, an RF-6000 was used to measure duloxetine hydrochloride. The results indicated a lower limit of quantitation of μg/ml and a lower limit of detection of μg/ml, showing the ability of the RF-6000 to measure very low concentrations. Fluorescence Intensity Fluorescence Intensity Fluorescence Spectra of Duloxetine Hydrochloride Concentration (μg/ml) Calibration Curve Life Sciences Fluorescent Dyes for DNA Detection Specified complementary DNA can be detected by using a DNA probe which is marked by fluorochrome. These probes become luminescent when connected to DNA. The following shows the results of a 3D measurement of DNA marked by two different kinds of DNA probes. Unique fluorescent peaks according to specific DNA fluorescence probes can be quickly measured using the high-speed scanning function. Fluorochrome A marked probe Fluorochrome B marked probe 8

9 Foods Classifying and Identifying Types of Milk There are many types of milk products, such as raw or processed and those classified by fat content levels (low-fat, non-fat, and so on). These different types of milk products can have different 3D fluorescence spectra. In this example, three different types of milk products (A, B, and C) were used to measure 3D fluorescence spectra while varying the excitation wavelength. Samples were diluted by five times with distilled water. The results show that milk samples A and C have different fluorescence patterns. However, milk sample B has a fluorescence pattern that is found in both milk samples A and C. Therefore, the 3D fluorescence spectra can be used to discriminate between different types of milk products. A B C RF-6000 Spectrofluorophotometer 9

10 Environmental Measuring Oil in Water - ASTM D5412 The American Society for Testing and Materials (ASTM) testing standard D 5412 specifies testing for polycyclic aromatic hydrocarbons contained in water as oil. In this example, the target substance was separated from a solution prepared with a mixture of five polycyclic aromatic hydrocarbons using synchronized scan*. Figure 1 is a fluorescence spectrum of the mixture of polycyclic aromatic hydrocarbones. Figure 2 is a synchronized scan spectrum of Benzo[a]pyrene. Figure 3 is a synchronized scan spectrum of the mixture. The fluorescence peak of Benzo[a]pyrene was not distinguished in the fluorescence spectrum of the mixture; however, it was clearly separated on the synchronized scan spectrum. * Synchronized scan Synchronized scan mode simultaneously scans samples using both an excitation monochromator and a fluorescence monochromator that are offset by fixed wavelength intervals. Sharp fluorescence peaks can be detected for target substances even if multiple types of components are mixed together. Fig. 1 Fluorescence spectrum of the mixture of polycyclic aromatic hydrocarbons (Ex 300 nm) Fluorescence Intensity Fluorescence Intensity Fluorescence Intensity Fig. 2 Synchronized scan spectrum of Benzo[a]pyrene (Offset 6 nm) Fig. 3 Synchronized scan spectrum of the mixture (Offset 6 nm) 10
![Figure 1 is a fluorescence spectrum of the mixture of polycyclic aromatic hydrocarbones. Figure 2 is a synchronized scan spectrum of Benzo[a]pyrene.](/docs-images/41/15145249/images/page_10.jpg "Figure 3 is a synchronized scan spectrum of the mixture.")
11 Environmental Trace Measurement of Chlorophyll The chlorophyll content is commonly measured when inspecting the water quality of rivers and lakes. Since the concentration of chlorophyll is low in rivers and other such waters, high sensitivity is required for measurements. Chlorophyll emits fluorescent light when exposed to light, but the light exposure causes the fluorescence intensity to gradually diminish. Therefore, fluorescence measurements that apply only a slight amount of excitation light are required. If the same chlorophyll solution is measured repeatedly with a typical 5 nm bandwidth, the intensity varies as shown in Fig. 1. However, spectra with almost no variation can be obtained by narrowing a bandwidth, as shown in Fig. 2. These results show how low concentration chlorophyll solutions can be measured with good sensitivity. Fig. 1 Measurement with a Bandwidth of 5 nm Fluorescence Intensity Fluorescence Intensity Fig. 2 Measurement with Very Low Excitation Intensity Fig. 3 Chlorophyll-a at Concentrations of 0.75, 1.5, 3.0, 4.5, 7.5, and 15 ppb Fluorescence Intensity Fluorescence Intensity Fig. 4 Calibration Curve RF-6000 Spectrofluorophotometer 11

.")
12 High Sensitivity, High Stability and High Speed High-Sensitivity Measurements High-sensitivity measurements can be performed with S/N ratios of 1,000:1 (RMS) or 350:1 (P-P). Improved lower limit of quantitation. Measures concentrations up to mol/l (fluorescein). A redesigned optical system and signal processing system achieve the highest S/N ratio levels in its class. Even extremely dilute samples can be measured accurately. The RF-6000 can measure fluorescence spectra from fluorescein concentrations as low as mol/l. Furthermore, due to an auto-gain control function that ensures measurements are performed using optimal measurement parameters, the system can perform accurate and highly quantitative measurements over a wide six-order dynamic range, from to 10-7 mol/l mol/l mol/l mol/l 10-8 mol/l mol/l mol/l to 10-7 mol/l to mol/l Fluorescence Spectra of Fluorescein Excitation: 485 nm Florescence: 515 nm R 2 =1.000 Calibration Curve High-Speed Measurements Enables ultrafast scanning at speeds up to 60,000 nm/min. All wavelength regions can be measured in only one second. 3D fluorescence spectra can also be measured quickly. 12

13 Stable Measurements Includes a long-life xenon lamp. The Xenon lamp offers long service life and high stability. The 2000-hour service life significantly reduces running costs. In addition, auto alignment technology allows customers to easily replace the lamp without tedious adjustment routines. Long Wavelength Measurements The detector offers high sensitivity and a broad measurement wavelength range. A low-noise photomultiplier is included standard. It offers high measurement sensitivity for long wavelengths up to 900 nm. Consequently, it can measure substances that exhibit fluorescence at longer wavelengths, such as chlorophyll and indocyanin green (ICG). Below are Excitation and Emission spectra of indocyanin green, which is used for testing hepatic function and hepatic spare ability. The fluorescence peak was at 810 nm. Expanded wavelengths range by RF-6000 (750 to 900 nm) 810 nm Excitation spectrum Emission spectrum Fluorescence Intensity Excitation and Emission spectra of indocyanin green RF-6000 Spectrofluorophotometer 13


14 Excellent Usability New LabSolutions RF software makes it easy for anyone to perform measurements. LabSolutions RF software was developed to be easy for anyone to understand and operate. From measurement to analysis, printing, and saving processes, windows are laid out in an easy-to-understand manner, which ensures that measurements can be performed easily. All measurement programs feature the same main toolbar, menu, measurement toolbar, tree view, and log window configuration, so that each program can be operated in the same manner. This means the same operations can be used to operate all the specialized fluorescence analysis programs. Spectrum Measurement Window Main Toolbar The main toolbar includes buttons for all the main functions, such as file operations, printing, and data processing. The same main toolbar is used in all LabSolutions RF measurement programs. Tree View Lists all files currently displayed. It allows you to toggle between displaying, hiding, or closing data or converting data to text. Log View This successively displays log and operational information to indicate the instrument status or measurement history information. The displayed log information is saved so post-operation review can be accomplised at any time. Application Area This area displays spectra, 3D data, data processing tables, quantitation tables, measurement parameters, and other information. 14

15 All functions can be launched from the LabSolutions RF launcher. Relevant functions for each measurement action, such as spectral measurements and quantitative measurements, are organized conveniently on the LabSolutions RF launcher. That allows easy selection of the desired measurement function. In addition, frequently used Windows applications can also be added to the LabSolutions RF launcher. LabSolutions RF Launcher Instrument Status This displays the total number of hours the xenon lamp has been illuminated, the recognition status of accessories, and the status of current actions. It also notifies the user about the status of errors and when it is time to replace the lamp. Measurement Parameters This area is used to set measurement parameters. For quantitative measurements, it also displays calibration curves. Search This allows searching for the optimal excitation wavelength or fluorescence wavelength. * Please contact Shimadzu representative to comply with ER/ES regulations including FDA 21 CFR Part 11 and PIC/S. RF-6000 Spectrofluorophotometer 15

16 Spectral Correction Spectral correction functions are included standard, which allows you to display spectra corrected in real time! A spectral correction function for obtaining the true excitation and fluorescence spectra determined by correcting the instrument function for instrument characteristics, such as the emission characteristics of the light source and spectral characteristics of the optical system, is included standard. Because true spectra can be obtained in real time, the spectra can be easily compared to spectra measured using other instruments. The spectral correction functions preregistered in systems are determined using a calibrated standard light source and Shimadzu's proprietary correction techniques. If an integrating sphere is installed as an accessory, a function for creating spectral correction functions is included standard; this eliminates the need to install a special light source. Window for Creating Spectral Correction Functions Overview of spectral correction A certain sample had two fluorescence peaks. When that sample was measured using instruments A and B, the fluorescence peak intensity was higher for the left peak with instrument A, whereas the right peak was higher for instrument B. In reality, the spectral peak intensities and positions differed because instruments A and B each had the emission characteristics of light source and the spectral characteristics of optical system. Correcting the spectra by subtracting the difference in light source and optical system characteristics resulted in the same spectra, which reveals that the two peaks are successively larger as the wavelength increases. By comparing the spectra measured with different instruments the effects from differences in instrument characteristics cannot be ignored. Spectral correction allows you to compare data measured using different instruments. Spectral Correction Instrument Function and Spectrum Measured with Instrument A Instrument Function and Spectrum Measured with Instrument B Spectrum with Corrected Instrument Functions 16

17 3D Measurements 3D spectra can be measured at high speed. Excitation wavelength versus fluorescence wavelength 3D fluorescence spectra can be obtained by successively varying the excitation wavelength as fluorescence spectra are measured. 3D fluorescence spectra are helpful for determining the optimal excitation wavelength and fluorescence wavelength. Recently, differences in such 3D fluorescence spectral patterns (shapes) have allowed for discriminating between different types of samples or identifying the source of samples in some cases. Because the RF-6000 is able to scan samples at high speeds up to 60,000 nm/min, 3D fluorescence spectra can be obtained quickly, even for 3D measurements of the maximum wavelength range. Quantitative Analysis High-sensitivity quantitative measurements can be performed easily. Calibration curves are prepared from fluorescence spectra of samples with known concentrations, based on peak intensity and peak area values. As a result, the concentration of samples without known concentrations can be calculated from the fluorescence spectral results based on the calibration curve that was created. These calculated concentration values can then be used in various formulas to perform additional calculations. They can also be used for pass/fail decisions based on a specified threshold value. RF-6000 Spectrofluorophotometer 17
 have allowed for discriminating between different types of samples or identifying the source of samples in some cases.")


18 Creating and Printing Reports Report formats can be created easily. Printed reports can be freely prepared by simply dragging the desired content to the desired layout. This allows you reviewing the layout before printing, with content dragged into place, without using the print preview function. Fluorescence Quantum Yield and Fluorescence Quantum Efficiency Measuring fluorescence quantum yield and fluorescence quantum efficiency is simple. The fluorescence quantum yield can be calculated by comparing the fluorescence spectra of unknown samples with those of a standard sample with a known quantum yield. The 100 mm diameter integrating sphere unit can also be used to calculate the fluorescence quantum efficiency. The user-friendly window design allows anyone to easily measure the fluorescence quantum yield and fluorescence quantum efficiency using intuitive operations. Fluorescence Quantum Yield Measurement Window (Fluorescence quantum yield measurement of rhodamine B using quinine sulfate) Fluorescence Quantum Efficiency Measurement Window (Fluorescence quantum efficiency measurement of quinine sulfate) 18

19 Validation and LED Indicators Validation function allows you to diagnose performance. The system supports performance validation in accordance with procedures specified in JIS K 0120 General rules for fluorometric analysis. Note: An optional mercury lamp is required for confirming wavelength accuracy, resolution, and wavelength repeatability. Instrument status can be confirmed accurately. The instrument status display in LabSolutions RF and LED indicators on the instrument provide notification when the lamp operating hours have exceeded the specified service life and indicate the recognition status of accessories as well as an abnormal instrument status. Full color LED indicators on the front of the instrument indicate the current instrument status. Blue: Measurement in progress Green: Ready to measure Red: Instrument error or other problem Large Sample Compartment for All Analytical Needs A larger sample compartment allows for mounting a 100 mm diameter integrating sphere unit. The sample compartment size has been significantly increased, making it easier to place samples. RF-6000 Spectrofluorophotometer 19

20 Extensive Selection of Accessories Integrating Sphere Unit (P/N ) Used in combination with the dedicated application function for LabSolutions RF to determine the fluorescence quantum yield and fluorescence quantum efficiency. Samples : Liquids, solids, or powders Internal diameter of integrating sphere : 100 mm Integrating sphere material : Spectralon Max. sample size : W12.5 H45 T12.5 mm Measurement wavelength range : 200 to 900 nm Standard contents Integrating sphere attachment (main unit) Mesh for measurement of Spectral correction functions Ultra Micro Cell Holder Unit (P/N ) This ultra micro cell holder unit allows sample quantities of only a few tens of microliters to be measured. It uses a commercial micro cell. Standard contents Ultra micro cell holder Available micro cell Hellma Cat. No QS-15 (Min. sample amount 100 µl) Hellma Cat. No QS-15 (Min. sample amount 40 µl) Mercury Lamp Unit (P/N ) Used to inspect resolution, wavelength accuracy, and wavelength repeatability for validation. Standard contents Mercury lamp (main unit) Scattering block NTT-2200P Constant-Temperature Water Circulator (P/N ) Used to circulate temperature-controlled water to the constant-temperature cell holder. Temperature adjustment range Temperature adjustment precision Circulation pump External circulation nozzle Tank capacity Safety features Standard accessories Dimensions Power supply : Ambient + 15 to 80 C : Min. ±0.05 C : Max. 27/31 L/min flow rate Max. pump head 9.5/13 m (50/60 Hz) : 10.5 mm OD (both outlet and return) : About 10 L (9 L during operation) : Over/under-temperature detection, heater electrical continuity detection, prevention of heating empty system, sensor error detection, independent overheat protection, and circuit protector : Lid with handles, 4 m long tube (8 mm ID and 12 mm OD) (one), hose clamps (four), and English and Japanese instruction manuals : W270 H560 D400 mm : 100 V AC, 1250 VA, with 1.7 m long power cord (with grounded plug) Note: The provided tubing allows for connecting the constant-temperature single cell holder. 20
 Mesh for measurement of Spectral correction functions Ultra Micro Cell Holder Unit (P/N")
21 Constant-Temperature Single Cell Holder with Stirrer P/N V V /240V Used to stir and measure temperature-controlled samples. This is ideal for measuring the fluorescence of suspended cells. Enables controlling the temperature of one cell by circulating temperature-controlled ture-controlled water. The operating temperature range is 5 C to 70 C. The stirrer rpm is variable. The e minimum sample volume required is 2.5 ml. For use with 100 V, 120 V, or 220/240 V power supplies Note 1: This cannot be used if there is a large difference in specific weight between the sample and solvent. Temperature-controlled water tubing connectors are compatible with 4 to 8 mm ID tubing. Note 2: Requires a separate optional front cover (P/N ). Constant-Temperature Four Cell Holder (P/N ) Note: Temperature-controlled water tubing connectors are compatible with 4 to 8 mm ID tubing. Enables simultaneously controlling the temperature of four cells by circulating temperature-controlled water. The operating temperature range is 5 C to 80 C (temperature of circulated water). Note: Requires a separate optional front cover (P/N ). High-Sensitivity Cell Holder (P/N ) Using this attachment increases sensitivity by 2 to 3 times, which is especially useful for measuring dilute samples. It is designed to improve detection efficiency by using a mirror to reflect excitation light that passed through the cell back to the sample and by also reflecting the fluorescent light emitted in the opposite direction of the detector back to the fluorescence monochromator. or. Solid (Powder) Sample Holder (P/N ) In addition to solid and powder samples, it can hold a liquid solution cell to measure the reflected fluorescent light. The angle of the holder is designed to limit specular reflected ed excitation light from directly entering the fluorescence monochromator. Cutoff filters are included to block excitation light and scattered light (includes U-340, IHU-310, L-42, Y-50, O-56, and R-60). About 1 ml of sample is required for the powder holder. Sample size range Between 5 mm and 140 mm wide Between 12 mm and 110 mm tall Max. 20 mm thick Polarized Light Measurement Attachment (for UV/VIS region: 240 to 800 nm) (P/N ) (for VIS region: 330 to 800 nm) (P/N ) Measuring fluorescence polarization provides information on the size, fluidity, and surrounding g environment of molecules. The wide wavelength range of this attachment, from 240 nm to 800 nm, allows measurement t of the polarized light in UV and near infrared regions. RF-6000 Spectrofluorophotometer 21
22 Micro Cell Unit (P/N ) This allows measuring sample quantities of only 400 μl. It is placed in the same cell holder as a regular 10 mm standard cell polished on four sides. However, it cannot be used with a sample elevation stage (P/N ). Cell Polished on Four Sides (Fused Quartz) (P/N ) Non-Fluorescent Cell (Special Fused Quartz) (P/N ) Quartz cells with four sides polished absorb a small amount of light near 260 nm, which results in a slight fluorescence near 400 nm. Therefore, this non-fluorescent cell with special fused quartz is recommended for measuring low concentration samples with excitation near 260 nm. Non-Fluorescent Cell LC Flow Cell Unit (12 μl Cell) (P/N ) With this attachment, the RF-6000 can be used as a highly sensitive spectral fluorescence monitor for high performance liquid chromatography. The excitation and fluorescence wavelengths are freely selectable, permitting selective detection. In addition, it allows you to record spectra with solvent delivery paused, which is very useful for identifying chromatography peaks. A rectangular quartz micro flow cell with h minimized light scattering and a 12 μl capacity is used. Note: Requires a separate optional front cover (P/N ). LC Flow Cell Unit (120 μl Cell) (P/N ) This LC flow cell unit is for analyzing catecholamine. A rectangular quartz micro flow cell with minimized light scattering, two reflective sides, and a 120 μl capacity is used. Note: Requires a separate optional front cover (P/N ). Filter Set (P/N ) Set of seven filters; includes IHU-310, U-340, L-42, Y-50, O-56, R-60, and B-390 filters 8 mm Diameter Test Tube Holder (P/N ) Holds 8 mm diameter test tubes. (The minimum sample volume required is 400 μl.) Test tube size: 8 mm OD, between 45 mm and 100 mm long 12 mm Diameter Test Tube Holder (P/N ) Holds 12 mm diameter test tubes. Test tube size: 12 mm OD, between 60 mm and 100 mm long 22
23 Sample Elevation Stage (P/N ) Minimizes dead volume by raising the cell position in order to reduce the sample volume required for measurement. (The minimum sample volume required is 1.5 ml.) However, it cannot be used with a micro cell unit (P/N ). Sipper Unit 6000 (P/N ) Uses a stepping motor driven peristaltic pump for successively loading liquid samples for measurement. It can be operated in combination with the ASC-5 auto sample changer. Flow cell : Quartz rectangular flow cell Cell capacity : 120 μl (W4 D3 H10 mm) Aspiration rate : Three levels fast, medium, or slow Min. sample volume required : 2 ml (less than 1 % carryover) Standard sample volume required : 3 ml Standard contents Sipper 6000 (main unit) Waste tank 2.5 m Tygon tube for pumps Spare fittings for peristaltic pumps ASC-5 connection cable Options and Consumables Solenoid valve unit (liquid contact surfaces made of fluoropolymer) (P/N ) SWA-2 sample waste unit (P/N ) The SWA-2 cannot be used for strong acids, strong alkalis, or ester solvents due to inadequate chemical resistance of the tube used in standard peristaltic pumps. To use the SWA-2, purchase the solenoid valve unit and sample waste unit indicated above. Tygon tube for pumps (P/N ) Spare fittings for peristaltic pumps (P/N ) Note: Requires a separate optional front cover (P/N ). ASC-5 Auto Sample Changer P/N V V V V An automatic measurement system for multiple liquid samples can be configured by combining a sipper unit. Includes an accurate X-Y-Z 3-axis movement mechanism. Up to eight sets of parameters, such as rack size and number of test tubes, can be backed up by recording them in a file. Number of samples placeable: 1 to 100 RF-6000 Spectrofluorophotometer 23
24 RF-6000 Company names, product/service names and logos used in this publication are trademarks and trade names of Shimadzu Corporation or its affiliates, whether or not they are used with trademark symbol TM or. Third-party trademarks and trade names may be used in this publication to refer to either the entities or their products/services. Shimadzu disclaims any proprietary interest in trademarks and trade names other than its own. For Research Use Only. Not for use in diagnostic procedures. The contents of this publication are provided to you as is without warranty of any kind, and are subject to change without notice. Shimadzu does not assume any responsibility or liability for any damage, whether direct or indirect, relating to the use of this publication. Shimadzu Corporation, ANS
Spectrofluorophotometer
 Spectrofluorophotometer RF-5301PC C125-E008J World s Highest Level Performance and Windows Software Open Up a New Spectrum of Fluorescence Analysis. High-Sensitivity (SN Ratio Over 150) Sensitivity is
C125-E008H RF-5301PC. Shimadzu Spectrofluorophotometer
 C125-E008H RF-5301PC Shimadzu Spectrofluorophotometer World s Highest Level Performance and Windows TM Software From Routine Analysis to Research Employing the Highest Level of Sensitivity in the World!
Fundamentals of modern UV-visible spectroscopy. Presentation Materials
 Fundamentals of modern UV-visible spectroscopy Presentation Materials The Electromagnetic Spectrum E = hν ν = c / λ 1 Electronic Transitions in Formaldehyde 2 Electronic Transitions and Spectra of Atoms
Agilent Cary 60 UV-Vis
 Agilent Cary 60 UV-Vis Efficient. Accurate. Flexible. Specifications Introduction The Agilent Cary 60 UV-Vis spectrophotometer is efficient, accurate and flexible, and is designed to meet both current
University of Wisconsin Chemistry 524 Spectroscopic Applications (GFAA, ICP, UV/Vis, Fluorescence)
") University of Wisconsin Chemistry 524 Spectroscopic Applications (GFAA, ICP, UV/Vis, Fluorescence) For this laboratory exercise, you will explore a variety of spectroscopic methods used in an analytical
University of Wisconsin Chemistry 524 Spectroscopic Applications (GFAA, ICP, UV/Vis, Fluorescence) For this laboratory exercise, you will explore a variety of spectroscopic methods used in an analytical
Shimadzu UV-VIS User s Guide
 Shimadzu UV-VIS User s Guide 1) Push the F4 button on the UV-VIS instrument keypad. This will enable PC control. Push the F4 Button 2) Log into the UV-VIS software with your username and password. 3) After
UV-VIS Spectrophotometer
 UV-VIS Spectrophotometer C101-E130 UV-VIS Spectrophotometer Easy to Operate Easy-to-see LCD and buttons ensure simple measurement and instrument validation operations. A Wealth of Measurement Modes From
Hitachi Spectrophotometer
 Hitachi Spectrophotometer Spectrophotometer Meeting a Wide Range of Analytical Needs from Liquid to Solid Sample Measurements Single monochromator U-3900 Stray light : 0.015% or less Photometric range
EXPERIMENT 11 UV/VIS Spectroscopy and Spectrophotometry: Spectrophotometric Analysis of Potassium Permanganate Solutions.
 EXPERIMENT 11 UV/VIS Spectroscopy and Spectrophotometry: Spectrophotometric Analysis of Potassium Permanganate Solutions. Outcomes After completing this experiment, the student should be able to: 1. Prepare
UV-Vis spectrophotometers
 UV-Vis spectrophotometers an Advanced Digital Technology EXPERIENCE SECOMAM is proud to provide the new fourthgeneration UVIKON ultraviolet-visible spectrophotometers.with more than five decades of experience
Improved predictive modeling of white LEDs with accurate luminescence simulation and practical inputs
 Improved predictive modeling of white LEDs with accurate luminescence simulation and practical inputs TracePro Opto-Mechanical Design Software s Fluorescence Property Utility TracePro s Fluorescence Property
Molecular Spectroscopy
 Molecular Spectroscopy UV-Vis Spectroscopy Absorption Characteristics of Some Common Chromophores UV-Vis Spectroscopy Absorption Characteristics of Aromatic Compounds UV-Vis Spectroscopy Effect of extended
Fiber Optic Sampling by UV/Vis and UV/Vis/NIR Spectroscopy
 Fiber Optic Sampling by UV/Vis and UV/Vis/NIR Spectroscopy UV/VIS AND UV/VIS/NIR SPECTROSCOPY A P P L I C A T I O N N O T E Introduction The availability and applications of fiber optic sampling in UV/Vis
Shimadzu Simulated Distillation Gas Chromatograph System C184-E030
 Shimadzu Simulated Distillation Gas Chromatograph System C184-E030 Meets All Simulated Distillation Gas Chromatograph Standards - Provides Highly Accurate Analysis Results with Excellent Reproducibility-
Mitos P-Pump. product datasheet
 product datasheet page Product description 2 Main benefits 3 Why choose the Mitos P-Pump? 3 Closed-loop flow control 4 Product specifications 5 Accessories - overview 6 Mitos P-Pump Basic 7 Mitos P-Pump
Agilent Cary 4000/5000/6000i Series UV-Vis-NIR
 Agilent Cary 4000/5000/6000i Series UV-Vis-NIR Guaranteed specifications Design overview Double beam, ratio recording, double out-of-plane Littrow monochromator UV-Vis-NIR spectrophotometer (Agilent Cary
Appendix 5 Overview of requirements in English
 Appendix 5 Overview of requirements in English This document is a translation of Appendix 4 (Bilag 4) section 2. This translation is meant as a service for the bidder and in case of any differences between
73 Series Spectrophotometers
 73 Series Spectrophotometers The 73 series introduces four new spectrophotometers to the extensive Jenway range. These spectrophotometers use icon driven software and have an improved navigation system
STABILITY TESTING: PHOTOSTABILITY TESTING OF NEW DRUG SUBSTANCES AND PRODUCTS
 INTERNATIONAL CONFERENCE ON HARMONISATION OF TECHNICAL REQUIREMENTS FOR REGISTRATION OF PHARMACEUTICALS FOR HUMAN USE ICH HARMONISED TRIPARTITE GUIDELINE STABILITY TESTING: PHOTOSTABILITY TESTING OF NEW
Determining the Quantity of Iron in a Vitamin Tablet. Evaluation copy
 Determining the Quantity of Iron in a Vitamin Tablet Computer 34 As biochemical research becomes more sophisticated, we are learning more about the role of metallic elements in the human body. For example,
VWR SPECTROPHOTOMETERS
 VWR SPECTROPHOTOMETERS Reliable Accurate Easy to Use New_Spectrophotometry_v2.indd 2 Your first choice for spectrophotometry 5/9/2014 2:22:18 PM Quality Guaranteed VWR SPECTROPHOTOMETERS Single Beam Units
UVC LEDs for. Environmental Monitoring
 UVC LEDs for Environmental Monitoring Environmental monitoring relies extensively on molecular spectroscopy for tracking air quality, water and wastewater quality, and detecting hazardous substances. Advances
A Beer s Law Experiment
 A Beer s Law Experiment Introduction There are many ways to determine concentrations of a substance in solution. So far, the only experiences you may have are acid-base titrations or possibly determining
BB-18 Black Body High Vacuum System Technical Description
 BB-18 Black Body High Vacuum System Technical Description The BB-18 Black Body is versatile and is programmed for use as a fixed cold target at 80 K or variable target, at 80 K- 350 K no extra cost. The
instruments Analytical Instruments for Science
 instruments Analytical Instruments for Science instruments Contents PAGE NO. Introduction 4 T60 UV-Vis Spectrophotometer 6 T70 UV-Vis Spectrophotometer 10 T80 UV-Vis Spectrophotometer 14 T90+ UV-Vis Spectrophotometer
Measuring Protein Concentration through Absorption Spectrophotometry
 Measuring Protein Concentration through Absorption Spectrophotometry In this lab exercise you will learn how to homogenize a tissue to extract the protein, and then how to use a protein assay reagent to
GloMax Discover and Explorer. State-of-the-art multimode readers for luminescence, fluorescence and absorbance detection.
 GloMax Discover and Explorer State-of-the-art multimode readers for luminescence, fluorescence and absorbance detection. Easy-To-Use The intuitive touchscreen display, preloaded protocols and automatic
We bring quality to light. MAS 40 Mini-Array Spectrometer. light measurement
 MAS 40 Mini-Array Spectrometer light measurement Features at a glance Cost-effective and robust CCD spectrometer technology Standard USB interface Compatible with all Instrument Systems measuring adapters
FRACTION COLLECTOR. Microcomputer Controlled CHF122SC
 FRACTION COLLECTOR Microcomputer Controlled CHF122SC From open column to HPLC liquid chromatography and general liquid samplings, the Super Fraction Collector, model CHF122SC has a wide range of uses.
Hellma. Where precision becomes an art. Calibration standards for spectrophotometers. 2008 by Hellma www.hellma-worldwide.com
 Hellma. Where precision becomes an art. Calibration standards for spectrophotometers 2008 by Hellma www.hellma-worldwide.com Contents Calibration of spectrophotometers 3 Traceability of the calibration
Spectral Measurement Solutions for Industry and Research
 Spectral Measurement Solutions for Industry and Research Hamamatsu Photonics offers a comprehensive range of products for spectroscopic applications, covering the, Visible and Infrared regions for Industrial,
ORGANIC SAMPLE PREPARATION
 ORGANIC SAMPLE PREPARATION W W W.LA BT E C H S R L.CO M WSPE MANUAL VACUUM MANIFOLD SPE Process control of the flow rate is critical to guarantee reproducible extractions. Differently then any other systems,
Copyright 1999 2010 by Mark Brandt, Ph.D. 12
 Introduction to Absorbance Spectroscopy A single beam spectrophotometer is comprised of a light source, a monochromator, a sample holder, and a detector. An ideal instrument has a light source that emits
JASCO. FP-6000 Series Spectrofluorometer. Fluorescence Spectrophotometer
 JASCO Fluorescence Spectrophotometer FP-6000 Series Spectrofluorometer The FP-6000 Series meets the demands of both research and routine analysis by combining a highly sensitive and flexible optical system.
The Determination of an Equilibrium Constant
 The Determination of an Equilibrium Constant Computer 10 Chemical reactions occur to reach a state of equilibrium. The equilibrium state can be characterized by quantitatively defining its equilibrium
MCAL Spectrophotometry. Spectrophotometry
 MCAL Spectrophotometry Instruments include: Cary 50 UV-vis Spectrophotometer Eclipse Spectrofluorometer HPLC Diode Array and Fluorescence ICP-OES with CCD detection Spectrophotometry The instruments all
The photoionization detector (PID) utilizes ultraviolet
 utilizes ultraviolet") Chapter 6 Photoionization Detectors The photoionization detector (PID) utilizes ultraviolet light to ionize gas molecules, and is commonly employed in the detection of volatile organic compounds (VOCs).
Chapter 6 Photoionization Detectors The photoionization detector (PID) utilizes ultraviolet light to ionize gas molecules, and is commonly employed in the detection of volatile organic compounds (VOCs).
Reflectance Measurements of Materials Used in the Solar Industry. Selecting the Appropriate Accessories for UV/Vis/NIR Measurements.
 T e c h n i c a l N o t e Reflectance Measurements of Materials Used in the Solar Industry UV/Vis/NIR Author: Dr. Jeffrey L. Taylor PerkinElmer, Inc. 710 Bridgeport Avenue Shelton, CT 06484 USA Selecting
Micromass LCT User s Guide
 Micromass LCT User s Guide 1) Log on to MassLynx with your username & password. 2) After you have logged in, the MassLynx software will automatically run. 3) After MassLynx has come up, open your project
All the prepared formulations were subjected for following. evaluation parameters and obtained results were showed in Tables 6.3 &
 105 6.1 CHARACTERIZATION OF TABLETS All the prepared formulations were subjected for following evaluation parameters and obtained results were showed in Tables 6.3 & 6.4. 6.1.1 Description (Size, Shape,
High Resolution Spatial Electroluminescence Imaging of Photovoltaic Modules
 High Resolution Spatial Electroluminescence Imaging of Photovoltaic Modules Abstract J.L. Crozier, E.E. van Dyk, F.J. Vorster Nelson Mandela Metropolitan University Electroluminescence (EL) is a useful
ATOMIC ABSORTION SPECTROSCOPY: rev. 4/2011 ANALYSIS OF COPPER IN FOOD AND VITAMINS
 1 ATOMIC ABSORTION SPECTROSCOPY: rev. 4/2011 ANALYSIS OF COPPER IN FOOD AND VITAMINS Buck Scientific Atomic Absorption Spectrophotometer, Model 200 Atomic absorption spectroscopy (AAS) has for many years
DENSITY MEASURING SYSTEMS
 SHIBAYAMA SCIENTIFIC CO., LTD. DENSITY MEASURING SYSTEMS Density Gradient Tube Method Direct Reading Type A / Type B Comply with the standards below: JIS K-0061-1992, K-7112 1980 ASTM D1505 Type A /Left
Hitachi Double Beam Spectrophotometer
 Hitachi Double Beam Spectrophotometer Spectrophotometer simpler to use and higher in dependability thanks to mounting of a large-size color LCD. High resolution satisfying European Pharmacopoeia (spectral
Hitachi U-4100 UV-vis-NIR spectrophotometer (341-F)
") Hitachi U-4100 UV-vis-NIR spectrophotometer (341-F) Please contact Dr. Amanda Young for training requests and assistance: 979-862-6845, amandayoung@tamu.edu Hardware Our spectrophotometer is made up of
Hitachi U-4100 UV-vis-NIR spectrophotometer (341-F) Please contact Dr. Amanda Young for training requests and assistance: 979-862-6845, amandayoung@tamu.edu Hardware Our spectrophotometer is made up of
haze-gard i The objective standard for a clear view Global communication Reliable and Precise
 haze-gard i The objective standard for a clear view Transparent products can have a milky or fuzzy appearance dependent on its light scattering behaviour. The haze-gard i quantifies the visual perception
Technical Note. Roche Applied Science. No. LC 19/2004. Color Compensation
 Roche Applied Science Technical Note No. LC 19/2004 Purpose of this Note Color The LightCycler System is able to simultaneously detect and analyze more than one color in each capillary. Due to overlap
Spectrophotometry and the Beer-Lambert Law: An Important Analytical Technique in Chemistry
 Spectrophotometry and the Beer-Lambert Law: An Important Analytical Technique in Chemistry Jon H. Hardesty, PhD and Bassam Attili, PhD Collin College Department of Chemistry Introduction: In the last lab
Specifying Plasma Deposited Hard Coated Optical Thin Film Filters. Alluxa Engineering Staff
 Specifying Plasma Deposited Hard Coated Optical Thin Film Filters. Alluxa Engineering Staff December 2012 Specifying Advanced Plasma Deposited Hard Coated Optical Bandpass and Dichroic Filters. Introduction
Using the Spectrophotometer
 Using the Spectrophotometer Introduction In this exercise, you will learn the basic principals of spectrophotometry and and serial dilution and their practical application. You will need these skills to
Lab #11: Determination of a Chemical Equilibrium Constant
 Lab #11: Determination of a Chemical Equilibrium Constant Objectives: 1. Determine the equilibrium constant of the formation of the thiocyanatoiron (III) ions. 2. Understand the application of using a
Measurement of Enhanced Specular Reflector (ESR) Films Using a LAMBDA 1050 UV/Vis/NIR Spectrometer and URA Accessory
 Films Using a LAMBDA 1050 UV/Vis/NIR Spectrometer and URA Accessory") FIELD APPLICATION REPORT UV/Vis/NIR Spectroscopy Author: Frank Padera Shelton, CT Contributor: Chris Lynch Shelton, CT Measurement of Enhanced Specular Reflector (ESR) Films Using a LAMBDA 1050 UV/Vis/NIR
FIELD APPLICATION REPORT UV/Vis/NIR Spectroscopy Author: Frank Padera Shelton, CT Contributor: Chris Lynch Shelton, CT Measurement of Enhanced Specular Reflector (ESR) Films Using a LAMBDA 1050 UV/Vis/NIR
Beckman Coulter DTX 880 Multimode Detector Bergen County Technical Schools Stem Cell Lab
 Beckman Coulter DTX 880 Multimode Detector Bergen County Technical Schools Stem Cell Lab Room 213 Beckman Coulter DTX 880 Multimode Detector Information The Beckman Coulter DTX 880 Multimode Detector is
Fluorescent dyes for use with the
 Detection of Multiple Reporter Dyes in Real-time, On-line PCR Analysis with the LightCycler System Gregor Sagner, Cornelia Goldstein, and Rob van Miltenburg Roche Molecular Biochemicals, Penzberg, Germany
Cary 100 Bio UV-Vis Operating Instructions 09/25/2012 S.V.
 1234 Hach Hall 515-294-5805 www.cif.iastate.edu Cary 100 Bio UV-Vis Operating Instructions 09/25/2012 S.V. Location: Contact: 1240 Hach Hall Steve Veysey, 1234 Hach Hall Safety All researchers working
450TOC Analyzer. Portable, Real-time, Continuous Total Organic Carbon Measurement. 450TOC Analyzer
 450 Analyzer 450 Analyzer Fast, Continuous Measurement Compliant with USP, Ch P, EP and JP USB Data Logging and Printer Output Robust Portable Design Portable, Real-time, Continuous Total Organic Carbon
SPECTROSCOPY. Light interacting with matter as an analytical tool
 SPECTROSCOPY Light interacting with matter as an analytical tool Electronic Excitation by UV/Vis Spectroscopy : X-ray: core electron excitation UV: valance electronic excitation IR: molecular vibrations
The Measurement of Sensitivity in Fluorescence Spectroscopy
 The Measurement of Sensitivity in Fluorescence Spectroscopy Among instrumental techniques, fluorescence spectroscopy is recognized as one of the more sensitive. In fluorescence, the intensity of the emission
Katharina Lückerath (AG Dr. Martin Zörnig) adapted from Dr. Jörg Hildmann BD Biosciences,Customer Service
 adapted from Dr. Jörg Hildmann BD Biosciences,Customer Service") Introduction into Flow Cytometry Katharina Lückerath (AG Dr. Martin Zörnig) adapted from Dr. Jörg Hildmann BD Biosciences,Customer Service How does a FACS look like? FACSCalibur FACScan What is Flow Cytometry?
Introduction into Flow Cytometry Katharina Lückerath (AG Dr. Martin Zörnig) adapted from Dr. Jörg Hildmann BD Biosciences,Customer Service How does a FACS look like? FACSCalibur FACScan What is Flow Cytometry?
Amino Acid Analyzer L-8900
 Amino Acid Analyzer L-8900 VWR - Hitachi Your Partner in Amino Acid Analysis Hitachi has manufactured more than 1800 Amino Acid Analysers for over 40 years. The new Amino Acid Analyser Model L-8900 is
Modern approaches to determination of toxic metals in marine environmental objects. Atomic absorption and inductively coupled plasma, advantages and
 Modern approaches to determination of toxic metals in marine environmental objects. Atomic absorption and inductively coupled plasma, advantages and disadvantages Atomic spectroscopy Atomic spectroscopy
Ultra High Performance Liquid Chromatograph. Nexera XR C196-E082B
 Ultra High Performance Liquid Chromatograph Nexera XR C196-E82B The Most Accessible UHPLC Available Developed with expandability and compatibility in mind, the Nexera XR ultra high performance liquid chromatograph
Simultaneous Qualitative and Quantitative Data Acquisition for Research of Diabetes Drugs
 Liquid Chromatography Mass Spectrometry SSI-LCMS-068 Simultaneous Qualitative and Quantitative Data Acquisition for Research of Diabetes Drugs LCMS-8050 Summary By utilizing the LCMS-8050 s ultrafast scan
EASIDEW PORTABLE HYGROMETER INSTALLATION, OPERATION AND MAINTENANCE MANUAL
 EASIDEW PORTABLE HYGROMETER INSTALLATION, OPERATION AND MAINTENANCE MANUAL Issue February 2004 2 TABLE OF CONTENTS SECTION PAGE 1. INTRODUCTION 3 1.1 General 3 1.2 Ceramic Sensing Element 3 1.3 Calibration
ILX Lightwave Corporation www.ilxlightwave.com
 # 14 Optimizing TEC Current Optimizing TEC Drive Current This Application Note discusses methods for optimizing the TEC drive current for optimum operation in heating and cooling applications. BACKGROUND
Hygro-Thermometer + InfraRed Thermometer Model RH101
 User's Guide Hygro-Thermometer + InfraRed Thermometer Model RH101 Introduction Congratulations on your purchase of the Extech Hygro-Thermometer plus InfraRed Thermometer. This device measures relative
UV/VIS/IR SPECTROSCOPY ANALYSIS OF NANOPARTICLES
 UV/VIS/IR SPECTROSCOPY ANALYSIS OF NANOPARTICLES SEPTEMBER 2012, V 1.1 4878 RONSON CT STE K SAN DIEGO, CA 92111 858-565 - 4227 NANOCOMPOSIX.COM Note to the Reader: We at nanocomposix have published this
Introduction. Methods. Sample Processing
 PO-CON1656 High-sensitivity, high-throughput quantitation of catecholamines and metanephrine in plasma by automated WCX-SP coupled to LC/MS/MS for clinical research ASMS 2016 MP-080 Ichiro HIRANO 1, Atsuhiko
Background Information
 1 Gas Chromatography/Mass Spectroscopy (GC/MS/MS) Background Information Instructions for the Operation of the Varian CP-3800 Gas Chromatograph/ Varian Saturn 2200 GC/MS/MS See the Cary Eclipse Software
Experiment #5: Qualitative Absorption Spectroscopy
 Experiment #5: Qualitative Absorption Spectroscopy One of the most important areas in the field of analytical chemistry is that of spectroscopy. In general terms, spectroscopy deals with the interactions
OPL BASIC. Dosing System for Professional Laundry machines. Contents
 OPL BASIC Dosing System for Professional Laundry machines Contents 1 Getting Started. Page 2 2 Installation. Page 4 3 Set Up & Operation. Page 8 4 Maintenance & Accessories. Page 10 5 Troubleshooting Page
How To Use A Ds340 (Dsp)
") Ideal for monitoring dust levels in the exhaust gas of industrial combustion or air filtration processes. Innovative Dynamic Detection Principle (DDP) measurement technique Immune to gradual reductions
Ideal for monitoring dust levels in the exhaust gas of industrial combustion or air filtration processes. Innovative Dynamic Detection Principle (DDP) measurement technique Immune to gradual reductions
LynX TM Silicon Photomultiplier Module - LynX-A-33-050-T1-A User Guide Understanding Silicon Photomultiplier Module for improving system performance
 Application Notes User Guide Photon Detection LynX TM Silicon Photomultiplier Module - LynX-A-33-050-T1-A User Guide Understanding Silicon Photomultiplier Module for improving system performance Overview
Thermo Scientific NanoDrop Products. Revolutionary technology. Elegant simplicity. Instruments for microvolume analysis of biomolecules
 Thermo Scientific NanoDrop Products Revolutionary technology. Elegant simplicity. Instruments for microvolume analysis of biomolecules Thermo Scientific NanoDrop instruments have pre-programmed methods
Multifunctional Autosampler AOC-6000 C146-E272A
 Multifunctional Autosampler C146-E272A Multifunctional Autosampler Multifunctional Autosampler Dramatically Improves GC/MS Analysis Productivity Automatic Switching Between Three GC/MS Sample Injection
Overview. Introduction. AB SCIEX MPX -2 High Throughput TripleTOF 4600 LC/MS/MS System
 Investigating the use of the AB SCIEX TripleTOF 4600 LC/MS/MS System for High Throughput Screening of Synthetic Cannabinoids/Metabolites in Human Urine AB SCIEX MPX -2 High Throughput TripleTOF 4600 LC/MS/MS
TMS TANK MANAGEMENT SYSTEM
 TMS TANK MANAGEMENT SYSTEM Page 1 of 9 Operating Instructions GENERAL The Tank Management System is a bespoke design to control, monitor and accommodate efficient storage and dispensing of TMS. FUNCTIONS
Austin Peay State University Department of Chemistry Chem 1111. The Use of the Spectrophotometer and Beer's Law
 Purpose To become familiar with using a spectrophotometer and gain an understanding of Beer s law and it s relationship to solution concentration. Introduction Scientists use many methods to determine
Strategy for Functional Material Development in FUJIFILM
 証券コード 4901 Strategy for Functional Material Development in FUJIFILM - Global competency strategy for business innovation in Functional Material Industry - Sep. 24, 2013 FUJIFILM Corporation Development
DSM155 Digital LED Light Meter User s Manual DSM155
 DSM155 Digital LED Light Meter User s Manual DSM155 CONTENTS TABLE OF CONTENTS......3 LIMITED WARRANTY AND LIMITATION OF LIABILITY......3 Out of Box....3 Accessories....3 Safety Information....3 Certification....5
Chapter 28: High-Performance Liquid Chromatography (HPLC)
") Chapter 28: High-Performance Liquid Chromatography (HPLC) Scope Instrumentation eluants, injectors, columns Modes of HPLC Partition chromatography Adsorption chromatography Ion chromatography Size exclusion
Chapter 28: High-Performance Liquid Chromatography (HPLC) Scope Instrumentation eluants, injectors, columns Modes of HPLC Partition chromatography Adsorption chromatography Ion chromatography Size exclusion
Drop Counter Sensor Product Number: ENDRP-AD100
 imagine explore learn Drop Counter Sensor Product Number: ENDRP-AD100 Overview The Drop Counter sensor is an optical sensor that accurately records the number of drops of titrant added during a titration.
Beer's Law: Colorimetry of Copper(II) Solutions
 Solutions") Exercise 11 Page 1 Illinois Central College CHEMISTRY 130 Name: Beer's Law: Colorimetry of Copper(II) Solutions Objectives In this experiment, we will use Beer's Law to determine the unknown concentrations
Exercise 11 Page 1 Illinois Central College CHEMISTRY 130 Name: Beer's Law: Colorimetry of Copper(II) Solutions Objectives In this experiment, we will use Beer's Law to determine the unknown concentrations
Image Area EXCEPTIONAL PERFORMANCE FOR CHALLENGING MERCURY ANALYSES. FIMS 100 and 400. Flow Injection Mercury Systems
 Image Area EXCEPTIONAL PERFORMANCE FOR CHALLENGING MERCURY ANALYSES FIMS 100 and 400 Flow Injection Mercury Systems Delivering the Performance You Need The determination and monitoring of sub-ppb concentrations
Spectrophotometry Practical Lesson on Medical Chemistry and Biochemistry
 Spectrophotometry Practical Lesson on Medical Chemistry and Biochemistry General Medicine Jiřina Crkovská (translated by Jan Pláteník) 2010/2011 1 Spectrophotometry is one of the most widely used instrumental
Upon completion of this lab, the student will be able to:
 1 Learning Outcomes EXPERIMENT B4: CHEMICAL EQUILIBRIUM Upon completion of this lab, the student will be able to: 1) Analyze the absorbance spectrum of a sample. 2) Calculate the equilibrium constant for
Chemistry 111 Lab: Intro to Spectrophotometry Page E-1
 Chemistry 111 Lab: Intro to Spectrophotometry Page E-1 SPECTROPHOTOMETRY Absorption Measurements & their Application to Quantitative Analysis study of the interaction of light (or other electromagnetic
MCP 100 MCP 150. Modular Compact Polarimeters. ::: Superior Optical Instruments
 MCP 100 MCP 150 Modular Compact Polarimeters ::: Superior Optical Instruments Your Promise Anton Paar's Solution You have always made sure that your optically active substances meet all quality standards.
High pressure reactors Where are your limits?
 Laboratory equipment High pressure reactors Where are your limits? Modern high pressure reactors need to be technically safe, reliable, economical in use and simple to operate. With Berghof quality and
AMD Analysis & Technology AG
 AMD Analysis & Technology AG Application Note 120419 Author: Karl-Heinz Maurer APCI-MS Trace Analysis of volatile organic compounds in ambient air A) Introduction Trace analysis of volatile organic compounds
THERMAL ANEMOMETRY ELECTRONICS, SOFTWARE AND ACCESSORIES
 TSI and TSI logo are registered trademarks of TSI Incorporated. SmartTune is a trademark of TSI Incorporated. THERMAL ANEMOMETRY ELECTRONICS, SOFTWARE AND ACCESSORIES IFA 300 Constant Temperature Anemometry
Trace Gas Exchange Measurements with Standard Infrared Analyzers
 Practical Environmental Measurement Methods Trace Gas Exchange Measurements with Standard Infrared Analyzers Last change of document: February 23, 2007 Supervisor: Charles Robert Room no: S 4381 ph: 4352
SURFACE MOUNT LED LAMP STANDARD BRIGHT 0606
 PACKAGE DIMENSIONS 0.075 (1.9) 0.063 (1.6) 0.035 (0.9) TOP 0.047 (1.2) 0.012 (0.3) 0.032 [0.8] SIDE 0.043 [1.1] 1 3 0.020 [0.5] 2 4 BOTTOM CATHODE MASK 1 2 3 4 HER / AlGaAs Red / Yellow (for-34) Green
APPLICATION INFORMATION
 DRAFT: Rev. D A-2045A APPLICATION INFORMATION Flow Cytometry 3-COLOR COMPENSATION Raquel Cabana,* Mark Cheetham, Jay Enten, Yong Song, Michael Thomas,* and Brendan S. Yee Beckman Coulter, Inc., Miami FL
Cross-beam scanning system to detect slim objects. 100 mm 3.937 in
 891 Object Area Sensor General terms and conditions... F-17 Related Information Glossary of terms... P.1359~ Sensor selection guide...p.831~ General precautions... P.1405 PHOTO PHOTO Conforming to EMC
Supporting Information
 Supporting Information [C 70 ] Fullerene-Sensitized Triplet-Triplet Annihilation Upconversion Kyle Moor a, Jae-Hyuk Kim a, Samuel Snow b, and Jae-Hong Kim a,b a Department of Chemical and Environmental
Spectroscopy. Biogeochemical Methods OCN 633. Rebecca Briggs
 Spectroscopy Biogeochemical Methods OCN 633 Rebecca Briggs Definitions of Spectrometry Defined by the method used to prepare the sample 1. Optical spectrometry Elements are converted to gaseous atoms or
Advanced Solutions for Gas Monitoring
 Continuous Emissions Monitoring Stack Testing Process Monitoring Quality Control Engine Exhaust Gas Monitoring Workplace Air Quality Monitoring Combustion Research Emergency Rescue Services Advanced Solutions
UV-VIS VARIAN, INC. Cary 100/300 UV-Vis. S p e c t r o p h o t o m e t e r s
 UV-VIS VARIAN, INC. Cary 100/300 UV-Vis S p e c t r o p h o t o m e t e r s Unmatched quality and performance Outstanding performance, flexibility, and ease of use are what you can expect from Varian s
MAVO-MONITOR / MAVO-SPOT Instrument Set for Contact or Distant Measurements of Luminances
 Operating Instructions MAVO-MONITOR / MAVO-SPOT Instrument Set for Contact or Distant Measurements of Luminances 15043 1/1.00 10 9 8 1 7 6 1 Display 2 Slider switch cd/m² segment test 3 ON/OFF switch 4