GAW 15 Problem 3: Simulated Rheumatoid Arthritis Data Full Model and Simulation Parameters
|
|
|
- Charla Blair
- 10 years ago
- Views:
Transcription
1 GAW 15 Problem 3: Simulated Rheumatoid Arthritis Data Full Model and Simulation Parameters Michael B Miller <[email protected]>, Michael Li <[email protected]>, Gregg Lind <[email protected]>, Soon-Young Jang <[email protected]> School of Public Health, University of Minnesota See the readme files distributed with the Problem 3 data for basic information about the data. This document explains the genetic model used to generate the data. For a quick overview of the model, look at the figure on the final page of this document and the figure caption on the penultimate page. If you have any questions after reading this document, please write to Mike Miller at the address given above. This document includes sections on the trait loci and their relationships to the phenotypes, more description of how the phenotypes were modeled, then details on the selection and modeling of marker loci. Trait Loci The following two tables summarize the trait locus positions and effects for all nine major genes. More details follow the tables. Effects of Trait Loci (Major Genes) locus chr cm trait locus effect DR affects risk of RA A controls effect of DR on RA risk B controls effect of smoking on RA risk C cm from DR, increases RA risk only in women D cm from DR, rare allele increases RA risk 5-fold E controls effect of DR on anti-ccp and increases RA risk F QTL for IgM G cm from Locus H, is 25% QTL for severity H cm from Locus G, is 25% QTL for severity

2 Genetic and Physical Map Locations of Trait Loci (Major Genes) locus chr cm Male cm Female cm physical location (bp) DR A B C D E F G H We use DR as shorthand for the DRB1 locus of HLA. All loci are in linkage equilibrium with all other loci except for locin on chromosome 6. Loci C and DR have the maximum possible LD between them (a D' of 1.0), given their frequencies. Locus D is in very weak LD with Loci DR and C. All loci are diallelic except for DR which is triallelic. Effects of Loci and Risk Variables Affecting Outcomes Hazard and Risk The model uses a constant hazard function to determine risk of RA. We planned at first to determine age at onset according to this exponential survival model, but it turned out that age of onset was then too strongly linked to some loci. We then retained the hazard approach but gave every individual the same risk period and the same base hazard (exponentiated intercept term). Therefore, multiplying hazard by some value is equivalent to multiplying risk by that value and the terms risk and hazard are used somewhat interchangeably below. Once hazard was known for a subject, we used the hazard to determine the mean of an exponential random variable. If this variable was less than a fixed threshold value (i.e., within the risk period), the subject was affected. The values of the base hazard and threshold are arbitrary, but they jointly determine population prevalence. Also see the section RA affection status under Phenotypes below. HLA and Locus C We model three DR alleles at the HLA locus. DR is in strong LD (multi-allelic D' = 1.0) and complete linkage (0 recombination fraction) with Locus C. DR effects are independent of locus C effects, but DR effects are epistatically controlled by Locus A. In females only, each C allele increases risk by a factor of 2.1 (female risk of RA is multiplied by 2.1 for the Cc genotype and by 4.41 for the CC genotype). Females with

3 no C alleles (cc) have no increased risk. The allele frequency for C is 0.5. DR/C haplotypes are shown in the following table. DR/C Haplotype Frequencies (showing LD) C c DR DR DRx Multiallelic: D =.15, D' = 1.0. HLA/DR and Locus A Locus A affects the impact of HLA DR types in a dominant fashion. Individuals with Aa or AA genotypes have their hazard multiplied by a value that is determined by their DR type according to the Risk Multipliers table below. A value of 1 indicates no change in risk. The allele frequency for A is.3 (thus the "aa" genotype has frequency 49% and "A_" has frequency 51%). Average DR Risk (across A Genotypes) DRX DR DR DR Risk Multipliers DRX DR DR DR Risk ("aa") - 49% frequency DRX DR DR
. Average DR Risk (across A Genotypes) DRX 1 1 5 DR1 1 1.5 6 DR4 5 6 30 DR Risk Multipliers DRX 0.")
4 HLA Risk ("Aa" or "AA") - 51% frequency DRX DR DR Locus B In smokers only, Bb or BB genotype multiplies RA risk by 1.5. This has the effect that smokers have no directly increased risk if their genotype is bb, but they still have some indirectly increased risk through the effect of smoking on IgM. The allele frequency for allele B is.35. Locus D Locus D has a direct effect on RA risk but a low allele frequency. Each D allele multiplies hazard by 5. The D allele frequency is only.0083 (exactly 1/120; so DD homozygotes are very rare). Locus E This locus has a strong direct effect on RA hazard, multiplying by 2.2 for each E allele (2.2 for Ee and 4.84 for EE). Locus E also affects anti-ccp by controlling which DR genotypes place a subject in the "high-mean" anti-ccp group (see the Anti-CCP section below). For a DR4 homozygotes only, having any E alleles puts one in the high-mean group. The high-mean group consists entirely of DR4 homozygotes with Ee or EE genotypes. The frequency of the E allele is.25. No E Alleles (ee) DRX DR DR One or Two E Alleles (Ee or EE) DRX DR DR

5 The + in the tables above denotes being in the group with high mean anti-ccp, which occurs only for DR4/DR4 homozygotes with at least one Ee or EE genotype. Locus F An additive effect of locus F causes 30% of the variance in IgM. Mean values of IgM are proportional to number of F alleles. The frequency of the F allele is.5. Loci G & H These two diallelic loci have allele frequencies of.1 and.2, respectively, and each contributes an additive genetic effect that accounts for 25% of the variance of latent severity (a total of 50% jointly). These loci are 2 cm apart on chromosome 9, but they are not in LD. Thresholds on latent severity are used to produce observed severity. Phenotypes Age. Ages for pairs of siblings were drawn from a bivariate normal distribution having parameters similar to pairs of affected siblings in real RA data we were given (rho=.855, stdev = 11.51, mean = 54.60), but pairs were retained only if both ages were between 18 and 87. The mother's age at the birth of the oldest sibling was uniformly distributed between 20 and 30 years and the father's age was equal to the mother's age plus a triangular random variable with a range from -1 to 5 and a mean of 2. This kept all ages reasonable and within acceptable ranges. The age reported for deceased individuals is the age they would have been at ascertainment of their oldest child, if they had lived. Age at death is also reported for deceased parents. Sex. The sex of offspring was determined by age from published census data on sex ratio by age. Death and Age of Death. All offspring are living. The variable "dead" has value 1 for parents who were deceased at the time of ascertainment, and value 0 for parents who were living. A parent was determined to be dead based on 2002 CDC mortality statistics for 10-year age classes. We applied a constant hazard within all but the oldest age group and started at the age of the parent when the youngest child was born. In the oldest age group from 85 to 100 years, the density for age at death had a linear form with the mode at 85 and zero density at 100, limiting longevity to age 100. We present data for dead parents as if they were alive. Age at death is provided. RA has a small mortality effect. The age of death for affected parents is on average 2 years (symmetrical triangular distribution with endpoints 0, 4) earlier than expected. RA affection status. Affection was determined by taking a fixed threshold on an exponential random variable (values below threshold were affected). The mean of the exponential random variable (reciprocal of the hazard) was determined by multiplication of risk factors. More precisely, the log-hazard was modeled as a linear function of risk
.")
6 factors and the individual exponential mean was 1/exp(log-hazard). This is a proportional hazards model with constant hazard and fixed follow-up time. Mortality and age were ignored in determining affection status. Variables and parameters that determined hazard are described below. Smoking status. This was based on an age-dependent threshold model. A normal (0,1) random variable was generated for every subject such that variance was due to additive polygenic (50%), shared environmental (40%) and non-shared environmental (10%) influences. These numbers were based on results of a published twin study. Parents were genetically independent. Thresholds were determined by age according to CDC data so that individuals whose normal value exceeded a threshold were considered to be lifetime smokers at a probability appropriate for their age. IgM. We generated a latent IgM value from a normal mixture with means determined by Locus F. Variance in latent IgM is caused by Smoking Status (24%), additive effect of Locus F (30%), and a residual (46%) with the residual variance being divided between additive polygenic (60%), and non-shared environmental (40%) components. The IgM latent variable was transformed monotonically to fit the distribution of IgM in real RA data. Anti-CCP. Locus E and HLA/DR genotype jointly created 10.3% of the variance in anti- CCP as described in the "Locus E" section above. The remaining variance was caused by additive polygenic (60%), and non-shared environmental (40%) components. The anti-ccp latent variable was rank rescaled using the observed distribution of values in the RA reference data to create the final anti-ccp values. Severity. Severity was determined by two diallelic loci (G and H, allele frequencies of 0.1 and 0.2 respectively) with additive effects. Each of the loci accounts for 25% of the total variance. The remaining variance (50%) is due to an individual random environment effect. There are 5 severity classes, each containing 20% of the affected persons. Age of Onset. The age of onset (for affected offspring) was created from an "onset" latent variable that equally weighed the hazard, latent severity, and an independent random variate. This variable was converted to ranks and used with real RA data to derive a "proportion of life affected," which multiplied by the ascertainment age, yielded the age of onset. Residual Effect: There is a residual effect on the log-hazard for RA that is composed of shared environment effect (85% of variance) and a non-shared environment effect (15%). The shared environment effect is a constant multiple of a Bernoulli-distributed random variable and it is shared by all members of a family in 30% of families. The non-shared environment effect was normally distributed. The convolution (sum of the two variables) was a normal mixture with a standard deviation of

7 Summary Of Key Covariate Effects Smoking: Affects RA risk directly with Locus B interaction, and through its effect on IgM. Age: Age affects RA risk through its affect on smoking and through its effect on the sex ratio. Age affects mortality, but only in the parents, and we report affection status regardless of mortality. Sex: Nearly all of the sex effect comes from Locus C, but the general population M:F sex ratio in the offspring generation has an effect. Use of HapMap Data All trait loci and marker data were derived from HapMap Phase I data on 120 haplotypes estimated from CEPH data on Utah Residents with Northern and Western European ancestry (known as the "CEU" data). This naturally created LD between all markers and trait loci. Generating Founder Haplotypes The haplotypes for founders in our nuclear families were generated by randomly recombining HapMap CEU haplotypes. Based partly on population genetics theory and partly on our tests of LD, we chose to multiply map length by 30 so that on a 1 Morgan interval of a founder haplotype there are, on average, 30 points where the ancestry switches from one of the 120 HapMap haplotypes to another one (but the "other one" would be the same one with probability 1/120). The number of these switch points per Morgan follows a Poisson distribution and locations of switch points are uniformly distributed in the genetic map. This provides something very similar to what would be obtained by selecting a random haplotype after 30 generations of random mating of a large population of the 120 HapMap haplotypes where the HapMap haplotypes have equal frequency. (It differs only in using a sex-averaged map instead of allowing for male-female differences in recombination -- but the effect of modeling such an effect would be trivial. We used sex-specific maps to model genetic transmission within families.) Generating maps HapMap data provided estimated sex-averaged map locations in cms for every SNP, but it did not provide sex-specific maps. To derive sex-specific maps for the HapMap markers, we used the sex-specific maps presented by Kong et al.[1] and we used linear interpolation to choose appropriate male and female distances that corresponded to the

8 sex-averaged distances from HapMap. The sex-averaged maps were used to generate the locations of recombination junctions for meioses in the nuclear families. Recombination We used a Haldane model (Poisson process). The locations of all recombination junctions from transmitted chromosomes were stored and used for every marker set (trait loci, microsatellites, 10k SNPs and Chromosome 6 dense SNP map). We also store complete information about how parental haplotypes were extracted from HapMap data. Thus, our method allows us to add more markers from the HapMap data after the simulation project is over, just as one could type more markers from DNA samples. Selection of Microsatellites To generate microsatellites, we decided to look at every set of four consecutive SNP markers in hapmap and treat them as binary numbers from 0 to 15. We could then treat the binary numbers as alleles. Each marker so constructed was placed on the map at the location of the left-most of the four SNPs used to construct it. We then generated a list of the locations of the markers with heterozygosities exceeding.70. We chose how many of those polymorphic markers to retain based on the numbers of markers that had been used in a 5 cm Marshfield marker set. We then selected the subset of markers on every chromosome to achieve the target number of markers while maximizing the size of the smallest inter-marker distance and retaining the two most telomeric markers. Microsatellites selected in this way would have a stronger LD with nearby SNPs than one would expect to see in real data. Therefore, we "mutated" the microsatellites by adding a random number. We added floor(3*u 4 ), where U is a uniform (0,1) pseudorandom value. This term has a distribution of 0, 1, 2 with probabilities,.76,.14,.10. This weakens LD between microsatellites and nearby SNPs to some degree. There are 730 microsatellite markers on the 22 autosomes with a maximum intermarker distance of 9.3 cm (sex averaged). Selection of SNP Markers for the 10K SNP Set Our goal here was to mimic an Affymetrix Xba K SNP chip. The distribution of the SNP minor allele frequencies in HapMap is similar to that of Affymetrix 10K SNP chip, but we did not use any monomorphic SNPs. We simply ignored frequencies and focused on physical map positions. We took a list of the physical map locations of the SNPs from the Affymetrix 10k chip and for every one of those markers, we identified the marker in HapMap that was physically closest to the marker from Affymetrix. We then used that collection of HapMap markers for our 10K SNP set.

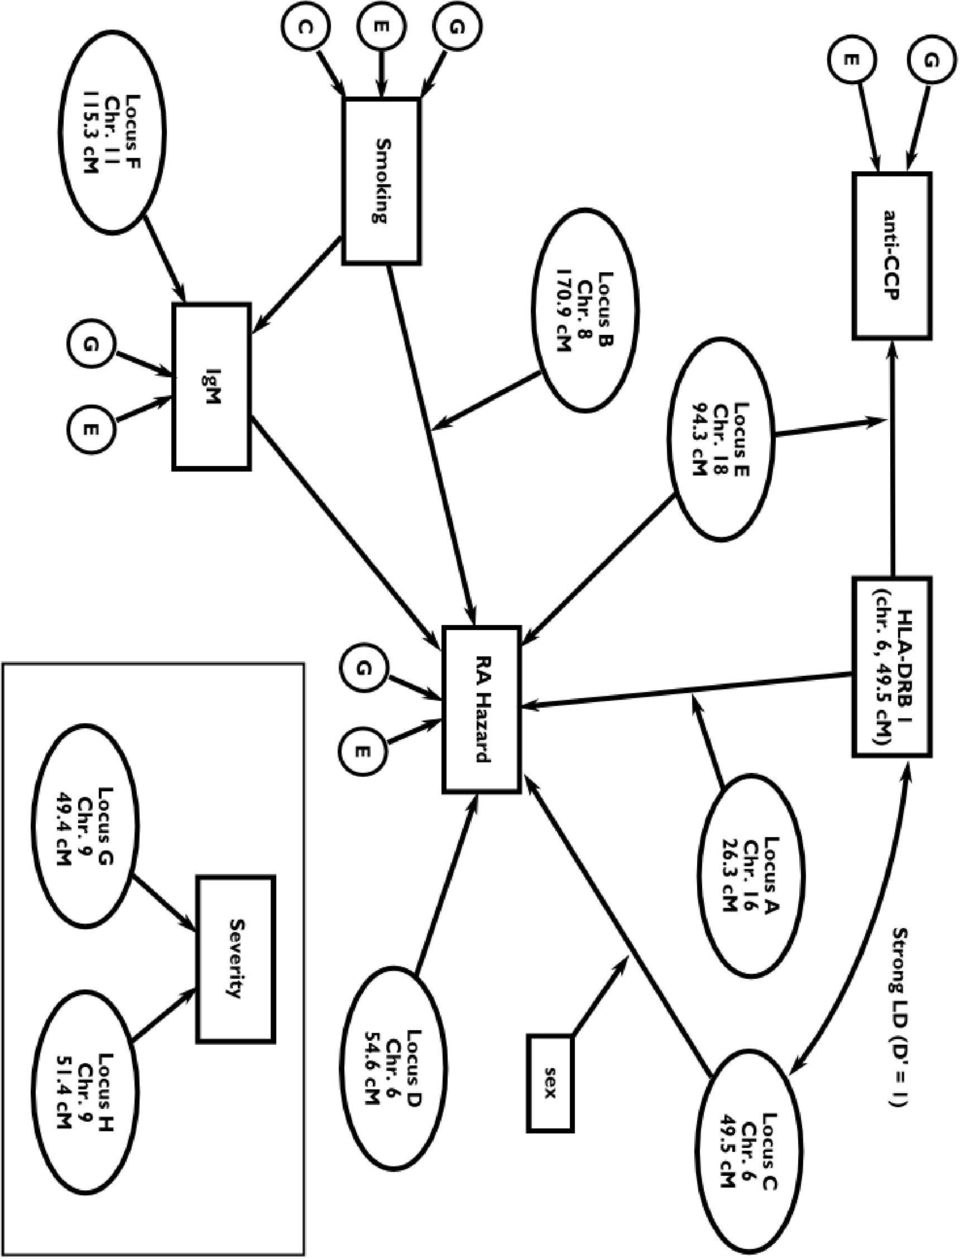
9 There are 9,187 SNPs on the 22 autosomes in the 10K SNP set and a maximum intermarker distance of 11.8 cm. Selection of a Dense SNP Map for Chromosome 6 We wanted the chromosome 6 SNP map to correspond roughly to what one might have for chromosome 6 from a 300K SNP chip. We counted the number of HapMap SNPs and found that there were about 812,000 SNPs, roughly three times the number on a 300K SNP chip. We then simply retained every third SNP from the HapMap data to produce 8,910 SNPs for the Chromosome 6 dense SNP map. Acknowledgement We thank the members of the GAW15 committee for their help and patience. We especially thank Chris Amos for coming up with most of the interesting ideas on how to model RA genetics, but please blame us for anything you don t like! References 1. Kong A, et al. (2002). A high-resolution recombination map of the human genome. Nature Genetics, 31, Figure Caption. Genetic loci are represented as ovals, normally-distributed polygenic/environmental variables are represented as circles (G = additive polygenic, C = common family environment, E = non-shared environment) and observed variables are represented as rectangles. The RA hazard is a continuous variable that is dichotomized into affected/unaffected before it is observed, and severity is polytomized into five levels before it is observed. Arrows indicate where effects of variables are manifested. For example HLA-DRB1 affects both anti-ccp levels and RA Hazard, but the strength of its effect on anti-ccp is controlled by Locus E genotype and the effect of HLA-DRB1 on RA Hazard is controlled by Locus A genotype.

10
MAGIC design. and other topics. Karl Broman. Biostatistics & Medical Informatics University of Wisconsin Madison
 MAGIC design and other topics Karl Broman Biostatistics & Medical Informatics University of Wisconsin Madison biostat.wisc.edu/ kbroman github.com/kbroman kbroman.wordpress.com @kwbroman CC founders compgen.unc.edu
CCR Biology - Chapter 7 Practice Test - Summer 2012
 Name: Class: Date: CCR Biology - Chapter 7 Practice Test - Summer 2012 Multiple Choice Identify the choice that best completes the statement or answers the question. 1. A person who has a disorder caused
Heritability: Twin Studies. Twin studies are often used to assess genetic effects on variation in a trait
 TWINS AND GENETICS TWINS Heritability: Twin Studies Twin studies are often used to assess genetic effects on variation in a trait Comparing MZ/DZ twins can give evidence for genetic and/or environmental
Basics of Marker Assisted Selection
 asics of Marker ssisted Selection Chapter 15 asics of Marker ssisted Selection Julius van der Werf, Department of nimal Science rian Kinghorn, Twynam Chair of nimal reeding Technologies University of New
SeattleSNPs Interactive Tutorial: Web Tools for Site Selection, Linkage Disequilibrium and Haplotype Analysis
 SeattleSNPs Interactive Tutorial: Web Tools for Site Selection, Linkage Disequilibrium and Haplotype Analysis Goal: This tutorial introduces several websites and tools useful for determining linkage disequilibrium
Deterministic computer simulations were performed to evaluate the effect of maternallytransmitted
 Supporting Information 3. Host-parasite simulations Deterministic computer simulations were performed to evaluate the effect of maternallytransmitted parasites on the evolution of sex. Briefly, the simulations
Chromosomes, Mapping, and the Meiosis Inheritance Connection
 Chromosomes, Mapping, and the Meiosis Inheritance Connection Carl Correns 1900 Chapter 13 First suggests central role for chromosomes Rediscovery of Mendel s work Walter Sutton 1902 Chromosomal theory
DNA Determines Your Appearance!
 DNA Determines Your Appearance! Summary DNA contains all the information needed to build your body. Did you know that your DNA determines things such as your eye color, hair color, height, and even the
Globally, about 9.7% of cancers in men are prostate cancers, and the risk of developing the
 Chapter 5 Analysis of Prostate Cancer Association Study Data 5.1 Risk factors for Prostate Cancer Globally, about 9.7% of cancers in men are prostate cancers, and the risk of developing the disease has
Genetics of Rheumatoid Arthritis Markey Lecture Series
 Genetics of Rheumatoid Arthritis Markey Lecture Series Al Kim [email protected] 2012.09.06 Overview of Rheumatoid Arthritis Rheumatoid Arthritis (RA) Autoimmune disease primarily targeting the synovium
Gene Mapping Techniques
 Gene Mapping Techniques OBJECTIVES By the end of this session the student should be able to: Define genetic linkage and recombinant frequency State how genetic distance may be estimated State how restriction
Logistic Regression (1/24/13)
") STA63/CBB540: Statistical methods in computational biology Logistic Regression (/24/3) Lecturer: Barbara Engelhardt Scribe: Dinesh Manandhar Introduction Logistic regression is model for regression used
STA63/CBB540: Statistical methods in computational biology Logistic Regression (/24/3) Lecturer: Barbara Engelhardt Scribe: Dinesh Manandhar Introduction Logistic regression is model for regression used
Basic Principles of Forensic Molecular Biology and Genetics. Population Genetics
 Basic Principles of Forensic Molecular Biology and Genetics Population Genetics Significance of a Match What is the significance of: a fiber match? a hair match? a glass match? a DNA match? Meaning of
HLA data analysis in anthropology: basic theory and practice
 HLA data analysis in anthropology: basic theory and practice Alicia Sanchez-Mazas and José Manuel Nunes Laboratory of Anthropology, Genetics and Peopling history (AGP), Department of Anthropology and Ecology,
Name: Class: Date: ID: A
 Name: Class: _ Date: _ Meiosis Quiz 1. (1 point) A kidney cell is an example of which type of cell? a. sex cell b. germ cell c. somatic cell d. haploid cell 2. (1 point) How many chromosomes are in a human
GENOMIC SELECTION: THE FUTURE OF MARKER ASSISTED SELECTION AND ANIMAL BREEDING
 GENOMIC SELECTION: THE FUTURE OF MARKER ASSISTED SELECTION AND ANIMAL BREEDING Theo Meuwissen Institute for Animal Science and Aquaculture, Box 5025, 1432 Ås, Norway, [email protected] Summary
Chapter 8: Recombinant DNA 2002 by W. H. Freeman and Company Chapter 8: Recombinant DNA 2002 by W. H. Freeman and Company
 Genetic engineering: humans Gene replacement therapy or gene therapy Many technical and ethical issues implications for gene pool for germ-line gene therapy what traits constitute disease rather than just
(1-p) 2. p(1-p) From the table, frequency of DpyUnc = ¼ (p^2) = #DpyUnc = p^2 = 0.0004 ¼(1-p)^2 + ½(1-p)p + ¼(p^2) #Dpy + #DpyUnc
 2. p(1-p) From the table, frequency of DpyUnc = ¼ (p^2) = #DpyUnc = p^2 = 0.0004 ¼(1-p)^2 + ½(1-p)p + ¼(p^2) #Dpy + #DpyUnc") Advanced genetics Kornfeld problem set_key 1A (5 points) Brenner employed 2-factor and 3-factor crosses with the mutants isolated from his screen, and visually assayed for recombination events between
Advanced genetics Kornfeld problem set_key 1A (5 points) Brenner employed 2-factor and 3-factor crosses with the mutants isolated from his screen, and visually assayed for recombination events between
Y Chromosome Markers
 Y Chromosome Markers Lineage Markers Autosomal chromosomes recombine with each meiosis Y and Mitochondrial DNA does not This means that the Y and mtdna remains constant from generation to generation Except
Population Genetics and Multifactorial Inheritance 2002
 Population Genetics and Multifactorial Inheritance 2002 Consanguinity Genetic drift Founder effect Selection Mutation rate Polymorphism Balanced polymorphism Hardy-Weinberg Equilibrium Hardy-Weinberg Equilibrium
Chapter 9 Patterns of Inheritance
 Bio 100 Patterns of Inheritance 1 Chapter 9 Patterns of Inheritance Modern genetics began with Gregor Mendel s quantitative experiments with pea plants History of Heredity Blending theory of heredity -
5 GENETIC LINKAGE AND MAPPING
 5 GENETIC LINKAGE AND MAPPING 5.1 Genetic Linkage So far, we have considered traits that are affected by one or two genes, and if there are two genes, we have assumed that they assort independently. However,
2 GENETIC DATA ANALYSIS
 2.1 Strategies for learning genetics 2 GENETIC DATA ANALYSIS We will begin this lecture by discussing some strategies for learning genetics. Genetics is different from most other biology courses you have
PRACTICE PROBLEMS - PEDIGREES AND PROBABILITIES
 PRACTICE PROBLEMS - PEDIGREES AND PROBABILITIES 1. Margaret has just learned that she has adult polycystic kidney disease. Her mother also has the disease, as did her maternal grandfather and his younger
The Human Genome. Genetics and Personality. The Human Genome. The Human Genome 2/19/2009. Chapter 6. Controversy About Genes and Personality
 The Human Genome Chapter 6 Genetics and Personality Genome refers to the complete set of genes that an organism possesses Human genome contains 30,000 80,000 genes on 23 pairs of chromosomes The Human
I. Genes found on the same chromosome = linked genes
 Genetic recombination in Eukaryotes: crossing over, part 1 I. Genes found on the same chromosome = linked genes II. III. Linkage and crossing over Crossing over & chromosome mapping I. Genes found on the
Paternity Testing. Chapter 23
 Paternity Testing Chapter 23 Kinship and Paternity DNA analysis can also be used for: Kinship testing determining whether individuals are related Paternity testing determining the father of a child Missing
UKB_WCSGAX: UK Biobank 500K Samples Genotyping Data Generation by the Affymetrix Research Services Laboratory. April, 2015
 UKB_WCSGAX: UK Biobank 500K Samples Genotyping Data Generation by the Affymetrix Research Services Laboratory April, 2015 1 Contents Overview... 3 Rare Variants... 3 Observation... 3 Approach... 3 ApoE
LAB : PAPER PET GENETICS. male (hat) female (hair bow) Skin color green or orange Eyes round or square Nose triangle or oval Teeth pointed or square
 female (hair bow) Skin color green or orange Eyes round or square Nose triangle or oval Teeth pointed or square") Period Date LAB : PAPER PET GENETICS 1. Given the list of characteristics below, you will create an imaginary pet and then breed it to review the concepts of genetics. Your pet will have the following
Period Date LAB : PAPER PET GENETICS 1. Given the list of characteristics below, you will create an imaginary pet and then breed it to review the concepts of genetics. Your pet will have the following
Genotyping and quality control of UK Biobank, a large- scale, extensively phenotyped prospective resource
 Genotyping and quality control of UK Biobank, a large- scale, extensively phenotyped prospective resource Information for researchers Interim Data Release, 2015 1 Introduction... 3 1.1 UK Biobank... 3
The correct answer is c A. Answer a is incorrect. The white-eye gene must be recessive since heterozygous females have red eyes.
 1. Why is the white-eye phenotype always observed in males carrying the white-eye allele? a. Because the trait is dominant b. Because the trait is recessive c. Because the allele is located on the X chromosome
Step-by-Step Guide to Bi-Parental Linkage Mapping WHITE PAPER
 Step-by-Step Guide to Bi-Parental Linkage Mapping WHITE PAPER JMP Genomics Step-by-Step Guide to Bi-Parental Linkage Mapping Introduction JMP Genomics offers several tools for the creation of linkage maps
2. Simple Linear Regression
 Research methods - II 3 2. Simple Linear Regression Simple linear regression is a technique in parametric statistics that is commonly used for analyzing mean response of a variable Y which changes according
Title: Genetics and Hearing Loss: Clinical and Molecular Characteristics
 Session # : 46 Day/Time: Friday, May 1, 2015, 1:00 4:00 pm Title: Genetics and Hearing Loss: Clinical and Molecular Characteristics Presenter: Kathleen S. Arnos, PhD, Gallaudet University This presentation
Documentation for structure software: Version 2.3
 Documentation for structure software: Version 2.3 Jonathan K. Pritchard a Xiaoquan Wen a Daniel Falush b 1 2 3 a Department of Human Genetics University of Chicago b Department of Statistics University
Okami Study Guide: Chapter 3 1
 Okami Study Guide: Chapter 3 1 Chapter in Review 1. Heredity is the tendency of offspring to resemble their parents in various ways. Genes are units of heredity. They are functional strands of DNA grouped
PRINCIPLES OF POPULATION GENETICS
 PRINCIPLES OF POPULATION GENETICS FOURTH EDITION Daniel L. Hartl Harvard University Andrew G. Clark Cornell University UniversitSts- und Landesbibliothek Darmstadt Bibliothek Biologie Sinauer Associates,
DNA as a Biometric. Biometric Consortium Conference 2011 Tampa, FL
 DNA as a Biometric Biometric Consortium Conference 2011 Tampa, FL September 27, 2011 Dr. Peter M. Vallone Biochemical Science Division National Institute of Standards and Technology Gaithersburg, MD 20899
Online Supplement to Polygenic Influence on Educational Attainment. Genotyping was conducted with the Illumina HumanOmni1-Quad v1 platform using
 Online Supplement to Polygenic Influence on Educational Attainment Construction of Polygenic Score for Educational Attainment Genotyping was conducted with the Illumina HumanOmni1-Quad v1 platform using
Step by Step Guide to Importing Genetic Data into JMP Genomics
 Step by Step Guide to Importing Genetic Data into JMP Genomics Page 1 Introduction Data for genetic analyses can exist in a variety of formats. Before this data can be analyzed it must imported into one
A Multi-locus Genetic Risk Score for Abdominal Aortic Aneurysm
 A Multi-locus Genetic Risk Score for Abdominal Aortic Aneurysm Zi Ye, 1 MD, Erin Austin, 1,2 PhD, Daniel J Schaid, 2 PhD, Iftikhar J. Kullo, 1 MD Affiliations: 1 Division of Cardiovascular Diseases and
SNPbrowser Software v3.5
 Product Bulletin SNP Genotyping SNPbrowser Software v3.5 A Free Software Tool for the Knowledge-Driven Selection of SNP Genotyping Assays Easily visualize SNPs integrated with a physical map, linkage disequilibrium
Combining Data from Different Genotyping Platforms. Gonçalo Abecasis Center for Statistical Genetics University of Michigan
 Combining Data from Different Genotyping Platforms Gonçalo Abecasis Center for Statistical Genetics University of Michigan The Challenge Detecting small effects requires very large sample sizes Combined
Journal of Statistical Software
 JSS Journal of Statistical Software October 2006, Volume 16, Code Snippet 3. http://www.jstatsoft.org/ LDheatmap: An R Function for Graphical Display of Pairwise Linkage Disequilibria between Single Nucleotide
SUPPLEMENTARY METHODS
 SUPPLEMENTARY METHODS Description of parameter selection for the automated calling algorithm The first analyses of the HLA data were performed with the haploid cell lines described by Horton et al. (1).
Genetics for the Novice
 Genetics for the Novice by Carol Barbee Wait! Don't leave yet. I know that for many breeders any article with the word genetics in the title causes an immediate negative reaction. Either they quickly turn
Variations on a Human Face Lab
 Variations on a Human Face Lab Introduction: Have you ever wondered why everybody has a different appearance even if they are closely related? It is because of the large variety or characteristics that
NGS and complex genetics
 NGS and complex genetics Robert Kraaij Genetic Laboratory Department of Internal Medicine [email protected] Gene Hunting Rotterdam Study and GWAS Next Generation Sequencing Gene Hunting Mendelian gene
Lecture 6: Single nucleotide polymorphisms (SNPs) and Restriction Fragment Length Polymorphisms (RFLPs)
 and Restriction Fragment Length Polymorphisms (RFLPs)") Lecture 6: Single nucleotide polymorphisms (SNPs) and Restriction Fragment Length Polymorphisms (RFLPs) Single nucleotide polymorphisms or SNPs (pronounced "snips") are DNA sequence variations that occur
Lecture 6: Single nucleotide polymorphisms (SNPs) and Restriction Fragment Length Polymorphisms (RFLPs) Single nucleotide polymorphisms or SNPs (pronounced "snips") are DNA sequence variations that occur
Chapter 3 RANDOM VARIATE GENERATION
 Chapter 3 RANDOM VARIATE GENERATION In order to do a Monte Carlo simulation either by hand or by computer, techniques must be developed for generating values of random variables having known distributions.
The Functional but not Nonfunctional LILRA3 Contributes to Sex Bias in Susceptibility and Severity of ACPA-Positive Rheumatoid Arthritis
 The Functional but not Nonfunctional LILRA3 Contributes to Sex Bias in Susceptibility and Severity of ACPA-Positive Rheumatoid Arthritis Yan Du Peking University People s Hospital 100044 Beijing CHINA
Forensic Statistics. From the ground up. 15 th International Symposium on Human Identification
 Forensic Statistics 15 th International Symposium on Human Identification From the ground up UNTHSC John V. Planz, Ph.D. UNT Health Science Center at Fort Worth Why so much attention to statistics? Exclusions
Two-locus population genetics
 Two-locus population genetics Introduction So far in this course we ve dealt only with variation at a single locus. There are obviously many traits that are governed by more than a single locus in whose
SNP Essentials The same SNP story
 HOW SNPS HELP RESEARCHERS FIND THE GENETIC CAUSES OF DISEASE SNP Essentials One of the findings of the Human Genome Project is that the DNA of any two people, all 3.1 billion molecules of it, is more than
Presentation by: Ahmad Alsahaf. Research collaborator at the Hydroinformatics lab - Politecnico di Milano MSc in Automation and Control Engineering
 Johann Bernoulli Institute for Mathematics and Computer Science, University of Groningen 9-October 2015 Presentation by: Ahmad Alsahaf Research collaborator at the Hydroinformatics lab - Politecnico di
Interpretation of Somers D under four simple models
 Interpretation of Somers D under four simple models Roger B. Newson 03 September, 04 Introduction Somers D is an ordinal measure of association introduced by Somers (96)[9]. It can be defined in terms
Heredity - Patterns of Inheritance
 Heredity - Patterns of Inheritance Genes and Alleles A. Genes 1. A sequence of nucleotides that codes for a special functional product a. Transfer RNA b. Enzyme c. Structural protein d. Pigments 2. Genes
Fact Sheet 14 EPIGENETICS
 This fact sheet describes epigenetics which refers to factors that can influence the way our genes are expressed in the cells of our body. In summary Epigenetics is a phenomenon that affects the way cells
Why Taking This Course? Course Introduction, Descriptive Statistics and Data Visualization. Learning Goals. GENOME 560, Spring 2012
 Why Taking This Course? Course Introduction, Descriptive Statistics and Data Visualization GENOME 560, Spring 2012 Data are interesting because they help us understand the world Genomics: Massive Amounts
Forensic DNA Testing Terminology
 Forensic DNA Testing Terminology ABI 310 Genetic Analyzer a capillary electrophoresis instrument used by forensic DNA laboratories to separate short tandem repeat (STR) loci on the basis of their size.
Genetics Lecture Notes 7.03 2005. Lectures 1 2
 Genetics Lecture Notes 7.03 2005 Lectures 1 2 Lecture 1 We will begin this course with the question: What is a gene? This question will take us four lectures to answer because there are actually several
Influence of Sex on Genetics. Chapter Six
 Influence of Sex on Genetics Chapter Six Humans 23 Autosomes Chromosomal abnormalities very severe Often fatal All have at least one X Deletion of X chromosome is fatal Males = heterogametic sex XY Females
Overview One of the promises of studies of human genetic variation is to learn about human history and also to learn about natural selection.
 Technical design document for a SNP array that is optimized for population genetics Yontao Lu, Nick Patterson, Yiping Zhan, Swapan Mallick and David Reich Overview One of the promises of studies of human
CHROMOSOMES AND INHERITANCE
 SECTION 12-1 REVIEW CHROMOSOMES AND INHERITANCE VOCABULARY REVIEW Distinguish between the terms in each of the following pairs of terms. 1. sex chromosome, autosome 2. germ-cell mutation, somatic-cell
Summary. 16 1 Genes and Variation. 16 2 Evolution as Genetic Change. Name Class Date
 Chapter 16 Summary Evolution of Populations 16 1 Genes and Variation Darwin s original ideas can now be understood in genetic terms. Beginning with variation, we now know that traits are controlled by
Complex Genetic Risk: The Implications for Insurance
 Complex Genetic Risk: The Implications for Insurance Angus Macdonald Heriot-Watt University, Edinburgh The Maxwell Institute for Mathematical Sciences Indeed, the sociology of risk... is an academic subject
Using Markers in Gene Introgression Breeding Programs
 Copyright 0 1992 by the Genetics Society of America Using Markers in Gene Introgression Breeding Programs Frikldric Hospital, Claude Chevalet and Philippe Mulsant Laboratoire de Ginitique Cellulaire, Znstitut
Introductory genetics for veterinary students
 Introductory genetics for veterinary students Michel Georges Introduction 1 References Genetics Analysis of Genes and Genomes 7 th edition. Hartl & Jones Molecular Biology of the Cell 5 th edition. Alberts
Statistical Analysis for Genetic Epidemiology (S.A.G.E.) Version 6.2 Graphical User Interface (GUI) Manual
 Version 6.2 Graphical User Interface (GUI) Manual") Statistical Analysis for Genetic Epidemiology (S.A.G.E.) Version 6.2 Graphical User Interface (GUI) Manual Department of Epidemiology and Biostatistics Wolstein Research Building 2103 Cornell Rd Case Western
Statistical Analysis for Genetic Epidemiology (S.A.G.E.) Version 6.2 Graphical User Interface (GUI) Manual Department of Epidemiology and Biostatistics Wolstein Research Building 2103 Cornell Rd Case Western
Asexual Versus Sexual Reproduction in Genetic Algorithms 1
 Asexual Versus Sexual Reproduction in Genetic Algorithms Wendy Ann Deslauriers ([email protected]) Institute of Cognitive Science,Room 22, Dunton Tower Carleton University, 25 Colonel By Drive
Pedigree Based Analysis using FlexQTL TM software
 Pedigree Based Analysis using FlexQTL TM software Marco Bink Eric van de Weg Roeland Voorrips Hans Jansen Outline Current Status: QTL mapping in pedigreed populations IBD probability of founder alleles
2. True or False? The sequence of nucleotides in the human genome is 90.9% identical from one person to the next. False (it s 99.
 1. True or False? A typical chromosome can contain several hundred to several thousand genes, arranged in linear order along the DNA molecule present in the chromosome. True 2. True or False? The sequence
This fact sheet describes how genes affect our health when they follow a well understood pattern of genetic inheritance known as autosomal recessive.
 11111 This fact sheet describes how genes affect our health when they follow a well understood pattern of genetic inheritance known as autosomal recessive. In summary Genes contain the instructions for
DNA Copy Number and Loss of Heterozygosity Analysis Algorithms
 DNA Copy Number and Loss of Heterozygosity Analysis Algorithms Detection of copy-number variants and chromosomal aberrations in GenomeStudio software. Introduction Illumina has developed several algorithms
Genetics 1. Defective enzyme that does not make melanin. Very pale skin and hair color (albino)
") Genetics 1 We all know that children tend to resemble their parents. Parents and their children tend to have similar appearance because children inherit genes from their parents and these genes influence
Genetics 1 We all know that children tend to resemble their parents. Parents and their children tend to have similar appearance because children inherit genes from their parents and these genes influence
Von Mäusen und Menschen E - 1
 Von Mäusen und Menschen E - 1 Mus musculus: Genetic Portrait of the House Mouse E - 3 Outline Mouse genome Mouse life cycle Transgenic protocols Addition of genes by nuclear injection Removal of genes
Array Comparative Genomic Hybridisation (CGH)
") Array Comparative Genomic Hybridisation (CGH) Exceptional healthcare, personally delivered What is array CGH? Array CGH is a new test that is now offered to all patients referred with learning disability
Array Comparative Genomic Hybridisation (CGH) Exceptional healthcare, personally delivered What is array CGH? Array CGH is a new test that is now offered to all patients referred with learning disability
Heredity. Sarah crosses a homozygous white flower and a homozygous purple flower. The cross results in all purple flowers.
 Heredity 1. Sarah is doing an experiment on pea plants. She is studying the color of the pea plants. Sarah has noticed that many pea plants have purple flowers and many have white flowers. Sarah crosses
Integration of genomic data into electronic health records
 Integration of genomic data into electronic health records Daniel Masys, MD Affiliate Professor Biomedical & Health Informatics University of Washington, Seattle Major portion of today s lecture is based
Tests in a case control design including relatives
 Tests in a case control design including relatives Stefanie Biedermann i, Eva Nagel i, Axel Munk ii, Hajo Holzmann ii, Ansgar Steland i Abstract We present a new approach to handle dependent data arising
Genetics and Evolution: An ios Application to Supplement Introductory Courses in. Transmission and Evolutionary Genetics
 G3: Genes Genomes Genetics Early Online, published on April 11, 2014 as doi:10.1534/g3.114.010215 Genetics and Evolution: An ios Application to Supplement Introductory Courses in Transmission and Evolutionary
FHF prosjekt 900706:
 FHF prosjekt 900706: Sporing av laks: SNP-tilnærming Matthew Kent, Harald Grove, Teresa Andersstuen, Mariann Arnyasi, Kristil Sundsaasen, Sigbjørn Lien CIGENE, Dept Animal and Aquaculture Sciences, Norwegian
Investigating the genetic basis for intelligence
 Investigating the genetic basis for intelligence Steve Hsu University of Oregon and BGI www.cog-genomics.org Outline: a multidisciplinary subject 1. What is intelligence? Psychometrics 2. g and GWAS: a
ESTIMATING THE DISTRIBUTION OF DEMAND USING BOUNDED SALES DATA
 ESTIMATING THE DISTRIBUTION OF DEMAND USING BOUNDED SALES DATA Michael R. Middleton, McLaren School of Business, University of San Francisco 0 Fulton Street, San Francisco, CA -00 -- [email protected]
Mendelian inheritance and the
 Mendelian inheritance and the most common genetic diseases Cornelia Schubert, MD, University of Goettingen, Dept. Human Genetics EUPRIM-Net course Genetics, Immunology and Breeding Mangement German Primate
The Developing Person Through the Life Span 8e by Kathleen Stassen Berger
 The Developing Person Through the Life Span 8e by Kathleen Stassen Berger Chapter 3 Heredity and Environment PowerPoint Slides developed by Martin Wolfger and Michael James Ivy Tech Community College-Bloomington
MATH4427 Notebook 2 Spring 2016. 2 MATH4427 Notebook 2 3. 2.1 Definitions and Examples... 3. 2.2 Performance Measures for Estimators...
 MATH4427 Notebook 2 Spring 2016 prepared by Professor Jenny Baglivo c Copyright 2009-2016 by Jenny A. Baglivo. All Rights Reserved. Contents 2 MATH4427 Notebook 2 3 2.1 Definitions and Examples...................................
PENCALC: A program for penetrance estimation in autosomal dominant diseases
 Short Communication Genetics and Molecular Biology, 33, 3, 455-459 (2010) Copyright 2010, Sociedade Brasileira de Genética. Printed in Brazil www.sbg.org.br PENCALC: A program for penetrance estimation
ASSIsT: An Automatic SNP ScorIng Tool for in and out-breeding species Reference Manual
 ASSIsT: An Automatic SNP ScorIng Tool for in and out-breeding species Reference Manual Di Guardo M, Micheletti D, Bianco L, Koehorst-van Putten HJJ, Longhi S, Costa F, Aranzana MJ, Velasco R, Arús P, Troggio
THE GENETIC ARCHITECTURE
 Annu. Rev. Genet. 2001. 35:303 39 Copyright c 2001 by Annual Reviews. All rights reserved THE GENETIC ARCHITECTURE OF QUANTITATIVE TRAITS TrudyF.C.Mackay Department of Genetics, Box 7614, North Carolina
EMPIRICAL FREQUENCY DISTRIBUTION
 INTRODUCTION TO MEDICAL STATISTICS: Mirjana Kujundžić Tiljak EMPIRICAL FREQUENCY DISTRIBUTION observed data DISTRIBUTION - described by mathematical models 2 1 when some empirical distribution approximates
A Primer of Genome Science THIRD
 A Primer of Genome Science THIRD EDITION GREG GIBSON-SPENCER V. MUSE North Carolina State University Sinauer Associates, Inc. Publishers Sunderland, Massachusetts USA Contents Preface xi 1 Genome Projects: