Raman Data Analysis. GeoRaman 2012 International School. N.Tarcea, Jürgen Popp
|
|
|
- Laura Page
- 10 years ago
- Views:
Transcription
1 Raman Data Analysis GeoRaman 2012 International School 14 th -16 th of June 2012, Nancy RAMAN SPECTROSCOPY APPLIED TO EARTH SCIENCES AND CULTURAL HERITAGE 1 N.Tarcea, Jürgen Popp 1, 2 1 Institute of Physical Chemistry, University of Jena, Germany 2 Institute of Photonic Technology, Jena, Germany

2 Overview Data Acquisition and storage Acquisition Storage & organization (spectral libraries) Pre-processing of Raman spectra Spike removal Smoothing/denoising Background Normalization Spectral and intensity (re-)calibration Chemometry methods for Raman spectroscopy Multivariate calibration algorithms (MLR, PCA, PCR) Classification methods Cluster analysis
 Classification methods")
3 Overview Data Acquisition and storage Acquisition Storage & organization (spectral libraries) Pre-processing of Raman spectra Spike removal Smoothing/denoising Background Normalization Spectral and intensity (re-)calibration Chemometry methods for Raman spectroscopy Multivariate calibration algorithms (MLR, PCA, PCR) Classification methods Cluster analysis
 Classification methods")
4 Data Acquisition 4
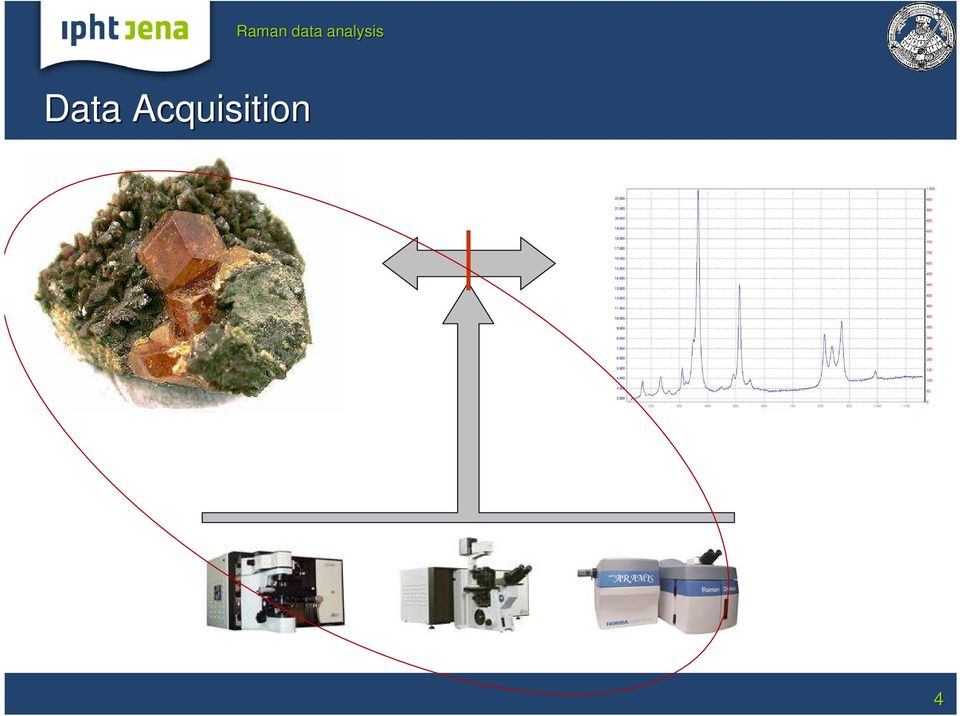
5 Data Acquisition Effort needed to control the data acquisition process depends on intended data usage. Will all Raman data be measured on a single device? Do I need to compare data with data measured on other devices? (degree of comparison?) Is data meant for a spectral database or building a robust calibration model (chemometrics)?. Facts: - vast majority of Raman devices make use of multichannel detection (e.g. using CCDs) - pixel uniformity? - modern Raman instruments are delivered with complex software packages => degree of data preprocessing not always known (and/or understood) by the user e.g. automatic calibration spectral frames joining with offsets spike removal background subtraction, intensity corrections etc. - spectral accuracy and stability changes (e.g. due to mechanical wear) - is your instrument still in specs? - degraded spectral calibration by grating movement or environmental changes (lab temperature) - instrument throughput characteristics might depend on light polarization (e.g. due to grating) - crystal sample orientation - laser wavelength might shift (e.g. diode laser) - Raman band shape convoluted with the instrument function (Gauss, Triangular etc.) - Variation in Raman spectra is induced by factors which are not always obvious.. 5
 by the user e.g. automatic calibration spectral frames joining with offsets spike removal background subtraction, intensity corrections etc.")
6 6

7 Data organisation/storage Different types of Raman data: simple spectrum (intensity vs. relative wavenumber) hyperspectral data (multiple dimensions: intensity, wavenumber, spatial coordinates, time) Different file formats: proprietary file formats (instrument manufacturer) industry standard formats (GRAMS format -.spc, ascii format) Information saved within a datafile: spectral (hyperspectral) data metadata (instrument configuration parameters, user comments, user defined parameters) Data organization: File system (project directories) data links in experiment log book descriptive filename/directories extra metadata items (file headers) 7
 Information saved within a datafile: spectral (hyperspectral) data metadata (instrument configuration parameters, user comments, user defined")
8 Data organisation/storage Relational databases (make use of SQL engines capabilities - MS Access, MySQL, MSSQL) Standard approach - each object type and each relation has a dedicated table - rigid object structure - effective data access and searching Entity-Attribute-Value (EAV) implementation - object structure and relations are defined as metadata inside the database - tables hold data split on their type (strings, integers, pictures etc.) - complex maintenance and user interface - complex constructs for searching and data mining - effective data access and searching - flexible object structure Graph databases (free schema database) (tools: Neo4J, InfoGrid, HyperGraph, AllegroGraph etc.) - nodes, properties and edges in a graph like structure - not in use for now by spectroscopic applications - used for bio and medical data, social networks co.) Raw Raman Spectrum Property: ascii data Property: measured on Relation: has been measured with Spectrometer HR400 Property: functional Property: booked Relation: was used for measuring 8
 - complex maintenance and user interface - complex constructs for searching and data mining - effective data access and searching - flexible object structure Graph databases (free schema database)")
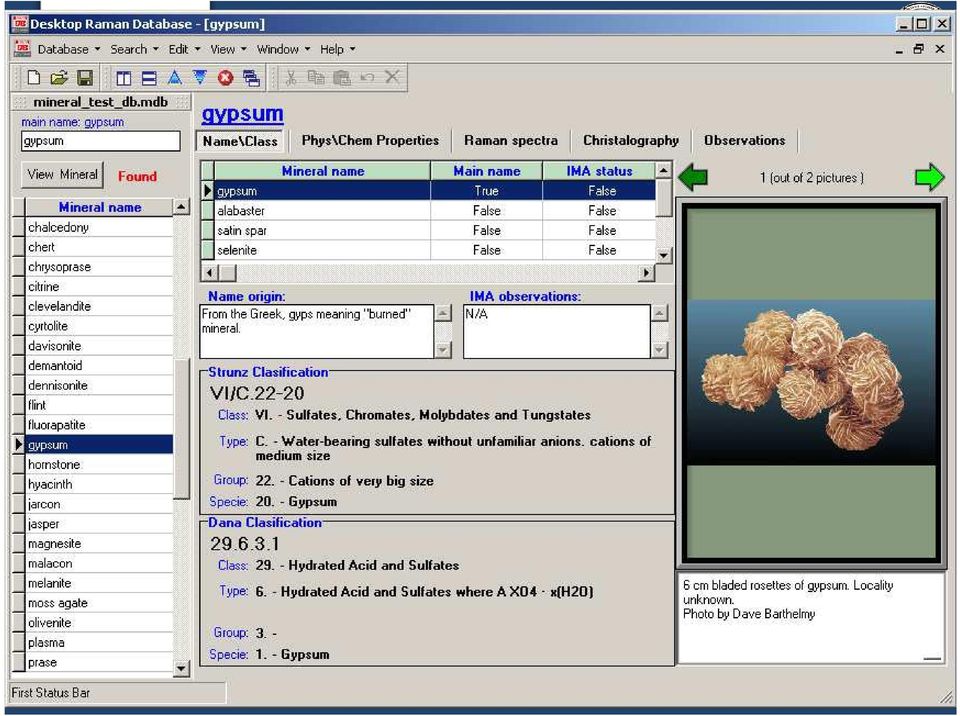
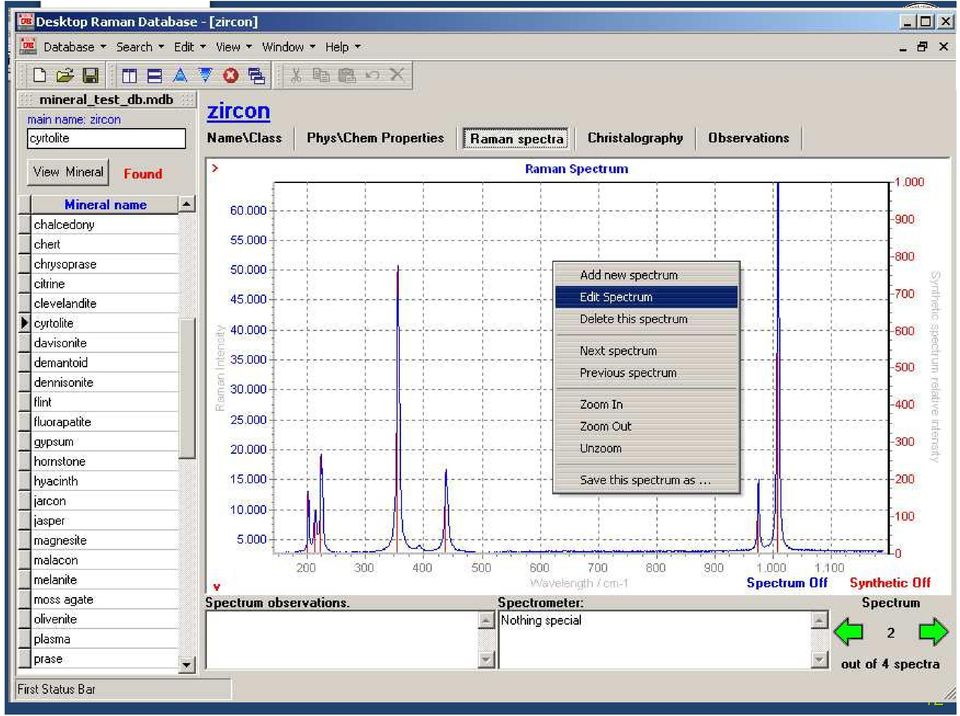
9 Databases Mineral centric 9

10 10
11

12 12
13

14 Databases sample/spectrum centric 14
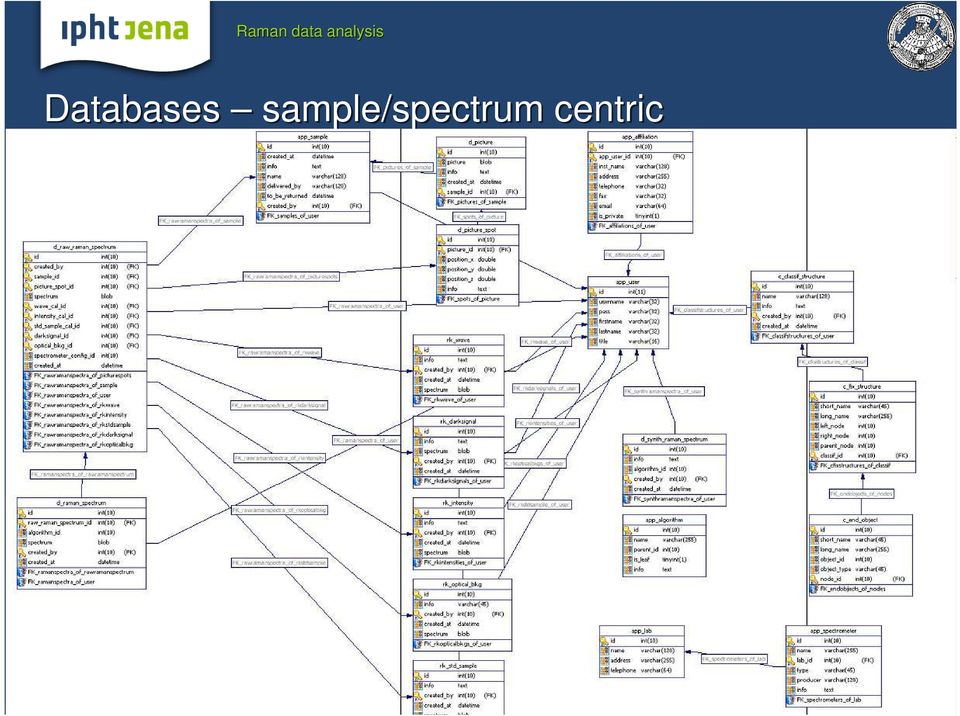
15 Databases sample/spectrum centric 15

16 Row Raman spectrum Detector dark-signal (laser off) Algorithm Optical background (laser on no sample) Wavelength calibration (spectral lamps) Intensity calibration (white light lamp) Standard sample (NIST standards) Algorithm Raman spectrum 16
 Standard sample (NIST standards) Algorithm Raman")
17 Free available Raman Spectra Databases RRUFF Project ( - more than 3000 different samples (more than 2000 minerals) + IR and X-Ray diffraction spectra. CrystalSleuth software for offline search RAMIN Raman Spectra Database of Minerals and Inorganic Materials is available at and has 576 Raman spectra of minerals and 1022 of other inorganics as end of Mineral Raman Database at University of Parma, Italy ~200 Raman spectra of minerals. Some others smaller free accessible databases: ColoRaman ( pigments, Handbook of Minerals Raman Spectra ( Minerals Raman spectra by Department of Earth Science in Siena ( Database of SFMC (Société Française de Minéralogie et Cristallographie) specially dedicated to minerals ( 17
 pigments, Handbook of Minerals Raman Spectra (http://www.ens-lyon.")
18 Commercially available Raman Spectra Databases Raman data libraries can be also purchased at instrument manufacturer (Horiba, Witec, Renishaw, Thermo Scientific, etc.) and are delivered also with most of the portable/handheld Raman devices. Other commercially available databases: Fiveash Data Management Inc. ( 600 Raman spectra of organics, 250 of pharmaceuticals 6051 minerals spectra Thermo Fisher Scientific Inc. ( over Raman spectra Bio Rad ( Raman spectra of polymers, inorganics and processing chemicals Sigma-Aldrich ( FT-Raman spectra S. T. Japan Europe GmbH ( searchable Raman spectra of polymers, food additives, food packaging, solvents, biochemicals, hydrocarbons, pesticides, dyes, pigments, pharmaceuticals, minerals and inorganics, etc. why so little compared with other techniques (IR, XRD)? 18
 4465 Raman spectra of polymers, inorganics and processing chemicals Sigma-Aldrich (http://www.sigmaaldrich.com) 14033 FT-Raman spectra S. T. Japan Europe GmbH (http://www.stjapan-europe.de) 8.")
19 Overview Data Acquisition and storage Acquisition Storage & organization (spectral libraries) Pre-processing of Raman spectra Spike removal Smoothing/denoising Background Normalization Spectral and intensity (re-)calibration Chemometry methods for Raman spectroscopy Multivariate calibration algorithms (MLR, PCA, PCR) Classification methods Cluster analysis
 Classification methods")
20 Pre-processing of Raman spectra Why? Scope: reduce or eliminate irrelevant, random and systematic variations in the data e.g. - signal intensity variations linked to laser intensity - low SNR - high background (fluorescence) - spikes 20

21 Spike removal Spikes: - single events (mostly caused by cosmic rays) hitting the detector - are always positive peaks of narrow bandwidth - random position on CCD and random in time Spike removal: - multiple accumulations (eliminates the spike through comparison, robust summation etc.) - mathematical - missing point polynomial filter - robust smoothing filter - moving window filter - wavelet transform methods - reduction of spike events by special design of the instrument (Zhao, 2003) Assumptions: - spike band width much smaller than Raman band width - Raman maps de-spiking: spatially adjacent spectra are similar 21
22 Smoothing Scope: Reduce the noise Improvement of SNR Noise is random and it changes with a higher frequency than the Raman signals Methods: Average Moving Average Moving Median Moving Polynomial (Savitzgy-Golay) Fourier Filter Works on intervals of n points 22
23 Smoothing Average - reduces the data points - information is lost Raman-Intensität n = 9 Original data New data Wellenzahl / cm -1 Raman-Intensität n = 9 Original data New data Wellenzahl / cm -1 Moving Average - data points number remains - information loss increases with increasing moving window size - end effects 23
24 Smoothing Messwerte Measured values angepasstes Polynomial fit Polynom Messwert New value Moving Polynomial (Savitzgy-Golay): Polynomial of small order is fitted through data points Variable 24
25 Smoothing Window of 13 points used with different smoothing algorithms Original Average Value Raman-Intensity Moving Average Moving Median If band shape is important then use Savitzgy-Golay smoothing - it preserves the band shape better than all other methods Savitzgy-Golay Wavenumber / cm -1 25
26 Smoothing Original Different smoothing window sizes for Savitzgy-Golay (Polynomial) 5 Pt Raman-Intensity 13 Pt Width of Raman bands increases with smoothing window size 25 Pt Wavenumber / cm -1 26
27 Smoothing Spectrum is Fourier-transformed Transformed spectrum is multiplied with a filtering function (reduce or eliminate the influence of high frequency terms in FT, e.g. Boxcar Variable Variable Another FT (back transformation) Eliminating too many frequencies will lead to looses of spectral information enlargement of band widths Variable Variable Images: K. R. Beebe, R. J. Pell, and M. B. Seasholtz, Chemometrics: A Practical Guide (John Wiley & Sons, New York, 1998). 27
28 a) Chose appropriate excitation wavelength: near infrared or UV laser lines Near IR UV 28
29 b) For low-wavenumber modes look at anti-stokes side since fluorescence starts in most cases only in the Stokes region c) Use nonlinear technique: coherent anti-stokes Raman spectroscopy (CARS) d) Fluorescence quenching by means of surface enhanced Raman scattering (SERS) e) Bleaching f) Rejection of fluorescence by means of Shifted Excitation Raman Difference Spectroscopy (SERDS) (equivalent with recording a spectrum and shifting the same spectrum digitally with computer) (see e.g. P.A. Mosier-Boss et al., Appl. Spectrosc. 49, 630 (1995) 29
30 Background Background sources: Fluorescence and other laser induced emissions (sample+instrument optics) Environmental light sources Instrument specific background (e.g. dark current) Methods of background correction: - Polynomial r = ~ r + α + β x + γx 2 + Offset correction (Subtract a constant, α) Subtract a line α + βx Approximate a polynomial through basis points... α + βx + γx Derivate r' = ~ r ' β + γx +... FFT with high pass filter Wavelet transformation techniques Free form baseline 30
31 Background baseline support points Correct Baseline Wrong baselines: Left-over background Overfitting (negative values) A baseline should not cut into Raman band signal strength 31
32 Background Derivate Advantages: Baseline support points are not needed Spectrum: Methods: Moving simple difference: r ' = r = ( r2 r1, r3 r2, r4 r3,...) ( r1, r2, r3, r4,...) Moving average difference: window size, average values r e.g. window size 3: ' = r + r3 3 Savitzgy-Golay: + r + r2 + r 3 ( Polynomial fitted in moving window New value is the polynomial derivate on that point r,...) Messwert New value: Polynomial derivate at this point Messwerte Measured values angepasstes Polynomial fit Polynom Variable 32
33 Background Derivate Raman-Intensität / arb. u Original Simple difference Moving average difference Savitzgy-Golay 1. Derivate Simple Difference: SNR decrease Moving average difference: smooth Bands are shifted Savitzgy-Golay: smooth Band shape better preserved Wellenzahl / cm -1 Raman-Intensität / arb. u Original Simple difference Moving average difference Savitzgy-Golay Wellenzahl / cm Derivate 33
34 Normalization Eliminate systematic differences among measurements Raman spectra show intensity differences because of e.g.: Changing laser power Differences in focusing depth Sample volume differences For measuring concentrations with Raman based on calibration curves do not normalize your spectra on bands dependent on concentration! 2 Possible normalization methods: Vector normalization and Min-/Max-Normalization Perform baseline correction before normalization 34
35 Normalization Raw data 0.15 Raman-Intensity Nomalization without baseline correction Wavenumber / cm Nomalization with baseline correction 0.10 Raman-Intensität / arb. u Raman-Intensität / arb. u Wellenzahl / cm Wellenzahl / cm -1 35
36 Normalization Min/Max method Original data Normalized data Raman-Intensität Wellenzahl / cm Wellenzahl / cm -1 I norm = I I I max min Raman-Intensität Wellenzahl / cm Wellenzahl / cm -1 36
37 Vector Normalization Calculates the average intensity value for all (chosen) wavenumber: a m = k a ( k k ) Intensities will be centered: Centered intensities will be divided by the length of the spectrum (as vector) The new spectrum vector will have a length of 1. a'( k) a ( k) = = a( k) k a m a ( k) a 2 ( ( k)) ( ( k) ) a = 1 k 2 37
38 Vector Normalization Baseline correction Raman-Intensity Centering Vector normalization Wavenumber / cm -1 Raman-Intensität / arb. u Wellenzahl / cm -1 38
39 Original data 7000 Raman-Intensität Min-/Max-Normalization Wellenzahl / cm Vector normalization Raman-Intensität Raman-Intensität Wellenzahl / cm Wellenzahl / cm -1 39
40 Higher laser power leads to better SNR as longer integration time. But: photo degradation of the sample Raman-Intensity s, Accumulation 1, OD 2 20s, Accumulation 1, OD 0,6 7s, Accumulation 1, OD 0 IR I Laser Wavenumber / cm -1 40
41 Improvement of SNR through multiple accumulations s, Accumulation 30 Raman-Intensity s, Accumulation Wavenumber / cm -1 41
42 Spectral and Intensity (re-)calibration Spectral Calibration Atomic emission lines (Ne, Hg, Ar, Kr lamps, plasma lines of the gas lasers) Shift calibration standards (indene, polystiren, paracetamol, naphtalene etc.) Intensity Calibration Intensity calibrated lamps NIST fluorescence standards for Raman 42
43 Spectral and Intensity (re-)calibration Instrument variation induced in Raman data can be reduced but very hard to completely eliminate => Spectrometer identification by analyzing the Raman spectra 43
44 Overview Data Acquisition and storage Acquisition Storage & organization (spectral libraries) Pre-processing of Raman spectra Spike removal Smoothing/denoising Background Normalization Spectral and intensity (re-)calibration Chemometry methods for Raman spectroscopy Multivariate calibration algorithms (MLR, PCA, PCR) Classification methods Cluster analysis
45 Chemometrics K. R. Beebe, R. J. Pell, and M. B. Seasholtz, Chemometrics: A Practical Guide (John Wiley & Sons, New York, 1998). H. Martens and T. Naes, Multivariate Calibration (John Wiley & Sons, Chichester, 1993). R. Henrion and G. Henrion, Multivariate Datenanalyse (Springer Verlag, Berlin, 1994). J. Gasteiger and T. Engel, (Eds.) Chemoinformatics, (Wiley-VCH, Weinheim, 2003). 45
46 1972 Svante Wold und Bruce R. Kowalski establish the new term Chemometry 1974 International Chemometrics Society Definition: the chemical discipline that uses mathematical and statistical methods (a)to design or select optimal measurement procedures and experiments, and (b)to provide maximum chemical information by analyzing chemical data. (Mathias Otto 'Chemometrics Statistics and Computer Application in Analytical Chemistry. ) 46
47 Why use chemometrics? It all comes together in the brain whether we like it or not, our senses and mind are part of the research process. This allows flexibility and creativity, but calls for checks against wishful thinking. H. Martens, M. Martens,
48 Chemometrics The task of sorting objects migt seem sometimes trivial Sort on shape: Color: Shape and color: 48
49 Chemometrics L. acidophilus DSM 9126 Glucose Titandioxid For very different spectra the task is easy Raman-Intensity DSM 423 S. cohnii DSM 6669 S. cohnii DSM 6718 DSM 426 S. cohnii DSM 6719 S. cohnii DSM Wavenumber / cm -1 For larger data set and more resembling data? Raman - intensity Intensität DSM 429 DSM 498 DSM 499 DSM 501 DSM 613 DSM 1058 DSM 2769 Raman - Intensität intensity S. warneri DSM S. epidermidis RP 62A S. epidermidis DSM 1798 S. epidermidis DSM 3269 S. epidermidis DSM 3270 DSM Wellenzahl Wavenumber / cm -1 / cm -1 S. epidermidis DSM Wavenumber Wellenzahl / cm -1 / cm -1 49
50 Chemometric methods Supervised methods (require a set of well characterized samples calibration model) Multiple Linear Regression (MLR) Partial Least Square Regression (PLS) Linear Discriminant Analysis (LDA) Unsupervised methods (do not require a priori knowledge on the samples) Principal Component Analysis(PCA) Cluster Analysis (CA) Factor Analysis Another classification Factor Methods (Extracting information) Classification Methods (Modeling group differences) Cluster Methods (Partitioning a dataset) 50
51 Chemometric methods Multivariate calibration Algorithms - needs calibration model (validation) Multiple Linear Regression (MLR) simple regression extended to multiple var. (deconvolutions) Principal Component Analysis(PCA) unsupervized (reduce dimensionality to PC) Principal Component Regression (PCR) linear regression using PCA Partial Least Squares Regression (PLS) like PCR with other projection rules Classification Methods Linear Discriminant Analysis (LDA) reduce dimensionality by preserving class discrimination Gaussian Mixture Modeling (GMM) weighted sums of gaussian distributions Artificial Neuronal Network (ANN) layered processing elements (neurons) Support Vector Machines (SVM) try to find the borders between two classes Cluster Analysis widely used for Raman image analyses (hyperspectral data in general) Hierarchical Cluster Analysis (HCA) cluster based on distances among spectra Fuzzy c means Cluster Analysis (c-means CA) like HCA & k but with membership function Fuzzy k means Cluster Analysis (k-means CA) min D inside clusters and max between them Gaussian Mixture Modeling (GMM) + nonlinear versions of each (SVM with kernel-trick ) 51
52 Yes Can the sample be recognized as member of a class? No non-controlled pattern recognition Are the classes discret? Yes controlled pattern recognition Hierarchic Cluster-Analysis (HCA) Search for eventual relations with in the database saved spectra No HCA and PCA for initial analysis Principal Component Analysis (PCA) Multivariate Calibration Does exists enough representative data in the DB? >10 Yes SIMCA No SVM Beebe, 1998 K-Nearest Neighbors (KNN) 52
")
")
53 Chemometric tools R (free open source statistics software) Unscrambler (PCA, PLS, MLR) 53
54 Example PCA Raman spectra (3372 bis 298 cm -1 ) How many components and which concentrations 54
55 Example PCA A qualitative inspection, shows 3 components in the spectrum Blue: Acetonitrile Red: Acetone Green: Ethanol 55
56 Initial tries - PCA PC1 PC2 PC8 Die Factor loadings shows which spectral regions are important for a given PC: PC1: positiv: Acetonitrile negativ: Acetone PC2: positiv: Acetone negativ: Ethanol PC8: large noise component for model not important 56
57 real concentration PCR PLS1 PLS2 Un A = 33.0 E 31.9 (4.3) 33.9 (3.6) 31.9 (4.3) Un B = 11.0 E 12.1 (5.3) 12.2 (3.6) 12.1 (5.3) Un C = 40.0 E 33.5 (34.9) 30.5 (36.1) 32.9 (34.8) Un D = 33.0 E 32.1 (2.6) 32.2 (2.2) 32.1 (2.6) Un E = 11.0 E 14.2 (5.1) 15.1 (3.9) 14.2 (5.1) Un F = 40.0 E 34.2 (45.4) 28.5 (47.8) 33.3 (45.1) 57
58 real concentration PCR PLS1 PLS2 Un A = 33.0 E 30.1 (3.5) 29.9 (2.8) 29.2 (3.3) Un B = 11.0 E 11.8 (3.7) 11.8 (2.6) 11.8 (2.8) Un C = 40.0 E 36.5 (3.7) 36.5 (2.7) 35.4 (3.8) Un D = 33.0 E 30.4 (3.8) 30.2 (2.4) 30.5 (2.7) Un E = 11.0 E 11.5 (3.1) 11.5 (2.5) 11.8 (2.7) Un F = 40.0 E 37.7 (4.7) 37.7 (3.1) 37.9 (3.2) 58
Chemometric Analysis for Spectroscopy
 Chemometric Analysis for Spectroscopy Bridging the Gap between the State and Measurement of a Chemical System by Dongsheng Bu, PhD, Principal Scientist, CAMO Software Inc. Chemometrics is the use of mathematical
Raman spectroscopy Lecture
 Raman spectroscopy Lecture Licentiate course in measurement science and technology Spring 2008 10.04.2008 Antti Kivioja Contents - Introduction - What is Raman spectroscopy? - The theory of Raman spectroscopy
Multivariate Chemometric and Statistic Software Role in Process Analytical Technology
 Multivariate Chemometric and Statistic Software Role in Process Analytical Technology Camo Software Inc For IFPAC 2007 By Dongsheng Bu and Andrew Chu PAT Definition A system Understand the Process Design
A Partially Supervised Metric Multidimensional Scaling Algorithm for Textual Data Visualization
 A Partially Supervised Metric Multidimensional Scaling Algorithm for Textual Data Visualization Ángela Blanco Universidad Pontificia de Salamanca [email protected] Spain Manuel Martín-Merino Universidad
Specifying Plasma Deposited Hard Coated Optical Thin Film Filters. Alluxa Engineering Staff
 Specifying Plasma Deposited Hard Coated Optical Thin Film Filters. Alluxa Engineering Staff December 2012 Specifying Advanced Plasma Deposited Hard Coated Optical Bandpass and Dichroic Filters. Introduction
Spectroscopy Using the Tracker Video Analysis Program
 Spectroscopy Using the Tracker Video Analysis Program Douglas Brown Cabrillo College Aptos CA 95003 [email protected] Spectroscopy has important applications in many fields and deserves more attention
Multivariate Tools for Modern Pharmaceutical Control FDA Perspective
 Multivariate Tools for Modern Pharmaceutical Control FDA Perspective IFPAC Annual Meeting 22 January 2013 Christine M. V. Moore, Ph.D. Acting Director ONDQA/CDER/FDA Outline Introduction to Multivariate
Fundamentals of modern UV-visible spectroscopy. Presentation Materials
 Fundamentals of modern UV-visible spectroscopy Presentation Materials The Electromagnetic Spectrum E = hν ν = c / λ 1 Electronic Transitions in Formaldehyde 2 Electronic Transitions and Spectra of Atoms
In this column installment, we present results of tablet. Raman Microscopy for Detecting Counterfeit Drugs A Study of the Tablets Versus the Packaging
 Electronically reprinted from June 214 Molecular Spectroscopy Workbench Raman Microscopy for Detecting Counterfeit Drugs A Study of the Tablets Versus the Packaging With the increasing proliferation of
Nano-Spectroscopy. Solutions AFM-Raman, TERS, NSOM Chemical imaging at the nanoscale
 Nano-Spectroscopy Solutions AFM-Raman, TERS, NSOM Chemical imaging at the nanoscale Since its introduction in the early 80 s, Scanning Probe Microscopy (SPM) has quickly made nanoscale imaging an affordable
NIRCal Software data sheet
 NIRCal Software data sheet NIRCal is an optional software package for NIRFlex N-500 and NIRMaster, that allows the development of qualitative and quantitative calibrations. It offers numerous chemometric
Application of Automated Data Collection to Surface-Enhanced Raman Scattering (SERS)
") Application Note: 52020 Application of Automated Data Collection to Surface-Enhanced Raman Scattering (SERS) Timothy O. Deschaines, Ph.D., Thermo Fisher Scientific, Madison, WI, USA Key Words Array Automation
Application Note: 52020 Application of Automated Data Collection to Surface-Enhanced Raman Scattering (SERS) Timothy O. Deschaines, Ph.D., Thermo Fisher Scientific, Madison, WI, USA Key Words Array Automation
Raman Spectroscopy Basics
 Raman Spectroscopy Basics Introduction Raman spectroscopy is a spectroscopic technique based on inelastic scattering of monochromatic light, usually from a laser source. Inelastic scattering means that
An Introduction to Data Mining. Big Data World. Related Fields and Disciplines. What is Data Mining? 2/12/2015
 An Introduction to Data Mining for Wind Power Management Spring 2015 Big Data World Every minute: Google receives over 4 million search queries Facebook users share almost 2.5 million pieces of content
Introduction to Fourier Transform Infrared Spectrometry
 Introduction to Fourier Transform Infrared Spectrometry What is FT-IR? I N T R O D U C T I O N FT-IR stands for Fourier Transform InfraRed, the preferred method of infrared spectroscopy. In infrared spectroscopy,
Software Approaches for Structure Information Acquisition and Training of Chemistry Students
 Software Approaches for Structure Information Acquisition and Training of Chemistry Students Nikolay T. Kochev, Plamen N. Penchev, Atanas T. Terziyski, George N. Andreev Department of Analytical Chemistry,
The accurate calibration of all detectors is crucial for the subsequent data
 Chapter 4 Calibration The accurate calibration of all detectors is crucial for the subsequent data analysis. The stability of the gain and offset for energy and time calibration of all detectors involved
FTIR Instrumentation
 FTIR Instrumentation Adopted from the FTIR lab instruction by H.-N. Hsieh, New Jersey Institute of Technology: http://www-ec.njit.edu/~hsieh/ene669/ftir.html 1. IR Instrumentation Two types of instrumentation
SSO Transmission Grating Spectrograph (TGS) User s Guide
 User s Guide") SSO Transmission Grating Spectrograph (TGS) User s Guide The Rigel TGS User s Guide available online explains how a transmission grating spectrograph (TGS) works and how efficient they are. Please refer
SSO Transmission Grating Spectrograph (TGS) User s Guide The Rigel TGS User s Guide available online explains how a transmission grating spectrograph (TGS) works and how efficient they are. Please refer
Medical Information Management & Mining. You Chen Jan,15, 2013 [email protected]
 Medical Information Management & Mining You Chen Jan,15, 2013 [email protected] 1 Trees Building Materials Trees cannot be used to build a house directly. How can we transform trees to building materials?
Uses of Derivative Spectroscopy
 Uses of Derivative Spectroscopy Application Note UV-Visible Spectroscopy Anthony J. Owen Derivative spectroscopy uses first or higher derivatives of absorbance with respect to wavelength for qualitative
O2PLS for improved analysis and visualization of complex data
 O2PLS for improved analysis and visualization of complex data Lennart Eriksson 1, Svante Wold 2 and Johan Trygg 3 1 Umetrics AB, POB 7960, SE-907 19 Umeå, Sweden, [email protected] 2 Umetrics
Alignment and Preprocessing for Data Analysis
 Alignment and Preprocessing for Data Analysis Preprocessing tools for chromatography Basics of alignment GC FID (D) data and issues PCA F Ratios GC MS (D) data and issues PCA F Ratios PARAFAC Piecewise
DETECTION OF COATINGS ON PAPER USING INFRA RED SPECTROSCOPY
 DETECTION OF COATINGS ON PAPER USING INFRA RED SPECTROSCOPY Eduard Gilli 1,2 and Robert Schennach 1, 2 1 Graz University of Technology, 8010 Graz, Austria 2 CD-Laboratory for Surface Chemical and Physical
Raman Spectroscopy. 1. Introduction. 2. More on Raman Scattering. " scattered. " incident
 February 15, 2006 Advanced Physics Laboratory Raman Spectroscopy 1. Introduction When light is scattered from a molecule or crystal, most photons are elastically scattered. The scattered photons have the
Experiment #5: Qualitative Absorption Spectroscopy
 Experiment #5: Qualitative Absorption Spectroscopy One of the most important areas in the field of analytical chemistry is that of spectroscopy. In general terms, spectroscopy deals with the interactions
Introduction to Pattern Recognition
 Introduction to Pattern Recognition Selim Aksoy Department of Computer Engineering Bilkent University [email protected] CS 551, Spring 2009 CS 551, Spring 2009 c 2009, Selim Aksoy (Bilkent University)
TIETS34 Seminar: Data Mining on Biometric identification
 TIETS34 Seminar: Data Mining on Biometric identification Youming Zhang Computer Science, School of Information Sciences, 33014 University of Tampere, Finland [email protected] Course Description Content
Introduction to CCDs and CCD Data Calibration
 Introduction to CCDs and CCD Data Calibration Dr. William Welsh San Diego State University CCD: charge coupled devices integrated circuit silicon chips that can record optical (and X-ray) light pixel =
LabRAM HR. Research Raman Made Easy! Raman Spectroscopy Systems. Spectroscopy Suite. Powered by:
 LabRAM HR Research Raman Made Easy! Raman Spectroscopy Systems Powered by: Spectroscopy Suite Cutting-Edge Applications with the LabRAM HR Deeply involved in Raman spectroscopy for decades, HORIBA Scientific
Environmental Remote Sensing GEOG 2021
 Environmental Remote Sensing GEOG 2021 Lecture 4 Image classification 2 Purpose categorising data data abstraction / simplification data interpretation mapping for land cover mapping use land cover class
Integrated Data Mining Strategy for Effective Metabolomic Data Analysis
 The First International Symposium on Optimization and Systems Biology (OSB 07) Beijing, China, August 8 10, 2007 Copyright 2007 ORSC & APORC pp. 45 51 Integrated Data Mining Strategy for Effective Metabolomic
CROP CLASSIFICATION WITH HYPERSPECTRAL DATA OF THE HYMAP SENSOR USING DIFFERENT FEATURE EXTRACTION TECHNIQUES
 Proceedings of the 2 nd Workshop of the EARSeL SIG on Land Use and Land Cover CROP CLASSIFICATION WITH HYPERSPECTRAL DATA OF THE HYMAP SENSOR USING DIFFERENT FEATURE EXTRACTION TECHNIQUES Sebastian Mader
Maschinelles Lernen mit MATLAB
 Maschinelles Lernen mit MATLAB Jérémy Huard Applikationsingenieur The MathWorks GmbH 2015 The MathWorks, Inc. 1 Machine Learning is Everywhere Image Recognition Speech Recognition Stock Prediction Medical
KATE GLEASON COLLEGE OF ENGINEERING. John D. Hromi Center for Quality and Applied Statistics
 ROCHESTER INSTITUTE OF TECHNOLOGY COURSE OUTLINE FORM KATE GLEASON COLLEGE OF ENGINEERING John D. Hromi Center for Quality and Applied Statistics NEW (or REVISED) COURSE (KGCOE- CQAS- 747- Principles of
Modelling, Extraction and Description of Intrinsic Cues of High Resolution Satellite Images: Independent Component Analysis based approaches
 Modelling, Extraction and Description of Intrinsic Cues of High Resolution Satellite Images: Independent Component Analysis based approaches PhD Thesis by Payam Birjandi Director: Prof. Mihai Datcu Problematic
Tutorial 4.6 Gamma Spectrum Analysis
 Tutorial 4.6 Gamma Spectrum Analysis Slide 1. Gamma Spectrum Analysis In this module, we will apply the concepts that were discussed in Tutorial 4.1, Interactions of Radiation with Matter. Slide 2. Learning
Social Media Mining. Data Mining Essentials
 Introduction Data production rate has been increased dramatically (Big Data) and we are able store much more data than before E.g., purchase data, social media data, mobile phone data Businesses and customers
Comparison of Non-linear Dimensionality Reduction Techniques for Classification with Gene Expression Microarray Data
 CMPE 59H Comparison of Non-linear Dimensionality Reduction Techniques for Classification with Gene Expression Microarray Data Term Project Report Fatma Güney, Kübra Kalkan 1/15/2013 Keywords: Non-linear
The Measurement of Sensitivity in Fluorescence Spectroscopy
 The Measurement of Sensitivity in Fluorescence Spectroscopy Among instrumental techniques, fluorescence spectroscopy is recognized as one of the more sensitive. In fluorescence, the intensity of the emission
Measuring the Doppler Shift of a Kepler Star with a Planet
 Measuring the Doppler Shift of a Kepler Star with a Planet 1 Introduction The Doppler shift of a spectrum reveals the line of sight component of the velocity vector ( radial velocity ) of the object. Doppler
EFFICIENT DATA PRE-PROCESSING FOR DATA MINING
 EFFICIENT DATA PRE-PROCESSING FOR DATA MINING USING NEURAL NETWORKS JothiKumar.R 1, Sivabalan.R.V 2 1 Research scholar, Noorul Islam University, Nagercoil, India Assistant Professor, Adhiparasakthi College
QUANTITATIVE INFRARED SPECTROSCOPY. Willard et. al. Instrumental Methods of Analysis, 7th edition, Wadsworth Publishing Co., Belmont, CA 1988, Ch 11.
 QUANTITATIVE INFRARED SPECTROSCOPY Objective: The objectives of this experiment are: (1) to learn proper sample handling procedures for acquiring infrared spectra. (2) to determine the percentage composition
Chemotaxonomische Identifikation einzelner Bakterienzellen mit Hilfe der Mikro-Raman- Spektroskopie Online-Monitoring von Bioaerosolen (OMIB)
") 1. Jenaer Workshop Spektralsensorik 0. September 00 Chemotaxonomische Identifikation einzelner Bakterienzellen mit Hilfe der Mikro-Raman- Spektroskopie Online-Monitoring von Bioaerosolen (OMIB) P. Rösch
1. Jenaer Workshop Spektralsensorik 0. September 00 Chemotaxonomische Identifikation einzelner Bakterienzellen mit Hilfe der Mikro-Raman- Spektroskopie Online-Monitoring von Bioaerosolen (OMIB) P. Rösch
product overview pco.edge family the most versatile scmos camera portfolio on the market pioneer in scmos image sensor technology
 product overview family the most versatile scmos camera portfolio on the market pioneer in scmos image sensor technology scmos knowledge base scmos General Information PCO scmos cameras are a breakthrough
5.33 Lecture Notes: Introduction to Spectroscopy
 5.33 Lecture Notes: ntroduction to Spectroscopy What is spectroscopy? Studying the properties of matter through its interaction with different frequency components of the electromagnetic spectrum. Latin:
Zeiss 780 Training Notes
 Zeiss 780 Training Notes 780 Start Up Sequence Do you need the argon laser, 458,488,514nm lines? No Turn on the Systems PC Switch Turn on Main Power Switch Yes Turn on the laser main power switch and turn
Analyze IQ Spectra Manager Version 1.2
 Analyze IQ Spectra Manager Version 1.2 User Manual Document Version: 1.2-2010-02-15 Copyright Analyze IQ Limited, 2008-2010. All Rights Reserved. Table of Contents 1 Introduction... 3 2 Installation...
Neural Network Add-in
 Neural Network Add-in Version 1.5 Software User s Guide Contents Overview... 2 Getting Started... 2 Working with Datasets... 2 Open a Dataset... 3 Save a Dataset... 3 Data Pre-processing... 3 Lagging...
MUSICAL INSTRUMENT FAMILY CLASSIFICATION
 MUSICAL INSTRUMENT FAMILY CLASSIFICATION Ricardo A. Garcia Media Lab, Massachusetts Institute of Technology 0 Ames Street Room E5-40, Cambridge, MA 039 USA PH: 67-53-0 FAX: 67-58-664 e-mail: rago @ media.
Spectroscopy. Biogeochemical Methods OCN 633. Rebecca Briggs
 Spectroscopy Biogeochemical Methods OCN 633 Rebecca Briggs Definitions of Spectrometry Defined by the method used to prepare the sample 1. Optical spectrometry Elements are converted to gaseous atoms or
Analecta Vol. 8, No. 2 ISSN 2064-7964
 EXPERIMENTAL APPLICATIONS OF ARTIFICIAL NEURAL NETWORKS IN ENGINEERING PROCESSING SYSTEM S. Dadvandipour Institute of Information Engineering, University of Miskolc, Egyetemváros, 3515, Miskolc, Hungary,
Recording the Instrument Response Function of a Multiphoton FLIM System
 Recording the Instrument Response Function of a Multiphoton FLIM System Abstract. FLIM data analysis in presence of SHG signals or extremely fast decay components requires the correct instrument response
Data Mining. Cluster Analysis: Advanced Concepts and Algorithms
 Data Mining Cluster Analysis: Advanced Concepts and Algorithms Tan,Steinbach, Kumar Introduction to Data Mining 4/18/2004 1 More Clustering Methods Prototype-based clustering Density-based clustering Graph-based
A PHOTOGRAMMETRIC APPRAOCH FOR AUTOMATIC TRAFFIC ASSESSMENT USING CONVENTIONAL CCTV CAMERA
 A PHOTOGRAMMETRIC APPRAOCH FOR AUTOMATIC TRAFFIC ASSESSMENT USING CONVENTIONAL CCTV CAMERA N. Zarrinpanjeh a, F. Dadrassjavan b, H. Fattahi c * a Islamic Azad University of Qazvin - [email protected]
Hydrogen Bonds in Water-Methanol Mixture
 Bulg. J. Phys. 34 (2007) 103 107 Hydrogen Bonds in Water-Methanol Mixture G.M. Georgiev, K. Vasilev, K. Gyamchev Faculty of Physics, University of Sofia 5J.Bourchier Blvd., 1164 Sofia, Bulgaria Received
Component Ordering in Independent Component Analysis Based on Data Power
 Component Ordering in Independent Component Analysis Based on Data Power Anne Hendrikse Raymond Veldhuis University of Twente University of Twente Fac. EEMCS, Signals and Systems Group Fac. EEMCS, Signals
Data Mining and Visualization
 Data Mining and Visualization Jeremy Walton NAG Ltd, Oxford Overview Data mining components Functionality Example application Quality control Visualization Use of 3D Example application Market research
ANALYZER BASICS WHAT IS AN FFT SPECTRUM ANALYZER? 2-1
 WHAT IS AN FFT SPECTRUM ANALYZER? ANALYZER BASICS The SR760 FFT Spectrum Analyzer takes a time varying input signal, like you would see on an oscilloscope trace, and computes its frequency spectrum. Fourier's
BIOINF 585 Fall 2015 Machine Learning for Systems Biology & Clinical Informatics http://www.ccmb.med.umich.edu/node/1376
 Course Director: Dr. Kayvan Najarian (DCM&B, [email protected]) Lectures: Labs: Mondays and Wednesdays 9:00 AM -10:30 AM Rm. 2065 Palmer Commons Bldg. Wednesdays 10:30 AM 11:30 AM (alternate weeks) Rm.
Functional Data Analysis of MALDI TOF Protein Spectra
 Functional Data Analysis of MALDI TOF Protein Spectra Dean Billheimer [email protected]. Department of Biostatistics Vanderbilt University Vanderbilt Ingram Cancer Center FDA for MALDI TOF
Knowledge Discovery from patents using KMX Text Analytics
 Knowledge Discovery from patents using KMX Text Analytics Dr. Anton Heijs [email protected] Treparel Abstract In this white paper we discuss how the KMX technology of Treparel can help searchers
Group Theory and Chemistry
 Group Theory and Chemistry Outline: Raman and infra-red spectroscopy Symmetry operations Point Groups and Schoenflies symbols Function space and matrix representation Reducible and irreducible representation
Realization of a UV fisheye hyperspectral camera
 Realization of a UV fisheye hyperspectral camera Valentina Caricato, Andrea Egidi, Marco Pisani and Massimo Zucco, INRIM Outline Purpose of the instrument Required specs Hyperspectral technique Optical
Austin Peay State University Department of Chemistry Chem 1111. The Use of the Spectrophotometer and Beer's Law
 Purpose To become familiar with using a spectrophotometer and gain an understanding of Beer s law and it s relationship to solution concentration. Introduction Scientists use many methods to determine
Data Mining mit der JMSL Numerical Library for Java Applications
 Data Mining mit der JMSL Numerical Library for Java Applications Stefan Sineux 8. Java Forum Stuttgart 07.07.2005 Agenda Visual Numerics JMSL TM Numerical Library Neuronale Netze (Hintergrund) Demos Neuronale
Characterizing Digital Cameras with the Photon Transfer Curve
 Characterizing Digital Cameras with the Photon Transfer Curve By: David Gardner Summit Imaging (All rights reserved) Introduction Purchasing a camera for high performance imaging applications is frequently
X-RAY FLUORESCENCE SPECTROSCOPY IN PLASTICS RECYCLING
 X-RAY FLUORESCENCE SPECTROSCOPY IN PLASTICS RECYCLING Brian L. Riise and Michael B. Biddle MBA Polymers, Inc., Richmond, CA, USA Michael M. Fisher American Plastics Council, Arlington, VA, USA X-Ray Fluorescence
3D Raman Imaging Nearfield-Raman TERS. Solutions for High-Resolution Confocal Raman Microscopy. www.witec.de
 3D Raman Imaging Nearfield-Raman TERS Solutions for High-Resolution Confocal Raman Microscopy www.witec.de 01 3D Confocal Raman Imaging Outstanding performance in speed, sensitivity, and resolution with
LabRAM HR Evolution. Research Raman Made Easy!
 LabRAM HR Evolution Research Raman Made Easy! Cutting-Edge Applications with the LabRAM HR LabRAM HR Deeply involved in Raman spectroscopy for decades, HORIBA Scientific has been providing an extensive
ENVI Classic Tutorial: Atmospherically Correcting Multispectral Data Using FLAASH 2
 ENVI Classic Tutorial: Atmospherically Correcting Multispectral Data Using FLAASH Atmospherically Correcting Multispectral Data Using FLAASH 2 Files Used in this Tutorial 2 Opening the Raw Landsat Image
Features of the formation of hydrogen bonds in solutions of polysaccharides during their use in various industrial processes. V.Mank a, O.
 Features of the formation of hydrogen bonds in solutions of polysaccharides during their use in various industrial processes. V.Mank a, O. Melnyk b a National University of life and environmental sciences
We bring quality to light. MAS 40 Mini-Array Spectrometer. light measurement
 MAS 40 Mini-Array Spectrometer light measurement Features at a glance Cost-effective and robust CCD spectrometer technology Standard USB interface Compatible with all Instrument Systems measuring adapters
Partial Least Squares (PLS) Regression.
 Regression.") Partial Least Squares (PLS) Regression. Hervé Abdi 1 The University of Texas at Dallas Introduction Pls regression is a recent technique that generalizes and combines features from principal component
Partial Least Squares (PLS) Regression. Hervé Abdi 1 The University of Texas at Dallas Introduction Pls regression is a recent technique that generalizes and combines features from principal component
Knowledge Discovery and Data Mining. Structured vs. Non-Structured Data
 Knowledge Discovery and Data Mining Unit # 2 1 Structured vs. Non-Structured Data Most business databases contain structured data consisting of well-defined fields with numeric or alphanumeric values.
Extraction Heights for STIS Echelle Spectra
 Instrument Science Report STIS 98-09 Extraction Heights for STIS Echelle Spectra Claus Leitherer and Ralph Bohlin March 1998 ABSTRACT The optimum extraction height (h) for STIS echelle spectra of 7 pixels
Raman Scattering Theory David W. Hahn Department of Mechanical and Aerospace Engineering University of Florida ([email protected])
") Introduction Raman Scattering Theory David W. Hahn Department of Mechanical and Aerospace Engineering University of Florida ([email protected]) The scattering of light may be thought of as the redirection
Introduction Raman Scattering Theory David W. Hahn Department of Mechanical and Aerospace Engineering University of Florida ([email protected]) The scattering of light may be thought of as the redirection
Edited by. C'unter. and David S. Moore. Gauglitz. Handbook of Spectroscopy. Second, Enlarged Edition. Volume 4. WlLEY-VCH. VerlagCmbH & Co.
 Edited by C'unter Gauglitz and David S. Moore Handbook of Spectroscopy Second, Enlarged Edition Volume 4 WlLEY-VCH VerlagCmbH & Co. KGaA IX Volume 4 Section XII Applications 6: Spectroscopy at Surfaces
Copyright 1999 2010 by Mark Brandt, Ph.D. 12
 Introduction to Absorbance Spectroscopy A single beam spectrophotometer is comprised of a light source, a monochromator, a sample holder, and a detector. An ideal instrument has a light source that emits
Data Exploration and Preprocessing. Data Mining and Text Mining (UIC 583 @ Politecnico di Milano)
") Data Exploration and Preprocessing Data Mining and Text Mining (UIC 583 @ Politecnico di Milano) References Jiawei Han and Micheline Kamber, "Data Mining: Concepts and Techniques", The Morgan Kaufmann
Data Exploration and Preprocessing Data Mining and Text Mining (UIC 583 @ Politecnico di Milano) References Jiawei Han and Micheline Kamber, "Data Mining: Concepts and Techniques", The Morgan Kaufmann
Preprocessing, Management, and Analysis of Mass Spectrometry Proteomics Data
 Preprocessing, Management, and Analysis of Mass Spectrometry Proteomics Data M. Cannataro, P. H. Guzzi, T. Mazza, and P. Veltri Università Magna Græcia di Catanzaro, Italy 1 Introduction Mass Spectrometry
Introduction to X-Ray Powder Diffraction Data Analysis
 Introduction to X-Ray Powder Diffraction Data Analysis Center for Materials Science and Engineering at MIT http://prism.mit.edu/xray An X-ray diffraction pattern is a plot of the intensity of X-rays scattered
USING SELF-ORGANIZING MAPS FOR INFORMATION VISUALIZATION AND KNOWLEDGE DISCOVERY IN COMPLEX GEOSPATIAL DATASETS
 USING SELF-ORGANIZING MAPS FOR INFORMATION VISUALIZATION AND KNOWLEDGE DISCOVERY IN COMPLEX GEOSPATIAL DATASETS Koua, E.L. International Institute for Geo-Information Science and Earth Observation (ITC).
The Scientific Data Mining Process
 Chapter 4 The Scientific Data Mining Process When I use a word, Humpty Dumpty said, in rather a scornful tone, it means just what I choose it to mean neither more nor less. Lewis Carroll [87, p. 214] In
Spectral Measurement Solutions for Industry and Research
 Spectral Measurement Solutions for Industry and Research Hamamatsu Photonics offers a comprehensive range of products for spectroscopic applications, covering the, Visible and Infrared regions for Industrial,
What is Data mining?
 STAT : DATA MIIG Javier Cabrera Fall Business Question Answer Business Question What is Data mining? Find Data Data Processing Extract Information Data Analysis Internal Databases Data Warehouses Internet
Advanced Research Raman System Raman Spectroscopy Systems
 T600 Advanced Research Raman System Raman Spectroscopy Systems T600 Advanced Research Raman System T600 Triple stage Raman Spectrometer: The only solution for unprecedented stability and performance! Robust
Optics and Spectroscopy at Surfaces and Interfaces
 Vladimir G. Bordo and Horst-Gunter Rubahn Optics and Spectroscopy at Surfaces and Interfaces WILEY- VCH WILEY-VCH Verlag GmbH & Co. KGaA Contents Preface IX 1 Introduction 1 2 Surfaces and Interfaces 5
Assessment. Presenter: Yupu Zhang, Guoliang Jin, Tuo Wang Computer Vision 2008 Fall
 Automatic Photo Quality Assessment Presenter: Yupu Zhang, Guoliang Jin, Tuo Wang Computer Vision 2008 Fall Estimating i the photorealism of images: Distinguishing i i paintings from photographs h Florin
h e l p s y o u C O N T R O L
 contamination analysis for compound semiconductors ANALYTICAL SERVICES B u r i e d d e f e c t s, E v a n s A n a l y t i c a l g r o u p h e l p s y o u C O N T R O L C O N T A M I N A T I O N Contamination
CS 2750 Machine Learning. Lecture 1. Machine Learning. http://www.cs.pitt.edu/~milos/courses/cs2750/ CS 2750 Machine Learning.
 Lecture Machine Learning Milos Hauskrecht [email protected] 539 Sennott Square, x5 http://www.cs.pitt.edu/~milos/courses/cs75/ Administration Instructor: Milos Hauskrecht [email protected] 539 Sennott
Spectrophotometry and the Beer-Lambert Law: An Important Analytical Technique in Chemistry
 Spectrophotometry and the Beer-Lambert Law: An Important Analytical Technique in Chemistry Jon H. Hardesty, PhD and Bassam Attili, PhD Collin College Department of Chemistry Introduction: In the last lab
Strategies for Developing Optimal Synchronous SIM-Scan Acquisition Methods AutoSIM/Scan Setup and Rapid SIM. Technical Overview.
 Strategies for Developing Optimal Synchronous SIM-Scan Acquisition Methods AutoSIM/Scan Setup and Rapid SIM Technical Overview Introduction The 5975A and B series mass selective detectors (MSDs) provide
Optical Metrology. Third Edition. Kjell J. Gasvik Spectra Vision AS, Trondheim, Norway JOHN WILEY & SONS, LTD
 2008 AGI-Information Management Consultants May be used for personal purporses only or by libraries associated to dandelon.com network. Optical Metrology Third Edition Kjell J. Gasvik Spectra Vision AS,
Data Preprocessing. Week 2
 Data Preprocessing Week 2 Topics Data Types Data Repositories Data Preprocessing Present homework assignment #1 Team Homework Assignment #2 Read pp. 227 240, pp. 250 250, and pp. 259 263 the text book.
An Introduction to the MTG-IRS Mission
 An Introduction to the MTG-IRS Mission Stefano Gigli, EUMETSAT IRS-NWC Workshop, Eumetsat HQ, 25-0713 Summary 1. Products and Performance 2. Design Overview 3. L1 Data Organisation 2 Part 1 1. Products
1 What is Chemometrics?
 1 What is Chemometrics? Learning objectives To define chemometrics To learn how to count with bits and how to perform arithmetic or logical operations in a computer To understand the principal terminology
Calculation of Minimum Distances. Minimum Distance to Means. Σi i = 1
 Minimum Distance to Means Similar to Parallelepiped classifier, but instead of bounding areas, the user supplies spectral class means in n-dimensional space and the algorithm calculates the distance between