Data Mining and Visualization
|
|
|
- Lee Murphy
- 8 years ago
- Views:
Transcription
1 Data Mining and Visualization Jeremy Walton NAG Ltd, Oxford

2 Overview Data mining components Functionality Example application Quality control Visualization Use of 3D Example application Market research Statistics and visualization in Excel What s the problem? 2

3 Overview Data mining components Functionality Example application Quality control Visualization Use of 3D Example application Market research Statistics and visualization in Excel What s the problem? 3

4 NAG Data Mining Components (DMC) Data Cleaning Data imputation adding missing values Outlier detection finding suspect data records Data Transformation Scaling Data before distance computation Principal Component Analysis reducing # of variables Cluster Analysis k-means analyst decides # of clusters in data Hierarchical stepwise agglomeration of data 4

5 DMC: Classification techniques Classification Trees Two types of decision tree: binary (Gini index) n-ary (entropy-based) Generalized Linear Models Fitting of Binomial distribution (for binary classification tasks) Poisson distribution (for count data) k-nearest Neighbours Predict values using k most similar records in a training dataset Set prior probabilities for data classes Also used for regression (see below) 5

6 DMC: Regression techniques Regression Trees Minimise sum of squares about mean robust estimate of the mean, or sample average Linear Regression Automatic selection of model variables Multi-Layer Perceptron Neural Networks Flexible non-linear models Free parameters in MLP optimised using conjugate gradients Nearest Neighbours (see above) Radial Basis Function Models function of distance from centre location to data records 6
 Radial Basis Function Models function of distance from centre location to")
7 DMC: other techniques Association rules Determine relationships between nominal data values Utility functions Random number generators Rank ordering Sorting Mean and sum of squares updates Two-way classification comparison Save and load models 7

8 Example application: Quality control Detection of changes in sample due to e.g. heating Use circular dichroism spectroscopy measures difference in absorbance by left & right polarized light Generates spectrum for each sample Intensity vs wavelength Some spectra look similar, others don t How to classify them? 8

9 Spectra display 9

10 Classification 36 spectra, 152 intensity values each Read into 36 x 152 matrix Passed to hierarchical cluster analysis routines Euclidean distances between data points Average link distances between clusters Output displayed as dendogram tree plot showing merging of clusters with distance Introduce a cut-off to define natural clusters 10

11
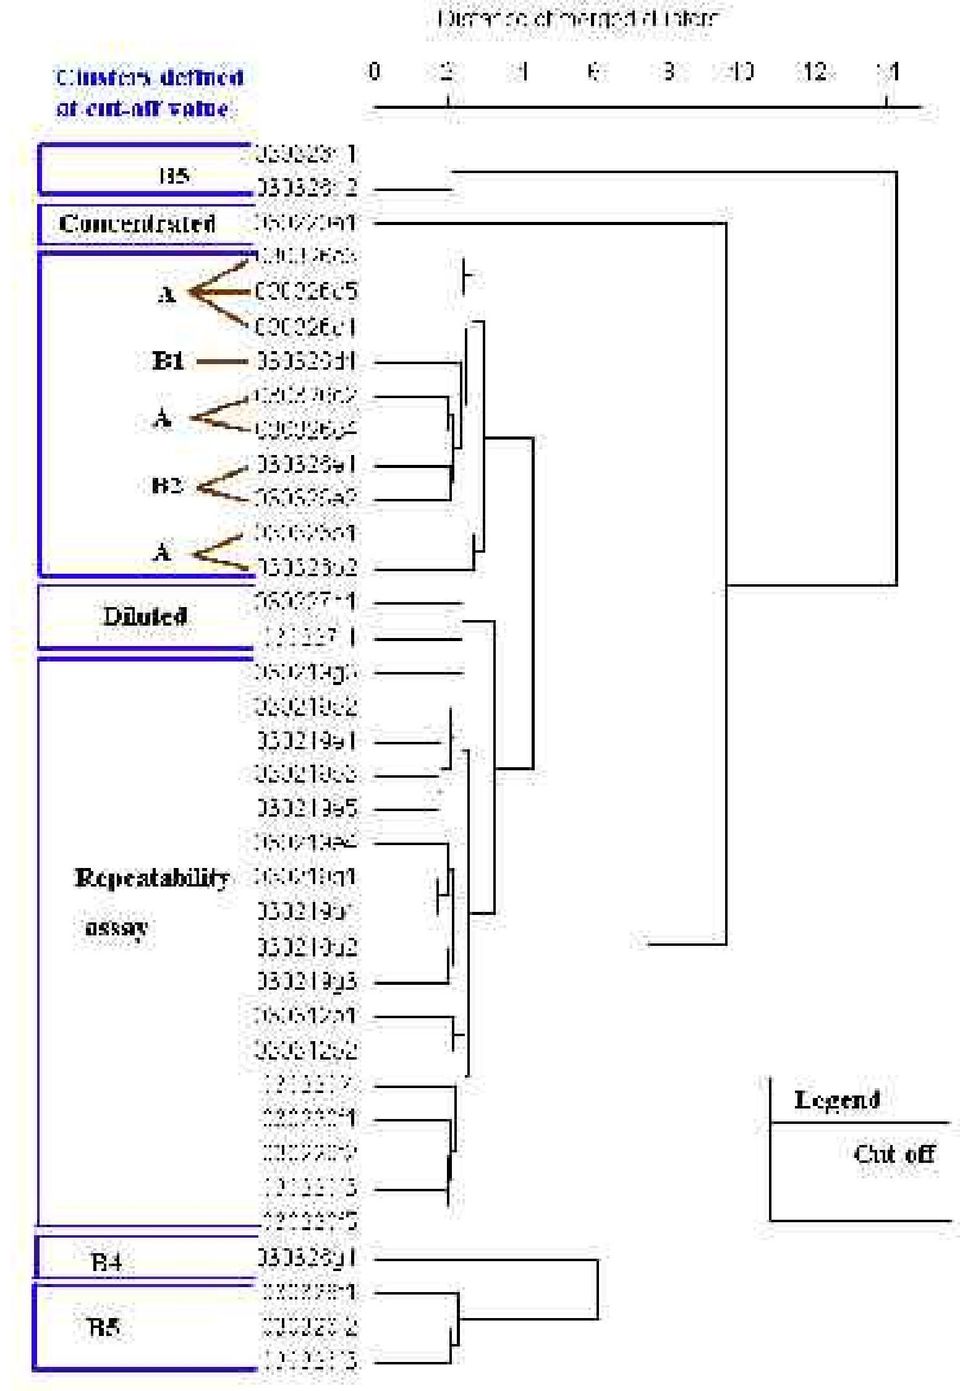
12 Analysis Cut off gives seven natural clusters not v. sensitive to distance functions Some of the results can be understood w.r.t experimental conditions e.g a1 - concentrated sample (evaporation) e.g g5 to f5 - repeatable experiment But there are some outliers e.g e1, e2 in normals needs consultation with domain experts 12

13 Example application: Classification Fisher s iris dataset 4 measurements made on 50 iris specimens from each of three species petal length, petal width, sepal length, sepal width How to classify the species? 150 data points Each point has 4 independent variables belongs in one of three classes red, green, blue How to display dataset? 13

14 2D scatterplots
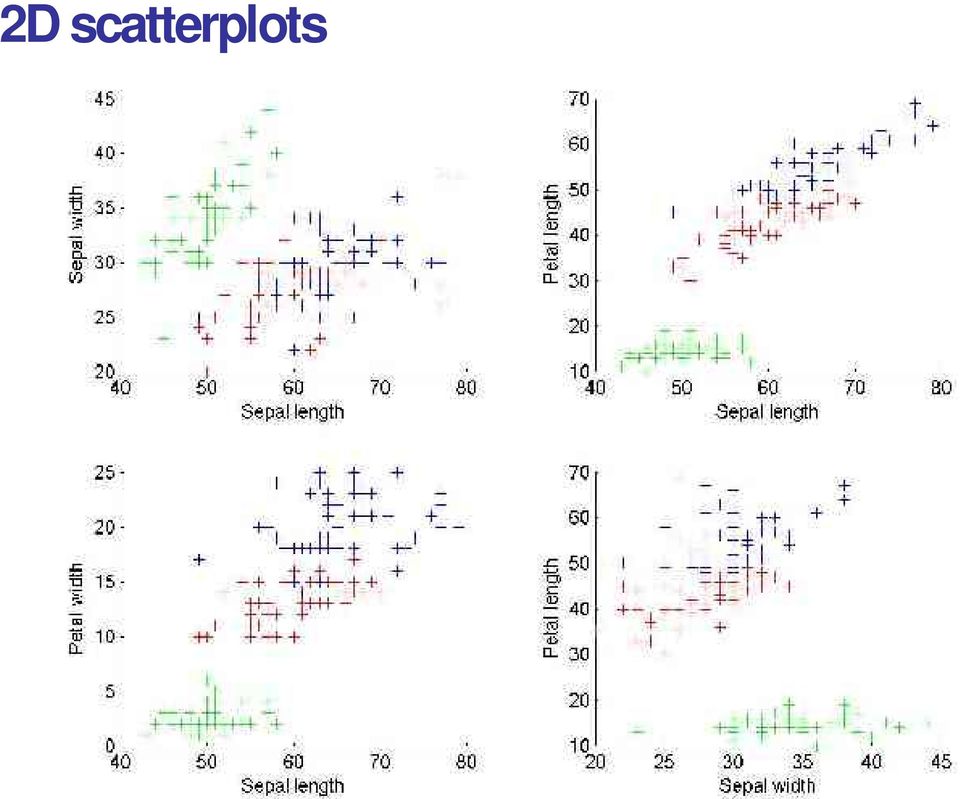
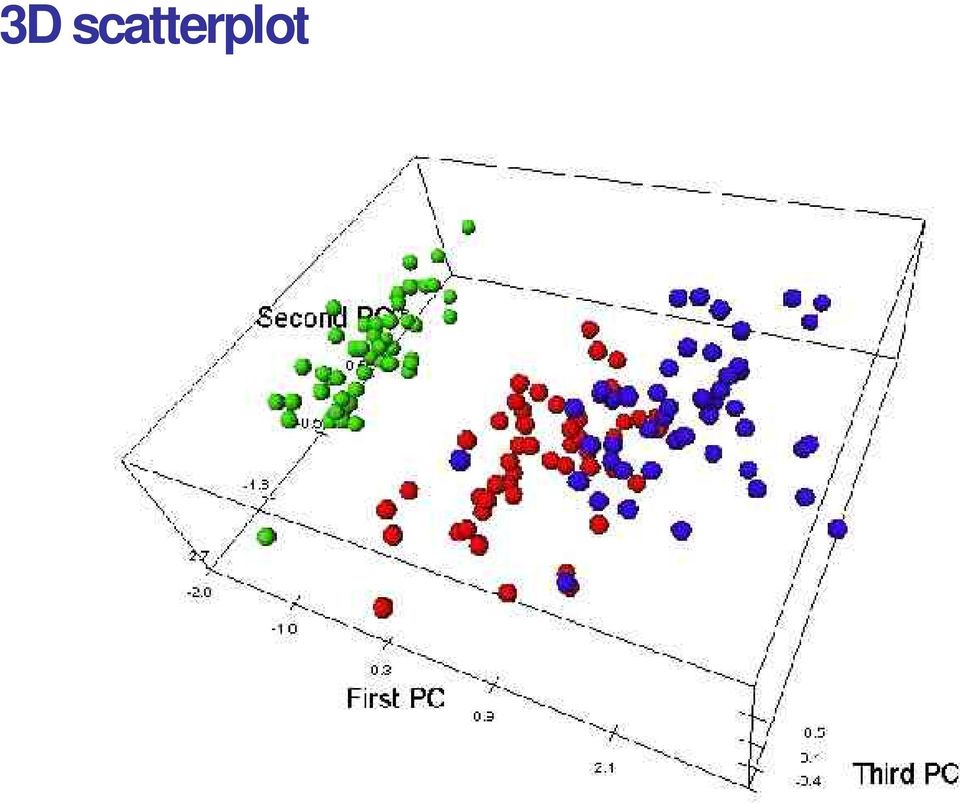
15 Scatterplots? In 2D, need 6 plots to show each variable vs every other one Need to consider them all at the same time Can reduce the number of variables using principal components analysis first three explain ~95% of the variance Scatterplot in 3D 15

16 3D scatterplot

17 3D scatterplot

18 3D scatterplot
19 3D scatterplot

20 Overview Data mining components Functionality Example application Quality control Visualization Use of 3D Example application Market research Statistics and visualization in Excel What s the problem? 20

21 Example: Visual datamining Dutch financial asset management company Keen to target products at entrepreneurs How does entrepreneurship relate to other customer characteristics? Marketing dataset 25,000 customers (sampled from full customer base) Each characterised by values for 100 variables Investment history = entrepreneurship Income Age 21
22 Select strongly correlated variables Correlation matrix 22
23 Select strongly correlated variables Correlation matrix Histogram from cluster analysis Select variables of interest 23
24 Select strongly correlated variables Scatter plot Correlation matrix Histogram from cluster analysis Select variables of interest 24
25 Lessons learnt 3D correlation landscape useful Identifying significant variables Focus on data distributions Select appropriate ranges for cluster analysis Cluster visualization helpful Non-linear relationships in data revealed 3D visualization combined with direct interaction Selection of correlated variables Binning and sorting Done with IRIS Explorer 25
26 Overview Data mining components Functionality Example application Quality control Visualization Use of 3D Example application Market research Statistics and visualization in Excel What s the problem? 26
27 Simple visualization: shoe size survey Shoe size Frequency Visualize using Excel Chart wizard creates visualization easily Interactive control over appearance Colours, line width, text, fonts, placement Data and visualization linked together 27
28
29 Second survey (now with half-sizes) Shoe size Frequency
30
31
32 What s wrong with this picture? Ordering of values on X axis reflects order in spreadsheet not numerical order Spacing on X axis doesn t reflect difference between values spacing is everywhere the same Could pay close attention to labels But might be harder for more complex data Obscures missing data 32
33 Another example adsorption isotherm Measurement of fluid density inside porous solid as a function of fluid pressure Confined fluid can condense before saturation Capillary condensation Vertical jump in isotherm Plot data using Scatter plot Line graph 33
34 Scatter plot
35 Line graph
36 Another example derivative calculation Black-Scholes modelling of options on swap agreements ( swaptions ) Option volatility as a function of Swap maturity Option expiry time Display in Excel as a surface plot 36
37 Irregular spacing
38 What s wrong with this picture? See above Irregular spacing, discontinuities This is only one part of the dataset Volatility also depends on strike value Want plots at other strike values Want to see other relationships e.g. volatility ( strike ) = volatility smile Use IRIS Explorer 38
39 Irregular spacing
40
41
42 Two types of axis in Excel charts Value Data treated as continuously varying numerical values Marker placed at location reflecting its value Used in Excel Scatter plots Category Data treated as sequence of non-numerical text labels Marker location reflects position in sequence Points distributed evenly along axis Used in Excel Bar chart, Line chart, Surface plot 42
43 NAG Schools Excel Add-in (N-SEA) Supports instruction in statistics Functionality for Data sampling Frequency plots Box and whisker plots Histograms Continuous bar charts Allows (X/Y) ordering of data points in plotting and inclusion of points with zero Y values 43
44 Original
45 N-SEA
46
47 Conclusions Data mining components offer basic routines Developers can incorporate them into applications No wheel-reinvention, stone canoes, chocolate teapots cf NAG numerical library Visualization is crucial for analysis Integration of data mining & visualization is applicationdependent Interactivity important Problems with (even) well-known tools Be aware Work around 47
Get The Picture: Visualizing Financial Data part 1
 Get The Picture: Visualizing Financial Data part 1 by Jeremy Walton Turning numbers into pictures is usually the easiest way of finding out what they mean. We're all familiar with the display of for example
WebFOCUS RStat. RStat. Predict the Future and Make Effective Decisions Today. WebFOCUS RStat
 Information Builders enables agile information solutions with business intelligence (BI) and integration technologies. WebFOCUS the most widely utilized business intelligence platform connects to any enterprise
Data Exploration Data Visualization
 Data Exploration Data Visualization What is data exploration? A preliminary exploration of the data to better understand its characteristics. Key motivations of data exploration include Helping to select
CONTENTS PREFACE 1 INTRODUCTION 1 2 DATA VISUALIZATION 19
 PREFACE xi 1 INTRODUCTION 1 1.1 Overview 1 1.2 Definition 1 1.3 Preparation 2 1.3.1 Overview 2 1.3.2 Accessing Tabular Data 3 1.3.3 Accessing Unstructured Data 3 1.3.4 Understanding the Variables and Observations
Improving the Performance of Data Mining Models with Data Preparation Using SAS Enterprise Miner Ricardo Galante, SAS Institute Brasil, São Paulo, SP
 Improving the Performance of Data Mining Models with Data Preparation Using SAS Enterprise Miner Ricardo Galante, SAS Institute Brasil, São Paulo, SP ABSTRACT In data mining modelling, data preparation
Iris Sample Data Set. Basic Visualization Techniques: Charts, Graphs and Maps. Summary Statistics. Frequency and Mode
 Iris Sample Data Set Basic Visualization Techniques: Charts, Graphs and Maps CS598 Information Visualization Spring 2010 Many of the exploratory data techniques are illustrated with the Iris Plant data
COM CO P 5318 Da t Da a t Explora Explor t a ion and Analysis y Chapte Chapt r e 3
 COMP 5318 Data Exploration and Analysis Chapter 3 What is data exploration? A preliminary exploration of the data to better understand its characteristics. Key motivations of data exploration include Helping
COC131 Data Mining - Clustering
 COC131 Data Mining - Clustering Martin D. Sykora m.d.sykora@lboro.ac.uk Tutorial 05, Friday 20th March 2009 1. Fire up Weka (Waikako Environment for Knowledge Analysis) software, launch the explorer window
Instructions for SPSS 21
 1 Instructions for SPSS 21 1 Introduction... 2 1.1 Opening the SPSS program... 2 1.2 General... 2 2 Data inputting and processing... 2 2.1 Manual input and data processing... 2 2.2 Saving data... 3 2.3
STATS8: Introduction to Biostatistics. Data Exploration. Babak Shahbaba Department of Statistics, UCI
 STATS8: Introduction to Biostatistics Data Exploration Babak Shahbaba Department of Statistics, UCI Introduction After clearly defining the scientific problem, selecting a set of representative members
Diagrams and Graphs of Statistical Data
 Diagrams and Graphs of Statistical Data One of the most effective and interesting alternative way in which a statistical data may be presented is through diagrams and graphs. There are several ways in
Data Mining: Exploring Data. Lecture Notes for Chapter 3. Introduction to Data Mining
 Data Mining: Exploring Data Lecture Notes for Chapter 3 Introduction to Data Mining by Tan, Steinbach, Kumar Tan,Steinbach, Kumar Introduction to Data Mining 8/05/2005 1 What is data exploration? A preliminary
Data Mining: Exploring Data. Lecture Notes for Chapter 3. Introduction to Data Mining
 Data Mining: Exploring Data Lecture Notes for Chapter 3 Introduction to Data Mining by Tan, Steinbach, Kumar What is data exploration? A preliminary exploration of the data to better understand its characteristics.
Data Mining: Exploring Data. Lecture Notes for Chapter 3. Slides by Tan, Steinbach, Kumar adapted by Michael Hahsler
 Data Mining: Exploring Data Lecture Notes for Chapter 3 Slides by Tan, Steinbach, Kumar adapted by Michael Hahsler Topics Exploratory Data Analysis Summary Statistics Visualization What is data exploration?
Data Visualization Handbook
 SAP Lumira Data Visualization Handbook www.saplumira.com 1 Table of Content 3 Introduction 20 Ranking 4 Know Your Purpose 23 Part-to-Whole 5 Know Your Data 25 Distribution 9 Crafting Your Message 29 Correlation
How To Use Statgraphics Centurion Xvii (Version 17) On A Computer Or A Computer (For Free)
 On A Computer Or A Computer (For Free)") Statgraphics Centurion XVII (currently in beta test) is a major upgrade to Statpoint's flagship data analysis and visualization product. It contains 32 new statistical procedures and significant upgrades
Statgraphics Centurion XVII (currently in beta test) is a major upgrade to Statpoint's flagship data analysis and visualization product. It contains 32 new statistical procedures and significant upgrades
Tutorial Segmentation and Classification
 MARKETING ENGINEERING FOR EXCEL TUTORIAL VERSION 1.0.8 Tutorial Segmentation and Classification Marketing Engineering for Excel is a Microsoft Excel add-in. The software runs from within Microsoft Excel
The Delicate Art of Flower Classification
 The Delicate Art of Flower Classification Paul Vicol Simon Fraser University University Burnaby, BC pvicol@sfu.ca Note: The following is my contribution to a group project for a graduate machine learning
Curriculum Map Statistics and Probability Honors (348) Saugus High School Saugus Public Schools 2009-2010
 Saugus High School Saugus Public Schools 2009-2010") Curriculum Map Statistics and Probability Honors (348) Saugus High School Saugus Public Schools 2009-2010 Week 1 Week 2 14.0 Students organize and describe distributions of data by using a number of different
Curriculum Map Statistics and Probability Honors (348) Saugus High School Saugus Public Schools 2009-2010 Week 1 Week 2 14.0 Students organize and describe distributions of data by using a number of different
Cluster Analysis. Alison Merikangas Data Analysis Seminar 18 November 2009
 Cluster Analysis Alison Merikangas Data Analysis Seminar 18 November 2009 Overview What is cluster analysis? Types of cluster Distance functions Clustering methods Agglomerative K-means Density-based Interpretation
Data Mining Cluster Analysis: Basic Concepts and Algorithms. Lecture Notes for Chapter 8. Introduction to Data Mining
 Data Mining Cluster Analysis: Basic Concepts and Algorithms Lecture Notes for Chapter 8 Introduction to Data Mining by Tan, Steinbach, Kumar Tan,Steinbach, Kumar Introduction to Data Mining 4/8/2004 Hierarchical
Step 3: Go to Column C. Use the function AVERAGE to calculate the mean values of n = 5. Column C is the column of the means.
 EXAMPLES - SAMPLING DISTRIBUTION EXCEL INSTRUCTIONS This exercise illustrates the process of the sampling distribution as stated in the Central Limit Theorem. Enter the actual data in Column A in MICROSOFT
Using Excel for descriptive statistics
 FACT SHEET Using Excel for descriptive statistics Introduction Biologists no longer routinely plot graphs by hand or rely on calculators to carry out difficult and tedious statistical calculations. These
Data Mining mit der JMSL Numerical Library for Java Applications
 Data Mining mit der JMSL Numerical Library for Java Applications Stefan Sineux 8. Java Forum Stuttgart 07.07.2005 Agenda Visual Numerics JMSL TM Numerical Library Neuronale Netze (Hintergrund) Demos Neuronale
Data Exploration and Preprocessing. Data Mining and Text Mining (UIC 583 @ Politecnico di Milano)
") Data Exploration and Preprocessing Data Mining and Text Mining (UIC 583 @ Politecnico di Milano) References Jiawei Han and Micheline Kamber, "Data Mining: Concepts and Techniques", The Morgan Kaufmann
Data Exploration and Preprocessing Data Mining and Text Mining (UIC 583 @ Politecnico di Milano) References Jiawei Han and Micheline Kamber, "Data Mining: Concepts and Techniques", The Morgan Kaufmann
Data Mining Using SAS Enterprise Miner Randall Matignon, Piedmont, CA
 Data Mining Using SAS Enterprise Miner Randall Matignon, Piedmont, CA An Overview of SAS Enterprise Miner The following article is in regards to Enterprise Miner v.4.3 that is available in SAS v9.1.3.
Bowerman, O'Connell, Aitken Schermer, & Adcock, Business Statistics in Practice, Canadian edition
 Bowerman, O'Connell, Aitken Schermer, & Adcock, Business Statistics in Practice, Canadian edition Online Learning Centre Technology Step-by-Step - Excel Microsoft Excel is a spreadsheet software application
Visualization Quick Guide
 Visualization Quick Guide A best practice guide to help you find the right visualization for your data WHAT IS DOMO? Domo is a new form of business intelligence (BI) unlike anything before an executive
Exercise 1.12 (Pg. 22-23)
") Individuals: The objects that are described by a set of data. They may be people, animals, things, etc. (Also referred to as Cases or Records) Variables: The characteristics recorded about each individual.
Individuals: The objects that are described by a set of data. They may be people, animals, things, etc. (Also referred to as Cases or Records) Variables: The characteristics recorded about each individual.
Tutorial 3: Graphics and Exploratory Data Analysis in R Jason Pienaar and Tom Miller
 Tutorial 3: Graphics and Exploratory Data Analysis in R Jason Pienaar and Tom Miller Getting to know the data An important first step before performing any kind of statistical analysis is to familiarize
Summarizing and Displaying Categorical Data
 Summarizing and Displaying Categorical Data Categorical data can be summarized in a frequency distribution which counts the number of cases, or frequency, that fall into each category, or a relative frequency
Visualization methods for patent data
 Visualization methods for patent data Treparel 2013 Dr. Anton Heijs (CTO & Founder) Delft, The Netherlands Introduction Treparel can provide advanced visualizations for patent data. This document describes
Neural Networks Lesson 5 - Cluster Analysis
 Neural Networks Lesson 5 - Cluster Analysis Prof. Michele Scarpiniti INFOCOM Dpt. - Sapienza University of Rome http://ispac.ing.uniroma1.it/scarpiniti/index.htm michele.scarpiniti@uniroma1.it Rome, 29
A Correlation of. to the. South Carolina Data Analysis and Probability Standards
 A Correlation of to the South Carolina Data Analysis and Probability Standards INTRODUCTION This document demonstrates how Stats in Your World 2012 meets the indicators of the South Carolina Academic Standards
An Introduction to Data Mining
 An Introduction to Intel Beijing wei.heng@intel.com January 17, 2014 Outline 1 DW Overview What is Notable Application of Conference, Software and Applications Major Process in 2 Major Tasks in Detail
Decision Support System Methodology Using a Visual Approach for Cluster Analysis Problems
 Decision Support System Methodology Using a Visual Approach for Cluster Analysis Problems Ran M. Bittmann School of Business Administration Ph.D. Thesis Submitted to the Senate of Bar-Ilan University Ramat-Gan,
Lecture 2: Descriptive Statistics and Exploratory Data Analysis
 Lecture 2: Descriptive Statistics and Exploratory Data Analysis Further Thoughts on Experimental Design 16 Individuals (8 each from two populations) with replicates Pop 1 Pop 2 Randomly sample 4 individuals
Location matters. 3 techniques to incorporate geo-spatial effects in one's predictive model
 Location matters. 3 techniques to incorporate geo-spatial effects in one's predictive model Xavier Conort xavier.conort@gear-analytics.com Motivation Location matters! Observed value at one location is
MTH 140 Statistics Videos
 MTH 140 Statistics Videos Chapter 1 Picturing Distributions with Graphs Individuals and Variables Categorical Variables: Pie Charts and Bar Graphs Categorical Variables: Pie Charts and Bar Graphs Quantitative
Drawing a histogram using Excel
 Drawing a histogram using Excel STEP 1: Examine the data to decide how many class intervals you need and what the class boundaries should be. (In an assignment you may be told what class boundaries to
Data Visualization. or Graphical Data Presentation. Jerzy Stefanowski Instytut Informatyki
 Data Visualization or Graphical Data Presentation Jerzy Stefanowski Instytut Informatyki Data mining for SE -- 2013 Ack. Inspirations are coming from: G.Piatetsky Schapiro lectures on KDD J.Han on Data
Clustering. Adrian Groza. Department of Computer Science Technical University of Cluj-Napoca
 Clustering Adrian Groza Department of Computer Science Technical University of Cluj-Napoca Outline 1 Cluster Analysis What is Datamining? Cluster Analysis 2 K-means 3 Hierarchical Clustering What is Datamining?
DATA MINING CLUSTER ANALYSIS: BASIC CONCEPTS
 DATA MINING CLUSTER ANALYSIS: BASIC CONCEPTS 1 AND ALGORITHMS Chiara Renso KDD-LAB ISTI- CNR, Pisa, Italy WHAT IS CLUSTER ANALYSIS? Finding groups of objects such that the objects in a group will be similar
business statistics using Excel OXFORD UNIVERSITY PRESS Glyn Davis & Branko Pecar
 business statistics using Excel Glyn Davis & Branko Pecar OXFORD UNIVERSITY PRESS Detailed contents Introduction to Microsoft Excel 2003 Overview Learning Objectives 1.1 Introduction to Microsoft Excel
Figure 1. An embedded chart on a worksheet.
 8. Excel Charts and Analysis ToolPak Charts, also known as graphs, have been an integral part of spreadsheets since the early days of Lotus 1-2-3. Charting features have improved significantly over the
Data Analysis. Using Excel. Jeffrey L. Rummel. BBA Seminar. Data in Excel. Excel Calculations of Descriptive Statistics. Single Variable Graphs
 Using Excel Jeffrey L. Rummel Emory University Goizueta Business School BBA Seminar Jeffrey L. Rummel BBA Seminar 1 / 54 Excel Calculations of Descriptive Statistics Single Variable Graphs Relationships
An Overview of Knowledge Discovery Database and Data mining Techniques
 An Overview of Knowledge Discovery Database and Data mining Techniques Priyadharsini.C 1, Dr. Antony Selvadoss Thanamani 2 M.Phil, Department of Computer Science, NGM College, Pollachi, Coimbatore, Tamilnadu,
IBM SPSS Direct Marketing 23
 IBM SPSS Direct Marketing 23 Note Before using this information and the product it supports, read the information in Notices on page 25. Product Information This edition applies to version 23, release
How To Cluster
 Data Clustering Dec 2nd, 2013 Kyrylo Bessonov Talk outline Introduction to clustering Types of clustering Supervised Unsupervised Similarity measures Main clustering algorithms k-means Hierarchical Main
A fast, powerful data mining workbench designed for small to midsize organizations
 FACT SHEET SAS Desktop Data Mining for Midsize Business A fast, powerful data mining workbench designed for small to midsize organizations What does SAS Desktop Data Mining for Midsize Business do? Business
Steven M. Ho!and. Department of Geology, University of Georgia, Athens, GA 30602-2501
 CLUSTER ANALYSIS Steven M. Ho!and Department of Geology, University of Georgia, Athens, GA 30602-2501 January 2006 Introduction Cluster analysis includes a broad suite of techniques designed to find groups
Data representation and analysis in Excel
 Page 1 Data representation and analysis in Excel Let s Get Started! This course will teach you how to analyze data and make charts in Excel so that the data may be represented in a visual way that reflects
PERFORMANCE ANALYSIS OF CLUSTERING ALGORITHMS IN DATA MINING IN WEKA
 PERFORMANCE ANALYSIS OF CLUSTERING ALGORITHMS IN DATA MINING IN WEKA Prakash Singh 1, Aarohi Surya 2 1 Department of Finance, IIM Lucknow, Lucknow, India 2 Department of Computer Science, LNMIIT, Jaipur,
CHARTS AND GRAPHS INTRODUCTION USING SPSS TO DRAW GRAPHS SPSS GRAPH OPTIONS CAG08
 CHARTS AND GRAPHS INTRODUCTION SPSS and Excel each contain a number of options for producing what are sometimes known as business graphics - i.e. statistical charts and diagrams. This handout explores
IBM SPSS Direct Marketing 22
 IBM SPSS Direct Marketing 22 Note Before using this information and the product it supports, read the information in Notices on page 25. Product Information This edition applies to version 22, release
Data analysis process
 Data analysis process Data collection and preparation Collect data Prepare codebook Set up structure of data Enter data Screen data for errors Exploration of data Descriptive Statistics Graphs Analysis
Hierarchical Clustering Analysis
 Hierarchical Clustering Analysis What is Hierarchical Clustering? Hierarchical clustering is used to group similar objects into clusters. In the beginning, each row and/or column is considered a cluster.
Using multiple models: Bagging, Boosting, Ensembles, Forests
 Using multiple models: Bagging, Boosting, Ensembles, Forests Bagging Combining predictions from multiple models Different models obtained from bootstrap samples of training data Average predictions or
Medical Information Management & Mining. You Chen Jan,15, 2013 You.chen@vanderbilt.edu
 Medical Information Management & Mining You Chen Jan,15, 2013 You.chen@vanderbilt.edu 1 Trees Building Materials Trees cannot be used to build a house directly. How can we transform trees to building materials?
Service courses for graduate students in degree programs other than the MS or PhD programs in Biostatistics.
 Course Catalog In order to be assured that all prerequisites are met, students must acquire a permission number from the education coordinator prior to enrolling in any Biostatistics course. Courses are
There are six different windows that can be opened when using SPSS. The following will give a description of each of them.
 SPSS Basics Tutorial 1: SPSS Windows There are six different windows that can be opened when using SPSS. The following will give a description of each of them. The Data Editor The Data Editor is a spreadsheet
There are a number of different methods that can be used to carry out a cluster analysis; these methods can be classified as follows:
 Statistics: Rosie Cornish. 2007. 3.1 Cluster Analysis 1 Introduction This handout is designed to provide only a brief introduction to cluster analysis and how it is done. Books giving further details are
PATTERN RECOGNITION AND MACHINE LEARNING CHAPTER 4: LINEAR MODELS FOR CLASSIFICATION
 PATTERN RECOGNITION AND MACHINE LEARNING CHAPTER 4: LINEAR MODELS FOR CLASSIFICATION Introduction In the previous chapter, we explored a class of regression models having particularly simple analytical
 T O P I C 1 2 Techniques and tools for data analysis Preview Introduction In chapter 3 of Statistics In A Day different combinations of numbers and types of variables are presented. We go through these
What is Data Mining? MS4424 Data Mining & Modelling. MS4424 Data Mining & Modelling. MS4424 Data Mining & Modelling. MS4424 Data Mining & Modelling
 MS4424 Data Mining & Modelling MS4424 Data Mining & Modelling Lecturer : Dr Iris Yeung Room No : P7509 Tel No : 2788 8566 Email : msiris@cityu.edu.hk 1 Aims To introduce the basic concepts of data mining
Systat: Statistical Visualization Software
 Systat: Statistical Visualization Software Hilary R. Hafner Jennifer L. DeWinter Steven G. Brown Theresa E. O Brien Sonoma Technology, Inc. Petaluma, CA Presented in Toledo, OH October 28, 2011 STI-910019-3946
Correlation Coefficient The correlation coefficient is a summary statistic that describes the linear relationship between two numerical variables 2
 Lesson 4 Part 1 Relationships between two numerical variables 1 Correlation Coefficient The correlation coefficient is a summary statistic that describes the linear relationship between two numerical variables
APPLICATION PROGRAMMING: DATA MINING AND DATA WAREHOUSING
 Wrocław University of Technology Internet Engineering Henryk Maciejewski APPLICATION PROGRAMMING: DATA MINING AND DATA WAREHOUSING PRACTICAL GUIDE Wrocław (2011) 1 Copyright by Wrocław University of Technology
Statistical Distributions in Astronomy
 Data Mining In Modern Astronomy Sky Surveys: Statistical Distributions in Astronomy Ching-Wa Yip cwyip@pha.jhu.edu; Bloomberg 518 From Data to Information We don t just want data. We want information from
Exploratory data analysis (Chapter 2) Fall 2011
 Fall 2011") Exploratory data analysis (Chapter 2) Fall 2011 Data Examples Example 1: Survey Data 1 Data collected from a Stat 371 class in Fall 2005 2 They answered questions about their: gender, major, year in school,
Exploratory data analysis (Chapter 2) Fall 2011 Data Examples Example 1: Survey Data 1 Data collected from a Stat 371 class in Fall 2005 2 They answered questions about their: gender, major, year in school,
Predictive Dynamix Inc
 Predictive Modeling Technology Predictive modeling is concerned with analyzing patterns and trends in historical and operational data in order to transform data into actionable decisions. This is accomplished
The right edge of the box is the third quartile, Q 3, which is the median of the data values above the median. Maximum Median
 CONDENSED LESSON 2.1 Box Plots In this lesson you will create and interpret box plots for sets of data use the interquartile range (IQR) to identify potential outliers and graph them on a modified box
Data exploration with Microsoft Excel: analysing more than one variable
 Data exploration with Microsoft Excel: analysing more than one variable Contents 1 Introduction... 1 2 Comparing different groups or different variables... 2 3 Exploring the association between categorical
Data Mining Cluster Analysis: Basic Concepts and Algorithms. Clustering Algorithms. Lecture Notes for Chapter 8. Introduction to Data Mining
 Data Mining Cluster Analsis: Basic Concepts and Algorithms Lecture Notes for Chapter 8 Introduction to Data Mining b Tan, Steinbach, Kumar Clustering Algorithms K-means and its variants Hierarchical clustering
Clustering. Data Mining. Abraham Otero. Data Mining. Agenda
 Clustering 1/46 Agenda Introduction Distance K-nearest neighbors Hierarchical clustering Quick reference 2/46 1 Introduction It seems logical that in a new situation we should act in a similar way as in
Excel Tutorial. Bio 150B Excel Tutorial 1
 Bio 15B Excel Tutorial 1 Excel Tutorial As part of your laboratory write-ups and reports during this semester you will be required to collect and present data in an appropriate format. To organize and
Microsoft Business Intelligence Visualization Comparisons by Tool
 Microsoft Business Intelligence Visualization Comparisons by Tool Version 3: 10/29/2012 Purpose: Purpose of this document is to provide a quick reference of visualization options available in each tool.
seven Statistical Analysis with Excel chapter OVERVIEW CHAPTER
 seven Statistical Analysis with Excel CHAPTER chapter OVERVIEW 7.1 Introduction 7.2 Understanding Data 7.3 Relationships in Data 7.4 Distributions 7.5 Summary 7.6 Exercises 147 148 CHAPTER 7 Statistical
Institute of Actuaries of India Subject CT3 Probability and Mathematical Statistics
 Institute of Actuaries of India Subject CT3 Probability and Mathematical Statistics For 2015 Examinations Aim The aim of the Probability and Mathematical Statistics subject is to provide a grounding in
R Graphics Cookbook. Chang O'REILLY. Winston. Tokyo. Beijing Cambridge. Farnham Koln Sebastopol
 R Graphics Cookbook Winston Chang Beijing Cambridge Farnham Koln Sebastopol O'REILLY Tokyo Table of Contents Preface ix 1. R Basics 1 1.1. Installing a Package 1 1.2. Loading a Package 2 1.3. Loading a
Comparison of Non-linear Dimensionality Reduction Techniques for Classification with Gene Expression Microarray Data
 CMPE 59H Comparison of Non-linear Dimensionality Reduction Techniques for Classification with Gene Expression Microarray Data Term Project Report Fatma Güney, Kübra Kalkan 1/15/2013 Keywords: Non-linear
KNIME TUTORIAL. Anna Monreale KDD-Lab, University of Pisa Email: annam@di.unipi.it
 KNIME TUTORIAL Anna Monreale KDD-Lab, University of Pisa Email: annam@di.unipi.it Outline Introduction on KNIME KNIME components Exercise: Market Basket Analysis Exercise: Customer Segmentation Exercise:
Example: Document Clustering. Clustering: Definition. Notion of a Cluster can be Ambiguous. Types of Clusterings. Hierarchical Clustering
 Overview Prognostic Models and Data Mining in Medicine, part I Cluster Analsis What is Cluster Analsis? K-Means Clustering Hierarchical Clustering Cluster Validit Eample: Microarra data analsis 6 Summar
Colour Image Segmentation Technique for Screen Printing
 60 R.U. Hewage and D.U.J. Sonnadara Department of Physics, University of Colombo, Sri Lanka ABSTRACT Screen-printing is an industry with a large number of applications ranging from printing mobile phone
Once saved, if the file was zipped you will need to unzip it. For the files that I will be posting you need to change the preferences.
 1 Commands in JMP and Statcrunch Below are a set of commands in JMP and Statcrunch which facilitate a basic statistical analysis. The first part concerns commands in JMP, the second part is for analysis
Univariate Regression
 Univariate Regression Correlation and Regression The regression line summarizes the linear relationship between 2 variables Correlation coefficient, r, measures strength of relationship: the closer r is
Lavastorm Analytic Library Predictive and Statistical Analytics Node Pack FAQs
 1.1 Introduction Lavastorm Analytic Library Predictive and Statistical Analytics Node Pack FAQs For brevity, the Lavastorm Analytics Library (LAL) Predictive and Statistical Analytics Node Pack will be
3F3: Signal and Pattern Processing
 3F3: Signal and Pattern Processing Lecture 3: Classification Zoubin Ghahramani zoubin@eng.cam.ac.uk Department of Engineering University of Cambridge Lent Term Classification We will represent data by
Machine Learning and Data Mining. Regression Problem. (adapted from) Prof. Alexander Ihler
 Prof. Alexander Ihler") Machine Learning and Data Mining Regression Problem (adapted from) Prof. Alexander Ihler Overview Regression Problem Definition and define parameters ϴ. Prediction using ϴ as parameters Measure the error
Machine Learning and Data Mining Regression Problem (adapted from) Prof. Alexander Ihler Overview Regression Problem Definition and define parameters ϴ. Prediction using ϴ as parameters Measure the error
Azure Machine Learning, SQL Data Mining and R
 Azure Machine Learning, SQL Data Mining and R Day-by-day Agenda Prerequisites No formal prerequisites. Basic knowledge of SQL Server Data Tools, Excel and any analytical experience helps. Best of all:
Data Mining III: Numeric Estimation
 Data Mining III: Numeric Estimation Computer Science 105 Boston University David G. Sullivan, Ph.D. Review: Numeric Estimation Numeric estimation is like classification learning. it involves learning a
Tutorial for proteome data analysis using the Perseus software platform
 Tutorial for proteome data analysis using the Perseus software platform Laboratory of Mass Spectrometry, LNBio, CNPEM Tutorial version 1.0, January 2014. Note: This tutorial was written based on the information
Business Statistics. Successful completion of Introductory and/or Intermediate Algebra courses is recommended before taking Business Statistics.
 Business Course Text Bowerman, Bruce L., Richard T. O'Connell, J. B. Orris, and Dawn C. Porter. Essentials of Business, 2nd edition, McGraw-Hill/Irwin, 2008, ISBN: 978-0-07-331988-9. Required Computing
SPSS Manual for Introductory Applied Statistics: A Variable Approach
 SPSS Manual for Introductory Applied Statistics: A Variable Approach John Gabrosek Department of Statistics Grand Valley State University Allendale, MI USA August 2013 2 Copyright 2013 John Gabrosek. All
STATISTICA. Clustering Techniques. Case Study: Defining Clusters of Shopping Center Patrons. and
 Clustering Techniques and STATISTICA Case Study: Defining Clusters of Shopping Center Patrons STATISTICA Solutions for Business Intelligence, Data Mining, Quality Control, and Web-based Analytics Table
Data Mining for Business Intelligence. Concepts, Techniques, and Applications in Microsoft Office Excel with XLMiner. 2nd Edition
 Brochure More information from http://www.researchandmarkets.com/reports/2170926/ Data Mining for Business Intelligence. Concepts, Techniques, and Applications in Microsoft Office Excel with XLMiner. 2nd
Section 3 Part 1. Relationships between two numerical variables
 Section 3 Part 1 Relationships between two numerical variables 1 Relationship between two variables The summary statistics covered in the previous lessons are appropriate for describing a single variable.
Data Mining. Dr. Saed Sayad. University of Toronto 2010 saed.sayad@utoronto.ca. http://chem-eng.utoronto.ca/~datamining/
 Data Mining Dr. Saed Sayad University of Toronto 2010 saed.sayad@utoronto.ca http://chem-eng.utoronto.ca/~datamining/ 1 Data Mining Data mining is about explaining the past and predicting the future by
Robust Outlier Detection Technique in Data Mining: A Univariate Approach
 Robust Outlier Detection Technique in Data Mining: A Univariate Approach Singh Vijendra and Pathak Shivani Faculty of Engineering and Technology Mody Institute of Technology and Science Lakshmangarh, Sikar,
STATISTICA Formula Guide: Logistic Regression. Table of Contents
 : Table of Contents... 1 Overview of Model... 1 Dispersion... 2 Parameterization... 3 Sigma-Restricted Model... 3 Overparameterized Model... 4 Reference Coding... 4 Model Summary (Summary Tab)... 5 Summary